Hunger in Florida 2014 | Executive Summary in Florida 2014 Executive Summary A Report on Charitable...
8
Hunger in Florida 2014 Executive Summary A Report on Charitable Food Distribution in Florida
Transcript of Hunger in Florida 2014 | Executive Summary in Florida 2014 Executive Summary A Report on Charitable...

Hunger in Florida 2014Executive Summary
A Report on Charitable Food Distribution in Florida
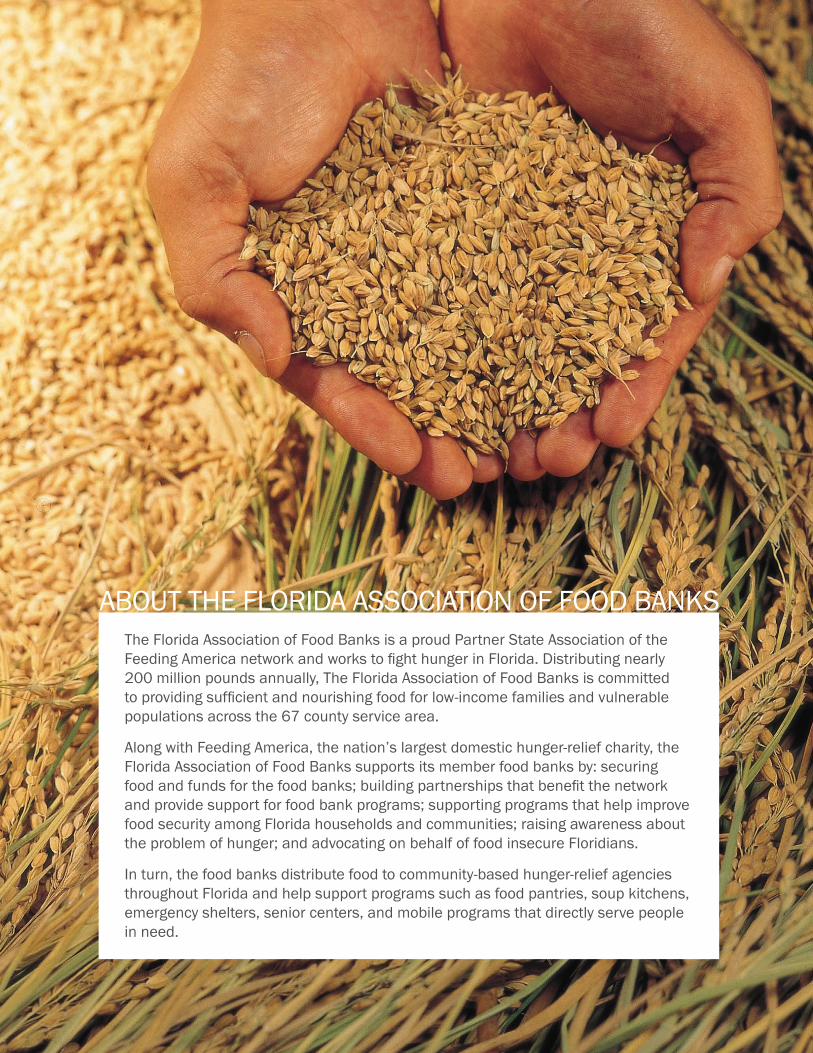
ABOUT THE FLORIDA ASSOCIATION OF FOOD BANKSThe Florida Association of Food Banks is a proud Partner State Association of the Feeding America network and works to fight hunger in Florida. Distributing nearly 200 million pounds annually, The Florida Association of Food Banks is committed to providing sufficient and nourishing food for low-income families and vulnerable populations across the 67 county service area.
Along with Feeding America, the nation’s largest domestic hunger-relief charity, the Florida Association of Food Banks supports its member food banks by: securing food and funds for the food banks; building partnerships that benefit the network and provide support for food bank programs; supporting programs that help improve food security among Florida households and communities; raising awareness about the problem of hunger; and advocating on behalf of food insecure Floridians.
In turn, the food banks distribute food to community-based hunger-relief agencies throughout Florida and help support programs such as food pantries, soup kitchens, emergency shelters, senior centers, and mobile programs that directly serve people in need.

ABOUT HUNGER IN FLORIDA 2014
Rich data from two widely distributed surveys comprise the basis for the Hunger in Florida 2014 results. For the first time in this study’s history, almost all data were collected through electronic surveys, which supports a higher level of data monitoring and quality checks. The surveys were conducted in two sequential stages: first, Florida Association of Food Banks network partner agencies completed the Agency Survey; then, clients at participating partner agencies’ food programs completed the Client Survey. The Agency Survey was fielded from October 2012 to January 2013 among the partner agencies of all participating food banks. The Agency Survey contained detailed questions about partner agencies’ services, capacity, and food distribution, including a specific set of additional questions regarding the individual food programs operated by the partner agency.
The Client Survey, fielded from April through August 2013, was implemented through a vast force of data collectors, a majority of whom were volunteers, recruited by each participating food bank. Numerous data
METHODOLOGY FOR HUNGER IN FLORIDA 2014
Hunger in Florida is part of a national series of quadrennial studies called Hunger in America that provide comprehensive demographic profiles of people seeking food assistance through the Feeding America network.
It is the largest study of its kind. The data collected help guide the development of programs and solutions that improve food security for individuals and their households and inform public awareness and policy development for addressing hunger in Florida and the United States.
Hunger in Florida 2014 is the sixth and most comprehensive study in the Hunger in Florida series. Through interviews with more than 5,289 clients and 1,317 partner agencies in Florida, we have a comprehensive understanding of the people who receive assistance through the Florida Association of Food Banks network, the personal and economic circumstances of their households, and the response of the partner agencies that provide assistance to those in need.
collectors were trained and registered to carry out client data collection in Florida. In lieu of face-to-face interviews used in years past, Hunger in Florida 2014 utilized touchscreen tablet computers and a proven computer software program that allows respondents to simultaneously read and have survey questions read to them through private headphones, maximizing confidentiality. Data collectors followed a prescribed study plan in order to select a random sample of clients at 1,317 partner agencies across the Florida Association of Food Banks network. In total, 5,289 clients responded to questions about themselves, their households, and the circumstances that led them to seek help from the emergency food network. Florida’s participating food banks contributed to the successful execution of the study design by fulfilling important roles throughout data collection. The research vendor Westat conducted analysis of the data collected and, together with the Urban Institute, produced the national and local reports in the spring and summer of 2014 and the state reports in the fall of 2014.
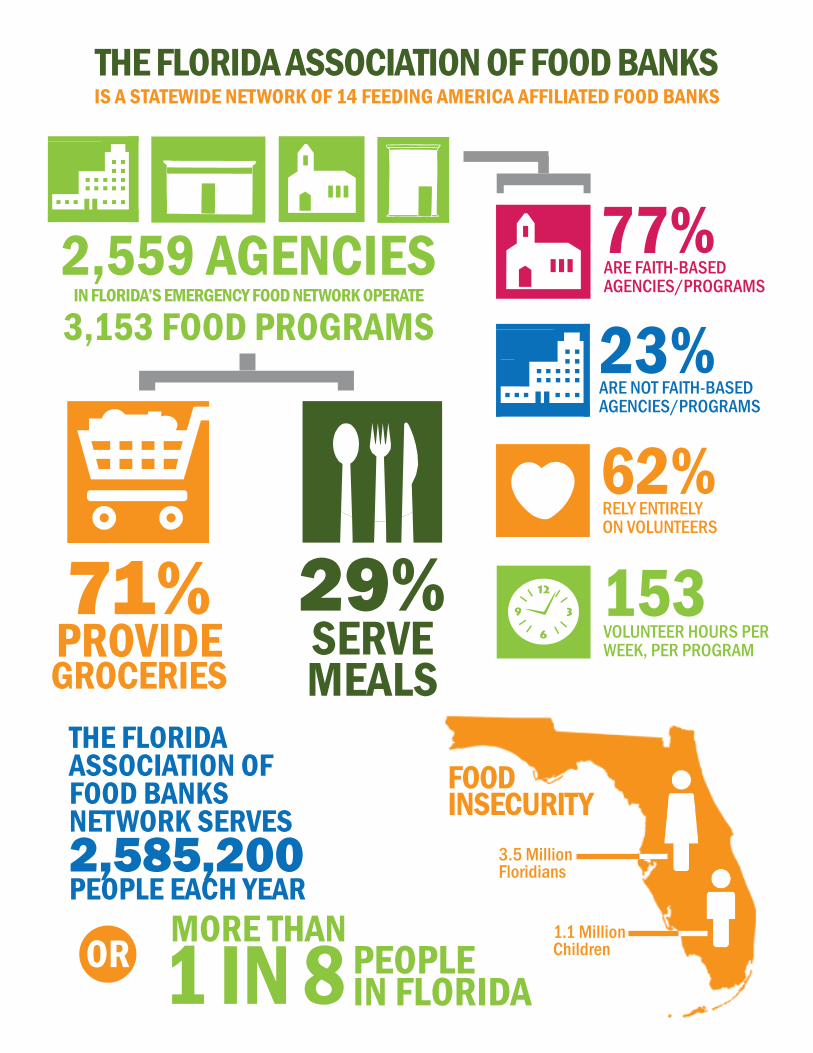
THE FLORIDA ASSOCIATION OF FOOD BANKSIS A STATEWIDE NETWORK OF 14 FEEDING AMERICA AFFILIATED FOOD BANKS
71%PROVIDE GROCERIES
29%SERVE MEALS
2,559 AGENCIESIN FLORIDA’S EMERGENCY FOOD NETWORK OPERATE
3,153 FOOD PROGRAMS 23%ARE NOT FAITH-BASED AGENCIES/PROGRAMS
77%ARE FAITH-BASED AGENCIES/PROGRAMS
62%RELY ENTIRELYON VOLUNTEERS
VOLUNTEER HOURS PER WEEK, PER PROGRAM
153
THE FLORIDA ASSOCIATION OF FOOD BANKS NETWORK SERVES 2,585,200 PEOPLE EACH YEAR
OR MORE THAN1 IN 8 PEOPLE
IN FLORIDA
1.1 MillionChildren
3.5 Million Floridians
FOODINSECURITY

THE PEOPLE SERVED BY THE FLORIDA ASSOCIATION OF FOOD BANKS NETWORKMore than 1 in 8 Floridians turns to the Florida Association of Food Banks network for food assistance.
Hunger in Florida 2014 reveals that each year, 2,585,200 unduplicated individuals receive food assistance through the Florida Association of Food Banks network. This translates to an estimated 850,600 households served by the network each year. Each week, 484,000 unduplicated individuals receive food assistance through the Florida Association of Food Banks network.
Studying the regularity of use of programs among clients gives a duplicated client count– the number of times individual clients are reached through food distributions on an annual basis.
Using this definition, the Florida Association of Food Banks network provides assistance to 25,234,700 million duplicated clients each year, illustrating that many individuals are routinely turning to the Florida Association of Food Banks network to meet their nutrition and food budget needs.
Households served by the Florida Association of Food Banks network represent a diversity of households. Clients face a wide array of obstacles to food security, such as health status, education levels, housing instability, unemployment, and insufficient income.
CLIENT FOOD INSECURITYFood security refers to reliable access to an adequate amount of food for an active, healthy life for all household members. Using the USDA Economic Research Service’s validated six-item Core Food Security Model, Hunger in Florida 2014 reveals that 85 percent of Florida Association of Food Banks client households are food insecure, meaning that they were without reliable access to a sufficient quantity of affordable, nutritious food at some point during the past year.
HOUSEHOLD FOOD INSECURITY
85% OF ALL HOUSEHOLDS SERVED BY THE NETWORK ARE FOOD INSECURE
HOUSEHOLDS THAT CONTAIN A SENIOR
OVER 70
HOUSEHOLDS THAT CONTAIN A CHILD
UNDER 18
5
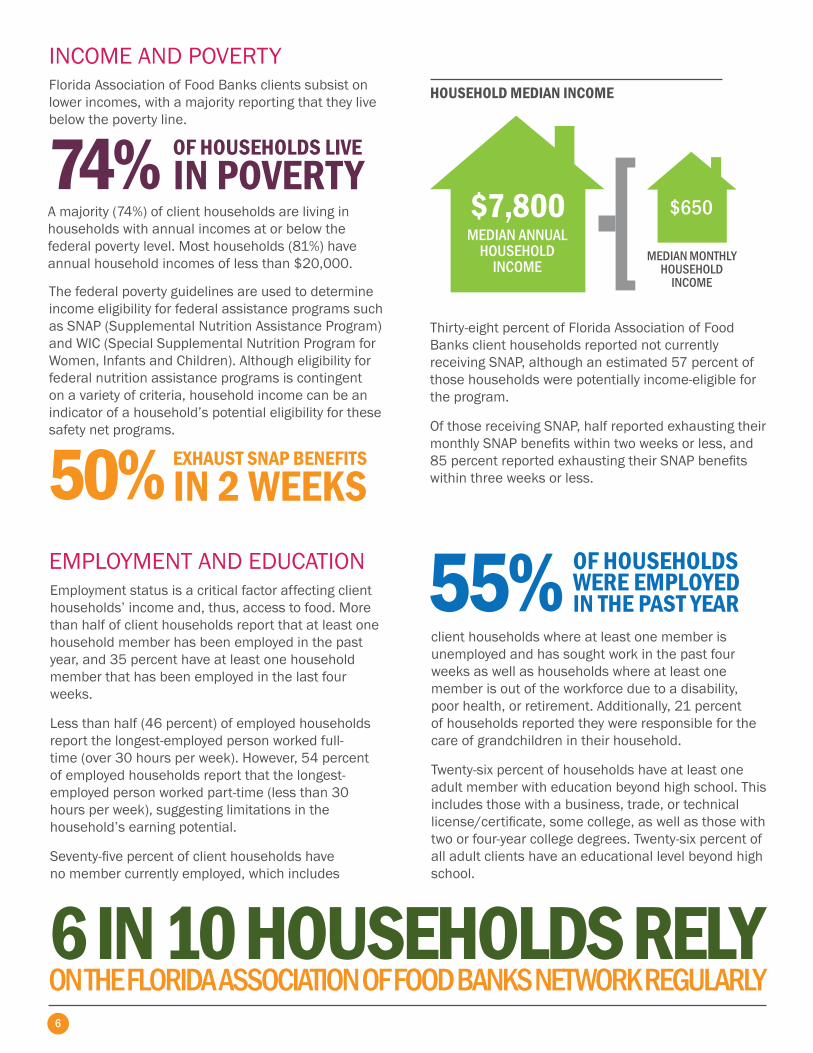
HOUSEHOLD MEDIAN INCOME
$7,800
INCOME AND POVERTYFlorida Association of Food Banks clients subsist on lower incomes, with a majority reporting that they live below the poverty line.
MEDIAN ANNUAL HOUSEHOLD
INCOME
74% OF HOUSEHOLDS LIVEIN POVERTY
EMPLOYMENT AND EDUCATION
The federal poverty guidelines are used to determine income eligibility for federal assistance programs such as SNAP (Supplemental Nutrition Assistance Program) and WIC (Special Supplemental Nutrition Program for Women, Infants and Children). Although eligibility for federal nutrition assistance programs is contingent on a variety of criteria, household income can be an indicator of a household’s potential eligibility for these safety net programs.
Thirty-eight percent of Florida Association of Food Banks client households reported not currently receiving SNAP, although an estimated 57 percent of those households were potentially income-eligible for the program.
Of those receiving SNAP, half reported exhausting their monthly SNAP benefits within two weeks or less, and 85 percent reported exhausting their SNAP benefits within three weeks or less.50% EXHAUST SNAP BENEFITS
IN 2 WEEKS
Employment status is a critical factor affecting client households’ income and, thus, access to food. More than half of client households report that at least one household member has been employed in the past year, and 35 percent have at least one household member that has been employed in the last four weeks.
Less than half (46 percent) of employed households report the longest-employed person worked full-time (over 30 hours per week). However, 54 percent of employed households report that the longest-employed person worked part-time (less than 30 hours per week), suggesting limitations in the household’s earning potential.
Seventy-five percent of client households have no member currently employed, which includes
client households where at least one member is unemployed and has sought work in the past four weeks as well as households where at least one member is out of the workforce due to a disability, poor health, or retirement. Additionally, 21 percent of households reported they were responsible for the care of grandchildren in their household.
Twenty-six percent of households have at least one adult member with education beyond high school. This includes those with a business, trade, or technical license/certificate, some college, as well as those with two or four-year college degrees. Twenty-six percent of all adult clients have an educational level beyond high school.
55% OF HOUSEHOLDSWERE EMPLOYEDIN THE PAST YEAR
6 IN 10 HOUSEHOLDS RELYON THE FLORIDA ASSOCIATION OF FOOD BANKS NETWORK REGULARLY
A majority (74%) of client households are living in households with annual incomes at or below the federal poverty level. Most households (81%) have annual household incomes of less than $20,000.
$650
MEDIAN MONTHLY HOUSEHOLD
INCOME
6
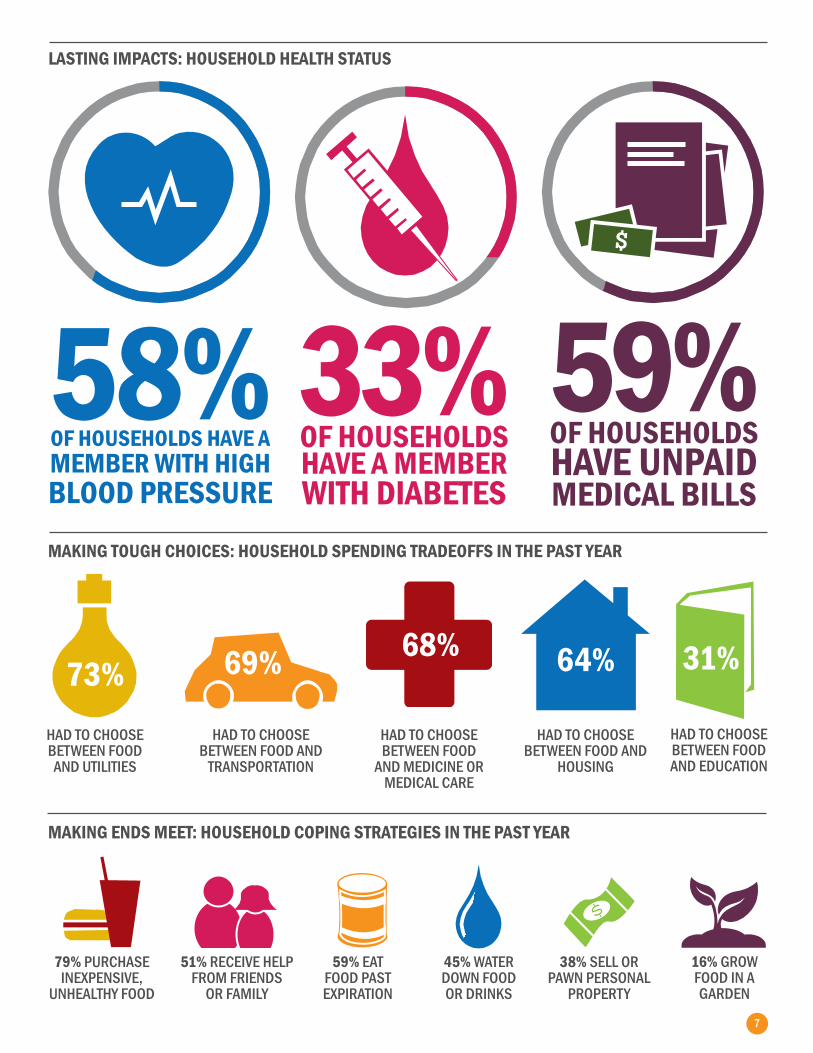
73% 69% 68% 64% 31%
HAD TO CHOOSE BETWEEN FOOD AND UTILITIES
HAD TO CHOOSE BETWEEN FOOD AND
TRANSPORTATION
HAD TO CHOOSE BETWEEN FOOD
AND MEDICINE OR MEDICAL CARE
HAD TO CHOOSE BETWEEN FOOD AND
HOUSING
HAD TO CHOOSE BETWEEN FOOD AND EDUCATION
MAKING TOUGH CHOICES: HOUSEHOLD SPENDING TRADEOFFS IN THE PAST YEAR
MAKING ENDS MEET: HOUSEHOLD COPING STRATEGIES IN THE PAST YEAR
LASTING IMPACTS: HOUSEHOLD HEALTH STATUS
58%OF HOUSEHOLDS HAVE A MEMBER WITH HIGH BLOOD PRESSURE
33%OF HOUSEHOLDS HAVE A MEMBER WITH DIABETES
59%OF HOUSEHOLDS HAVE UNPAID MEDICAL BILLS
79% PURCHASE INEXPENSIVE,
UNHEALTHY FOOD
51% RECEIVE HELP FROM FRIENDS
OR FAMILY
59% EAT FOOD PAST EXPIRATION
45% WATER DOWN FOOD OR DRINKS
38% SELL OR PAWN PERSONAL
PROPERTY
16% GROW FOOD IN A GARDEN
7

3760 Fowler St.Fort Myers, Florida 339011.855.FLA.FOOD (352.3663)www.HungerFreeFlorida.org