HUMPBACK WHALE ENTANGLEMENT RATES IN FISHING GEAR … · Population size and status of humpback...
133
Transcript of HUMPBACK WHALE ENTANGLEMENT RATES IN FISHING GEAR … · Population size and status of humpback...


HUMPBACK WHALE (MEGAPTERA NOVAEANGLIAE) ENTANGLEMENT
IN FISHING GEAR IN NORTHERN SOUTHEASTERN ALASKA
A
THESIS
Presented to the Faculty
of the University of Alaska Fairbanks
in Partial Fulfillment of the Requirements
for the Degree of
MASTER OF SCIENCE
By
Janet L. Neilson, B.S.
Fairbanks, Alaska
May 2006

iii
Abstract
The prevalence of non-lethal entanglements of humpback whales (Megaptera
novaeangliae) in fishing gear in northern southeastern Alaska (SEAK) was quantified
using a scar-based method. The percentage of whales assessed to have been entangled
ranged from 52% (minimal estimate) to 71% (conditional estimate) to 78% (maximal
estimate). The conditional estimate is recommended because it is based solely on
unambiguous scars. Eight percent of the whales in Glacier Bay/Icy Strait acquired new
entanglement scars between years, although the sample size was small. Calves were less
likely to have entanglement scars than older whales and males may be at higher risk than
females. The temporal and spatial distribution of commercial fisheries is complex and
difficult to correlate with these results. The percentage of whales with entanglement
scarring is comparable to the Gulf of Maine where entanglement is a substantial
management concern. Consequently, SEAK humpback whale-fisheries interactions may
warrant a similar level of scrutiny.

iv
Table of Contents
Page
Signature Page ……………………………………………………………………………i
Title Page ..………………………………………………………………………………ii
Abstract …………………………………………………………………………………iii
Table of Contents .………………………………………………………………………iv
List of Figures .…………………………………………………………………………vii
List of Tables .……………………………………………………………………………x
List of Appendices .……………………………………………………………………xiii
Acknowledgements ……………………………………………………………………xiv
Introduction . .……………………………………………………………………………1
Population size and status of humpback whales in Alaska .……………………1
Legal mandates regarding marine mammal-fisheries interactions in the U.S…2
Applying the MMPA to humpback whale-fisheries interactions in SEAK .……4
A scar-based approach to assessing non-lethal entanglements . .………………7
Humpback whale entanglements in Alaska .……………………………………9
Fisheries in SEAK ..……………………………………………………………15

v
Objectives .………………………………………………………………………15
Methods …………………………………………………………………………………16
Study area ………………………………………………………………………16
Whale surveys and data collection .……………………………………………16
Photographic data analysis .……………………………………………………19
Percentage of whales with non-lethal caudal peduncle entanglement scars …25
Annual rate of entanglement scar acquisition …………………………………26
Identification of vulnerable segments of the population ………………………26
Commercial fisheries in northern SEAK ………………………………………27
Statistical analyses………………………………………………………………30
Results . .…………………………………………………………………………………31
Whale surveys and data collection .……………………………………………31
Photographic data analysis .……………………………………………………31
Percentage of whales with non-lethal caudal peduncle entanglement scars …40
Annual rate of entanglement scar acquisition …………………………………42
Identification of vulnerable segments of the population ………………………43
Sex ………………………………………………………………………43
Age ………………………………………………………………………46

vi
Location …………………………………………………………………48
Commercial fisheries in northern SEAK ………………………………………55
Discussion ………………………………………………………………………………59
Percentage of whales with non-lethal caudal peduncle entanglement scars …59
Recommended estimate …………………………………………………61
Annual rate of entanglement scar acquisition …………………………………62
Identification of vulnerable segments of the population ………………………65
Sex ………………………………………………………………………65
Age ………………………………………………………………………67
Location …………………………………………………………………68
Commercial fisheries in northern SEAK ………………………………………70
Fishing gear modifications………………………………………………73
Lost fishing gear …………………………………………………………74
Lessons learned from applying the scar coding method ………………………75
Management recommendations . .………………………………………………77
Literature cited …………………………………………………………………………80
Appendices . .……………………………………………………………………………87

vii
List of Figures
Page
Figure 1. Number of entangled humpback whales by month either reported in SEAK or sighted elsewhere, but confirmed to be entangled in SEAK fishing gear, 1997 – 2004 (n = 40) ………………………………10
Figure 2. Humpback whale calf with line entangled around its caudal peduncle in Frederick Sound, AK in July 2004 …………………………10
Figure 3. Humpback whale with line entangled around its caudal peduncle near Homer, AK in March 2005 . .………………………………………11
Figure 4. Calf whale #1846 with extensive caudal peduncle and fluke scarring presumed to be from an attack by a killer whale or false killer whale ….11
Figure 5. Fishing gear types involved in humpback whale entanglements in Alaska, 1997 – 2004 (n = 52) ……………………………………………12
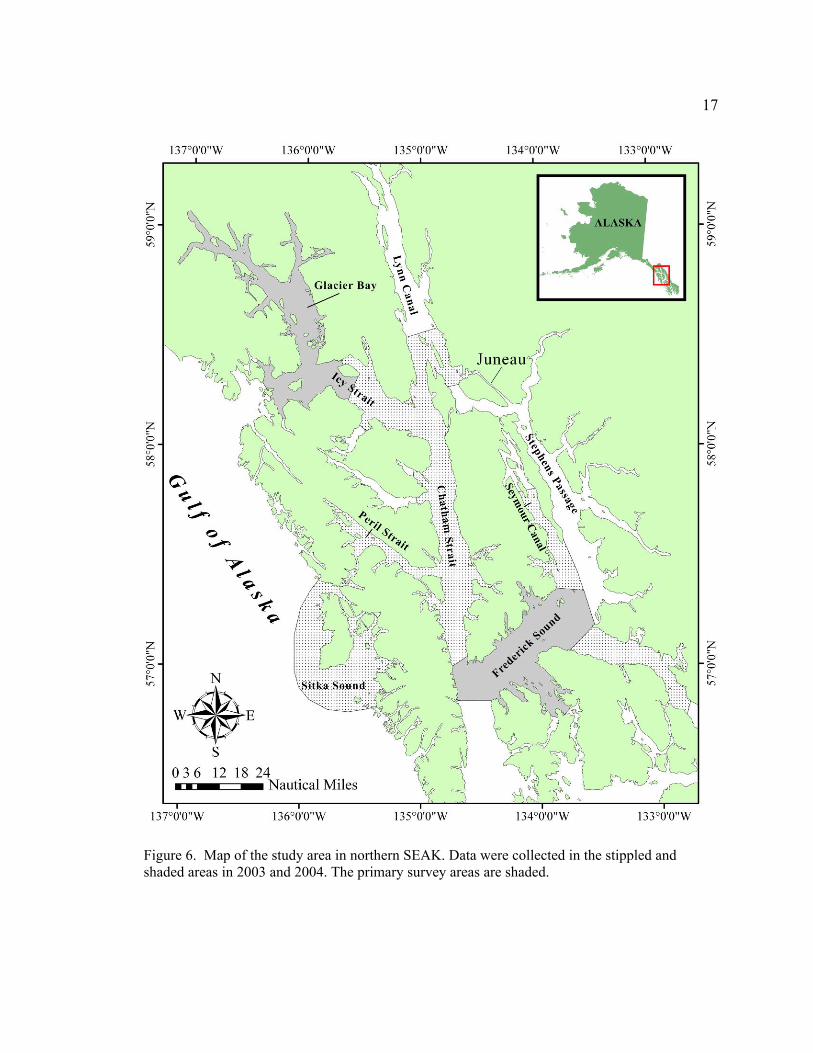
Figure 6. Map of the study area in northern SEAK .………………………………17
Figure 7. ADF&G salmon and shellfish fishery statistical area districts (‘ADF&G districts’) that overlap with the study area . .…………………18
Figure 8. Example caudal peduncle photograph illustrating four of the six areas used in coding . .……………………………………………………21
Figure 9. Example caudal peduncle photographs collected during this study illustrating E-codes ………………………………………………………23
Figure 10. Example of E-code EX due to limited photographic coverage (only one of the six caudal peduncle areas is visible) …………………………24
Figure 11. Locations of sampled whales, 2003 – 2004 (n = 303) . .…………………32

viii
Figure 12. Number of caudal peduncle photographs collected per individual whale vs. E-code for whales with adequate photographic coverage for both years combined (n = 180) ………………………………………35
Figure 13. Variation in the percentage of whales assigned to each E-code during four independent attempts at coding the 2003 sample of caudal peduncle photographs ……………………………………………37
Figure 14. Entanglement scarring percentages during four independent attempts at coding the 2003 sample of caudal peduncle photographs. .…38
Figure 15. Whale #351 in 2003 (left) and 2004 (right) . .……………………………41
Figure 16. Geographic distribution of whales with a high likelihood of previous entanglement (E-codes E3 and E4) for both years combined (n = 94) .………………………………………………………52
Figure 17. Summary of the general timing of commercial fishing seasons in the study area by ADF&G District ………………………………………56
Figure 18. Percentage of total harvest (lb) in ADF&G Districts 9 – 14 for each fishery ……………………………………………………………………57
Figure 19. Historic photographs showing whale #232 in 1988 (left) and 2004 (right) showing the stability of the scarring pattern on the leading edge of this whale’s flukes ………………………………………………88
Figure 20. Whale #351 in 1997 (left) and 2003 (right) .……………………………88
Figure 21. Whale #166 in 1994 (left) and 2004 (right). .……………………………88
Figure 22. Whale #1018 in 1996 (left) and 2002 (right) ……………………………89
Figure 23. Main Dungeness crab fishing grounds in northern SEAK ………………91
Figure 24. Diagram of generalized pot gear . .………………………………………92

ix
Figure 25. Main red king crab fishing grounds in northern SEAK …………………94
Figure 26. Main golden king crab fishing grounds in northern SEAK . .……………97
Figure 27. Main Tanner crab fishing grounds in northern SEAK …………………100
Figure 28. Main shrimp pot fishing grounds in northern SEAK .…………………103
Figure 29. Main drift gillnet fishing grounds for salmon in northern SEAK . .……106 Figure 30. Diagram of generalized drift gillnet gear ………………………………107
Figure 31. Main purse seine fishing grounds for salmon in northern SEAK . .……109
Figure 32. Diagram of generalized purse seine gear ………………………………110
Figure 33. Main longline fishing grounds for halibut in northern SEAK …………112
Figure 34. Main longline fishing grounds for sablefish in northern SEAK .………113
Figure 35. Diagram of generalized longline gear .…………………………………115

x
List of Tables
Page
Table 1. Summary of scar codes (S-codes) .………………………………………21
Table 2. Summary of entanglement status codes (E-codes) ………………………22
Table 3. Approximate equivalents between ADF&G Districts and IPHC statistical areas in the study area . .………………………………………29
Table 4. Approximate equivalents between ADF&G Districts and ADF&G groundfish statistical areas in the study area ……………………………29
Table 5. Summary of survey effort, 2003 – 2004…………………………………31
Table 6. Number of whales assigned to each E-code based on how much photographic coverage of the caudal peduncle was obtained for both years combined .……………………………………………………33
Table 7. Entanglement scarring percentages of whales with adequate photographic coverage of one vs. two (i.e., both) sides of the caudal peduncle for both years combined .………………………………34
Table 8. E-codes of all whales with adequate photographic coverage, 2003 – 2004 . .……………………………………………………………34
Table 9. Number of whales assigned E-codes E0 – E4 by number of caudal peduncle photographs per individual whale for both years combined .…36
Table 10. Entanglement scarring percentages of whales with fewer than 10 caudal peduncle photographs, whales with 10 or more caudal peduncle photographs and all whales for both years combined …………36
Table 11. Results of two-tailed Fisher’s exact tests comparing entanglement scarring percentages between four attempts at coding the 2003 sample of caudal peduncle photographs …………………………………38

xi
Table 12. Entanglement scarring percentages for all whales, 2003 – 2004 .………40
Table 13. Whales assigned different E-codes in 2003 and 2004 due to inter-annual differences in photographic quality and/or angle of caudal peduncle photographs ……………………………………………41
Table 14. Number of whales assigned E-codes E0 – E4 by sex and year …………44
Table 15. Entanglement scarring percentages by sex and year .……………………44
Table 16. Results of two-tailed Fisher’s exact tests comparing entanglement scarring percentages by sex between 2003 and 2004 ……………………44
Table 17. Number of whales assigned E-codes E0 – E4 by sex for both years combined . .………………………………………………………………45
Table 18. Entanglement scarring percentages by sex for both years combined ……45
Table 19. Number of caudal peduncle photographs per whale (range, median) and average amount of caudal peduncle photographic coverage per whale by sex for both years combined .…………………………………46
Table 20. Number of whales assigned E-codes E0 – E4 by age class and year ……47
Table 21. Entanglement scarring percentages by age class and year ………………47
Table 22. Number of whales assigned E-codes E0 – E4 by age class for both years combined .…………………………………………………………47
Table 23. Entanglement scarring percentages by age class for both years combined . .………………………………………………………………47
Table 24. Number of caudal peduncle photographs per whale (range, median) and average amount of caudal peduncle photographic coverage per whale by age class for both years combined .……………………………48

xii
Table 25. Number of whales assigned E-codes E0 – E4 by location and year .……49
Table 26. Entanglement scarring percentages by location and year .………………50
Table 27. Results of two-tailed Fisher’s exact tests comparing entanglement scarring percentages by location between 2003 and 2004 ………………50
Table 28. Number of whales assigned E-codes E0 – E4 by location of whale for both years combined …………………………………………………51
Table 29. Entanglement scarring percentages by location for both years combined . .………………………………………………………………51
Table 30. Results of two-tailed Fisher’s exact tests comparing minimal scarring percentages by location for both years combined . .……………53
Table 31. Results of two-tailed Fisher’s exact tests comparing conditional scarring percentages by location for both years combined . .……………54
Table 32. Results of two-tailed Fisher’s exact tests comparing maximal scarring percentages by location for both years combined . .……………54
Table 33. Number of caudal peduncle photographs per whale (range, median) and average amount of caudal peduncle photographic coverage per whale by location for both years combined . .……………………………55

xiii
List of Appendices
Page
Appendix 1. Historic Case Studies ……………………………………………………87
Appendix 2. Major Commercial Fisheries in Northern SEAK .………………………90
Dungeness Crab Pot Fishery .……………………………………90
Red King Crab Pot Fishery………………………………………93
Golden King Crab Pot Fishery . .…………………………………96
Tanner Crab Pot Fishery…………………………………………99
Shrimp Pot Fishery . ……………………………………………102
Salmon Drift Gillnet Fishery . .…………………………………105
Salmon Purse Seine Fishery ……………………………………108
Halibut and Sablefish Longline Fisheries………………………111
Appendix 3. Humpback Whale Photo Catalogs Used for Individual Identification …117

xiv
Acknowledgements
This thesis would not have been possible without the encouragement, as well as financial,
logistical and technical support, of many people and organizations. I am indebted to
Jooke Robbins (Provincetown Center for Coastal Studies) and David Mattila (Hawaiian
Islands Humpback Whale National Marine Sanctuary) for inspiring me to conduct this
study and for offering invaluable advice and assistance along the way. I am grateful to
Chris Gabriele and Jan Straley for being supportive mentors and for sharing their
knowledge and expertise in so many aspects of this project. I thank the National Park
Service for their long-term support of the humpback whale monitoring program in
Glacier Bay and Icy Strait and for allowing me to take time away from my job to pursue
this degree. Thanks to Jen Cedarleaf (UAS – Sitka) for her superlative fluke-matching
skills and to Betsy Wilson for her enthusiasm, expertise and friendship in the field. I
thank Kaja Brix, Aleria Jensen and Mary Sternfeld (NOAA Fisheries) for their support of
this study and for providing me with entanglement records. For many years of
administrative support, I gratefully acknowledge Susan Sugai and Adie Callahan (Alaska
Sea Grant), Cheryl Van Dyke and Bob Christensen (Southeast Alaska Wilderness
Exploration, Analysis & Discovery) and Christina Neumann and Laura Bender (UAF).
I offer my sincere thanks to the many fishermen who graciously shared their knowledge
about commercial fishing and patiently answered my many questions, including Paul
Barnes, Gene Farley, Ian Fisk, Dick Gregg, Michelle Masden, Ted Merrell, Larry Painter,
Vince Shafer and Pedr Turner. For technical help in describing fisheries, I appreciate the
help of the following ADF&G staff: Gretchen Bishop, Brian Glynn, Dave Gordon, Dave
Harris, Tory O’Connell, Jan Rumble and Troy Thynes. For logistical support, I thank Pat
Hughes (M/V Palco), Mike Braal (M/V Exodus), NPS mechanic Bruce McDonough and
Jim Collins and Tony Talbott (Allen Marine). Thanks to Jeff Jacobsen, Fred Sharpe,
Steve Lewis, Melissa Senac, Arny Blanchard, Ann Tangle and Uncle Peduncle for their
help and encouragement with various facets of this study. I appreciate the guidance and

xv
support of my committee, Sue Hills, Mike Castellini, Chris Gabriele, Jan Straley and
Terry Quinn. Finally, a heartfelt thanks to my husband, Sean, for putting me in a
supportive environment and for being patient while I navigated this long journey.
Funding for this study was generously provided by the Alaska Sea Grant College
Program, NOAA Fisheries Alaska Regional Office, National Park Service and the Bud
Fay and Ken Turner Memorial Scholarship Funds. Data collection was conducted under
NMFS Scientific Research Permits #945-1499-00 and #473-1433.

1
Introduction
Entanglement of marine mammals in fishing gear has been documented widely and may
affect a significant proportion of some populations of baleen whales (Kraus 1990; Lien
1994; Volgenau et al. 1995; Knowlton and Kraus 2001; Robbins and Mattila 2001, 2004;
Knowlton et al. 2005). In recent years an increasing number of humpback whales
(Megaptera novaeangliae) has been reported entangled in Alaska according to
unpublished data from the National Oceanic and Atmospheric Administration (NOAA)
Fisheries Alaska Regional Office. There have been no systematic efforts to quantify the
problem, although reports of entangled whales are compiled by NOAA Fisheries in a
stranding database. In 2001, NOAA Fisheries acknowledged the pressing need for a
detailed assessment of humpback whale entanglement in Alaska.1 The goal of this thesis
is to elucidate the prevalence of non-lethal entanglements and the distribution of
commercial fisheries in northern southeastern Alaska (SEAK) with the ultimate goal of
informing management discussions of the entanglement issue for the Central North
Pacific (CNP) stock of humpback whales.
Population size and status of humpback whales in Alaska
The humpback whales in Alaska are part of the CNP stock, mainly wintering in the
Hawaiian Islands and migrating in the summer to northern British Columbia and Alaska
west to Unimak Pass (Baker et al. 1990; Perry et al. 1990; Calambokidis et al. 1997,
2001). Like all stocks in U.S. waters, this stock is listed as endangered under the U.S.
Endangered Species Act (ESA) and as depleted under the U.S. Marine Mammal
Protection Act (MMPA). The most recent population estimate for the CNP stock based
on photo-identification data was 4,005 whales (CV = 0.095) in 1993 (Calambokidis et al.
1997) with a current rate of increase of 7% per year (Mobley et al. 2001).
1 Unpublished presentation by Kaja Brix, NOAA Fisheries Alaska Regional Office, PO Box 21668,
Juneau, AK 99802, to the Marine Mammal Commission, 2001.

2
Within Alaska, seasonal aggregations of feeding humpback whales from the CNP stock
form in several areas including SEAK, Prince William Sound, Kodiak and the Shumagin
Islands (Baker et al. 1986; Calambokidis et al. 1997, 2001; Waite et al. 1999; Witteven et
al. 2004). These aggregations are relatively isolated with minimal interchange
documented among feeding areas (Baker et al. 1986; Waite et al. 1999; Calambokidis et
al. 1997, 2001). For example, out of 287 whales photographically identified in SEAK
between 1991 and 1993, only three individuals were re-sighted in other feeding areas in
Alaska (Calambokidis et al. 2001). Based on the discreteness of the SEAK feeding
aggregation, NOAA Fisheries is considering formally designating these whales as a
separate stock under the MMPA (Angliss and Outlaw 2005).
Many of the whales in SEAK show a high level of fidelity to relatively small summer
feeding areas such as Glacier Bay or Sitka Sound (Straley 1994; Straley et al. 2002).
Using data collected in Glacier Bay, Sitka Sound and Frederick Sound from 1994 through
2000, Straley et al. (2002) estimated that 74% – 81% of the whales returned to the same
feeding area.
The most recent population estimate for northern SEAK was based on photo-
identification data and yielded an estimate of 961 (95% CI: 657, 1,076) individuals in
2000 (Straley et al. 2002). This is considered a minimum population estimate for SEAK
because no data were collected in southern SEAK (Straley et al. 2002).
Legal mandates regarding marine mammal-fisheries interactions in the U.S.
The 1994 amendments to the MMPA (16 U.S.C. 1361 et seq.) define a framework for
determining when the number of marine mammals seriously injured or killed incidental
to commercial fishing operations jeopardizes the sustainability of a stock. The process
involves estimating the maximum number of animals (not including natural mortalities)
that may be removed annually from a marine mammal stock while still allowing the stock
to reach or maintain its optimum sustainable population size. This threshold, known as

3
the Potential Biological Removal (PBR), is calculated from the species’ estimated
population size, net productivity rate and status under the ESA (50 CFR 229.2).
Although it is one of management’s key driving forces, a ‘serious injury’ is defined
vaguely as “[a wound or other physical harm] that will likely result in mortality” (50 CFR
229.2). In the absence of a more specific definition for serious injury, each humpback
whale entanglement in fishing gear is assessed by a panel of experts on a case-by-case
basis to determine if the whale’s injuries were likely to be fatal.2 The estimated number
of serious injuries is then added to the number of confirmed mortalities to determine if
PBR for the stock has been exceeded.
If PBR is exceeded, the MMPA mandates that a take reduction plan (TRP) be developed
to determine ways to reduce the serious injury and mortality rate to below PBR within six
months. Within five years of the implementation of the TRP, the number of marine
mammals seriously injured or killed incidental to commercial fishing operations is to be
reduced to “insignificant levels”, defined as less than 10% of PBR, which is called the
Zero Mortality Rate Goal (ZMRG).
Initially, the PBR framework was established to address serious injuries and mortalities
resulting from commercial fisheries interactions, but it has evolved to incorporate other
human-caused serious injuries and mortalities (e.g., ship strikes, subsistence/sport
fisheries interactions, etc.). However, there is no systematic effort to monitor non-
commercial fishery related takes (National Research Council 2005) and they are not
addressed through the TRP process.
2 Personal communication from Robyn Angliss, National Marine Mammal Laboratory, 7600 Sand Point
Way NE, Seattle, WA 98115, April 2005.
4
As an integral part of the PBR framework, NOAA Fisheries must categorize all U.S.
commercial fisheries annually based on the level of serious injury and mortality of
marine mammals caused by each fishery (16 U.S.C. 1387 (c)(1)). Category I fisheries are
those in which the amount of annual serious injury and mortality of a marine mammal
stock is greater than or equal to 50% of PBR; Category II fisheries are those in which the
amount of annual serious injury and mortality of a marine mammal stock is greater than
1% and less than 50% of PBR; and Category III fisheries are those in which the amount
of annual serious injury and mortality of a marine mammal stock is less than or equal to
1% of PBR.
Owners of vessels or gear involved in Category I or II fisheries are required to register
with NOAA Fisheries and obtain authorization to take marine mammals incidentally. If
requested by NOAA Fisheries, participants in Category I and II fisheries are required to
accommodate observers onboard their vessels to monitor incidental mortality and injury
of marine mammals (50 CFR 229.7). Observers may be placed on vessels participating in
Category III fisheries if there is evidence that the fishery is causing “immediate and
significant adverse impact” on a threatened or endangered marine mammal species (50
CFR 229.7). Vessel owners or operators engaged in any commercial fishery (Category I,
II or III) must report all mortalities and/or injuries of marine mammals that occur in the
course of commercial fishing operations (50 CFR 229.6).
Applying the MMPA to humpback whale-fisheries interactions in SEAK
Currently, PBR for the SEAK portion of the CNP stock of humpback whales is 3.0
whales per year (Angliss and Outlaw 2005). If this PBR were exceeded, then the ZMRG
would be 0.3 whales per year. The only Category I commercial fisheries that have been
identified within the typical annual range of SEAK humpback whales are the Hawaii
longline/set line fisheries for broadbill swordfish (Xiphias gladius), tuna (Thunnus sp.,
Katsuwonus pelamis), billfish (Makaira sp., Istiophorus sp., Tetrapturus sp.), mahimahi
(Coryphaena hippurus), wahoo (Acanthocybium solandri) and oceanic sharks (primarily

5
Prionace glauca). These fisheries are classified as Category I primarily due to
interactions with false killer whales (Pseudorca crassidens). Two Category II
commercial fisheries have been identified within the typical annual range of SEAK
humpback whales: the SEAK salmon drift gillnet fishery and the SEAK salmon purse
seine fishery. These fisheries are classified as Category II based on the cumulative
serious injury and mortality to multiple marine mammal stocks, including humpback
whales. All other commercial fisheries in SEAK and Hawaii with which SEAK
humpback whales are likely to interact are classified as Category III fisheries.
Based on a multi-year average of Alaska-Hawaii federal fishery observer program data,
self-reported commercial fisheries records and Alaska-Hawaii stranding records, the
serious injury and mortality rate incidental to commercial fisheries in SEAK is estimated
to be 2.7 whales per year (Angliss and Outlaw 2005). While this rate is considered an
underestimate because not all entangled whales are found or reported, it may also be an
overestimate because 1) any serious injury or mortality in which the gear type could not
be determined is counted as a commercial fisheries interaction3 and 2) all records from
Hawaii are counted, even though some of the whales may have come from feeding
grounds other than SEAK. Omitting the Hawaii records yields a serious injury and
mortality rate incidental to commercial fisheries of 1.65 whales per year. Regardless of
which rate is more accurate for SEAK, neither exceeds the PBR of 3.0 whales per year
but both exceed the ZMRG of 0.3 whales per year.
From a management perspective, an accurate measure of the serious injury and mortality
rate due to fisheries interactions in SEAK is clearly needed but difficult to obtain. The
remoteness of the Alaska and northern British Columbia coastline and the rarity with
which humpback whale carcasses are found and reported4 make it difficult to examine
3 Personal communication from Robyn Angliss, National Marine Mammal Laboratory, 7600 Sand Point
Way NE, Seattle, WA 98115, September 2005. 4 Personal communication from Jan Straley, University of Alaska Southeast, 1332 Seward Ave., Sitka,
AK 99835, October 2003.

6
dead humpback whales for evidence of lethal fisheries interactions. Alternatively, if
every live entangled whale or piece of lost fishing gear were found and tracked, then
accurately calculating the rate of lethal entanglements might be possible, but the cost and
effort required to undertake this level of monitoring are prohibitive.
In the absence of more comprehensive data, reports of live entangled whales provide
much of the information that managers use to gauge the level of serious injury and
mortality incidental to commercial fisheries in SEAK. Assessing whether or not an
entangled whale’s injuries are likely to be fatal is subjective, especially with the
incomplete information that accompanies most reports. The quality of an assessment
improves with the experience level of the person conducting the assessment; those with
more experience disentangling whales are generally better at interpreting whether an
entangled whale’s injuries are likely to be fatal over time. Some whales are able to self-
release (i.e., shed the entangling gear without human intervention) but the factors that
allow them to do so are poorly understood. Every entanglement is potentially lethal when
the whale first becomes entangled because the nature of each entanglement continuously
changes as the whale attempts to free itself, the gear shifts and/or the animal grows. In
addition, an entangled whale with trailing gear is susceptible to snagging more gear.
Unless all of the gear is removed from the whale, an entanglement assessed on one day as
minor may evolve into a serious injury or mortality.
Assessments of entangled whales are further complicated by the fact that extensive
external injuries are not always present in entangled humpback whales that eventually die
(Robbins and Mattila 2004). Superficially, entangled animals may appear healthy, but
chronic exposure to stress in cetaceans (such as the stress presumably induced by an
entanglement that is not immediately lethal) may cause an imbalance in metabolic
regulation which can lead to death (Angliss and Demaster 1998).

7
A scar-based approach to assessing non-lethal entanglements
A more feasible approach for assessing the magnitude of fisheries interactions in a stock
is to examine living humpback whales for evidence that they have been entangled
previously. This approach was pioneered in the western North Atlantic where researchers
studying northern right (Eubalaena glacialis) and humpback whales noted that wounds
resulting from entanglements may remain visible as distinct scars long after the
entanglement event (Kraus 1990; Robbins and Mattila 1999, 2001, 2004; Knowlton and
Kraus 2001; Knowlton et al. 2005). Photographic studies of entanglement scars offer the
opportunity to non-invasively sample a large number of animals to make inferences about
the frequency of entanglements in a population on a cumulative and annual scale.
The short- and long-term biological implications of non-lethal entanglements are
unknown and presumably vary depending on the severity of the incident. Female
humpback whales in the Gulf of Maine that survived being entangled were less likely to
be lactating than females that had not been entangled, suggesting that non-lethal
entanglements may have an impact on reproductive success (Robbins and Mattila 2001).
However, the short length of the study period may have confounded this analysis
(Robbins and Mattila 2001).
A study of 30 humpback whale entanglements documented in the western North Atlantic
revealed that 53% of the whales had gear attached at the posterior caudal peduncle (the
narrowing of the body at the insertion point of the flukes), 43% had gear attached at the
mouth and 4% had gear attached at the flipper(s), body or the exact location was
unknown (Johnson et al. 2005). Although entanglements often involved multiple body
parts, 30% involved only the caudal peduncle and 20% involved only the mouth (Johnson
et al. 2005). The propensity for gear to wrap around the caudal peduncle also has been
documented in gray whales (Heyning and Lewis 1990) and some right whales (Kraus
1990). Heyning and Lewis (1990) speculated that the gear starts out wrapped further
forward on the body, then slips posteriorly where it eventually snags at the base of the

8
flukes. Because whales are often entangled around their caudal peduncles, this is a good
place to look for evidence that they have been entangled.
In the Gulf of Maine, Robbins and Mattila (1999, 2001) developed a systematic method
to measure the frequency of non-lethal entanglements in humpback whales by assessing
high resolution photographs of scarring patterns on living whales’ caudal peduncles
(although they also included the leading edges of the whales’ flukes.) Humpback whales
frequently raise their tails as they dive, making the caudal peduncle a relatively easy part
of the body to photograph consistently and then examine for wrapping scars, linear
notches and other tissue damage consistent with a previous entanglement. After ground-
truthing the method with documented entanglements in their study area, Robbins and
Mattila (2001, 2004) concluded that 48% – 65% (no variances calculated in original) of
the humpback whales photographed annually between 1997 and 2002 in the Gulf of
Maine (n = 569) had a high likelihood of having experienced at least one entanglement
involving the caudal peduncle. A comparison of photographs of the same individuals
between years revealed that 8% – 25% of the whales acquired new entanglement scars
each year (Robbins and Mattila 2004). Using a similar scar-based approach, Kraus (1990)
concluded that 57% of North Atlantic right whales bear caudal peduncle entanglement
scars.
In 2002, Robbins and Mattila (2004) applied the caudal peduncle scar analysis method to
humpback whales in Hawaii (n =157) and found that 14% of the animals had a high
likelihood of having been entangled (Robbins and Mattila 2004). Based on these results,
entanglement of humpback whales appeared to be much more common in the Gulf of
Maine than in Hawaii. No comparative data were available for humpback whales in
Alaska, although historic photographs collected by Glacier Bay National Park & Preserve
(GBNPP) biologists include numerous opportunistic caudal peduncle photographs
(Appendix 1). This thesis represents the first systematic attempt to quantify the number of
humpback whales in Alaska that have been entangled.

9
Humpback whale entanglements in Alaska
Prior to 1955, several entanglements of large whales in submarine telecommunications
cables were reported in the Pacific Ocean (Heezen 1957), but since the mid-1950s no
whales have been documented entangled in submarine cables, presumably due to
advances in cable building and laying technology (Norman and Lopez 2002).
Entanglement records were not collected systematically by the NOAA Fisheries Alaska
Regional Office until 1997. From 1997 through 2004, 52 humpback whales were reported
entangled in fishing nets and/or lines in Alaska (or were reported elsewhere and were
confirmed to be entangled in Alaskan fishing gear.) Seventy-seven percent of the reports
involved SEAK humpback whales.5 This could either mean that entanglement rates are
higher in SEAK and/or that the reporting rate in SEAK is higher than in more remote
coastal areas of the state. The majority of entangled animals in SEAK were reported in
July and August (Fig. 1), although temporal patterns in stranding reports are confounded
by seasonal changes in the number of boaters/observers on the water.
The majority of the entanglements reported in Alaska have not been documented fully,
making it difficult to quantify how often different body parts are involved or how similar
the patterns of entanglement are between Alaska and the Gulf of Maine. However, two
unusually well-documented entanglements in Alaska involved whales with gear wrapped
around the caudal peduncle (Fig. 2, 3) in a manner analogous to what has been
documented in the Gulf of Maine.6 Both whales also had conspicuous wrap marks
anterior to the caudal peduncle, indicating that the gear probably started out wrapped
farther forward on their bodies and then slipped posteriorly to the location where it was
photographed.
5 Unpublished data, NOAA Fisheries Alaska Regional Office, PO Box 21668, Juneau, AK 99802. 6 Personal communication from Jooke Robbins, Provincetown Center for Coastal Studies, PO Box 1036,
Provincetown, MA 02657, September 2005.

10
4 43
1 1
1312
1000
1
0
2
4
6
8
10
12
14
Jan Feb Mar Apr May Jun Jul Aug Sep Oct Nov Dec
Month
No.
of e
ntan
glem
ents
rep
orte
d
Figure 1. Number of entangled humpback whales by month either reported in SEAK or sighted elsewhere, but confirmed to be entangled in SEAK fishing gear, 1997 – 2004 (n = 40).7
Figure 2. Humpback whale calf with line entangled around its caudal peduncle in Frederick Sound, AK in July 2004. The calf also appears to have line entangled around its left pectoral fin (photo courtesy of John McNally).
7 Unpublished data, NOAA Fisheries Alaska Regional Office, PO Box 21668, Juneau, AK 99802.

11
Figure 3. Humpback whale with line entangled around its caudal peduncle near Homer, AK in March 2005 (photo courtesy of NOAA Fisheries Enforcement Officer Jim Wisher).
In 2004, extensive scarring documented on calf #1846’s flukes and caudal peduncle (Fig.
4) illustrates the distinct difference between scars created by entangling gear and those
Figure 4. Calf whale #1846 with extensive caudal peduncle and fluke scarring presumed to be from an attack by a killer whale or false killer whale.

12
created by a predator. The parallel rake marks observed on the calf are consistent with a
killer whale (Orcinus orca) or false killer whale attack (Naessig and Lanyon 2004).
These scars are distinct in several respects from the wrapping marks and linear notch
scars characteristic of a previous entanglement. Most notably, the rake marks consist of
linear, parallel scars spaced a few centimeters apart (matching the dentition of a killer
whale or false killer whale (Naessig and Lanyon 2004)) with no scars wrapping around
the caudal peduncle, as would be expected if they had been produced by entangling gear.
When an entangled whale is reported, NOAA Fisheries records the gear type involved in
the entanglement based on observations made by the reporting party (Fig. 5). Nearly half
Unidentified net2%
Halibut hook & line2%
Longline2%
Purse seine4%
Gillnet8%
Shrimp pot8%
Unidentified pot6%
Unknown8%
Crab pot32%
Unidentified line23%
Figure 5. Fishing gear types involved in humpback whale entanglements in Alaska, 1997 – 2004 (n = 52).8
8 Unpublished data, NOAA Fisheries Alaska Regional Office, PO Box 21668, Juneau, AK 99802.
13
(46%) of all the entanglements reported have involved pot gear (Appendix 2). However,
only one pot fishery in Alaska, the Bering Sea sablefish pot fishery, is classified as
Category II9 and it is far from the typical range of SEAK humpback whales. In 48% of all
reported entanglements, the whales collided with gear that appears to have originated in
Alaska and/or British Columbia (i.e., crab pot, shrimp pot, unidentified pot, sport halibut
hook & line).10 The other gear types (i.e., longline, purse seine, gillnet, various other
lines and nets) are used broadly throughout the annual range of humpback whales; thus it
is not always possible to pinpoint the geographic origin of these entanglements.
Humpback whales sighted around the Hawaiian Islands in winter have been reported
entangled in fishing gear originating from Hawaii and Alaska fisheries (Mazzuca et al.
1998)11, and throughout their annual range humpback whales encounter miscellaneous
synthetic marine debris of wide geographic origin.
The reliability of gear reports depends on the expertise of the observer and how closely
they could examine the gear. Distinguishing between commercial, sport and subsistence
fishing gear is often difficult unless surface buoys are marked with information
identifying the owner, or the gear is of a variety that is used only commercially (e.g.,
purse seine). Despite many shortcomings in the gear data, it appears that the fishing gear
types most often implicated in entanglements in Alaska (pot gear and gillnets) match the
general gear types most often implicated in the western North Atlantic, where 41% of
entangled humpbacks (n = 22) were entangled in pot gear and 50% were entangled in
gillnets (Johnson et al. 2005, also see Lien 1994).
9 This fishery was elevated from Category III to Category II on the 2005 List of Fisheries (71 FR 2)
based on interactions with the central and western North Pacific stocks of humpback whales (69 FR 231). 10 From the late 1970s through 1999, a limited entry (15 permits) pot fishery targeting spiny lobster
(Panulirus marginatus) and slipper lobster (Scyllarides squammosus) occurred in the northwestern Hawaiian Islands. The fishery has been closed since 2000 (50 CFR 660).
11 Unpublished data, NOAA Fisheries Pacific Islands Regional Office, 1601 Kapiolani Boulevard, Suite 1110, Honolulu, HI 96814.

14
While some entanglements are short-term (lasting only hours or days), others may last
months or even years (Robbins and Mattila 2001), confounding attempts to pinpoint the
entanglement site. In rare cases, the geographic origin of the fishing gear is unambiguous.
For management purposes, NOAA Fisheries assumes that an entanglement occurred
where the whale was reported unless the type of gear indicates otherwise (Angliss and
Outlaw 2005). An example of the latter occurred in 1997, when the U.S. Coast Guard in
Hawaii disentangled a humpback whale from sport crab pot gear that the whale had
carried from Juneau, Alaska (Angliss and Lodge 2004)12, a distance of at least 2,500 mi.
Whales may be entangled in multiple gear types, making it difficult if not impossible to
implicate a specific fishery as the initial source of the entanglement. For instance, in
March 2005 at least 21 different types of lines and nets were identified in a mass of gear
weighing >50 lb that was removed from a humpback whale in Hawaii.13
The current reporting rate of entanglements in SEAK is certainly an underestimate of the
true entanglement rate because it is based upon observed incidents reported to NOAA
Fisheries. Each year, whale researchers hear about entangled whales in SEAK from local
boaters that are never reported to NOAA Fisheries14,15 and some entangled whales are
likely never observed by humans. In the Gulf of Maine, only 3% of the humpback whales
assessed to have been entangled between 1997 and 1999 were reported as entangled
whales (Robbins and Mattila 2001). The reporting rate of entanglements to the NOAA
Fisheries Alaska Regional Office stranding database is unknown and cannot be calculated
because photographic identifications of those entangled whales were not obtained.
12 Personal communication from Christine Gabriele, GBNPP, PO Box 140, Gustavus, AK 99826, October 2005.
13 Unpublished data, Hawaiian Islands Humpback Whale National Marine Sanctuary, 726 South Kihei Road, Kihei, HI 96753.
14 Personal communication from Fred Sharpe, Alaska Whale Foundation, 4739 University Way NE #1239, Seattle, WA 98105, October 2005.
15 Personal communication from Jan Straley, University of Alaska Southeast, 1332 Seward Ave., Sitka, AK 99835, October 2005.

15
Fisheries in SEAK
Fisheries in SEAK include commercial, subsistence and sport fishing gear. A description
of the current distribution of fishing gear in SEAK was undertaken to improve
understanding of interactions between whales and fisheries and to help inform
management actions aimed at preventing entanglements. Quantitative datasets describing
the distribution and quantity of commercial, subsistence and sport fishing gear in use in
SEAK on a fine geographic scale do not exist. However, unlike subsistence and sport
fisheries, most commercial fisheries in SEAK are managed under a limited entry system
and harvest levels (lb) are tabulated systematically by management areas. These
commercial fishery datasets describing harvest levels by area constitute the only
information currently available to approximate the distribution of fishing gear in SEAK.
This reality, coupled with the MMPA’s focus on commercial fisheries interactions, made
commercial fisheries the focus of this study.
Objectives
This thesis describes a study of non-lethal entanglement of humpback whales in fishing
gear in northern SEAK. The objectives of the study were to: 1) estimate the percentage of
humpback whales in northern SEAK that have been non-lethally entangled using the
caudal peduncle scar analysis methods developed by Robbins and Mattila (1999, 2001);
2) analyze the entanglement scar data in conjunction with existing long-term humpback
whale demographic data to identify any particularly vulnerable segments of the
humpback whale population; and 3) describe the distribution of scarred humpback whales
in relation to the distribution and amount of commercial fishing in the study area.

16
Methods
Study area
The main study area encompassed the near shore waters of northern southeastern Alaska,
approximately 57° – 59° North latitude (Fig. 6). This region is characterized by an
extensive network of glacial fjords, bays, channels and inlets surrounded by temperate
rainforest. The primary survey areas were Glacier Bay, Icy Strait and Frederick Sound. In
addition, lower Lynn Canal, Chatham Strait, Seymour Canal, Peril Strait and Sitka Sound
were surveyed.
Whale surveys and data collection
Data collection in Glacier Bay and Icy Strait occurred concurrently with humpback whale
surveys conducted as part of a long-term humpback whale monitoring program sponsored
by GBNPP. These surveys occurred approximately four to five days per week from June
1 – August 31 in 2003 and 2004, and one to two days per week in May, September,
October and November 2003 and 2004. Other parts of northern SEAK were surveyed
intermittently, with most of the effort occurring during two 10-day surveys in August
2003 and August 2004. Christine Gabriele (GBNPP), Betsy Wilson (Southeast Alaska
Wilderness Exploration, Analysis and Discovery) and Jan Straley (University of Alaska
Southeast) assisted with whale surveys and data collection.
Survey effort was summarized according to Alaska Department of Fish and Game
(ADF&G) salmon and shellfish fishery statistical area districts (Fig. 7), hereafter referred
to as ADF&G districts. These units of area were chosen because 1) the majority of
reported humpback whale entanglements in SEAK involve gear from shellfish and
salmon fisheries (i.e., pot gear and gillnets), and 2) organizing the data by ADF&G
district allows for comparisons of the percentage of whales with entanglement scars in
each district with relative levels of fishing in each district. The ADF&G districts that
overlap with the study area are: District 9 (‘eastern Frederick Sound’), District 10
17
Figure 6. Map of the study area in northern SEAK. Data were collected in the stippled and shaded areas in 2003 and 2004. The primary survey areas are shaded.

18
Figure 7. ADF&G salmon and shellfish fishery statistical area districts (‘ADF&G districts’) that overlap with the study area. Each district is indicated in color and numbered.

19
(‘western Frederick Sound’), District 11 (‘Stephens Passage’), District 12 (‘Chatham
Strait’), District 13 (‘Sitka Sound/Peril Strait’) and District 14 (‘Glacier Bay/Icy Strait’).
Humpback whales were approached and photographed from outboard-driven motorboats
4 – 6.5 m in length. The whales were photographed with single lens reflex (SLR) cameras
equipped with 300mm or 70 – 210mm lenses. In 2003, the majority of photographs were
taken with a 35mm Nikon N90 camera using Kodak TMAX 3200 black and white print
film shot at 1600 ISO. In addition, some color images were taken with a 6.1 megapixel
Nikon D100 digital camera in RAW file format shot at 400 ISO. In 2004, all images were
collected with the digital camera. Photographs were taken of each whale’s caudal
peduncle by operating the boat parallel and slightly forward of each whale as it dove.
When conditions allowed both the left and right side of each whale’s caudal peduncle
were photographed. Occasionally, photographs of the dorsal side of a whale’s caudal
peduncle were taken opportunistically as a whale dove head-on towards us. To avoid bias
towards scarred whales, caudal peduncle photographs were taken of all suitably
positioned whales, regardless of whether any entanglement scarring was visible. In
addition, photographs were collected of the pigmentation and morphology of the ventral
surface of the flukes, as well as the shape and scarification of the dorsal fin, for individual
identification (Jurasz and Palmer 1981, Katona and Whitehead 1981, Blackmer et al.
2000). Waterproof plastic datasheets were used to record the date and latitude/longitude
(determined with a Global Positioning System (GPS)) where each whale was
encountered.
Photographic data analysis
Panda Photographic Laboratories, Inc., Seattle, WA processed the 35mm film and printed
a 21.6 x 27.9 cm contact sheet for each roll. Preliminary data analysis was performed by
examining the contact sheets with a 4x magnifying loupe and by using Microsoft Photo
Editor v.3.0 (Microsoft Corp., Redmond, WA) to view and enlarge the digital images.
Preliminary data analysis consisted of identifying each whale by matching its fluke

20
and/or dorsal fin photograph(s) to catalogs of individual humpback whales previously
identified in the Central North Pacific (Appendix 3). Jennifer Cedarleaf (University of
Alaska Southeast) assisted with the photographic identification of whales.
Caudal peduncle photographs and digital images were grouped by year and individual
whale. A 35mm negative film scanner (Nikon Coolscan 4000ED with Nikon Scan v.3.1.2
software (Nikon, Inc., Melville, NY)) was used to create digital images at 4000 dots per
inch (dpi). Microsoft Photo Editor v.3.0, ThumbsPlus v.6.0 and v.7.0 (Cerious Software,
Inc., Charlotte, NC) and Nikon View v.6.1.0 (Nikon, Inc., Melville, NY) were used to
adjust the lighting, contrast, exposure and dimensions of each scanned or original digital
image.
The entanglement scar analysis method of Robbins and Mattila (2001) was applied to the
digital caudal peduncle images of individual whales. Each whale’s caudal peduncle was
divided into six areas with minor revisions in terminology (dorsal peduncle, ventral
peduncle, right leading edge of flukes, left leading edge of flukes, left lateral peduncle
(equivalent to Robbins and Mattila’s ‘left flank’) and right lateral peduncle (equivalent to
Robbins and Mattila’s ‘right flank’)) (Fig. 8).
Scar codes (S-codes) after Robbins and Mattila (2001) were assigned based on the
presence/absence of entanglement-related scarring in each area (Table 1) and then an
overall entanglement status code (E-code) was assigned to each individual whale (Table
2, Fig. 9). Some entanglement scars are obvious even in very poor photographs but to
avoid biasing the analysis towards scarred whales, E-codes E0 – E4 were assigned only
to whales with adequate photographic coverage in at least two of the six caudal peduncle
coding areas. E-codes E0 – E4 were equivalent to those used by Robbins and Mattila
(2001) except that whales coded as E2 were referred to as “ambiguous” instead of as
“uncertain”. A new E-code, EX, was created and assigned to whales with coverage in
fewer than two areas and/or if the quality of the caudal peduncle photographs was

21
dorsal peduncle left leading
edge of flukes
Figure 8. Example caudal ped(after Robbins and Mattila 200
Table 1. Summary of scar codcaudal peduncle was divided iobserved. Code Scar Code (S-Code S0 No visible marks S1 Non-linear marks o S2 Linear marks or w
around the feature S3 Linear or wide sca S4 At least one visible
peduncle) S5 Extensive tissue da SX Feature could not b
quality
left lateral peduncle
ventral peduncle
uncle photograph illustrating four of the six areas used in coding 1).
es (S-codes) (after Robbins and Mattila 2001). Each whale’s nto six areas and assigned an S-code depending on the marks
) Description
r apparently randomly oriented linear marks
ide areas lacking pigmentation, which did not appear to wrap
rs which appeared to wrap around the feature
linear notch or indentation (generally on the dorsal or ventral
mage and deformation of the feature
e coded due to lack of photographic coverage or inadequate photo

22
Table 2. Summary of entanglement status codes (E-codes) (after Robbins and Mattila 2001). The six S-codes assigned to each whale’s caudal peduncle resulted in an overall E-code for that whale.
Likelihood of Code Past Entanglement Entanglement Status Code (E-Code) Description E0 NONE No evidence of entanglement (no marks present) E1 LOW Marks were observed, but did not suggest a previous entanglement.
Scar codes did not generally exceed S2 in any documented region. E2 AMBIGUOUS Entanglement-like elements were present, but there was no
consistent pattern. At least one region was generally assigned a scar code of S3 or higher.
E3 HIGH Marks appeared to be entanglement-related and minor tissue
damage was evident. At least two regions were generally assigned scar codes of S3 or higher.
E4 HIGH Marks appeared to be entanglement-related and major tissue
damage was evident. At least two regions were assigned scar codes of S3 or higher. At least one region was coded as S5.
EX Whale could not be assigned an entanglement status code due to
lack of photographic coverage or inadequate photo quality.
inadequate (i.e., blurry, too distant, or taken at an angle that obscured the caudal
peduncle) (e.g., Fig. 9, 10). Thus E-code EX was assigned to some whales despite clear
signs that they had been entangled previously. Robbins and Mattila (2001) eliminated
whales from their sample using identical criteria but did not assign an E-code to these
whales.
Whales with E-codes E3 and E4 had a high likelihood of having been entangled at least
once in the past. To assign E-codes E3 and E4, a consistent, plausible entanglement
scarring pattern had to be present across at least two areas. The observed marks had to
indicate that gear had wrapped around the caudal peduncle, otherwise the whale could
have acquired the scars from a source other than entanglement. For example, if a whale
had a scar that appeared to wrap across one area, but there were no correlating wrapping

23
Example of E-code E0 Likelihood of past entanglement: NONE
Example of E-code E2
Example of E-code E1 Likelihood of past entanglement: LOW
???
Example of E-code E3 Likelihood of past entanglement: AMBIGUOUS Likelihood of past entanglement: HIGH
Example of E-code E4 Example of E-code EX Likelihood of past entanglement: HIGH Likelihood of past entanglement: UNKNOWN
Figure 9. Example caudal peduncle photographs collected during this study illustrating E-codes. Arrows highlight key features and do not represent the total number of entanglement scars observed.

24
Figure 10. Example of E-code EX due to limited photographic coverage (only one of the six caudal peduncle areas is visible). This is the same calf shown in Fig. 2 approximately one hour after being disentangled from line. Note white linear wrapping scars on the calf’s dorsal peduncle and tissue damage indicated by arrow.
or linear notch scars in at least one other area, then E-code E2 was assigned (i.e.,
entanglement-like elements were present, but there was no consistent pattern).
The caudal peduncle entanglement scar analysis method was mastered during four
independent attempts at coding the 2003 sample of images. Between the second and third
attempts, I compared my E-codes with J. Robbins, who had assigned all of the
entanglement status codes to the whales in the Gulf of Maine study (Robbins and Mattila
2001, 2004). E-codes were assigned independently to 49 individual whales that
represented difficult cases because the appropriate code was not obvious and/or the image
quality was questionable. When different E-codes were assigned to the same whale,
Robbins’ E-codes were used when these whales were assigned E-codes in the third
attempt at coding. In the fourth (final) attempt at coding the 2003 sample, E-codes were
assigned independently without Robbins’ input; any E-codes that were found to be
different from Robbins’ E-codes were not changed in the final coding.

25
Before assigning E-codes to the 2004 sample of images, each whale was given a random
identification number to reduce bias in assigning codes to whales that had also been in
the 2003 sample.
Percentage of whales with non-lethal caudal peduncle entanglement scars
Three methods were used to estimate the cumulative percentage of whales with non-
lethal caudal peduncle entanglement scars:
Minimal Entanglement Scarring Percentage =
4321043
EEEEEEE
Σ+Σ+Σ+Σ+ΣΣ+Σ
Conditional Entanglement Scarring Percentage = 4310
43EEEE
EEΣ+Σ+Σ+Σ
Σ+Σ
Maximal Entanglement Scarring Percentage = 43210
432EEEEE
EEEΣ+Σ+Σ+Σ+Σ
Σ+Σ+Σ
Where E0, E1, E2, E3 and E4 = the number of whales assigned E-codes E0, E1, E2, E3 and E4, respectively.
The minimal entanglement scarring percentage, hereafter referred to as the minimal
scarring percentage, only includes whales with a high likelihood of previous
entanglement (E-codes E3 and E4) in the numerator. This approach is likely to
underestimate the true percentage of entangled whales because some of the whales coded
as ambiguous (E-code E2) may have been entangled. The minimal scarring percentage
approach was used by Robbins and Mattila (2001, 2004) when they estimated the
cumulative percentage of previously entangled humpback whales in the Gulf of Maine
and Hawaii. The conditional entanglement scarring percentage, hereafter referred to as
the conditional scarring percentage, has the same numerator but no ambiguous whales (E-
code E2) are included in the denominator; therefore this approach is based solely on

26
individuals with unambiguous caudal peduncle scars. However, this decreases the sample
size. The maximal entanglement scarring percentage, hereafter referred to as the maximal
scarring percentage, includes whales with a high likelihood of previous entanglement (E-
codes E3 and E4) and ambiguous whales (E-code E2) in the numerator. This approach is
likely to overestimate the true percentage of entangled whales because it is unlikely that
all of the ambiguous whales were entangled.
When the data from both years were combined, whales that were seen in both years were
counted once. If there was a difference in the E-codes between years, then the 2004 E-
code was used (unless the 2004 E-code was EX, in which case the 2003 E-code was
used).
Annual rate of entanglement scar acquisition
The E-codes and images of individual whales that were sampled adequately in both years
were used to estimate the annual rate of entanglement scar acquisition between 2003 and
2004. The whale’s caudal peduncle images from both years were compared and assessed
to estimate the amount of new entanglement-related scarring occurring between 2003 and
2004. This rate was calculated by dividing the number of whales in 2004 with an increase
in entanglement scarring by the total number of individuals with adequate photographic
coverage in both years.
Identification of vulnerable segments of the population
Sex and birth year for individual whales previously identified in SEAK were obtained
from databases maintained by long-term humpback whale monitoring programs based at
GBNPP in Gustavus, AK and at J. Straley Investigations in Sitka, AK. Sex was
determined by genetic analysis of skin samples (Lambertsen et al. 1988; Bérubé and
Palsbøll 1996) and/or photographs of the genital slit (Glockner 1983). In addition, any
whale that has been observed in close association with a calf on one or more occasions
was considered to be a female. The number of whales for which sex was determined only

27
from genetic sampling was calculated to determine if the sample was biased towards one
sex. Calves were defined as whales less than one year old and juveniles were defined as
whales over one year old but less than five years old (Clapham 1992).
GPS locations of the whale observations were grouped according to ADF&G Districts. If
a whale was photographed in multiple districts, it was assigned randomly to one district
in analyses of the percentage of whales in each district with entanglement scars. If a
whale was documented multiple times within the same district, it was assigned randomly
to one of the GPS locations where it was seen so that it could be included on descriptive
maps showing where whales were sampled.
Commercial fisheries in northern SEAK
The goal of this part of the study was to describe the commercial fisheries that humpback
whales are most likely to encounter in the study area and to compare the entanglement
scar results with the spatial and temporal distribution of these fisheries. The following
fisheries were considered: pot fisheries for Dungeness crab (Cancer magister), red king
crab (Paralithodes camtschaticus), golden king crab (Lithodes aequispinus), Tanner crab
(Chionoecetes bairdi) and shrimp (Pandalus spp.); drift gillnet and purse seine fisheries
for Pacific salmon (Oncorhynchus spp.)16; and longline fisheries for Pacific halibut
(Hippoglossus stenolepis) and sablefish (Anoplopoma fimbria).17,18
16 Purse seines and set gillnets are used to target Pacific herring (Clupea pallasi) in northern SEAK.
These fisheries are not included in this analysis because presumably humpback whales are less likely to encounter these fisheries because a) sac roe herring fishery openings (purse seine and gillnet) are typically very short (e.g., ~2 – 24 hours) and occur over just a few days each spring immediately preceding the major herring spawn events and b) although the winter food and bait herring fishery (purse seine) is more protracted (typically opening early December and closing late February), this fishery is highly localized in northern SEAK in Tenakee Inlet (District 12) and to a lesser degree in the Hobart Bay/Port Houghton/Windham Bay area (District 10) with very few participants (generally less than three vessels in recent years). (Personal communication from Dave Harris, ADF&G Commercial Fisheries Division, PO Box 240020, Douglas, AK 99824, March 2006).
17 Longlines are also used to target Pacific cod (Gadus macrocephalus) and demersal shelf rockfishes (Sebastes spp.) in SEAK. These fisheries are not included because harvest levels are low compared to longline fisheries for halibut and sablefish and this analysis only includes the major commercial fisheries of SEAK.

28
For each ADF&G District, the level of fishing in each major commercial fishery was
calculated to compare with the entanglement scar results from each district. Harvest
levels (lb) were used as a proxy for fishing effort because no data are available on the
amount of fishing gear deployed or how long it is in the water. Annual harvest data for
each ADF&G District were obtained from ADF&G and were averaged over the period
1995 through 2004 for each fishery. Harvest data from this period were not available for
two fisheries; shrimp pot data were averaged over the period 1995 – 2002 and sablefish
longline data were averaged over the period 1999 – 2003. For the drift gillnet and purse
seine fisheries, harvest data were only compiled from the traditional common property
fishery [i.e., harvest data from terminal harvest areas and hatchery cost recovery areas
(Appendix 2) were not included.] According to ADF&G policy, when fewer than three
vessels participate in a fishery, the harvest data are confidential; in these cases, the
harvest level was treated as missing. Harvest data for the halibut and sablefish longline
fisheries were not readily available by ADF&G District because the halibut fishery is
managed by the International Pacific Halibut Commission (IPHC) based on IPHC
statistical areas19 and the sablefish fishery is managed by ADF&G based on ADF&G
groundfish statistical areas.20 Therefore, to compare the halibut harvest data by ADF&G
District, the rough equivalent of each ADF&G district was defined in terms of
overlapping IPHC statistical areas (Table 3) and the halibut harvest data were
summarized using these criteria. Similarly, to compare the sablefish harvest data by
ADF&G District, the rough equivalent of each ADF&G District was defined in terms of
overlapping ADF&G groundfish statistical areas (Table 4).
In addition, a brief summary of each fishery was compiled describing the current location
of the main fishing grounds, the timing of the fishery and the type of gear used
18 Troll fisheries for salmon (Oncorhynchus spp.) and lingcod (Ophiodon elongates) are not included in
this analysis because trolling gear is not one of the gear types reported in humpback whale entanglements in SEAK in recent years (Fig. 5).
19 See Appendix 2 for a map of IPHC statistical areas in the study area. 20 See Appendix 2 for a map of ADF&G groundfish statistical areas in the study area.

29
Table 3. Approximate equivalents between ADF&G Districts and IPHC statistical areas in the study area.
ADF&G District Approximate IPHC statistical area equivalent9 stat area 161 + approximately 1/3 of stat area 162
10 stat area 163 + approximately 2/3 of stat area 16211 stat area 17312 stat area 17113 stat areas 160 + 170 + 181 + 17414 stat areas 182 + 184
Table 4. Approximate equivalents between ADF&G Districts and ADF&G groundfish statistical areas in the study area.21,22
ADF&G District Approximate ADF&G groundfish statistical area equivalent9 stat areas 345702 + 345631 + 34560310 stat area 33570112 stat areas 345803 + 345731 + 345701
(Appendix 2). Maps showing the location of the fishing grounds were generated using
information from various sources, including ADF&G reports and consultations with
commercial fishermen. Descriptions of the open season for each fishery were compiled
from ADF&G and IPHC management plans and reports. Descriptions of legal gear were
obtained from Alaska state law (05 AAC 29.001 – 05 AAC 35.590). When available,
information pertaining to historic changes in the timing or gear types used in a fishery
was noted to provide a broader perspective on the fisheries that humpback whales were
likely to have encountered in the past in northern SEAK. NOAA Alaska Sea Grant
provided illustrations of commercial fishing vessels and gear configurations. ArcGIS 9
21 ADF&G Districts 11, 13 and 14 were not considered because over 99% of the sablefish catch in the
study area comes from the equivalent of ADF&G Districts 9, 10 and 12 (Richardson and O’Connell 2004). 22 Longlining for sablefish occurs offshore of the study area in the eastern Gulf of Alaska (Appendix 2);
however these ADF&G groundfish statistical areas were not included in the summary of harvest data because they do not overlap with the study area.

30
(Environmental Systems Research Institute, Inc., Redlands, CA) was used to create maps
of the locations where whales were photographed and the locations of the fishing
grounds.
Statistical analyses
Ninety-five percent confidence intervals were calculated according to Zar (1999) on the
entanglement scarring percentages. Fisher’s exact tests of independence (Zar 1999) were
used to test for significant differences between percentages. For example, when testing
the difference between minimal scarring percentages, the pooled frequencies of E-codes
E3 and E4 were compared to the pooled frequencies of E-codes E0, E1 and E2.

31
Results
Whale surveys and data collection
A total of 1,139 hours were spent searching for, approaching and photographing
humpback whales in northern SEAK (Table 5).
Table 5. Summary of survey effort, 2003 – 2004.
Location (ADF&G District) # days # hours # days # hours # days # hoursW. Frederick Sound (9) 2 17 5 26 7 43E. Frederick Sound (10) 2 15 4 27 6 42Stephens Passage (11) 4 14 1 10 5 24Chatham Strait (12) 3 20 2 10 5 30Sitka Sound/Peril Strait (13) 2 4 2 16 4 20Glacier Bay/Icy Strait (14) 68 447 80 533 148 980Total 81 517 94 622 175 1,139
2003 2004 2003 + 2004
Note: On some days surveys were conducted in more than one district; these were counted as one survey day in each district.
Photographic data analysis
Caudal peduncle images of 152 and 224 unique whales were obtained in 2003 and 2004,
respectively. Seventy-three whales were photographed in both years resulting in 303
unique whales in the combined 2003 – 2004 sample, the majority of which were sampled
in Glacier Bay, Icy Strait and Frederick Sound (Fig. 11).
The amount of photographic coverage obtained of each whale’s caudal peduncle varied.
Fifty-three percent (n = 160) of the whales in the 2003 – 2004 sample were whales with
photographs of both the right and left sides of the caudal peduncle (# sides = 2); 6% (n =
17) were whales with photographs of one side of the caudal peduncle (left or right) and
opportunistic photographs of the dorsal caudal peduncle as the whale dove head-on

32
Figure 11. Locations of sampled whales, 2003 – 2004 (n = 303). ADF&G Districts are indicated in color and numbered.

33
towards the survey vessel (# sides = 1.5); 36% (n = 109) were whales with photographs
of just the left or the right side of the caudal peduncle (# sides = 1); 4% (n = 12) were
whales with photographs of only the dorsal caudal peduncle as the whale dove head-on
towards the survey vessel (# sides = 0.5); and 2% (n = 5) were whales with photographs
of small portions of the caudal peduncle that qualified as inadequate quality (# sides = 0)
(Table 6). The less photographic coverage that was obtained of a whale, the more likely it
Table 6. Number of whales assigned to each E-code based on how much photographic coverage of the caudal peduncle was obtained for both years combined.
%
%
No. of sides n E0 E1 E2 E3 E4 EX % EX2 160 1 24 30 74 2 29 18%
1.5 17 0 4 3 2 0 8 471 109 1 9 14 16 0 69 63%
0.5 12 0 0 0 0 0 12 100%0 5 0 0 0 0 0 5 100
was to be assigned E-code EX. All of the whales with 0 and 0.5 sides of coverage were
assigned E-code EX (Table 6) because the minimum criterion necessary to assign E-
codes E0 – E4 was not met (fewer than two of the caudal peduncle coding areas were
visible).
Using the minimal scarring percentage approach, whales with adequate photographic
coverage of one side of the caudal peduncle were significantly less likely to be assessed
as having been entangled than whales with adequate photographic coverage of both sides
of the caudal peduncle (P = 0.035, one-tailed Fisher’s exact test) (Table 7). This bias did
not exist when the maximal or conditional scarring percentage approaches were followed;
whales with photographic coverage of one side of the caudal peduncle did not have
significantly lower maximal or conditional scarring percentages than whales with

34
Table 7. Entanglement scarring percentages of whales with adequate photographic coverage of one vs. two (i.e., both) sides of the caudal peduncle for both years combined (95% confidence intervals).
No. of sides nMinimal Scarring Percentage
Maximal Scarring Percentage n
Conditional Scarring Percentage
2 131 58% (49%, 67%) 81% (73%, 87%) 101 75% (66%, 83%)1 40 40% (25%, 57%) 75% (59%, 87%) 26 62% (41%, 80%)
photographs of both sides of the caudal peduncle (P = 0.273 and P = 0.126, respectively,
one-tailed Fisher’s exact tests).
Adequate photographic coverage was obtained of 47% (n = 72) of the whales in the 2003
sample and of 61% (n = 137) of the whales in the 2004 sample (Table 8). In total, the
entanglement status of 180 unique individuals was determined. Twenty-four percent of
each annual sample consisted of whales with an ambiguous entanglement history (E-code
E2).
Table 8. E-codes of all whales with adequate photographic coverage, 2003 – 2004. The numbers for the two years cannot be added directly because some whales were seen in both years.
Year n E0 E1 E2 E3 E4
2003 72 1 15 17 37 22004 137 1 30 33 73 0
2003 + 2004 180 2 37 47 92 2
The number of caudal peduncle photographs per individual whale appeared to influence
the E-code (Fig. 12). The more photographs that were obtained of a whale, the more
likely it was that the whale was assigned E-code E3 (i.e., marks appeared to be
entanglement-related and minor tissue damage was evident). The mean number of

35
0
1
2
3
4
E-c
ode
0 5 10 15 20 25 30 35No. of caudal peduncle photographs
Figure 12. Number of caudal peduncle photographs collected per individual whale vs. E-code for whales with adequate photographic coverage for both years combined (n = 180).
photographs of whales assessed to have a high likelihood of previous entanglement (E-
codes E3 and E4) (8.4 photographs per whale) was higher than the mean number of
photographs of whales assessed to have no, low or an ambiguous likelihood of previous
entanglement (E-codes E0 – E2) (5.8 photographs per whale) and the difference was
significant (unpaired t-test, t = 3.31, df = 178, P = 0.001).
Whales with fewer than 10 caudal peduncle photographs had significantly lower minimal
and conditional scarring percentages than whales with 10 or more caudal peduncle
photographs (P = 0.003 and P = 0.037, respectively, one-tailed Fisher’s exact tests).
However, whales with fewer than 10 caudal peduncle photographs did not have a
significantly lower maximal scarring percentage than whales with 10 or more caudal
peduncle photographs (P = 0.133, one-tailed Fisher’s exact test) (Table 9, 10).

36
Table 9. Number of whales assigned E-codes E0 – E4 by number of caudal peduncle photographs per individual whale for both years combined.
No. caudal peduncle
photographs n E0 E1 E2 E3 E4
< 10 133 2 30 40 60 1≥ 10 47 0 7 7 32 1
All whales 180 2 37 47 92 2
Table 10. Entanglement scarring percentages of whales with fewer than 10 caudal peduncle photographs, whales with 10 or more caudal peduncle photographs and all whales for both years combined (95% confidence intervals).
No. caudal peduncle
photographs nMinimal Scarring Percentage
Maximal Scarring Percentage n
Conditional Scarring Percentage
< 10 133 46% (37%, 55%) 76% (68%, 83%) 93 66% (55%, 75%)≥ 10 47 70% (55%, 83%) 85% (72%, 94%) 40 83% (67%, 93%)
All whales 180 52% (45%, 60%) 78% (72%, 84%) 133 71% (62%, 78%)
The number of whales that I assigned to each E-code category varied with each attempt
that I made at coding the 2003 sample (Fig. 13). The greatest variation occurred in the
assignment of E-codes E3 and EX. As I learned to recognize the subtleties of
entanglement scar patterns, the percentage of whales coded E3 (i.e., marks appeared to be
entanglement-related and minor tissue damage was evident) increased with each coding
attempt. As I became more familiar with the minimum photographic quality and coverage
needed to assign E-codes E0 – E4, I became more selective and therefore the number of
whales coded EX (i.e., whale could not be assigned an entanglement status code due to
lack of photographic coverage or inadequate photo quality) increased with each coding
attempt. There was 90% agreement between the E-codes that I assigned during my third
and fourth coding attempts. The entanglement scarring percentages changed the most
between my first and second attempts at coding, with less variation in subsequent coding

37
0%
10%
20%
30%
40%
50%
60%
EX E0 E1 E2 E3 E4E-Code
Perc
enta
ge o
f Wha
les i
n Sa
mpl
eA
ssig
ned
E-C
ode 1st attempt
2nd attempt
3rd attempt
4th attempt
Figure 13. Variation in the percentage of whales assigned to each E-code during four independent attempts at coding the 2003 sample of caudal peduncle photographs. For code EX, the sample size is n = 152; for codes E0 – E4 the sample size is n minus the number of whales assigned code EX.
attempts (Fig. 14). There was a significant difference in the minimal scarring percentages
between my first and second attempt at coding (P = 0.029, two-tailed Fisher’s exact test);
none of the other scarring percentages were significantly different between coding
attempts (Table 11).
The comparison of E-codes with Robbins based on photographs of 49 “difficult” whales
revealed that we generated similar minimal (Neilson: 37%; Robbins: 41%), conditional
(Neilson: 53%; Robbins: 65%) and maximal (Neilson: 67%; Robbins: 78%) scarring
percentages. None of these pairs of percentages were significantly different (P = 1, P =
0.516, P = 0.544, respectively, two-tailed Fisher’s exact tests) but Robbins’ estimates of
the percentage of previously entangled whales were consistently higher than mine.

38
0%
20%
40%
60%
80%
100%
1st attempt 2nd attempt 3rd attempt 4th attempt
Coding Attempt
Perc
enta
ge o
f Wha
les A
sses
sed
to H
ave
Bee
n E
ntan
gled
MaximalScarringPercentage
ConditionalScarringPercentage
MinimalScarringPercentage
Figure 14. Entanglement scarring percentages during four independent attempts at coding the 2003 sample of caudal peduncle photographs.
Table 11. Results of two-tailed Fisher’s exact tests comparing entanglement scarring percentages between four attempts at coding the 2003 sample of caudal peduncle photographs.
ComparisonMinimal Scarring Percentage
Conditional Scarring Percentage
Maximal Scarring Percentage
1st vs. 2nd attempt P = 0.029* P = 0.069 P = 0.2932nd vs. 3rd attempt P = 0.874 P = 0.704 P = 0.5953rd vs. 4th attempt P = 0.872 P = 0.837 P = 0.845
* Indicates significant difference at α = 0.05
We assigned the same E-codes 67% (n = 33) of the time and different E-codes 33% (n =
16) of the time. There were no instances in which one of us coded a whale as having been
entangled (E3 or E4) that the other person coded as not having been entangled (E0 or
E1). The reasons why we assigned different E-codes varied:

39
In eight cases we disagreed on what constituted adequate quality photographs:
I assigned E-code EX to four whales that Robbins coded E2, E2, E3 and E3;
Robbins assessed four whales as having inadequate quality photographs that I coded
E1, E1, E2 and E3.
In five cases we disagreed on the distinction between E-codes E1 and E2:
I assigned E-code E1 to three whales that Robbins coded E2;
Robbins assigned E-code E1 to two whales that I coded E2.
In two cases we disagreed on the distinction between E-codes E2 and E3:
I assigned E-code E2 to one whale that Robbins coded E3;
Robbins assigned E-code E2 to one whale that I coded as E3.
In one case we disagreed on the distinction between E-codes E3 and E4:
I assigned E-code E4 to one whale (#1797) that Robbins coded E3 (Robbins
agreed that this was a borderline case).
During my fourth (and final) attempt at coding, I assigned 12 of these 16 disputed whales
the same E-codes and four of them different E-codes. The reasons I changed four of the
E-codes in the fourth coding were: I assigned E-code EX to one whale that had been E-
code E2; I assigned E-code E3 to two whales that had been E-code E2; I assigned E-code
E4 to whale #1797, which Robbins and I had both agreed was a borderline E3/E4 case.
These changes occurred because of slight differences in my interpretation of the same
scars, a problem inherent in the subjective nature of the scar coding method, but in this
case accentuated by the fact that these were difficult whales with scarring patterns that
did not fit easily into one E-code category.

40
Percentage of whales with non-lethal caudal peduncle entanglement scars
In 2004, a larger sample of whales with adequate caudal peduncle photographs than in
2003 allowed for greater precision in the estimates of the entanglement scarring
percentages (Table 12). The minimal, maximal and conditional scarring percentages in
2003 and 2004 were not significantly different between years (P = 1, two-tailed Fisher’s
exact tests for all comparisons); therefore, the data for both years were pooled (Table 12).
Table 12. Entanglement scarring percentages for all whales, 2003 – 2004 (95% confidence intervals).
Year NMinimal Scarring Percentage
Maximal Scarring Percentage n
Conditional Scarring Percentage
2003 72 54% (42%, 66%) 78% (67%, 87%) 55 71% (57%, 82%)2004 137 53% (45%, 61%) 77% (69%, 84%) 104 70% (60%, 79%)
2003 + 2004 180 52% (45%, 60%) 78% (72%, 84%) 133 71% (62%, 78%)
As documented by photographs of the flukes, 73 whales were photographed in both
years: 28 had adequate photographic coverage of the caudal peduncle in both years; all
were adults. None of these 28 whales exhibited a decrease in entanglement scarring
between years, 26 (93%) exhibited stable scars and two (7%) (whales #1489 and #351)
exhibited an increase in entanglement scarring. Whale #1489 was assessed as having a
low likelihood of previous entanglement (E-code E1) in 2003 and a high likelihood of
previous entanglement in (E-code E3) in 2004 based on a definite increase in scarring.
Whale #351 gained new entanglement scarring but was assessed as having a high
likelihood of previous entanglement (E-code E3) in both years (Fig. 15).
Of the 28 whales photographed adequately in both years, different E-codes were assigned
between years in four (14%) cases. One of the four whales with a different E-code was
whale #1489; this whale gained new entanglement scars between years. The other three

41
Figure 15. Whale #351 in 2003 (left) and 2004 (right).both years but new wrap marks (indicated with arrow)
instances (3/28 = 11%) in which whales were assig
to inter-annual differences in photographic quality
(Table 13).
Table 13. Whales assigned different E-codes in 2003 aphotographic quality and/or angle of caudal peduncle p
Whale ID 2003 E-code 2004 E-code
166 E4 E3
518 E1 E2
157 E2 E3
2004
2003This whale was assigned E-code E3 in were visible in 2004.
ned different E-codes are attributable
and/or the angle of the photographs
nd 2004 due to inter-annual differences in hotographs.
Reason for difference
An area of major tissue damage that was apparent in 2003 was obscured by the angle of the 2004 photographs. All of the other scars available for direct comparison were stable.
Slight differences in lighting and angle of photographs resulted in different interpretations of the same marks between years.
Slight differences in lighting and angle of photographs resulted in different interpretations of the same marks between years.
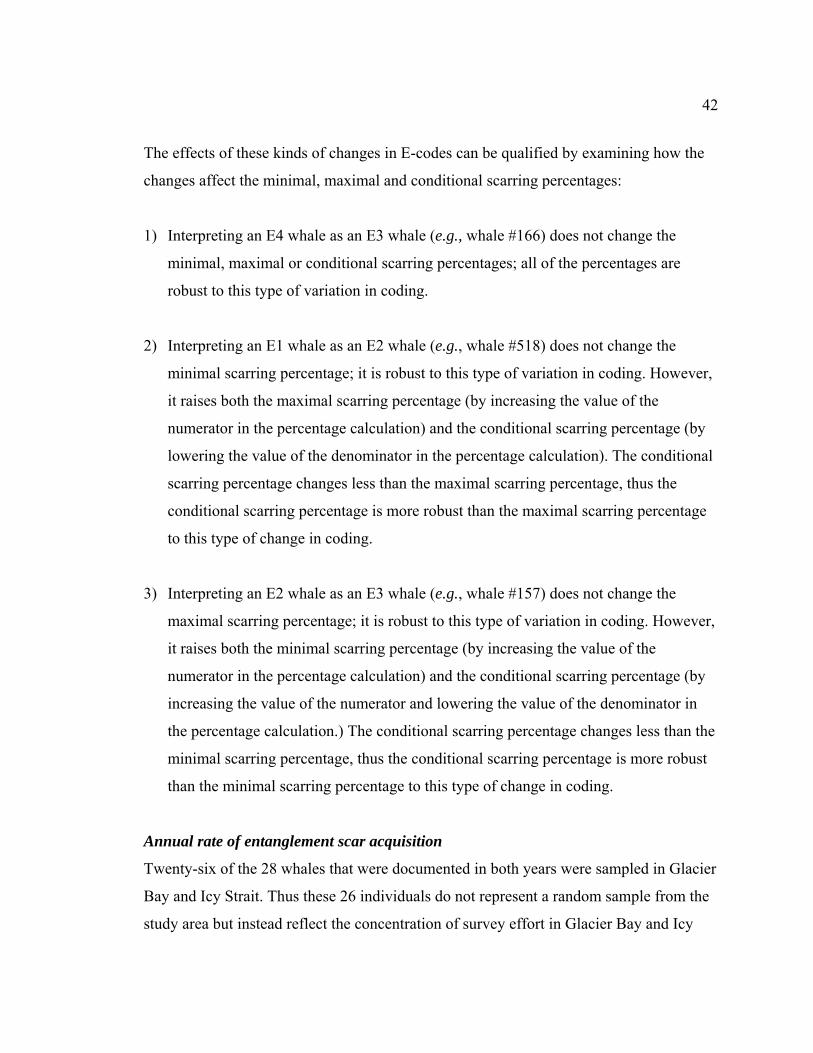
42
The effects of these kinds of changes in E-codes can be qualified by examining how the
changes affect the minimal, maximal and conditional scarring percentages:
1) Interpreting an E4 whale as an E3 whale (e.g., whale #166) does not change the
minimal, maximal or conditional scarring percentages; all of the percentages are
robust to this type of variation in coding.
2) Interpreting an E1 whale as an E2 whale (e.g., whale #518) does not change the
minimal scarring percentage; it is robust to this type of variation in coding. However,
it raises both the maximal scarring percentage (by increasing the value of the
numerator in the percentage calculation) and the conditional scarring percentage (by
lowering the value of the denominator in the percentage calculation). The conditional
scarring percentage changes less than the maximal scarring percentage, thus the
conditional scarring percentage is more robust than the maximal scarring percentage
to this type of change in coding.
3) Interpreting an E2 whale as an E3 whale (e.g., whale #157) does not change the
maximal scarring percentage; it is robust to this type of variation in coding. However,
it raises both the minimal scarring percentage (by increasing the value of the
numerator in the percentage calculation) and the conditional scarring percentage (by
increasing the value of the numerator and lowering the value of the denominator in
the percentage calculation.) The conditional scarring percentage changes less than the
minimal scarring percentage, thus the conditional scarring percentage is more robust
than the minimal scarring percentage to this type of change in coding.
Annual rate of entanglement scar acquisition
Twenty-six of the 28 whales that were documented in both years were sampled in Glacier
Bay and Icy Strait. Thus these 26 individuals do not represent a random sample from the
study area but instead reflect the concentration of survey effort in Glacier Bay and Icy

43
Strait. Limiting the sample of whales documented in both years to only the 26 whales
documented in Glacier Bay and Icy Strait, two (8%) acquired new caudal peduncle
entanglement scars between years. By applying an 8% (95% CI: 1%, 25%) annual rate of
entanglement scar acquisition to the best population estimate for the humpback whale
population in Glacier Bay and Icy Strait (n = 169) (Straley et al. 2002), about 12 or 13
(point estimate 12.5) of the whales in Glacier Bay and Icy Strait are estimated to have
had non-lethal entanglements and self-released between 2003 and 2004.
Identification of vulnerable segments of the population
Sex
The combined 2003 – 2004 sample consisted of 75 females, 46 males and 182 whales of
unknown sex. The higher percentage of females in the combined sample (1.6:1) is
reasonable because a greater proportion of the SEAK population has been identified as
female because females can be sexed more easily based on the presence of a calf.
Limiting the sample to whales whose sex is known from genetic sampling (32 females,
37 males) reveals a sample closer to parity and no female bias. Therefore I conclude that
the overall sample is not biased toward females.
In 2003, the whales with adequate photographic coverage (i.e., E-codes E0 – E4)
consisted of 14 males, 28 females and 30 whales of unknown sex (Table 14). In 2004, the
whales with adequate photographic coverage consisted of 26 males, 47 females and 64
whales of unknown sex (Table 14).
The minimal, maximal and conditional scarring percentages of males, females and
whales of unknown sex were not significantly different between 2003 and 2004 (Table
15, 16); therefore, the data from both years were pooled (Table 17, 18).
For both years combined, the minimal scarring percentage of males (82%) was higher
than that of females (55%) and the difference was significant (P = 0.013, two-tailed

44
Table 14. Number of whales assigned E-codes E0 – E4 by sex and year.
Sex Year n E0 E1 E2 E3 E4
Male 2003 14 0 4 1 8 12004 26 0 2 2 22 0
Female 2003 28 0 5 7 16 02004 47 0 12 10 25 0
Unknown 2003 30 1 6 9 13 12004 64 1 16 21 26 0
Table 15. Entanglement scarring percentages by sex and year (95% confidence intervals).
Sex Year nMinimal Scarring Percentage
Maximal Scarring Percentage n
Conditional Scarring Percentage
Male 2003 14 64% (35%, 87%) 71% (42%, 92%) 13 69% (38%, 91%)2004 26 85% (65%, 96%) 92% (75%, 99%) 24 92% (73%, 99%)
Female 2003 28 57% (37%, 76%) 82% (63%, 94%) 21 76% (53%, 92%)2004 47 53% (38%, 68%) 74% (60%, 86%) 37 68% (50%, 82%)
Unknown 2003 30 47% (28%, 66%) 77% (58%, 90%) 21 67% (43%, 85%)2004 64 41% (29%, 54%) 73% (61%, 84%) 43 60% (44%, 75%)
Table 16. Results of two-tailed Fisher’s exact tests comparing entanglement scarring percentages by sex between 2003 and 2004.
ComparisonMinimal Scarring Percentage
Maximal Scarring Percentage
Conditional Scarring Percentage
Males, 2003 vs. 2004 P = 0.234 P = 0.159 P = 0.157Females, 2003 vs. 2004 P = 0.813 P = 0.572 P = 0.560Unknown sex, 2003 vs. 2004 P = 0.657 P = 0.805 P = 0.785

45
Table 17. Number of whales assigned E-codes E0 – E4 by sex for both years combined.
Sex n E0 E1 E2 E3 E4Male 33 0 4 2 26 1
Female 62 0 13 15 34 0Unknown 85 2 20 30 32 1
Table 18. Entanglement scarring percentages by sex for both years combined (95% confidence intervals).
Sex nMinimal Scarring Percentage
Maximal Scarring Percentage n
Conditional Scarring Percentage
Male 33 82% (65%, 93%) 88% (72%, 97%) 31 87% (70%, 96%)Female 62 55% (42%, 68%) 79% (67%, 88%) 47 72% (57%, 84%)
Unknown 85 39% (28%, 50%) 74% (63%, 83%) 55 60% (46%, 73%)
Fisher’s exact test). However, this result is influenced by a higher number of caudal
peduncle photographs per whale for males (median 8.0) than for females (median 6.0)
and more caudal peduncle photographic coverage per whale for males (mean 1.9 sides)
than for females (mean 1.7 sides) (Table 19). Males and females did not have
significantly different maximal scarring percentages (males 88%, females 79%) (P =
0.402, two-tailed Fisher’s exact test) or conditional scarring percentages (males 87%,
females 72%) (P = 0.165, two-tailed Fisher’s exact test). The percentage of females with
an ambiguous entanglement history (E-code E2) (24%) was higher than the percentage of
males with an ambiguous entanglement history (6%) and the difference was significant
(P = 0.046, two-tailed Fisher’s exact test).
The two whales with a definite increase in entanglement scarring between years (#351
and #1489) are males.

46
Table 19. Number of caudal peduncle photographs per whale (range, median) and average amount of caudal peduncle photographic coverage per whale by sex for both years combined.
Caudal peduncle photographic coverage
Sex Range Median Mean no. of sidesMales 3 - 23 8.0 1.9
Females 1 - 32 6.0 1.7Unknown sex 1 - 16 4.0 1.7
No. of caudal peduncle photographs per whale
Age
The sample of juveniles with adequate photographic coverage from both years combined
(n = 3) was too small to treat juveniles as a separate age class in statistical analyses so
they were pooled with older whales. All three known-age juveniles were assessed as
having a high likelihood of previous entanglement.
In 2003, the whales with adequate photographic coverage (i.e., E-codes E0 – E4)
consisted of two calves and 70 older whales (Table 20). The small sample of calves in
2003 (n = 2) generated imprecise entanglement scarring percentage estimates (Table 21).
In 2004, the whales with adequate photographic coverage consisted of ten calves and 127
older whales (Table 20). The larger sample of calves in 2004 (n = 10) allowed for greater
precision in the entanglement scarring percentage estimates (Table 21).
For older whales, the minimal, maximal and conditional scarring percentages were not
significantly different between 2003 and 2004 (P = 1, two-tailed Fisher’s exact tests, for
all comparisons); therefore, the data for older whales from both years were pooled (Table
22, 23). For calves, the data from both years were pooled (Table 22, 23) to achieve
sufficient sample sizes for statistical testing of differences in entanglement scarring
percentages by age class.

47
Table 20. Number of whales assigned E-codes E0 – E4 by age class and year.
Age Class Year n E0 E1 E2 E3 E4
Calves 2003 2 1 0 1 0 02004 10 1 3 4 2 0
Older whales 2003 70 0 15 16 37 22004 127 0 27 29 71 0
Table 21. Entanglement scarring percentages by age class and year (95% confidence intervals).
Age Class Year nMinimal Scarring Percentage
Maximal Scarring Percentage n
Conditional Scarring Percentage
Calves 2003 2 0% 50% (1%, 99%) 1 0%2004 10 20% (3%, 56%) 60% (26%, 88%) 10 33% (4%, 78%)
Older whales 2003 70 56% (43%, 68%) 79% (67%, 87%) 54 72% (58%, 84%)2004 127 56% (47%, 65%) 79% (71%, 85%) 127 72% (63%, 81%)
Table 22. Number of whales assigned E-codes E0 – E4 by age class for both years combined.
Age Class n E0 E1 E2 E3 E4Calves 12 2 3 5 2 0
Older whales 168 0 34 42 90 2
Table 23. Entanglement scarring percentages by age class for both years combined (95% confidence intervals).
Age Class nMinimal Scarring Percentage
Maximal Scarring Percentage n
Conditional Scarring Percentage
Calves 12 17% (2%, 48%) 58% (28%, 85%) 7 29% (4%, 71%)Older whales 168 55% (47%, 62%) 80% (73%, 86%) 126 73% (64%, 81%)

48
For both years combined, the minimal scarring percentage of calves (17%) was lower
than that of older whales (55%) and the difference was significant (P = 0.015, two-tailed
Fisher’s exact test). In addition, the conditional scarring percentage of calves (29%) was
lower than that of older whales (73%) and the difference was significant (P = 0.023, two-
tailed Fisher’s exact test). However, these results are influenced by a slightly higher
median number of caudal peduncle photographs per whale for older whales (median 6.0)
than for calves (median 4.5) (Table 24). The average amount of caudal peduncle
photographic coverage per whale was the same for both age classes (mean 1.8 sides)
(Table 24).
Table 24. Number of caudal peduncle photographs per whale (range, median) and average amount of caudal peduncle photographic coverage per whale by age class for both years combined.
Caudal peduncle photographic coverage
Age Class Range Median Mean no. of sidesCalves 2 - 20 4.5 1.8
Older whales 1 - 32 6.0 1.8
No. of caudal peduncle photographs per whale
The maximal scarring percentage of calves (58%) was not significantly different than that
of older whales (80%) (P = 0.137, two-tailed Fisher’s exact test). The percentage of
calves with an ambiguous entanglement history (E-code E2) (42%) was higher than the
percentage of older whales with an ambiguous entanglement history (25%) but the
difference was not significant (P = 0.304, two-tailed Fisher’s exact test).
Location
In 2003, 97% (n = 70) of the whales with adequate photographs were documented in just
one out of the six ADF&G districts and 3% (n = 2) were photographed in more than one
district and were assigned randomly to one district. None of the whales with adequate
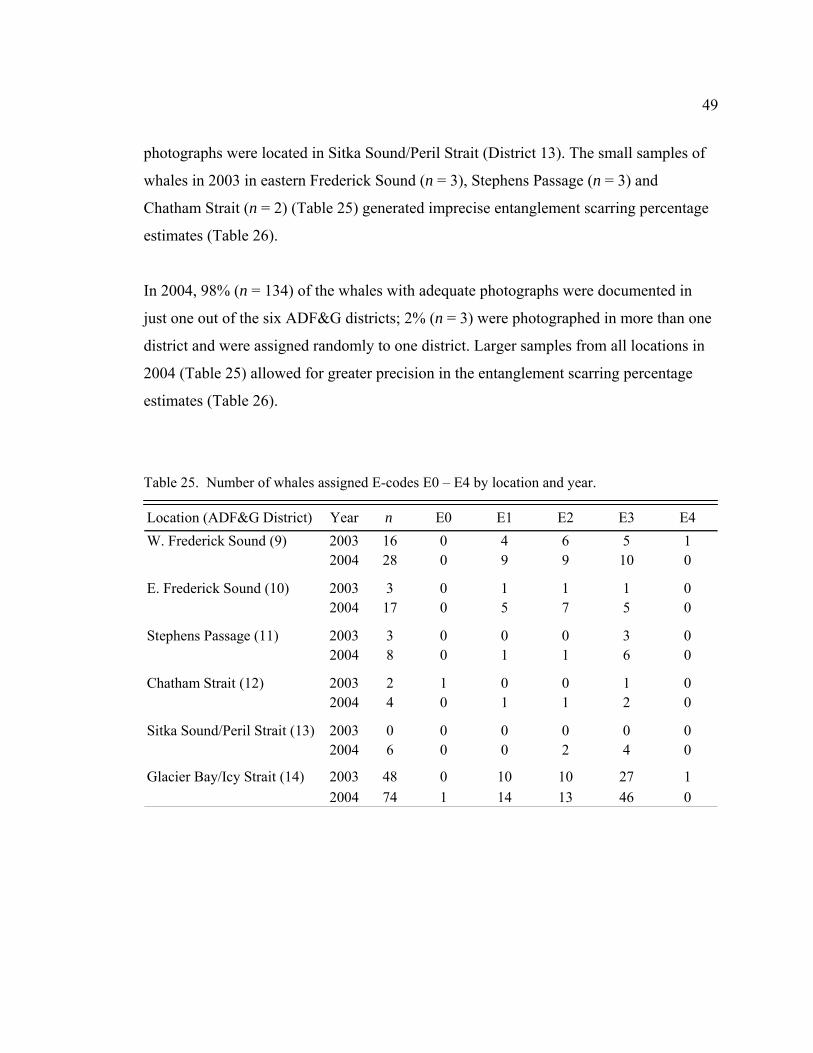
49
photographs were located in Sitka Sound/Peril Strait (District 13). The small samples of
whales in 2003 in eastern Frederick Sound (n = 3), Stephens Passage (n = 3) and
Chatham Strait (n = 2) (Table 25) generated imprecise entanglement scarring percentage
estimates (Table 26).
In 2004, 98% (n = 134) of the whales with adequate photographs were documented in
just one out of the six ADF&G districts; 2% (n = 3) were photographed in more than one
district and were assigned randomly to one district. Larger samples from all locations in
2004 (Table 25) allowed for greater precision in the entanglement scarring percentage
estimates (Table 26).
Table 25. Number of whales assigned E-codes E0 – E4 by location and year. Location (ADF&G District) Year n E0 E1 E2 E3 E4W. Frederick Sound (9) 2003 16 0 4 6 5 1
2004 28 0 9 9 10 0
E. Frederick Sound (10) 2003 3 0 1 1 1 02004 17 0 5 7 5 0
Stephens Passage (11) 2003 3 0 0 0 3 02004 8 0 1 1 6 0
Chatham Strait (12) 2003 2 1 0 0 1 02004 4 0 1 1 2 0
Sitka Sound/Peril Strait (13) 2003 0 0 0 0 0 02004 6 0 0 2 4 0
Glacier Bay/Icy Strait (14) 2003 48 0 10 10 27 12004 74 1 14 13 46 0

50
Table 26. Entanglement scarring percentages by location and year (95% confidence intervals).
Location (ADF&G District) Year nMinimal Scarring Percentage
Maximal Scarring Percentage n
Conditional Scarring Percentage
W. Frederick Sound (9) 2003 16 38% (15%, 65%) 75% (48%, 93%) 10 60% (26%, 88%)2004 28 36% (19%, 56%) 68% (48%, 84%) 19 53% (29%, 76%)
E. Frederick Sound (10) 2003 3 33% (1%, 91%) 67% (9%, 99%) 2 50% (1%, 99%)2004 17 29% (10%, 56%) 71% (44%, 90%) 10 50% (19%, 81%)
Stephens Passage (11) 2003 3 100% (29%, 100%) 100% (29%, 100%) 3 100% (29%, 100%)2004 8 75% (35%, 97%) 88% (47%, 100%) 7 86% (42%, 100%)
Chatham Strait (12) 2003 2 50% (1%, 99%) 50% (1%, 99%) 2 50% (1%, 99%)2004 4 50% (7%, 93%) 75% (19%, 99%) 3 67% (9%, 99%)
Sitka Sound/Peril Strait (13) 2003 0 - - 0 -2004 6 67% (22%, 96%) 100% (54%, 100%) 4 100% (40%, 100%)
Glacier Bay/Icy Strait (14) 2003 48 58% (43%, 72%) 65% (79%, 90%) 38 74% (57%, 87%)2004 74 62% (50%, 73%) 80% (69%, 88%) 61 75% (63%, 86%)
The minimal, maximal and conditional scarring percentages of whales by location were
not significantly different between 2003 and 2004 (Table 27); therefore, the data from
Table 27. Results of two-tailed Fisher’s exact tests comparing entanglement scarring percentages by location between 2003 and 2004.
ComparisonMinimal Scarring Percentage
Maximal Scarring Percentage
Conditional Scarring Percentage
W. Frederick Sound, 2003 vs. 2004 P = 1 P = 0.739 P = 1E. Frederick Sound, 2003 vs. 2004 P = 1 P = 1 P = 1Stephens Passage, 2003 vs. 2004 P = 1 P = 1 P = 1Chatham Strait, 2003 vs. 2004 P = 1 P = 1 P = 1Sitka Sound/Peril Strait, 2003 vs. 2004 n/a n/a n/aGlacier Bay/Icy Strait, 2003 vs. 2004 P = 0.707 P = 1 P = 1

51
both years were pooled (Table 28, 29). For both years combined, whales in Glacier
Bay/Icy Strait and Frederick Sound comprised the majority of the sample (Table 28).
Whales assessed to have had a high likelihood of previous entanglement (E-codes E3 and
E4) were distributed throughout the study area, with the majority located in Glacier
Bay/Icy Strait (Table 28, Fig. 16).
Table 28. Number of whales assigned E-codes E0 – E4 by location of whale for both years combined. Location (ADF&G District) n E0 E1 E2 E3 E4W. Frederick Sound (9) 43 0 13 15 14 1E. Frederick Sound (10) 18 0 5 8 5 0Stephens Passage (11) 11 0 1 1 9 0Chatham Strait (12) 6 1 1 1 3 0Sitka Sound/Peril Strait (13) 6 0 0 2 4 0Glacier Bay/Icy Strait (14) 96 1 17 20 57 1
Table 29. Entanglement scarring percentages by location for both years combined (95% confidence intervals).
Location (ADF&G District) nMinimal Scarring Percentage
Maximal Scarring Percentage n
Conditional Scarring Percentage
W. Frederick Sound (9) 43 35% (21%, 51%) 70% (54%, 83%) 28 54% (34%, 72%)E. Frederick Sound (10) 18 28% (10%, 53%) 72% (47%, 90%) 10 50% (19%, 81%)Stephens Passage (11) 11 82% (48%, 98%) 91% (59%, 100%) 10 90% (55%, 100%)Chatham Strait (12) 6 50% (12%, 88%) 67% (22%, 96%) 5 60% (15%, 95%)Sitka Sound/Peril Strait (13) 6 67% (22%, 96%) 100% (54%, 100%) 4 100% (40%, 100%)Glacier Bay/Icy Strait (14) 96 60% (50%, 70%) 80% (71%, 88%) 76 76% (65%, 85%)
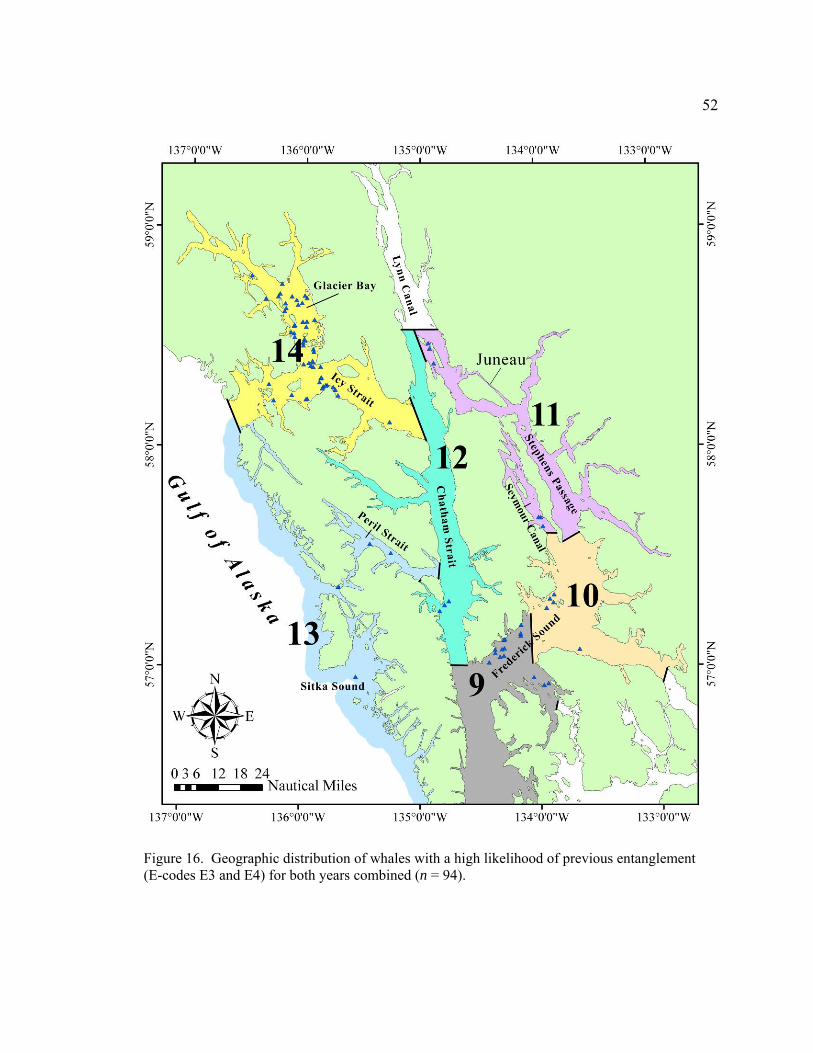
52
Figure 16. Geographic distribution of whales with a high likelihood of previous entanglement (E-codes E3 and E4) for both years combined (n = 94).

53
The minimal scarring percentage of whales in Glacier Bay/Icy Strait (60%) was higher
than the minimal scarring percentages of whales in western Frederick Sound (35%) and
eastern Frederick Sound (28%) and the differences were significant (P = 0.006 and P =
0.018, respectively, two-tailed Fisher’s exact tests). Similarly, the minimal scarring
percentage of whales in Stephen Passage (82%) was higher than the minimal scarring
percentages of whales in western Frederick Sound (35%) and eastern Frederick Sound
(28%) and the differences were significant (P = 0.007 and P = 0.008, respectively, two-
tailed Fisher’s exact tests). None of the other minimal scarring percentages were
significantly different by location for both years combined (Table 30).
Table 30. Results of two-tailed Fisher’s exact tests comparing minimal scarring percentages by location for both years combined.
Location W. FS E. FS SP CS SS/PS GB/ISW. FS -E. FS P = 0.767 -SP P = 0.007* P = 0.008* -CS P = 0.656 P = 0.362 P = 0.280 -SS/PS P = 0.190 P = 0.150 P = 0.584 P = 1 -GB/IS P = 0.006* P = 0.018* P = 0.204 P = 0.682 P = 1 -
Note: W. FS = western Frederick Sound; E. FS = eastern Frederick Sound; SP = Stephens Passage; CS = Chatham Strait; SS/PS = Sitka Sound/Peril Strait; GB/IS = Glacier Bay/Icy Strait * Indicates significant difference at α = 0.05
The conditional scarring percentage of whales in Glacier Bay/Icy Strait (76%) was higher
than the conditional scarring percentage of whales in western Frederick Sound (54%) and
the difference was significant (P = 0.031, two-tailed Fisher’s exact test). None of the
other conditional scarring percentages were significantly different by location for both
years combined (Table 31). None of the maximal scarring percentages were significantly
different by location (Table 32).

54
Table 31. Results of two-tailed Fisher’s exact tests comparing conditional scarring percentages by location for both years combined.
Location W. FS E. FS SP CS SS/PS GB/ISW. FS -E. FS P = 1 -SP P = 0.059 P = 0.141 -CS P = 1 P = 1 P = 0.242 -SS/PS P = 0.128 P = 0.221 P = 1 P = 0.444 -GB/IS P = 0.031* P = 0.123 P = 0.447 P = 0.593 P = 0.570 -
Note: W. FS = western Frederick Sound; E. FS = eastern Frederick Sound; SP = Stephens Passage; CS = Chatham Strait; SS/PS = Sitka Sound/Peril Strait; GB/IS = Glacier Bay/Icy Strait * Indicates significant difference at α = 0.05
Table 32. Results of two-tailed Fisher’s exact tests comparing maximal scarring percentages by location for both years combined.
Location W. FS E. FS SP CS SS/PS GB/ISW. FS -E. FS P = 1 -SP P = 0.253 P = 0.362 -CS P = 1 P = 1 P = 0.515 -SS/PS P = 0.175 P = 0.280 P = 1 P = 0.455 -GB/IS P = 0.186 P = 0.522 P = 0.685 P = 0.340 P = 0.588 -
Note: W. FS = western Frederick Sound; E. FS = eastern Frederick Sound; SP = Stephens Passage; CS = Chatham Strait; SS/PS = Sitka Sound/Peril Strait; GB/IS = Glacier Bay/Icy Strait
The results indicating a higher incidence of entanglement scarring in whales in Glacier
Bay/Icy Strait (and possibly Stephens Passage) than in Frederick Sound are influenced by
differences in the number of caudal peduncle photographs per whale and the amount of
caudal peduncle photographic coverage per whale. For example, the median number of
photographs per whale in Glacier Bay/Icy Strait (8.0) and Stephens Passage (5.0) was
higher than in any other location, including Frederick Sound (4.0), and whales in Glacier
Bay/Icy Strait had the highest amount of caudal peduncle photographic coverage (mean
1.9 sides) of whales in any location (Table 33).

55
Table 33. Number of caudal peduncle photographs per whale (range, median) and average amount of caudal peduncle photographic coverage per whale by location for both years combined.
Caudal peduncle photographic coverage
Location (ADF&G District) Range Median Mean no. of sidesW. Frederick Sound (9) 1 - 10 4.0 1.7E. Frederick Sound (10) 1 - 10 4.0 1.5Stephens Passage (11) 1 - 8 5.0 1.7Chatham Strait (12) 1 - 9 4.0 1.4Sitka Sound/Peril Strait (13) 1 - 9 2.5 1.5Glacier Bay/Icy Strait (14) 1 - 32 8.0 1.9
No. of caudal peduncle photographs per whale
Commercial fisheries in northern SEAK
Commercial fishing occurs in all months of the year in northern SEAK, with the greatest
number of fisheries open between June and October in the six ADF&G Districts that
overlap with the study area (Fig. 17, Appendix 2). The extent of fishing in each fishery is
highly variable between districts (Fig. 18), with some fisheries occurring in just one
district (e.g., the traditional common property drift gillnet fishery for salmon in District
11) and others widely dispersed over all six districts (e.g., the Dungeness crab pot
fishery).
In each fishery there are specific areas within a district where fishing activity is
concentrated on the main fishing grounds (Appendix 2). Overall, there are fewer pot
fisheries and more longlining for halibut in District 13 (Sitka Sound/Peril Strait) than in
the other districts (Fig. 18). District 9 (western Frederick Sound) accounts for 33% of the
Dungeness crab harvested from Districts 9 – 14 (Fig. 18) and this fishery occurs for an
extended period when humpback whales are generally present (Fig. 17). A unique feature
that District 11 (Stephens Passage) and District 14 (Glacier Bay/Icy Strait) share is a high
level of fishing effort for Tanner crab; together, these two districts account for the
majority (79%) of the Tanner crab harvested from Districts 9 – 14 (Fig. 18). However,
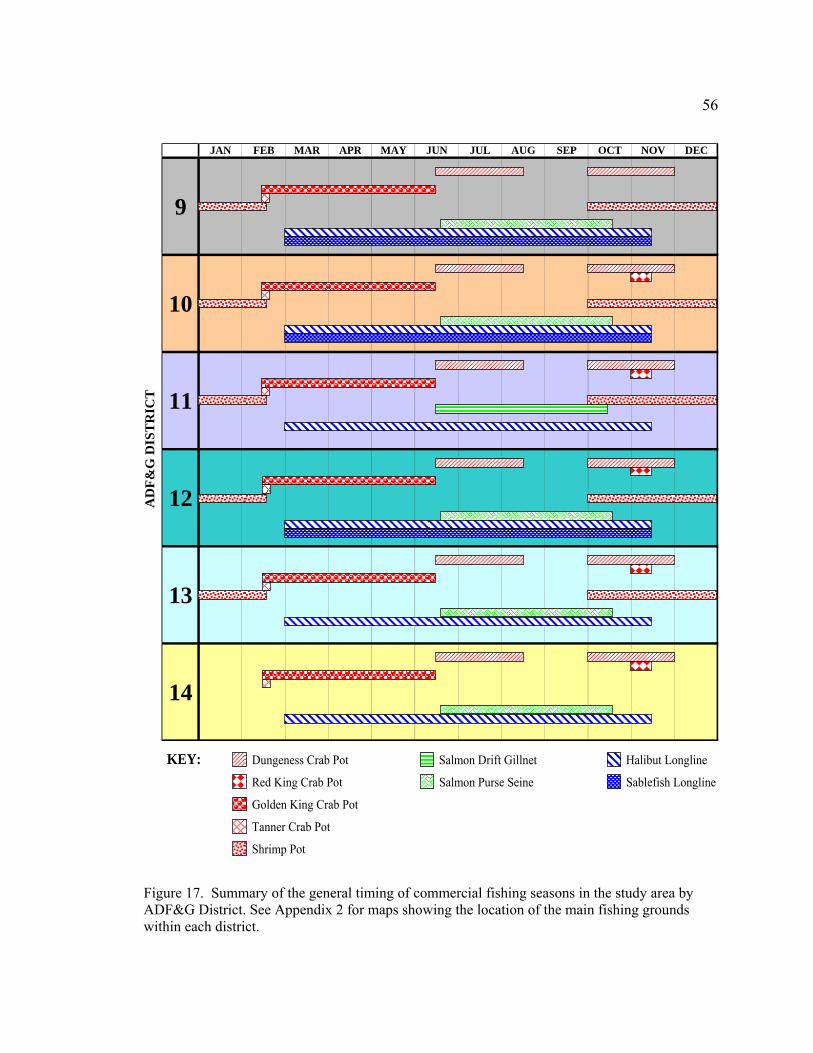
56
JAN FEB MAR APR MAY JUN JUL AUG SEP OCT NOV DEC
9
10
11
12
13
14
AD
F&G
DIS
TR
ICT
KEY: Dungeness Crab Pot Salmon Drift Gillnet Halibut Longline
Red King Crab Pot Salmon Purse Seine Sablefish Longline
Golden King Crab Pot
Tanner Crab Pot
Shrimp Pot Figure 17. Summary of the general timing of commercial fishing seasons in the study area by ADF&G District. See Appendix 2 for maps showing the location of the main fishing grounds within each district.

57
0%
20%
40%
60%
80%
100%
9 10 11 12 13 14
ADF&G District
% o
f Tot
al H
arve
st in
AD
F&G
Dis
tric
ts 9
- 14
KEY: Dungeness Crab Pot Salmon Drift Gillnet Halibut Longline
Red King Crab Pot Salmon Purse Seine Sablefish Longline
Golden King Crab Pot
Tanner Crab Pot
Shrimp Pot Figure 18. Percentage of total harvest (lb) in ADF&G Districts 9 – 14 for each fishery.
the Tanner crab fishery is only open for a few days in mid-February (Fig. 17), a time of
year when few humpback whales are in northern SEAK, so interactions with this fishery
alone are unlikely to account for the observed high entanglement scarring percentages in
these two districts (Table 29). Districts 9 and 12 account for 97% of the sablefish longline
harvested from Districts 9 – 14 and this fishery occurs during months when humpback
whales are common (March – November). Districts 10 and 11 account for 84% of the red
king crab harvested from Districts 9 – 14 (Fig. 18) but this fishery is only open for a short
period in early to mid-November (Fig. 17). However, humpback whales are not
uncommon in November, particularly in Seymour Canal (District 11) (Straley 1994),

58
where some of the main red king crab fishing grounds are located (Appendix 2). Since
1999, Glacier Bay (District 14) has been closed to most commercial fishing (except
Tanner crab fishing and longlining for halibut) (Appendix 2) which partially explains the
relatively low harvest levels in District 14 compared to the other districts.
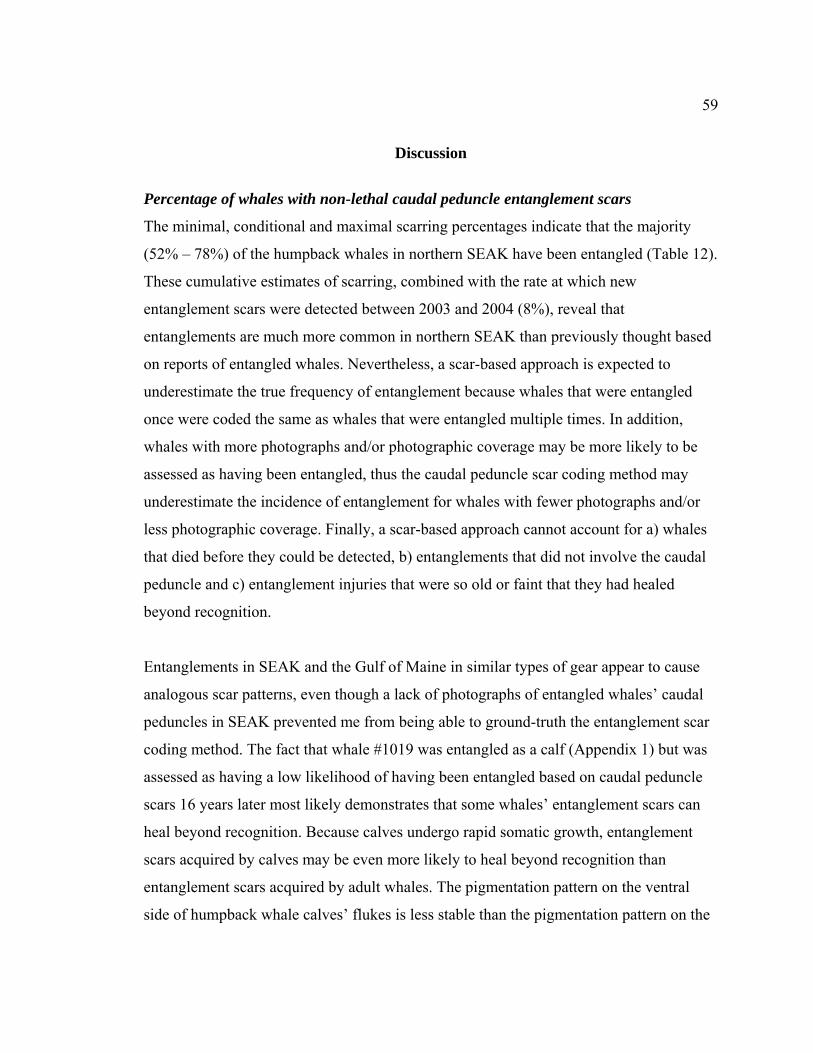
59
Discussion
Percentage of whales with non-lethal caudal peduncle entanglement scars
The minimal, conditional and maximal scarring percentages indicate that the majority
(52% – 78%) of the humpback whales in northern SEAK have been entangled (Table 12).
These cumulative estimates of scarring, combined with the rate at which new
entanglement scars were detected between 2003 and 2004 (8%), reveal that
entanglements are much more common in northern SEAK than previously thought based
on reports of entangled whales. Nevertheless, a scar-based approach is expected to
underestimate the true frequency of entanglement because whales that were entangled
once were coded the same as whales that were entangled multiple times. In addition,
whales with more photographs and/or photographic coverage may be more likely to be
assessed as having been entangled, thus the caudal peduncle scar coding method may
underestimate the incidence of entanglement for whales with fewer photographs and/or
less photographic coverage. Finally, a scar-based approach cannot account for a) whales
that died before they could be detected, b) entanglements that did not involve the caudal
peduncle and c) entanglement injuries that were so old or faint that they had healed
beyond recognition.
Entanglements in SEAK and the Gulf of Maine in similar types of gear appear to cause
analogous scar patterns, even though a lack of photographs of entangled whales’ caudal
peduncles in SEAK prevented me from being able to ground-truth the entanglement scar
coding method. The fact that whale #1019 was entangled as a calf (Appendix 1) but was
assessed as having a low likelihood of having been entangled based on caudal peduncle
scars 16 years later most likely demonstrates that some whales’ entanglement scars can
heal beyond recognition. Because calves undergo rapid somatic growth, entanglement
scars acquired by calves may be even more likely to heal beyond recognition than
entanglement scars acquired by adult whales. The pigmentation pattern on the ventral
side of humpback whale calves’ flukes is less stable than the pigmentation pattern on the

60
ventral side of older whales’ flukes (Carlson et al. 1990), so scarring patterns on calves’
caudal peduncles might be similarly unstable. This hypothesis could be tested by
collecting a time series of caudal peduncle photographs of calves and adults with
documented caudal peduncle entanglements. Additional caudal peduncle photographs of
the calf disentangled in Frederick Sound in 2004 (Fig. 2, 10) would contribute to such a
dataset.
The minimal scarring percentages in northern SEAK in 2003 (54%) and 2004 (53%)
(Table 12) are similar to the minimal scarring percentages documented in recent years for
humpback whales in the Gulf of Maine (1997, 55%; 1998, 48%; 1999, 65%) (Robbins
and Mattila 2001), but much higher than the minimal scarring percentage documented for
humpback whales in Hawaii in 2002 (14%) (Robbins and Mattila 2004). The median
number of caudal peduncle photographs per individual whale in the Hawaii study is
unknown, but if it was low, this could have contributed to the lower minimal scarring
percentage documented there. Another explanation for the lower value in Hawaii is that
Hawaii has a seasonal aggregation of whales from multiple feeding grounds with
different levels of fisheries interactions. The high percentage of whales with
entanglement scarring migrating to Hawaii from northern SEAK could have been diluted
by lower percentages of whales with entanglement scarring migrating to Hawaii from
other North Pacific feeding grounds. If whales from some feeding areas have a lower
frequency of entanglement scarring, this could mean that they experience fewer
entanglements overall, or it could mean that they are entangled fatally more often. Caudal
peduncle photographs of humpback whales on feeding grounds across the North Pacific
were collected in 2004 and 2005 by researchers participating in the international
humpback whale research program, Structure of Populations, Levels of Abundance and
Status of Humpbacks (SPLASH) (www.cascadiaresearch.org/SPLASH/splash.htm).
These data will be used to determine if entanglement scarring percentages are
significantly different between various humpback whale feeding grounds in the North
Pacific, allowing a test of this hypothesis. It is not known if entanglement scar tissues

61
heal at comparable rates in different populations of humpback whales. Although there is
no reason to believe that they would not, if they did heal at different rates this would
confound any comparisons of scarring percentages for whales from different populations.
Conditional and maximal scarring percentages were not calculated in caudal peduncle
entanglement scar studies in the Gulf of Maine or Hawaii. However, based on data
collected annually in the Gulf of Maine between 1997 and 1999 and presented by
Robbins and Mattila (2001), I calculated the Gulf of Maine conditional scarring
percentages (1997, 84%; 1998, 68%; 1999, 85%) and maximal scarring percentages
(1997, 89%; 1998, 78%; 1999, 88%). These percentages are similar to the conditional
and maximal scarring percentages calculated for humpback whales in northern SEAK
(Table 12).
The proportion of ambiguously scarred whales in northern SEAK (24%) is comparable to
what has been documented on average in the Gulf of Maine (28%) (Robbins and Mattila
2001). Whales with an ambiguous entanglement history (E-code E2) likely represent
animals that have experienced less severe entanglements, animals with entanglement
wounds that have healed partially and/or animals with wounds from other sources.
Presenting a range of entanglement scarring percentages (e.g., minimal, conditional and
maximal) allows readers to decide which value they believe is closest to the true
percentage of non-lethally entangled whales, depending on how they view whales with an
ambiguous entanglement history.
Recommended estimate
The results from this study indicate that the conditional scarring percentage (71%), which
excludes whales with ambiguous scars (E-code E2), is the most defensible of the three
scarring estimates. Difficulties associated with coding E2 whales (as revealed by
comparing E-codes with Robbins), combined with E2 whales’ ambiguous entanglement
histories (by definition) are compelling reasons to use the conditional approach. In

62
addition, the conditional scarring percentage appears to be more robust than the minimal
scarring percentage to variation in the amount of photographic coverage of the caudal
peduncle (i.e., one side vs. both sides). The conditional scarring percentage is also more
robust than the minimal scarring percentage to variation in the number of whales
assigned E-code E2 (ambiguous entanglement history) vs. E-code E3 (high likelihood of
previous entanglement). Finally, the conditional scarring percentage is more robust than
the maximal scarring percentage to variation in the number of whales assigned E-code E2
(ambiguous entanglement history) vs. E-code E1 (low likelihood of previous
entanglement).
One limitation against using the conditional approach is that it results in smaller sample
sizes (and wider confidence intervals), but that outcome in this study was
inconsequential. In addition, the conditional scarring percentage appears to be less robust
to variation in the number of caudal peduncle photographs per individual whale (less than
10 photographs vs. 10 or more photographs) than the maximal scarring percentage.
Annual rate of entanglement scar acquisition
Minimal, conditional and maximal scarring percentage estimates offer insight into the
cumulative number of animals in a population that have been entangled. However,
measuring the number of whales that acquire new entanglement scars over a specific
period of time is a more sensitive indicator of the magnitude of the entanglement
problem, especially given the long-term stability of some caudal peduncle entanglement
scars (Appendix 1; Robbins and Mattila 2001, 2004), the potential for others to heal
beyond recognition (e.g., whale #1019 (Appendix 1)) and the fact that whales may be
entangled multiple times (e.g., whale #351 (Fig. 15); whale #1018 (Appendix 1)). Eight
percent of the whales in Glacier Bay and Icy Strait were estimated to have acquired new
entanglement scars between 2003 and 2004, although this estimate is highly uncertain
(95% CI: 1%, 25%). Similar rates of annual entanglement scar acquisition were found in
the Gulf of Maine from 1997 through 2002 (8% – 25%) (Robbins and Mattila 2004).

63
Clearly, more whales are being entangled (and self-releasing from gear) in northern
SEAK than are reported currently to the NOAA Fisheries Alaska Regional Office.
Overall, the entanglement scarring percentages revealed by this study indicate that the
majority of humpback whales in northern SEAK have been entangled at some point in
their lives and that most apparently shed the gear on their own, unless whales are being
disentangled by humans much more often than is reported. Observations of humpback
whales and other cetaceans immediately following entanglement in fishing gear indicate
that high energy behaviors such as thrashing, shaking, rolling and breaching are common
(Mann et al. 1995; Weinrich 1999). Depending on the nature of the entanglement, these
behaviors may result in entangled animals successfully shedding the entangling gear by
shaking it loose and/or breaking the material so that it falls off. In August 2005, a
humpback whale was observed as it became entangled around the caudal peduncle in a
shrimp pot line near Sitka, Alaska, but after 3 – 4 minutes of breaching and rapid
swimming the whale broke free of the gear.23 It is not known if an entanglement of such
short duration would produce diagnostic caudal peduncle entanglement scarring (no
photographs were taken) but this incident clearly demonstrates that some humpback
whales are sometimes capable of self-releasing without human intervention.
The reporting rate of entanglements in northern SEAK could not be calculated due to a
lack of photographic identifications of entangled whales in this region. The entangled calf
in Figures 2 and 10 is the only animal out of 13 whales reported entangled in SEAK in
2003 and 2004 that was photographically identified. If more whales that were reported
entangled in SEAK had been photographically identified, then it would have been
possible to compare their identities with the identities of the whales that were assessed to
have been entangled based on an increase in scarring, and thus estimate the reporting rate
of entanglements to NOAA Fisheries. For instance, if 10 individually identified whales
gained new entanglement scarring between 2003 and 2004, but only one of these 10
23 Personal communication from Barth Hamberg, 206 Shotgun Alley, Sitka, AK 99835, August 2005.

64
whales was reported to be entangled, then this would equate to a reporting rate of 10%.
(Note that calculating the reporting rate hinges on photographically identifying the
whales that are reported entangled so that their records can be linked with the
entanglement scar data.) In this study, the small sample size of whales with an increase
in scarring between years (n = 2) would have generated an imprecise estimate of the
reporting rate in northern SEAK. Increased efforts to photographically identify entangled
whales in SEAK, combined with continued efforts to use caudal peduncle scarring to
detect whales that have been entangled over a specific time period, are needed in order to
generate an estimate of the reporting rate of entanglements in northern SEAK.
Continuing and expanding efforts to measure the annual rate of entanglement scar
acquisition in SEAK offers a systematic way to monitor entanglements in this region. In
the event that management initiatives are implemented with the aim of preventing
entanglements (e.g., reducing the amount of gear in the water column), the annual rate of
entanglement scar acquisition might be an indicator of success; presumably the rate
would decrease if prevention is effective. If management initiatives are implemented with
the aim of simply reducing the severity of entanglements (e.g., gear modifications such as
weak links in fishing lines and/or nets), the annual rate of entanglement scar acquisition
may not decrease (Knowlton et al. 2005), because even entanglements that last for less
than a day can produce diagnostic, persistent scarring (Robbins and Mattila 2004). In
fact, the annual rate of entanglement scar acquisition may even increase if whales that
previously would have died from entanglements survive to be photographed.
Humpback whales off Newfoundland and Labrador were rarely documented becoming
entangled more than once (Lien 1994) but photographs from this study (e.g., whale #351
(Fig. 25)) and the GBNPP archives (e.g., whale #1018 (Appendix 1)) demonstrate that at
least some humpback whales in northern SEAK have been entangled multiple times. In a
scar-based study of North Atlantic right whales, the number of entanglements per
individual (n = 447) ranged from zero to six (mean = 1.4 entanglements per animal)

65
(Knowlton et al. 2005). It is not known if entanglements are caused by whales
accidentally colliding with gear and/or by whales actively seeking out and investigating
gear in their environment. If the former is true, some whales may be at greater risk of
multiple entanglements than others if they spend more time in areas with greater
quantities of fishing gear or if they have some behavioral or sensory deficit that makes it
more difficult for them to detect gear. Alternatively, if some whales are more inquisitive
and likely to investigate gear than others, this could explain why some whales get
entangled multiple times, others get entangled once and some never get entangled.
Humpback whales of all ages have been observed rolling and twisting in beds of kelp,
often draping the strands of kelp across different body parts.24,25
Identification of vulnerable segments of the population
Sex
The minimal scarring percentages from this study indicate that male humpback whales
may be more likely to become non-lethally entangled than female humpback whales
(Table 18). Between 1997 and 1999, Robbins and Mattila (2001) also documented a
significantly higher percentage of male humpback whales with entanglement scarring
compared to females. However, based on recent data they no longer believe that males
are more likely to be entangled than females (Robbins and Mattila 2004). They speculate
that the distribution of high-risk fishing gear in the Gulf of Maine and/or the geographic
foraging patterns of female whales have changed in recent years such that now nearly
equal percentages of males and females have entanglement scars (Robbins and Mattila
2004). Knowlton et al. (2005) found no significant differences by sex in the number of
North Atlantic right whales with entanglement scars from 1980 through 2002.
24 Personal communication from Jan Straley, University of Alaska Southeast, 1332 Seward Ave. Sitka,
AK 99835, March 2006. 25 GBNPP unpublished data.

66
It is unknown why male humpback whales in northern SEAK would have a higher
minimal entanglement percentage than females. The fact that males’ and females’
maximal and conditional scarring percentages were not significantly different indicates
that the difference in minimal scarring percentages is attributable to differences in the
number of whales of each sex with an ambiguous entanglement history. Thus, the higher
proportion of females than males that were assessed to have an ambiguous entanglement
history (females 24%; males 6%) explains the observed difference in minimal scarring
percentages. The scarring percentage estimates based on sex may also have been
influenced by differences in the number of caudal peduncle photographs that were
available for males and females (Table 19). It is unknown why the median number of
caudal peduncle photographs was higher for males than for females in both years. It was
assumed that all whales had an equal chance of being photographed, but there may have
been behavioral differences between males and females that made it easier to obtain
caudal peduncle photographs of males. For example, many females with calves were
present in the study area in 2004 and it is possible that these females were less likely to
tolerate close approaches by the survey vessel due to the presence of their calves.
It seems unlikely that my interpretation of caudal peduncle scars on male humpback
whales was confounded by breeding ground injuries. Robbins and Mattila (2004)
investigated this possibility and concluded that caudal peduncle scars from breeding
ground injuries are unique and unlikely to be confused with entanglement scars. While a
specific study of age-sex segregation of humpback whales in SEAK has not been
conducted, there are no indications that male and female humpback whales select
different habitats in SEAK26,27 where the distribution of fishing gear may pose different
levels of risk. However, differences between the sexes in the timing of migration
(Gabriele 1992; Craig et al. 2003) could potentially expose males to more opportunities
26 Personal communication from Christine Gabriele, GBNPP, PO Box 140, Gustavus, AK 99826,
November 2005. 27 Unpublished data, J. Straley Investigations, PO Box 273, Sitka, AK 99835.

67
for fisheries interactions throughout their annual range. Another possible explanation is
that males may be more inquisitive and likely to investigate gear that they encounter than
females (e.g., Harris and Knowlton 2001). Male-biased mortality among nonhuman
mammals has often been explained in terms of more risky behaviors by males compared
with females, but generally these risky behaviors are associated with competition for
females (Owens 2002), making this an unlikely explanation for the difference in minimal
scarring percentages that I observed.
The reason why more females than males were assessed to have an ambiguous
entanglement history (E-code E2) is unclear. If whales assigned E-code E2 represent
whales with entanglement scars that have healed beyond recognition, then perhaps male
humpback whales “fight” entangling gear more intensely than females, which could
produce more severe injuries that are less likely to heal into ambiguous E2-type
patterns. Alternatively, if female humpback whales live longer on average than male
humpback whales (a pattern documented in many mammalian species (Owens 2002)),
then the higher proportion of ambiguous marks on females could be explained by females
having a greater chance than males of living long enough to have their entanglement
scars heal beyond recognition. Average and maximum life expectancies in humpback
whales are poorly understood (Clapham and Mead 1999), making it difficult to determine
if this is a contributing factor.
Age
The minimal and conditional scarring percentages suggest that non-lethal entanglement
scarring is significantly less common in calves than in older whales (Table 23). It is
unlikely that these results were affected by differences in the number of caudal peduncle
photographs obtained per whale in each age group because the median number of
photographs and amount of photographic coverage were similar between groups (Table
24). A lower incidence of scarring in calves is expected because calves had less time to
accumulate entanglement scarring than adults. However, the minimal scarring percentage

68
of calves in northern SEAK (17%) was higher than in the Gulf of Maine, where only 9%
of calves were assessed to have been entangled (Robbins and Mattila 2001), but this is
not a significant difference. Continued sampling of calves in SEAK would elucidate if the
scarring percentages found during this study are typical.
Juvenile humpback whales in the western north Atlantic (Lien 1994; Robbins and Mattila
2001), juvenile North Atlantic right whales (Knowlton et al. 2005), juvenile gray whales
(Heyning and Lewis 1990) and juvenile northern fur seals (Fowler 1985) appear to have
significantly higher rates of entanglement than older animals. In this study, the sample
size of juveniles (n = 3) was too small to estimate the entanglement scarring percentage.
It would be useful to sample more juvenile whales to determine if whales in this age
classes are at a higher risk of non-lethal entanglement than whales in other age classes.
It is thought that calves and juveniles probably have a higher mortality rate from
entanglements than adult whales because 1) they are growing, so gear is more likely to
become embedded, which may lead to lethal infections and/or restricted circulation, and
2) calves and juveniles may not have the strength necessary to break free from entangling
gear due to their smaller size (Knowlton et al. 2005). If younger animals have a higher
mortality rate from entanglements than older animals, this could explain the low
incidence of calves bearing entanglement scars in SEAK because a disproportionate
number of the calves could have died as a result of being entangled. Humpback whale
calves off the Pacific coast of Colombia were significantly more likely to be found dead
from entanglement than adults (Capella Alzueta et al. 2001). Between 1979 and 1995, the
estimated calf mortality rate in the CNP stock was 15% – 24% but the causes of most of
these mortalities are unknown (Gabriele et al. 2001).
Location
The analysis of scarring percentages by whale location suggests that whales in Stephens
Passage and Glacier Bay/Icy Strait may be at a higher risk of entanglement than whales

69
in Frederick Sound (Table 29). These results were likely to have been influenced by
differences in the number of caudal peduncle photographs available for whales in
different locations, in particular the anomalously high number of photographs available
for whales in Glacier Bay/Icy Strait (Table 33).
The ADF&G District where a whale with entanglement scarring was photographed does
not mean that this is the location where the whale was entangled. There is no way to
know where a whale is entangled unless it is photographically identified at the time it
becomes entangled. The high proportion of whales that were documented in only one
district supports previous research indicating that the majority of humpback whales in
northern SEAK exhibit a high degree of site fidelity to specific local feeding areas
(Straley et al. 2002). Assuming that most entanglements occur in SEAK (not during the
migration and/or on the breeding grounds), the tendency for whales to spend time in the
same localized areas in northern SEAK each year means that it may not be unreasonable
to draw inferences about where a whale became entangled based on where the whale was
sampled in this study.
Identifying where entanglements are occurring could help identify which commercial,
sport and/or subsistence fisheries are problematic and could lead to management
strategies to reduce the risk of entanglement. One approach that could be useful would be
to compare caudal peduncle photographs of individual whales on the breeding grounds
with caudal peduncle photographs of the same whales taken within the same year on the
feeding grounds. For whales that gain new entanglement scarring, these comparisons
could reveal where the whale was when it acquired the new scars (e.g., Hawaii or
Alaska), and therefore might help pinpoint which fishery was involved in the
entanglement. The caudal peduncle photographs collected as part of the SPLASH
program could be used to investigate this question if sample sizes of photographs of the
same individual whales from both the breeding and feeding grounds are sufficient.
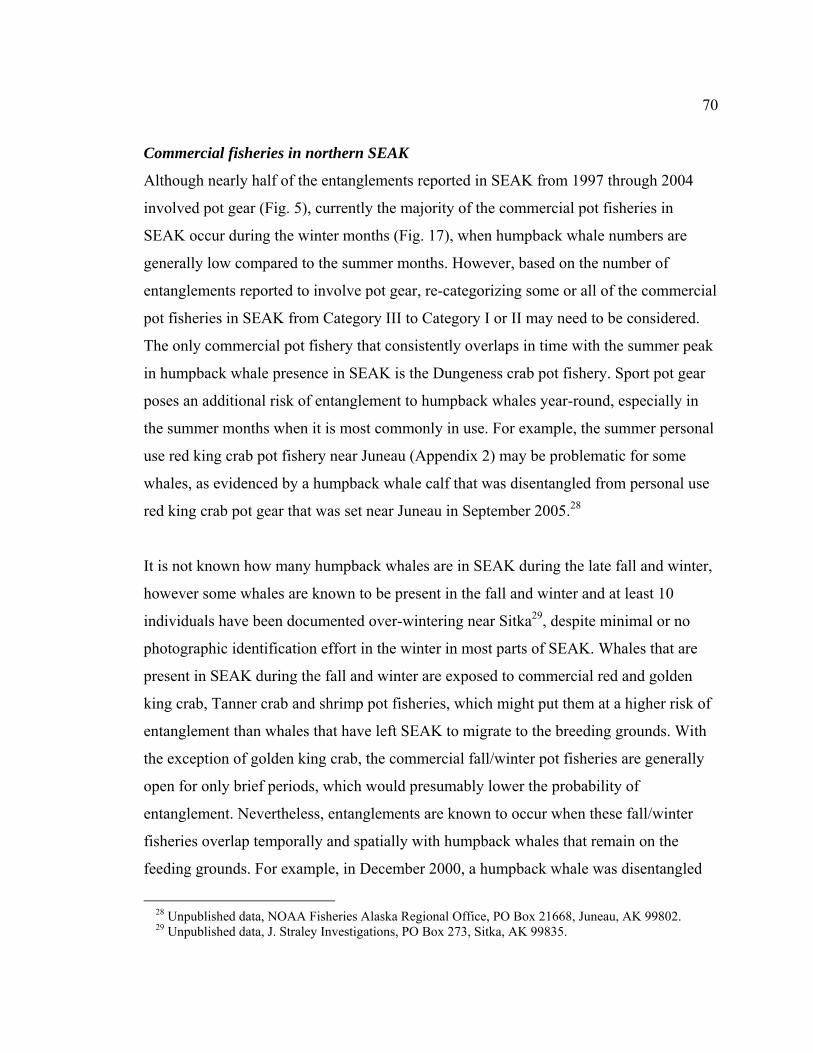
70
Commercial fisheries in northern SEAK
Although nearly half of the entanglements reported in SEAK from 1997 through 2004
involved pot gear (Fig. 5), currently the majority of the commercial pot fisheries in
SEAK occur during the winter months (Fig. 17), when humpback whale numbers are
generally low compared to the summer months. However, based on the number of
entanglements reported to involve pot gear, re-categorizing some or all of the commercial
pot fisheries in SEAK from Category III to Category I or II may need to be considered.
The only commercial pot fishery that consistently overlaps in time with the summer peak
in humpback whale presence in SEAK is the Dungeness crab pot fishery. Sport pot gear
poses an additional risk of entanglement to humpback whales year-round, especially in
the summer months when it is most commonly in use. For example, the summer personal
use red king crab pot fishery near Juneau (Appendix 2) may be problematic for some
whales, as evidenced by a humpback whale calf that was disentangled from personal use
red king crab pot gear that was set near Juneau in September 2005.28
It is not known how many humpback whales are in SEAK during the late fall and winter,
however some whales are known to be present in the fall and winter and at least 10
individuals have been documented over-wintering near Sitka29, despite minimal or no
photographic identification effort in the winter in most parts of SEAK. Whales that are
present in SEAK during the fall and winter are exposed to commercial red and golden
king crab, Tanner crab and shrimp pot fisheries, which might put them at a higher risk of
entanglement than whales that have left SEAK to migrate to the breeding grounds. With
the exception of golden king crab, the commercial fall/winter pot fisheries are generally
open for only brief periods, which would presumably lower the probability of
entanglement. Nevertheless, entanglements are known to occur when these fall/winter
fisheries overlap temporally and spatially with humpback whales that remain on the
feeding grounds. For example, in December 2000, a humpback whale was disentangled
28 Unpublished data, NOAA Fisheries Alaska Regional Office, PO Box 21668, Juneau, AK 99802. 29 Unpublished data, J. Straley Investigations, PO Box 273, Sitka, AK 99835.

71
from a commercial shrimp pot longline after becoming anchored at the surface by the
gear near Skagway, Alaska.30
This study highlights the need for better data describing the distribution and amount of
commercial (as well as sport and subsistence) fishing gear in SEAK. Harvest data were
used in the current analysis as a proxy for fishing effort (i.e., amount of gear in the water)
because they were the only data available. This information gap is not unique to SEAK; it
has been identified in many investigations of cetacean entanglement throughout the world
(Lien 1994; Harwood 1999; Lewison et al. 2004; Johnson et al. 2005; Knowlton et al.
2005). Describing the distribution of fishing effort in other parts of SEAK humpback
whales’ known annual range (i.e., Hawaii, northern British Columbia and the high seas of
the Central North Pacific) was beyond the scope of this study, but these data are needed
to fully understand the relative levels of risk that humpback whales face from fisheries
interactions throughout the year.
It is difficult to make generalizations about the distribution and amount of commercial
fishing effort in northern SEAK because of the variation in gear types, fishing grounds
and open seasons for each fishery. The synthesis of commercial fishing effort on the basis
of ADF&G Districts (Fig. 17, 18) was largely inconclusive and revealed few plausible
explanations for the observed differences in entanglement scarring percentages between
districts. The drift gillnet fishery in District 11 (Stephens Passage) could have contributed
to the high percentage of whales there with entanglement scars (Table 29), but this
relationship is only circumstantial without additional evidence. The difficulty of
correlating fishery harvest levels with the entanglement scar results is highlighted by the
fact that harvest levels in Glacier Bay/Icy Strait (District 14) are relatively low (Fig. 18)
but the percentage of whales with entanglement scars there is relatively high (Table 29).
For most commercial fisheries, harvest data are available at a finer geographic scale than
the units used in this study (e.g., ADF&G sub-districts), however it was beyond the scope
30 Unpublished data, NOAA Fisheries Alaska Regional Office, PO Box 21668, Juneau, AK 99802.

72
of this study to conduct a more detailed analysis of the complex temporal and spatial
patterns in commercial fishing activity in northern SEAK.
Given the longterm stability of caudal peduncle entanglement scars, the current
distribution and types of commercial fishing gear in SEAK are unlikely to reflect the
distribution and types of fishing gear in SEAK at the time many of the scarred whales
became entangled. For instance, the distribution of gear in Glacier Bay has changed
substantially since many of the commercial fisheries there were closed in 1999
(Appendix 2). In general, it appears that the level of risk posed to whales by commercial
fishing gear in SEAK may have been higher in the mid to late 20th century compared to
today because many fisheries were open for longer seasons (if not year-round), with
fewer restrictions on the amount or type of gear that could be fished (Appendix 2).
However, some fisheries may pose a greater risk to whales today than they did
historically. For example, with the implementation of halibut and sablefish IFQs in 1995
(Appendix 2), the temporal and spatial distribution of longline gear in SEAK changed
dramatically, resulting in a much longer period of time in which whales are exposed to
the gear than before 1995. On the other hand, a slower-paced fishery dispersed in time
and space may pose less risk.
While the specific circumstances that led to most past entanglements will never be
known, a description of the current distribution of commercial, subsistence and sport
fishing gear in SEAK which overlaps with areas of high whale numbers seasonally would
increase managers’ understanding of sources of current potential threats to this
population on a regional scale and could help inform management actions aimed at
preventing entanglements. This approach would entail identifying areas where humpback
whales regularly concentrate in SEAK and examining how these areas overlap with
fishing “hotspots” to identify areas that may warrant monitoring and/or special
protection.

73
Although it is beyond the scope of this study to make fishery management
recommendations, it would be useful to work with commercial, sport and subsistence
fishermen to ground-truth the data describing how often different fishing gear types are
involved in humpback whale entanglements in Alaska (Fig. 5). Developing ways for
fishermen to report entanglements without fear of retribution are needed to encourage
reporting. Another strategy would be to require participants in each fishery to use
uniquely colored line that would allow for identification of the gear types involved in
entanglements. Also, placing observers on vessels engaged in Category II fisheries in
SEAK (i.e., drift gillnet and purse seine vessels) would help ground-truth the relatively
low rate of reported entanglements that involve these gear types. Further investigation
would be necessary to determine if these measures are feasible.
Fishing gear modifications
Researchers and managers working to reduce right and humpback whale entanglements
in the western North Atlantic have identified several fishing practices that have the
potential to reduce the frequency and/or severity of entanglements (Johnson et al.
2005).31 Their primary recommendation is to reduce the amount of vertical line in the
water column, because having less line and/or slack in the water column presumably
reduces the chance that a whale will become entangled. One way to accomplish this
would be to replace some floating line with sinking line. Unlike sinking line, the slack in
a floating line floats in the water column instead of resting on the ocean floor, posing a
potential threat of entanglement to a whale. In recent years, participants in the New
England lobster pot and sink gillnet fisheries have reduced the amount of floating line
they use by replacing portions of it with sinking line to reduce the risk of entanglement to
whales (Kozuck 2003). It remains to be seen if this action results in a reduction in
entanglements. In SEAK, commercial Dungeness crab pot and longline fishermen
typically do not use floating line. However, floating line is used on commercial red king
31 NOAA Fisheries and Marine Mammal Commission Gear Workshop, North Falmouth, MA. October
13 – 15, 2004.

74
crab, golden king crab, Tanner crab and shrimp pots, as well as sport crab and shrimp
pots (Appendix 2). Encouraging these commercial and sport pot fishermen to use sinking
line instead may be one way to reduce the risk of entanglement for humpback whales in
SEAK.
Lost fishing gear
Lost fishing gear likely poses an additional risk of entanglement to humpback whales, but
the quantity and rate of gear losses in SEAK are unknown. Losses may occur for many
reasons, including weather, vessel propellers cutting surface buoy lines, vandalism,
human error and gear failure (Laist 1996). If a surface buoy line is cut and it is sinking
line, presumably the gear sinks to the bottom and poses less of a threat to humpback
whales than it would in the water column. But if the surface buoy line is floating line or
the gear drifts into deeper water, then the gear may still be vertical in the water column,
presumably continuing to pose a risk of entanglement. No systematic efforts exist to
quantify the rate of pot loss in SEAK.32 Surveys from other areas in the United States and
Canada indicate that 10% – 30% of the commercial pots used annually are lost (Laist
1996). Pot-loss rates are thought to be significantly lower in SEAK because of the pot
limits imposed on the commercial fisheries and because the fishing grounds in SEAK
tend to be in waters more protected from storms than the fishing grounds where the other
estimates originated.33 One commercial Dungeness crab fishermen in northern SEAK
estimated that he loses approximately 8% –13% of his pots each year for various
reasons.34 Pot-loss rates are reportedly similar in the commercial golden king crab
fishery (approximately 10%), and minimal in the commercial red king crab fishery,
presumably due to the short length of the season.35 The IPHC uses logbook data to
32 Personal communication from Gretchen Bishop, ADF&G Commercial Fisheries Division, 802 Third
St, Douglas, AK 99824, October 2005. 33 Ibid. 34 Personal communication from Gene Farley, commercial fisherman, PO Box 182, Gustavus, AK 99826,
November 2005. 35 Personal communication from Richard Gregg, commercial fisherman, PO Box 20669, Juneau, AK
99802, November 2005.

75
estimate the number of halibut longline skates that are lost or abandoned annually; one
halibut fishermen in northern SEAK estimated that he loses approximately 1 – 2 skates
per year.36 No systematic efforts exist to quantify the rate of gear loss in sport and
subsistence fisheries in SEAK.
Lessons learned from applying the scar coding method
Any application of the caudal peduncle scar coding method to other humpback whale
populations should be preceded by an initial training period similar to that used in this
study (i.e., repetitive attempts by the same person to code a sample of caudal peduncle
photographs, combined with a comparison of E-codes with an expert such as Robbins.)
Because of the subjectivity inherent in entanglement scar coding, it is essential that the
coding be done by as few people as possible to ensure maximum consistency in the
assignment of codes. However, a small percentage of cases will always exist in which
slight differences in the angle or lighting of photographs influence the coding process
(e.g., Table 13; Robbins and Mattila 2004).
The results from this study demonstrate that the amount of photographic coverage and the
number of caudal peduncle photographs collected per individual whale may influence the
entanglement scarring percentages (Table 7, 10; Fig. 12). It is not surprising that I was
more likely to assign E-code EX to whales with less photographic coverage. However,
because the minimal scarring percentage is not robust to variation in the amount of
photographic coverage of the caudal peduncle (one side vs. both sides), if this approach is
employed, future efforts to collect data should focus on obtaining photographs of both
sides of the caudal peduncle to increase the chances of detecting wrapping marks. More
testing is needed to determine the optimum number of caudal peduncle photographs
necessary to generate a stable estimate of the percentage of whales with entanglement
scars. This could be accomplished by randomly selecting one caudal peduncle
36 Personal communication from Paul Barnes, commercial fisherman, PO Box 155, Gustavus, AK 99826,
November 2005.
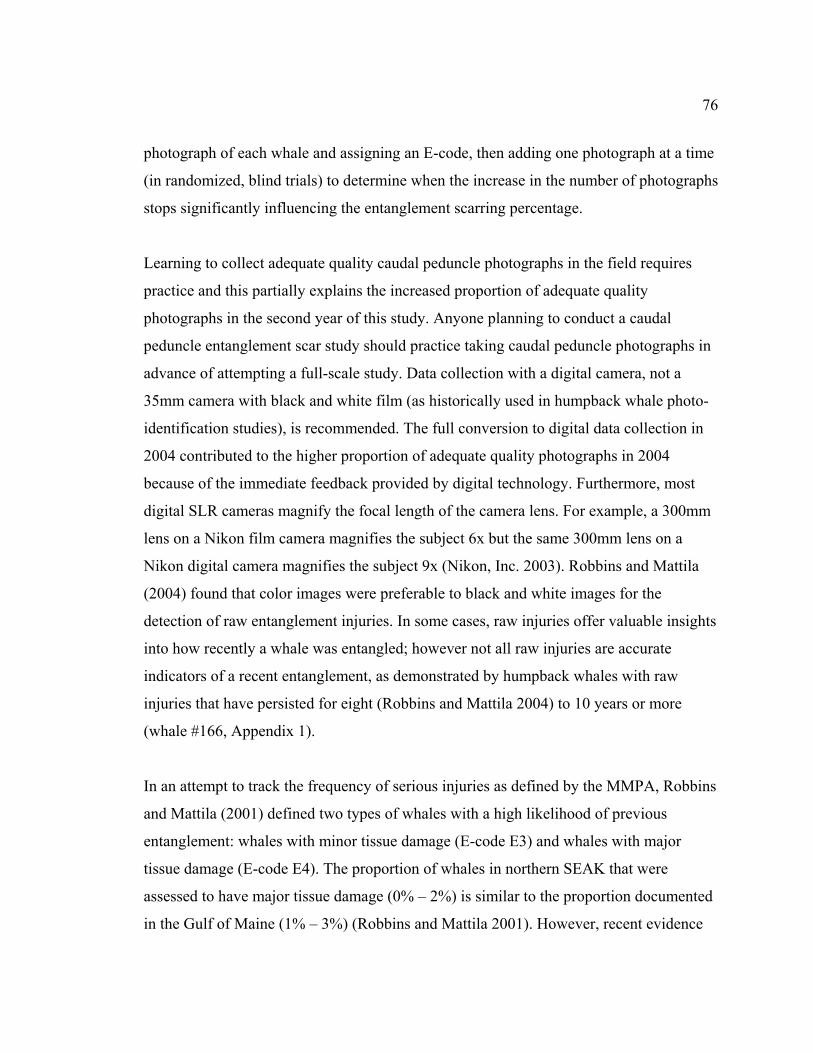
76
photograph of each whale and assigning an E-code, then adding one photograph at a time
(in randomized, blind trials) to determine when the increase in the number of photographs
stops significantly influencing the entanglement scarring percentage.
Learning to collect adequate quality caudal peduncle photographs in the field requires
practice and this partially explains the increased proportion of adequate quality
photographs in the second year of this study. Anyone planning to conduct a caudal
peduncle entanglement scar study should practice taking caudal peduncle photographs in
advance of attempting a full-scale study. Data collection with a digital camera, not a
35mm camera with black and white film (as historically used in humpback whale photo-
identification studies), is recommended. The full conversion to digital data collection in
2004 contributed to the higher proportion of adequate quality photographs in 2004
because of the immediate feedback provided by digital technology. Furthermore, most
digital SLR cameras magnify the focal length of the camera lens. For example, a 300mm
lens on a Nikon film camera magnifies the subject 6x but the same 300mm lens on a
Nikon digital camera magnifies the subject 9x (Nikon, Inc. 2003). Robbins and Mattila
(2004) found that color images were preferable to black and white images for the
detection of raw entanglement injuries. In some cases, raw injuries offer valuable insights
into how recently a whale was entangled; however not all raw injuries are accurate
indicators of a recent entanglement, as demonstrated by humpback whales with raw
injuries that have persisted for eight (Robbins and Mattila 2004) to 10 years or more
(whale #166, Appendix 1).
In an attempt to track the frequency of serious injuries as defined by the MMPA, Robbins
and Mattila (2001) defined two types of whales with a high likelihood of previous
entanglement: whales with minor tissue damage (E-code E3) and whales with major
tissue damage (E-code E4). The proportion of whales in northern SEAK that were
assessed to have major tissue damage (0% – 2%) is similar to the proportion documented
in the Gulf of Maine (1% – 3%) (Robbins and Mattila 2001). However, recent evidence

77
indicates that whales with minor external injuries may die from fisheries interactions;
therefore the frequency of E4 whales is now considered a poor correlate to serious injury
and mortality rates (Robbins and Mattila 2004). Based on this finding and also a lack of
management applications for distinguishing between E-codes E0 and E1, I recommend
simplifying the entanglement scar coding method by reducing the number of E-codes
from a total of six categories (likelihood of past entanglement: unknown, none, low,
ambiguous, high, high) to a total of four categories (likelihood of past entanglement:
unknown, low, ambiguous, high.) This could be accomplished by combining E-codes E0
and E1 into a single ‘low’ likelihood category and E-codes E3 and E4 into a single ‘high’
likelihood category, while leaving the ‘unknown’ and ‘ambiguous’ categories the same.
Management recommendations
Better photographic documentation of entangled humpback whales in SEAK is needed
because photographs have the potential to elucidate the type of material attached to the
whale (e.g., net, rope, buoys), the body parts involved in the entanglement, the severity of
the whale’s injuries, the size of the whale and the identity of the whale. These data are
essential to managers and fishermen trying to develop ways to prevent or mitigate the
severity of entanglements. In addition, photographic documentation of entanglements has
proven invaluable to experts when evaluating the condition of entangled whales, deciding
if they are candidates for disentanglement and planning how to attempt to remove the
gear.37 This study would have benefited from having more historic photographs of
entangled whales in SEAK because photographs would have allowed for ground-truthing
of the entanglement scar coding method for humpback whales in SEAK. Over the long-
term, a dataset of photographically identified entangled whales and subsequent sightings
of the same whales “gear-free” would allow managers to estimate minimum survival
rates of entangled whales and to generate more specific determination criteria for what
constitutes a serious injury under the MMPA.
37 Personal communication from Jan Straley, University of Alaska Southeast, 1332 Seward Ave. Sitka,
AK 99835, November 2005.

78
Clearly, photographs have the potential to yield important information, but their utility is
limited. Photographs rarely reveal the type of fishing gear or which part of the gear (e.g.,
groundline vs. surface buoy line) is entangled on the whale (Johnson et al. 2005).38
These data are essential to managers and fishermen trying to prevent or mitigate the
severity of entanglements. In the western North Atlantic, the type of entangling fishing
gear was identified 88% of the time when entangled whales were observed by
knowledgeable observers (e.g., fishermen, biologists) and/or when the entangling gear
was recovered. Thus, expanding the humpback whale stranding and disentanglement
response network in Alaska has the potential to greatly increase the quantity and quality
of data describing which types of fishing gear and which parts of the gear pose the
greatest threats to humpback whales in this region, with the ultimate goal of informing
initiatives aimed at preventing entanglements.
The Atlantic Large Whale Disentanglement Network (ALWDN) administered by the
Provincetown Center for Coastal Studies in Provincetown, MA, offers a successful
model.39 An ALWDN-style network of “first responders” who are trained to document
entangled whales could greatly improve the amount of information available on
entanglements in Alaska. Increasing the number of fishermen, biologists and others who
are trained and authorized to disentangle whales may not only increase the survival of
individual whales by freeing them from gear, but in many cases may also lead to positive
identifications and/or recovery of the entangling gear. In recognition of the importance of
developing and expanding the entanglement response network in Alaska, NOAA
Fisheries sponsored a two-day advanced disentanglement training workshop for whale
researchers and state and federal agency personnel in Bartlett Cove, Alaska in September
2005.
38 Unpublished data, NOAA Fisheries Alaska Regional Office, PO Box 21668, Juneau, AK 99802. 39 http://www.coastalstudies.org/what-we-do/whale-rescue/disentanglement-network.htm, accessed
November 3, 2005.

79
Humpback whale-fisheries interactions in northern SEAK may warrant a similar level of
management scrutiny as the Gulf of Maine where entanglement has been identified as a
substantial management concern, based on similarities in the amount of non-lethal
entanglement scarring between the two populations. Additional information is needed to
identify the specific fisheries and locations that pose the greatest threats to humpback
whales in northern SEAK. Increasing efforts to gather data from entangled whales in
northern SEAK and throughout the Central North Pacific could lead to insights into
potential preventative measures.

80
Literature Cited
ANGLISS, R. P., AND D. P. DEMASTER. 1998. Differentiating serious and non-serious
injury of marine mammals taken incidental to commercial fishing operation: Report of the Serious Injury Workshop. 1-2 April 1997, Silver Spring, Maryland, US Department of Commerce, NOAA Technical Memorandum NMFS-OPR-13. 48 pp.
ANGLISS, R. P., AND R. OUTLAW. 2005. Draft Alaska marine mammal stock
assessments 2005 (http://www.nmfs.noaa.gov/pr/PR2/Stock_Assessment_Program /sars_draft.html).
ANGLISS, R. P., AND K. L. LODGE. 2004. Alaska marine mammal stock assessments
2003. NOAA-TM-AFSC-144. 230 pp. BACHMAN, R., W. BERGMANN, J. BREESE, W. DAVIDSON, P. DOHERTY, S.
FORBES, D. GORDON, D. HARRIS, K. JENSEN, K. MONAGLE, L. SHAUL, P. SKANNES, G. TIMOTHY, T. THYNES AND G. WOODS. 2005. 2004 Commercial, Personal Use, and Subsistence Fisheries: Report to the Alaska Board of Fisheries. Alaska Department of Fish and Game, Fishery Management Report No. 05-38, Anchorage, AK. 225 pp.
BAKER, C. S., L. M. HERMAN, A. PERRY, W. S. LAWTON, J. M. STRALEY, A. A.
WOLMAN, G. D. KAUFMAN, H. E. WINN, J. D. HALL, J. M. REINKE AND J. ÖSTMAN. 1986. Migratory movement and population structure of humpback whales (Megaptera novaeangliae) in the central and eastern North Pacific. Marine Ecology Progress Series 31:105-119.
BAKER, C. S., S. T. PALUMBI, R. H. LAMBERSTEN, M. T. WEINRICH, J.
CALAMBOKIDIS AND S. J. O’BRIEN. 1990. Influence of seasonal migration on geographic distribution of mitochondrial DNA haplotypes in humpback whales. Nature 344:238-240.
BÉRUBÉ, M., AND P. J. PALSBØLL. 1996. Identification of sex in cetaceans by
multiplexing with three ZFX and ZFY specific primers. Molecular Ecology 5:283-287.
BLACKMER, A. L., S. K. ANDERSON AND M. T. WEINRICH. 2000. Temporal
variability in features used to photo-identify humpback whales (Megaptera novaeangliae). Marine Mammal Science 16:338-354.

81
CALAMBOKIDIS, J., G. H. STEIGER, J. M. STRALEY, L. H. HERMAN, S. CERCHIO, D. R. SALDEN, J. R. URBAN, J. K. JACOBSEN, O. VON ZEIGESAR, K. C. BALCOMB, C. M. GABRIELE, M. E. DAHLHEIM, S. UCHIDA, G. ELLIS, Y. MIYAMURA, P. LADRON DE GUEVERA, M. YAMAGUCHI, S. MIZROCH, L. SCHLENDER, K. RASMUSSEN, J. BARLOW AND T. J. QUINN II. 2001. Movements and population structure of humpback whales in the North Pacific. Marine Mammal Science 17:769-794.
CALAMBOKIDIS, J. G. H. STEIGER, J. M. STRALEY, T. J. QUINN II, L. M.
HERMAN, S. CERCHIO, D. R. SALDEN, M. YAMAGUCHI, F. SATO, J. R. URBAN, J. JACOBSEN, O. VON ZIEGESAR, K. C. BALCOMB, C. M. GABRIELE, M. E. DAHLHEIM, N. HIGASHI, S. UCHIDA, J. K. B. FORD, Y. MIYAMURA, P. LADRÓN DE GUEVARA, S. A. MIZROCH, L. SCHLENDER AND K. RASMUSSEN. 1997. Abundance and population structure of humpback whales in the North Pacific basin. Final Contract Report 50ABNF500113 to Southwest Fisheries Science Center, PO Box 271, La Jolla, CA 92038. 72 pp.
CAPELLA ALZUETA, J., L. FLÓREZ-GONZÁLEZ AND P. FALK FERNÁNDEZ.
2001. Mortality and anthropogenic harassment of humpback whales along the Pacific coast of Colombia. Memoirs of the Queensland Museum 47:547-553.
CARLSON, C. A., C. A. MAYO AND H. WHITEHEAD. 1990. Changes in the ventral
fluke pattern of the humpback whale, and its effect on matching: evaluation of its significance to photo-identification research. Reports of the International Whaling Commission (Special Issue 12):105-111.
CLAPHAM, P. J. 1992. Age at attainment of sexual maturity in humpback whales,
Megaptera novaeangliae. Canadian Journal of Zoology 70:1470-1472. CLAPHAM, P. J., AND J. G. MEAD. Megaptera novaeangliae. Mammalian Species
604:1-9. CLARK, J. E., K. K. IMAMURA AND T. M. KOENEMAN. 2001. The 1997 and 1998
Southeast Alaska Tanner Crab Stock Assessment Surveys. Alaska Department of Fish and Game, Regional Information Report No. 1J01-06, Juneau, AK. 42 pp.
CLARK. J. E., T. KOENEMAN, C. A. BOTELHO, S. MERKOURIS AND D.
WOODBY. 2003. Estimation of Red King Crab (Paralithodes camtschaticus) Abundance and Available Harvest in Southeast Alaska for the 2001/2002 Season Using a Pot Survey. Alaska Department of Fish and Game, Regional Information Report No. 1J03-25. 75 pp.

82
CRAIG, A. S., L. M. HERMAN, C. M. GABRIELE AND A. A. PACK. 2003. Migratory timing of humpback whales (Megaptera novaeangliae) in the Central North Pacific varies with age, sex and reproductive status. Behaviour 140:981-1001.
DAVIDSON, B., R. BACHMAN, G. BISHOP, W. BERGMANN, P. DOHERTY, D.
GORDON, K. HEBERT, J. BREESE, K. MONAGLE, E. COONRADT, S. FORBES, D. HARRIS, B. MEREDITH AND T. THYNES. 2005. Southeast Alaska Pot Shrimp Fishery Management Plan, 2005. Alaska Department of Fish and Game, Fishery Management Report No. 05-50, Anchorage, AK. 59 pp.
FOWLER, C. W. 1985. An evaluation of the role of entanglement in the population
dynamics of northern fur seals on the Pribilof Islands. Pages 291-307 in R. S. Shomura and H. O. Yoshida, eds. Proceedings of the Workshop on the Fate and Impact of Marine Debris, 26-29 November 1984, Honolulu, HI. NOAA Technical Memo NOAA-TM-NMFS-SWFC-54.
GABRIELE, C. M. 1992. The behavior and residence characteristics of reproductive
classes of humpback whales (Megaptera novaeangliae) in the Hawaiian Islands. Master’s thesis, University of Hawaii, Honolulu, HI. 99 pp.
GABRIELE, C. M., J. M. STRALEY, S. A. MIZROCH, C. S. BAKER, A. S. CRAIG, L.
M. HERMAN, D. GLOCKNER-FERRARI, M. J. FERRARI, S. CERCHIO, O. VON ZIEGESAR, J. DARLING, D. MCSWEENEY, T. J. QUINN II AND J. K. JACOBSEN. 2001. Estimating the mortality rate of humpback whale calves in the central North Pacific Ocean. Canadian Journal of Zoology 79:589-600.
GLOCKNER, D. 1983. Determining the sex of humpback whales (Megaptera
novaeangliae) in their natural environment. Pages 447-464 in R. Payne, ed. Communication and behavior of whales. Westview Press, Inc., Boulder, CO.
HARRIS, C. E., AND F. F. KNOWLTON. 2001. Differential responses of coyotes to
novel stimuli in familiar and unfamiliar settings. Canadian Journal of Zoology 79:2005-2013.
HARWOOD, J. 1999. A risk assessment framework for the reduction of cetacean by-
catches. Aquatic Conservation: Marine and Freshwater Ecosystems 9:593-599. HEBERT, K., G. H. BISHOP, J. M. RUMBLE, A. TINGLEY AND G. TIMOTHY.
2005. 2005 Report to the Board of Fisheries, 2005 King and Tanner Crab Fisheries. Alaska Department of Fish and Game, Fishery Management Report No. 1J05-02, Anchorage, AK. 125 pp.

83
HEEZEN, B. C. 1957. Whales entangled in deep sea cables. Deep-Sea Research 4:105-115.
HEYNING, J. E., AND T. D. LEWIS. 1990. Entanglements of baleen whales in fishing
gear off southern California. Reports of the International Whaling Commission 40:427-431.
JOHNSON, A., G. SALVADOR, J. KENNEY, J. ROBBINS, S. KRAUS, S. LANDRY
AND P. CLAPHAM. 2005. Fishing gear involved in entanglements of right and humpback whales. Marine Mammal Science 21:635-645.
JOHNSON, T., AND K. BYERS. 2003. Ocean treasure: commercial fishing in Alaska.
Alaska Sea Grant College Program, Fairbanks, AK. JURASZ, C.M., AND V. P. PALMER. 1981. Censusing and establishing age
composition of humpback whales (Megaptera novaeangliae), employing photodocumentation in Glacier Bay National Monument, Alaska. Report to the National Park Service, Anchorage, AK, 42 pp.
KATONA, S. K., AND H. P. WHITEHEAD. 1981. Identifying humpback whales using
their natural markings. Polar Record 20:439-444. KNOWLTON, A. R., AND S. D. KRAUS. 2001. Mortality and serious injury of northern
right whales (Eubalaena glacialis) in the western North Atlantic Ocean. Journal of Cetacean Research and Management (Special Issue 2):193-208.
KNOWLTON, A. R., M. K. MARX, H. M. PETTIS, P. K. HAMILTON AND S. D.
KRAUS. 2005. Analysis of scarring on North Atlantic right whales (Eubalaena glacialis): Monitoring rates of entanglement interaction: 1980-2002. Final Report to the National Marine Fisheries Service. Contract #43EANF030107. 20 pp.
KOZUCK, A. 2003. Implications of historical changes in fixed fishing gear for large
whale entanglements in the Northwest Atlantic. Master’s thesis, Duke University, Durham, NC. 43 pp.
KRAUS, S.D. 1990. Rates and potential causes of mortality in North Atlantic right
whales (Eubalaena glacialis). Marine Mammal Science 6:278-291. LAIST, D. 1996. Marine debris entanglement and ghost fishing: a cryptic and significant
type of bycatch? Pages 33-39 in Solving bycatch: consideration for today and tomorrow. Alaska Sea Grant College Program Publication No. AK-SG-96-03.

84
LAMBERTSEN, R. H., C. S. BAKER, D. A. DUFFIELD AND J. CHAMBERLAIN-LEA, J. 1988. Cytogenetic determination of sex among individually identified humpback whales (Megaptera novaeangliae). Canadian Journal of Zoology 66:1243-1249.
LEWISON, R. L., L. B. CROWDER, A. J. READ AND S. A. FREEMAN. 2004.
Understanding impacts of fisheries bycatch on marine megafauna. Trends in Ecology and Evolution 19:598-604.
LIEN, J. 1994. Entrapments of large cetaceans in passive inshore fishing gear in
Newfoundland and Labrador (1979-1990). Reports of the International Whaling Commission (Special Issue 15):149-157.
LOVE, D., AND G. BISHOP. 2002. Report to the Board of Fisheries, Southeast Alaska
Pot Shrimp Fishery. Alaska Department of Fish and Game, Regional Information Report No. 1J02-45, Juneau, AK. 21 pp.
MANN, J., R. A. SMOLKER AND B. B. SMUTS. 1995. Responses to calf entanglement
in free-ranging bottlenose dolphins. Marine Mammal Science 11:100-106. MAZZUCA, L., S. ATKINSON AND E. NITTA. 1998. Deaths and entanglements of
humpback whales, Megaptera novaeangliae, in the main Hawaiian Islands, 1972-1996. Pacific Science 52:1-13.
MOBLEY, J. M., S. SPITZ, R. GROTEFENDT, P. FORESTELL, A. FRANKEL AND
G. BAUER. 2001. Abundance of humpback whales in Hawaiian waters: Results of 1993-2000 aerial surveys. Report to the Hawaiian Islands Humpback Whale National Marine Sanctuary. 16 pp.
NAESSIG, P. J., AND J. M. LANYON. 2004. Levels and probable origin of predatory
scarring on humpback whales (Megaptera novaeangliae) in east Australian waters. Wildlife Research 31:163-170.
NATIONAL RESEARCH COUNCIL. 2005. Marine mammal populations and ocean
noise: Determining when noise causes biologically significant effects. National Research Council, National Academies Press, Washington, D.C. 142 pp.
NIKON, INC. 2003. D100 Digital SLR Camera Specification Sheet. 1 p. NORMAN, S. A., AND A. L. LOPEZ. 2002. Update on marine mammal interactions
with undersea cables. Unpublished manuscript. NOAA Alaska Fisheries Science Center, 7600 Sand Point Way NE, Seattle, WA 98115. 19 pp.

85
OWENS, I. P. F. 2002. Sex differences in mortality rates. Science 297:2008-2009. PERRY, A., C. S. BAKER AND L. M. HERMAN. 1990. Population characteristics of
individually identified humpback whales in the central and eastern north Pacific: a summary and critique. Reports of the International Whaling Commission (Special Issue 12): 307-317.
RICHARDSON, B., AND V. O’CONNELL. 2004. The Southeast Alaska Northern
Southeast Inside Sablefish Fishery Information Report With Outlook to the 2004 Fishery. Alaska Department of Fish and Game, Regional Information Report No. 1J04-03, Juneau, AK. 54 pp.
ROBBINS, J., AND D. MATTILA. 1999. Monitoring entanglement scars on the caudal
peduncle of Gulf of Maine humpback whales. Report to the National Marine Fisheries Service. Order number 40ENNF800288. 15 pp.
ROBBINS, J., AND D. K. MATTILA. 2001. Monitoring entanglements of humpback
whales (Megaptera novaeangliae) in the Gulf of Maine on the basis of caudal peduncle scarring. Unpublished report to the 53rd Scientific Committee Meeting of the International Whaling Commission. Hammersmith, London. Document # SC/53/NAH25. 12 pp.
ROBBINS, J., AND D. K. MATTILA. 2004. Estimating humpback whale (Megaptera
novaeangliae) entanglement rates on the basis of scar evidence. Report to the Northeast Fisheries Science Center, National Marine Fisheries Service, Order Number 43EANF030121. 21 pp.
RUMBLE, J., AND G. BISHOP. 2002. Report to the Board of Fisheries, Southeast
Alaska Dungeness Crab Fishery. Alaska Department of Fish and Game, Regional Information Report No. 1J02-45, Juneau, AK. 16 pp.
STRALEY, J.M. 1994. Seasonal characteristics of humpback whales (Megaptera
novaeangliae) in southeastern Alaska. Master's thesis, University of Alaska Fairbanks, Fairbanks, AK. 121 pp.
STRALEY, J.M., T. J. QUINN II AND C. M. GABRIELE. 2002. Estimate of the
abundance of humpback whales in southeastern Alaska 1994 to 2000. Final report submitted to the National Marine Fisheries Service, National Marine Mammal Laboratory, 7600 Sand Point Way N.E., Seattle, WA 98115, 23 pp.

86
TAYLOR, M. S., AND A. PERRY. 1988. Commercial fishing patterns in Glacier Bay National Park, Alaska. Pages 78-82 in Proceedings of the Second Glacier Bay Science Symposium, September 19-22, 1988, Glacier Bay National Park and Preserve, Gustavus, AK.
VOLGENAU, L., S. D. KRAUS AND J. LIEN. 1995. The impact of entanglements on
two substocks of the western North Atlantic humpback whale, Megaptera novaeangliae. Canadian Journal of Zoology 73:1689-1698.
WAITE, J. M., M. E. DAHLHEIM, R. C. HOBBS, S. A. MIZROCH, O. VON
ZIEGESAR-MATKIN, J. M. STRALEY, L. M. HERMAN AND J. JACOBSEN. 1999. Evidence of a feeding aggregation of humpback whales (Megaptera novaeangliae) around Kodiak Island, Alaska. Marine Mammal Science 15:210-220.
WEINRICH, M. 1999. Behavior of a humpback whale (Megaptera novaeangliae) upon
entanglement in a gill net. Marine Mammal Science 15:559-563. WITTEVEN, B. H., J. M. STRALEY, O. VON ZIEGESAR, D. STEEL AND C. S.
BAKER. 2004. Abundance and mtDNA differentiation of humpback whales (Megaptera novaeangliae) in the Shumagin Islands, Alaska. Canadian Journal of Zoology 82:1352-1359.
ZAR, J. H. 1999. Biostatistical analysis. Fourth edition. Prentice Hall. Upper Saddle
River, NJ.

87
Appendix 1
Historic Case Studies
Black and white humpback whale photographs from Glacier Bay and Icy Strait collected
annually from 1985 through 200240 were reviewed to look for case studies that would
offer insight into the stability of caudal peduncle scars, the persistence of raw wounds
and the occurrence of repeated entanglements of the same individual. Caudal peduncle
images of known individuals and ventral fluke photographs of known individuals that
showed wrapping injuries along the leading edge of the flukes and/or ventral caudal
peduncle were scanned at 4000 dpi using a 35mm negative film scanner (Nikon Coolscan
4000ED with Nikon Scan v.3.1.2 software).
Few adequate caudal peduncle photographs were found, but several historic photographs
provided insights into scar longevity (Fig. 19, 20) and the persistence of a raw caudal
peduncle wound (Fig. 21). Distinct wrap marks visible in fluke photographs of whale
#1018 from 1996 and 2002 illustrate that this female has been entangled more than once
(Fig. 22).
One whale was photographed that is known to have been entangled previously. Whale
#1019, first documented in 1988 as a calf, was reported to be entangled in a line and
towing a buoy in Icy Strait on August 8, 1988. This whale had been sighted July 28, 1988
with no apparent trailing gear, therefore the entanglement was likely less than 10 days old
when first reported. On August 10, 1988 GBNPP personnel approached the calf and cut
off a hard plastic buoy, trolling and longline gear, including 475 ft of ground line, which
was wrapped around the animal’s caudal peduncle (and possibly other body parts).41
40 Unpublished data, GBNPP, PO Box 140, Gustavus, AK 99826. 41 Personal communication from Jan Straley, University of Alaska Southeast, 1332 Seward Ave. Sitka,
AK 99835, September 2005.

88
Figure 19. Historic photographs showing whale #232 in 1988 (left) and 2004 (right) showing the stability of the scarring pattern on the leading edge of this whale’s flukes.
Figure 20. Whale #351 in 1997 (left) and 2003 (right)entanglement wounds that are not apparent in the 1997healed or faded beyond recognition by 2003. Nevertheentanglement scars visible in 2003 to assign entanglem
Figure 21. Whale #166 in 1994 (left) and 2004 (right)wound in 1994 that was still raw in 2004. The origin o
3
4
7
48
200
. In 1997 this whale had pink (i.e., raw) photograph. Many of the wounds had less, there were still enough diagnostic ent status code E3.
199
.f
2004
199
200
198This whale had a raw caudal peduncle this wound is unknown.

89
6 2
Fscpo
T
m
T
th
p
p
e
199
igure 22. Whale #1018 in 1996 (left) and 2002 (rightars in 1996 but new entanglement scars, laid on top o
hotograph. Historic caudal peduncle images of this wf very poor quality.
he original entanglement appeared to have been
ore gear as it trailed behind the calf. The entangl
here are no photographs of #1019’s caudal pedun
e time of the 1988 entanglement to 2002. In 200
hotographs were obtained and #1019 was assigne
hotographs were obtained but the marks suggeste
ntanglement (E-code E1).
42 Ibid.
200
). This whale already had entanglement f the original scars, are visible in the 2002
hale show the same general pattern but are
with the longline which then snagged
ement was not considered severe.42
cle in the GBNPP photo archives from
3, inadequate quality caudal peduncle
d E-code EX. In 2004, adequate
d a low likelihood of previous

90
Appendix 2
Major Commercial Fisheries in Northern SEAK
Dungeness Crab Pot Fishery
Location
Dungeness crabs are harvested in protected bays and inlets throughout the waters of
northern SEAK (Fig. 23) at depths of 6 – 60 ft.43 Glacier Bay and Dundas Bay were
closed to commercial Dungeness crab fishing in 1999. Prior to the closure, the harvest of
Dungeness crabs from Glacier Bay and Dundas Bay in the early-mid 1990s accounted for
4% – 13% of the total SEAK harvest (Rumble and Bishop 2002).44
Season
From the early 1930s through 1955, the fishery was open year-round, except for a closed
season for 2 – 4 months between May 1 and September 1. In the late 1950s, the summer
closures were lifted. From the late 1960s until 1989, the length of the fishing season
varied. From 1989 to the present, the fishery has been open in most of central and
northern SEAK in the summer (June 15 – August 15) and fall (October 1 – November
30). Most of the harvest is taken during the summer months (Rumble and Bishop 2002).
In addition, a sport pot fishery for Dungeness crab occurs throughout SEAK and is open
year-round.
Gear
The majority of fishermen use steel hatbox-shaped pots that weigh 50 – 100 lb each (Fig.
24) (Rumble and Bishop 2002).45 In 2001, a maximum pot diameter of 50 in. was
43 Personal communication from Richard Gregg, commercial fisherman, PO Box 20669, Juneau, AK
99802, November 2005. 44 GBNPP unpublished data. 45 Personal communication from Jan Rumble, ADF&G Commercial Fisheries Division, 802 Third St,
Douglas, AK 99824, December 2004.

91
Figure 23. Main Dungeness crab fishing grounds in northern SEAK (hatched areas).46 ADF&G Districts that overlap with the study area are indicated in color and numbered.
46 Personal communication from Richard Gregg, commercial fisherman, PO Box 20669, Juneau, AK
99802, November 2005.

92
Figure 24. Diagram of generalized pot gear (illustration by Bob Hitz, courtesy of NOAA Alaska Sea Grant).
established. Permits are issued for a maximum of 150 or 300 pots per vessel (05 AAC
32.125). Each pot must be individually marked with a surface buoy; Dungeness crab pots
may not be longlined (05 AAC 32.125). At least one buoy on each pot must be labeled
with the ADF&G license number of the vessel operating the gear (05 AAC 32.051). Pots
are generally soaked for 3 – 5 days.47 Pots may be stored in the water for up to seven
days after the season closes (05 AAC 32.052) in a standard configuration with a surface
buoy line. Surface buoy line is typically 3/8-in. to 7/16-in. leaded or ‘sinking’ (negatively
buoyant) line.48,49 Surface buoys are usually bullet-shaped corks approximately 12 in.
long.
In 1997, the Commercial Fisheries Entry Commission (CFEC) implemented a limited
entry system for the fishery in SEAK with a maximum effort level of 308 permits,
47 Ibid. 48 Ibid.
49 Personal communication from Gene Farley, commercial fisherman, PO Box 182, Gustavus, AK 99826, November 2005.

93
providing for a maximum of 48,750 commercial Dungeness crab pots (Rumble and
Bishop 2002).
Red King Crab Pot Fishery
Location
Red king crabs are harvested primarily in the protected bays, inlets and adjacent
shorelines of straits and sounds in northern SEAK in water depths usually less than 900 ft
(Fig. 25) (Clark et al. 2003, Hebert et al. 2005). The majority of the SEAK harvest is
taken in ADF&G Districts 9 – 14; generally less than 10% of the harvest comes from
southern SEAK (Hebert et al. 2005). Glacier Bay was closed to commercial red king crab
fishing in 1999; prior to the closure, harvest levels from Glacier Bay were very low
(Taylor and Perry 1988).
Season
From 1961 through 1968, the fishery was open year-round. Beginning in the 1969/70
season, the season was restricted to August 15 – March 15. In 1971, the season was
shortened to September 1 – January 31. The fishery was closed from the 1985/86 through
the 1992/93 seasons due to small stock size. Since 1993, the fishery has been open most
years, with intermittent annual closures to allow stocks to rebuild. Currently, the season is
open November 1 – January 24, but since the late 1990s the fishery has been closed by
November 15 because harvest limits were reached (Hebert et al. 2005).
Gear
The majority (~80%) of fishermen in SEAK use pyramid or cone-shaped pots (5 – 8 ft
bases) that weigh 200 – 500 lb, the remainder use square pots (7 ft x 7 ft x 30 in.) that
weigh approximately 600 lb (Fig. 24) (Clark et al. 2003; Hebert et al. 2005).50 From 1961
through 1967, the amount of gear that could be fished was not restricted. From 1968 until
50 Personal communication from Richard Gregg, commercial fisherman, PO Box 20669, Juneau, AK
99802, November 2005.

94
Figure 25. Main red king crab fishing grounds in northern SEAK (hatched areas).51 ADF&G Districts that overlap with the study area are indicated in color and numbered.
51 Ibid.
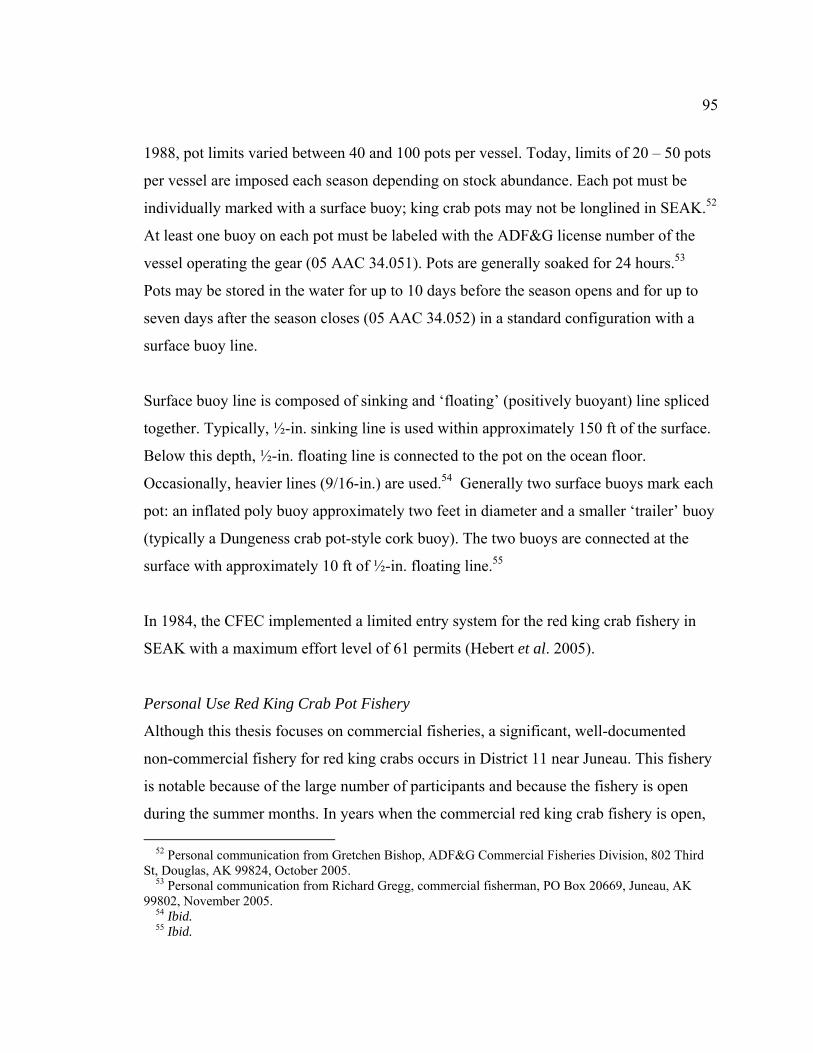
95
1988, pot limits varied between 40 and 100 pots per vessel. Today, limits of 20 – 50 pots
per vessel are imposed each season depending on stock abundance. Each pot must be
individually marked with a surface buoy; king crab pots may not be longlined in SEAK.52
At least one buoy on each pot must be labeled with the ADF&G license number of the
vessel operating the gear (05 AAC 34.051). Pots are generally soaked for 24 hours.53
Pots may be stored in the water for up to 10 days before the season opens and for up to
seven days after the season closes (05 AAC 34.052) in a standard configuration with a
surface buoy line.
Surface buoy line is composed of sinking and ‘floating’ (positively buoyant) line spliced
together. Typically, ½-in. sinking line is used within approximately 150 ft of the surface.
Below this depth, ½-in. floating line is connected to the pot on the ocean floor.
Occasionally, heavier lines (9/16-in.) are used.54 Generally two surface buoys mark each
pot: an inflated poly buoy approximately two feet in diameter and a smaller ‘trailer’ buoy
(typically a Dungeness crab pot-style cork buoy). The two buoys are connected at the
surface with approximately 10 ft of ½-in. floating line.55
In 1984, the CFEC implemented a limited entry system for the red king crab fishery in
SEAK with a maximum effort level of 61 permits (Hebert et al. 2005).
Personal Use Red King Crab Pot Fishery
Although this thesis focuses on commercial fisheries, a significant, well-documented
non-commercial fishery for red king crabs occurs in District 11 near Juneau. This fishery
is notable because of the large number of participants and because the fishery is open
during the summer months. In years when the commercial red king crab fishery is open,
52 Personal communication from Gretchen Bishop, ADF&G Commercial Fisheries Division, 802 Third St, Douglas, AK 99824, October 2005.
53 Personal communication from Richard Gregg, commercial fisherman, PO Box 20669, Juneau, AK 99802, November 2005.
54 Ibid. 55 Ibid.

96
60% of the total allowable harvest in the Juneau area is allocated to personal use and 40%
is allocated to commercial use. In years when the commercial fishery has been closed, the
personal use fishery has remained open (Hebert et al. 2005).
The personal use season is open July 1 – September 30 (summer) and October 1 – March
31 (winter), with earlier closures if guideline harvest levels are reached. Over 50% of the
summer harvest occurs in July and over 90% occurs by the end of August. The majority
of the summer harvest (99%) is taken with pot gear. Pot size and shape in the personal
use fishery are not restricted but the majority of participants use pyramid-shaped pots (~3
ft x 3 ft bases) that vary in weight up to approximately 50 lb, with a wide range of line
types used for surface buoys, including both sinking and floating line.56
Personal use permits are required to participate in the fishery. The number of permittees
has increased steadily since 1997, with 2,282 personal use permits issued for the summer
2004 season. Beginning in the 1995/96 season, a limit of 4 pots per person or vessel was
imposed (Hebert et al. 2005). Applying this pot limit to the number of permittees in 2004
equates to up to 9,000 personal use king crab pots in the Juneau area during the summer
season.
Golden King Crab Pot Fishery
Location
Golden king crabs are taken from the deeper waters (600 – 2100 ft) of northern SEAK
(Fig. 26). The majority of the SEAK harvest is taken in ADF&G Districts 9 – 14;
generally less than 10% of the harvest comes from southern SEAK. The fishing grounds
tend to be exposed to more adverse weather conditions, stronger tidal exchanges and
stronger currents than other crab fishing grounds in SEAK (Hebert et al. 2005). Glacier
Bay was closed to commercial golden king crab fishing in 1999; prior to the closure,
56 Personal communication from Brian Glynn, ADF&G Sport Fish Division, PO Box 240020, Douglas,
AK 99824, November 2005.

97
Figure 26. Main golden king crab fishing grounds in northern SEAK (hatched areas) (Hebert et al. 2005).57 ADF&G Districts that overlap with the study area are indicated in color and numbered.
57 Personal communication from Richard Gregg, commercial fisherman, PO Box 20669, Juneau, AK
99802, November 2005.

98
harvest levels from Glacier Bay were very low (Taylor and Perry 1988).
Season
From 1961 through 1968, the fishery was open year-round. Since the 1970s the length of
the season has varied. Since 1989 the season has opened on February 15, closing by
emergency order when the guideline harvest range is reached. In recent years, the fishery
has closed between March and September; most of the harvest is taken in February,
March and April (Hebert et al. 2005).
Gear
Because golden king crabs are harvested from deeper, more exposed waters, participants
tend to use heavier gear and soak times are generally longer compared to other crab pot
fisheries.58 Participants use both square pots (7 ft x 7 ft x 30 in.) that weigh
approximately 600 lb and pyramid or cone-shaped pots (5 – 8 ft bases) that weigh 200 –
500 lb (Fig. 24) (Clark et al. 2003; Hebert et al. 2005).59 In recent years, the popularity
of cone-shaped pots has grown. From 1961 through 1967, the amount of gear that could
be fished was not restricted. From 1968 until 1978, pot limits varied between 40 and 60
pots per vessel. In 1978, the limit was raised to 100 pots per vessel; this limit remains in
effect today. Each pot must be individually marked with a surface buoy; king crab pots
may not be longlined in SEAK.60 At least one buoy on each pot must be labeled with the
ADF&G license number of the vessel operating the gear (05 AAC 34.051). Pots are
generally soaked for 3 – 7 days.61 Pots may be stored in the water for up to 10 days
before the season opens and for up to seven days after the season closes (05 AAC 34.052)
in a standard configuration with a surface buoy line.
58 Ibid. 59 Ibid. 60 Personal communication from Gretchen Bishop, ADF&G Commercial Fisheries Division, 802 Third
St, Douglas, AK 99824, October 2005. 61 Personal communication from Richard Gregg, commercial fisherman, PO Box 20669, Juneau, AK
99802, November 2005.

99
Surface buoy line is composed of sinking and floating line spliced together. Typically,
½-in. sinking line is used within approximately 150 ft of the surface. Below this depth,
½-in. floating line is connected to the pot on the ocean floor. Occasionally, heavier lines
(9/16-in.) are used.62 Generally two surface buoys mark each pot: an inflated poly buoy
approximately two feet in diameter and a smaller ‘trailer’ buoy (typically a Dungeness
crab pot-style cork buoy). The two buoys are connected at the surface with approximately
10 ft of ½-in. floating line.63
In 1984, the CFEC implemented a limited entry system for the golden king crab fishery
in SEAK with a maximum effort level of 57 permits (Hebert et al. 2005).
Tanner Crab Pot Fishery
Location
Tanner crabs are harvested primarily in the waters of northern SEAK at depths of 120 –
600 ft64 (Fig. 27). In the early 1980s, large crab vessels that were bound for the Bering
Sea and Kodiak often fished in SEAK on their way north with a great deal of fishing
effort in the Glacier Bay/Icy Strait area (District 14). Harvests peaked in the 1981/82
season, with about two-thirds of the harvest coming from District 14. Beginning in 1985,
vessels registered to fish for Tanner crab in SEAK were prohibited from fishing for
Tanner crab in any other part of Alaska, which reduced the number of larger vessels
fishing in SEAK (Hebert et al. 2005).
Season
From 1961 through 1968, the fishery was open year-round. Since the 1970s the length of
the season has varied, with most of the openings in the fall and winter months. Since
1989 the season has opened on February 15, closing by emergency order when harvest
62 Ibid. 63 Ibid. 64 Ibid.

100
Figure 27. Main Tanner crab fishing grounds in northern SEAK (hatched areas) (Hebert et al. 2005).65 ADF&G Districts that overlap with the study area are indicated in color and numbered.
65 Ibid.
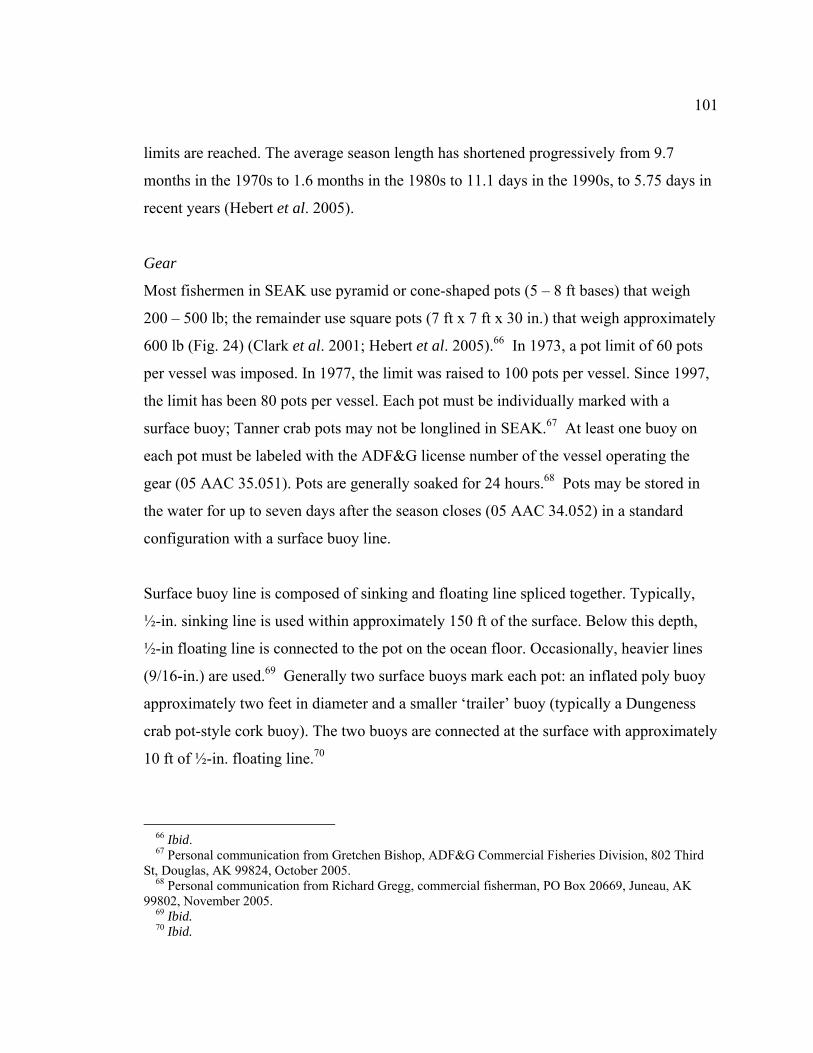
101
limits are reached. The average season length has shortened progressively from 9.7
months in the 1970s to 1.6 months in the 1980s to 11.1 days in the 1990s, to 5.75 days in
recent years (Hebert et al. 2005).
Gear
Most fishermen in SEAK use pyramid or cone-shaped pots (5 – 8 ft bases) that weigh
200 – 500 lb; the remainder use square pots (7 ft x 7 ft x 30 in.) that weigh approximately
600 lb (Fig. 24) (Clark et al. 2001; Hebert et al. 2005).66 In 1973, a pot limit of 60 pots
per vessel was imposed. In 1977, the limit was raised to 100 pots per vessel. Since 1997,
the limit has been 80 pots per vessel. Each pot must be individually marked with a
surface buoy; Tanner crab pots may not be longlined in SEAK.67 At least one buoy on
each pot must be labeled with the ADF&G license number of the vessel operating the
gear (05 AAC 35.051). Pots are generally soaked for 24 hours.68 Pots may be stored in
the water for up to seven days after the season closes (05 AAC 34.052) in a standard
configuration with a surface buoy line.
Surface buoy line is composed of sinking and floating line spliced together. Typically,
½-in. sinking line is used within approximately 150 ft of the surface. Below this depth,
½-in floating line is connected to the pot on the ocean floor. Occasionally, heavier lines
(9/16-in.) are used.69 Generally two surface buoys mark each pot: an inflated poly buoy
approximately two feet in diameter and a smaller ‘trailer’ buoy (typically a Dungeness
crab pot-style cork buoy). The two buoys are connected at the surface with approximately
10 ft of ½-in. floating line.70
66 Ibid. 67 Personal communication from Gretchen Bishop, ADF&G Commercial Fisheries Division, 802 Third
St, Douglas, AK 99824, October 2005. 68 Personal communication from Richard Gregg, commercial fisherman, PO Box 20669, Juneau, AK
99802, November 2005. 69 Ibid. 70 Ibid.

102
In 1984, the CFEC implemented a limited entry system for the Tanner crab fishery in
SEAK with a maximum effort level of 83 permits (Hebert et al. 2005).
Shrimp Pot Fishery
Location
Shrimp are harvested in rocky habitats, typically in water depths of 200 – 300 ft (max
600 ft)71 (Fig. 28). The majority of the harvest in SEAK is taken in southern SEAK
(ADF&G Districts 1, 3 and 7); from the 1981/82 season through the 2001/02 season, the
annual harvest of shrimp from Districts 9 – 14 only comprised an average of 17% of the
total annual SEAK harvest (Love and Bishop 2002). Within northern SEAK, fishing
activity is most concentrated in Tenakee Inlet (District 12), Port Houghton (District 10)
and Hoonah Sound (District 13).72 Glacier Bay was closed to commercial shrimp harvest
in 1983 (36 CFR 13.65).
Season
Prior to 1970, pot shrimp fishing was generally open May 1 through February 14. From
1970 until 1997, the season was open year-round in ADF&G Districts 9 – 14. In 1997,
the season was restricted to October 1 – February 18. If guideline harvest levels are not
reached in a district during the regular season, the district may be re-opened by regulation
from May 1 – July 31. However, in many areas the guideline harvest level is reached in
early October and the fishery is closed by emergency order (Davidson et al. 2005). In
addition, a sport pot fishery for shrimp occurs in some parts of SEAK and is open year-
round.
71 Personal communication from Larry Painter, commercial fisherman, PO Box 6181, Ketchikan, AK
99901, November 2005. 72 Personal communication from Ian Fisk, commercial fisherman, PO Box 240436, Douglas, AK 99824,
January 2006.

103
Figure 28. Main shrimp pot fishing grounds in northern SEAK (hatched areas).73 ADF&G Districts that overlap with the study area are indicated in color and numbered.
73 Ibid.

104
Gear
Today most fishermen use cone-shaped pots that weigh 25 – 50 lb74, but rectangular pots
approximately 30 in. x 18 in. x 18 in. used to be common (Fig. 24) (Love and Bishop
2002). Pots are classified as small if the bottom perimeter is less than 124 in. or large if
the bottom perimeter is greater than 124 in. (max 153 in.). Pot height may not exceed 24
in. Permits are issued for a maximum of 140 small or 100 large pots per vessel (05 AAC
31.124). Shrimp pots may be fished as single pots or longlined (05 AAC 31.124); most
fishermen longline their pots. Typically there are 5 – 20 pots per longline, with the pots
spaced 60 – 90 ft apart and connected by a 7/16-in. to ½-in. floating groundline. Pots are
generally soaked for 24 hours.75 Pots may be stored in the water for up to seven days
after the season closes (05 AAC 31.052) in a standard configuration with a surface buoy
line.
Surface buoy line is composed of sinking and floating line spliced together. Typically,
7/16-in. to ½-in. sinking line is used in the upper half of the water column and 7/16-in. to
½-in. floating line is used in the lower half of the water column.76 Some fishermen mark
both ends of the longline with surface buoys, others mark only one end. Generally two
surface buoys are used: an inflated poly buoy approximately two feet in diameter and a
smaller ‘trailer’ buoy (typically a Dungeness crab pot-style cork buoy). The two buoys
are connected at the surface with approximately six feet of 7/16-in. to ½-in. floating
line.77 At least one of the buoys must be labeled with the ADF&G license number of the
vessel operating the gear (05 AAC 31.051).
Participation in the fishery increased steadily from the 1960s until the early 1990s, when
large increases in effort and harvest occurred, leading the CFEC to implement a limited
74 Ibid. 75 Ibid. 76 Personal communication from Larry Painter, commercial fisherman, PO Box 6181, Ketchikan, AK
99901, November 2005. 77 Ibid.

105
entry system in SEAK in 1995 with a maximum effort level of 332 permits (Love and
Bishop 2002).
Salmon Drift Gillnet Fishery
Location
One traditional common property drift gillnetting area (Taku/Snettisham (District 11))
and several highly localized terminal hatchery fishing areas and hatchery cost recovery
areas overlap with the study area (Fig. 29). Although gillnets may be set anywhere in the
open areas, most of the gear is concentrated near shore, with approximately 80% of the
nets set within one mile of shore.78
Season
Specific periods when the fishery is open are established by emergency order. Openings
in SEAK generally occur from mid-June through mid-October with each opening lasting
an average of three days.79 In 2004, participation in the fishery peaked in mid-August.
Gear
Drift gillnets in SEAK may be 50 – 1800 ft long depending on the location where they
are fished (Fig. 30). In ADF&G District 11, nets may not be longer than 900 ft until mid-
late June, when they may be up to 1200 ft in length (05 AAC 33.331). Most fishermen in
District 11 use the maximum allowable net length (1200 ft).80 Only one gillnet is allowed
per vessel (05 AAC 33.331). Gillnet mesh is composed of multi-strand nylon and can be
any color, though blue and green are the most common.81 The maximum legal mesh size
is generally six inches (05 AAC 33.331). The top edge of the net is held at the surface of
the water by ~½-in. braided floating line attached to cork floats that are spaced
78 Personal communication from Richard Gregg, commercial fisherman, PO Box 20669, Juneau, AK 99802, November 2005.
79 Personal communication from Ted Merrell, commercial fisherman, 3119 Douglas Highway, Juneau, AK 99801, November 2005.
80 Ibid. 81 Ibid.

106
Figure 29. Main drift gillnet fishing grounds for salmon in northern SEAK ((traditional common property (hatched areas), terminal harvest areas ( #0), hatchery cost recovery areas ( )) (Bachman et al. 2005, 05 AAC 33.350). ADF&G Districts that overlap with the study area are indicated in color and numbered.
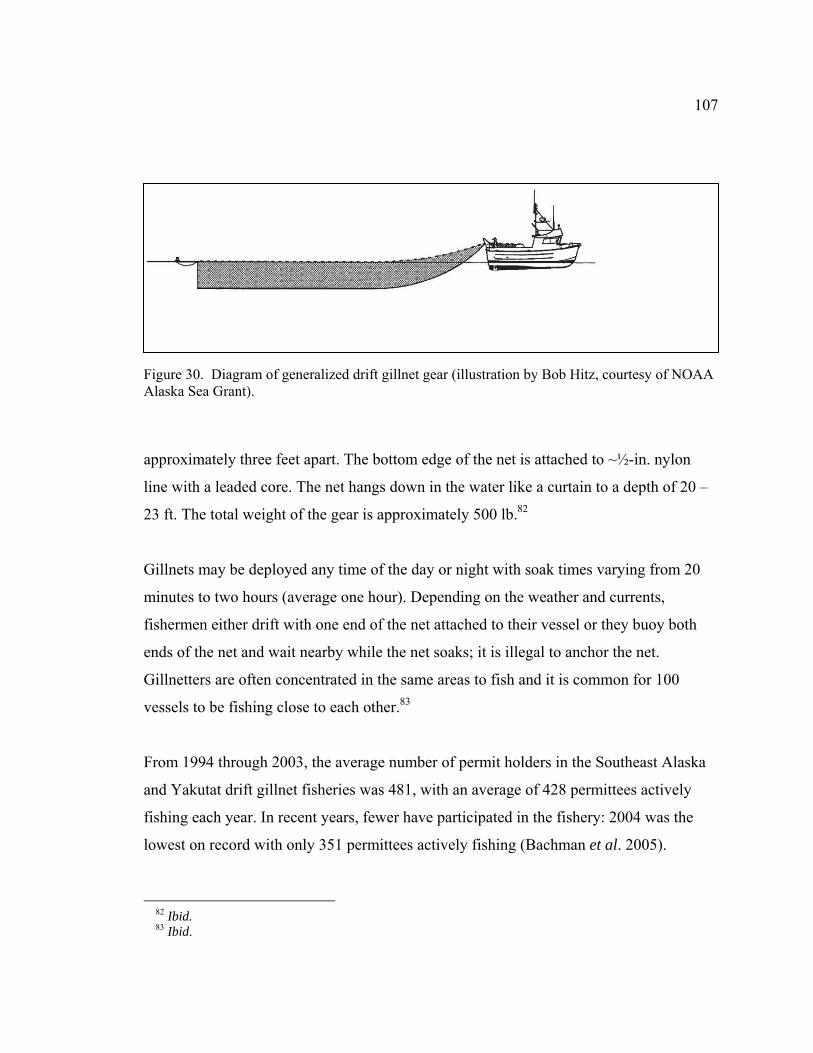
107
Figure 30. Diagram of generalized drift gillnet gear (illustration by Bob Hitz, courtesy of NOAA Alaska Sea Grant).
approximately three feet apart. The bottom edge of the net is attached to ~½-in. nylon
line with a leaded core. The net hangs down in the water like a curtain to a depth of 20 –
23 ft. The total weight of the gear is approximately 500 lb.82
Gillnets may be deployed any time of the day or night with soak times varying from 20
minutes to two hours (average one hour). Depending on the weather and currents,
fishermen either drift with one end of the net attached to their vessel or they buoy both
ends of the net and wait nearby while the net soaks; it is illegal to anchor the net.
Gillnetters are often concentrated in the same areas to fish and it is common for 100
vessels to be fishing close to each other.83
From 1994 through 2003, the average number of permit holders in the Southeast Alaska
and Yakutat drift gillnet fisheries was 481, with an average of 428 permittees actively
fishing each year. In recent years, fewer have participated in the fishery: 2004 was the
lowest on record with only 351 permittees actively fishing (Bachman et al. 2005).
82 Ibid. 83 Ibid.

108
Salmon Purse Seine Fishery
Location
Purse seining occurs widely throughout SEAK, with most openings designated as being
within two miles of shore (Fig. 31). Although purse seines may be set anywhere in the
designated open areas, most of the gear is concentrated close to shore, with
approximately 90% of the nets set within one half mile of shore.84
Season
Specific periods when the fishery is open are established by emergency order. Openings
in SEAK generally occur from June 20 through mid-October with each opening typically
lasting 8 hours – 4 days. Peak harvests generally occur from mid-July through mid-
August.85
Gear
Purse seine nets in SEAK are 900 – 1500 ft long (05 AAC 33.332) and generally hang
from the surface to a depth of 90 – 100 ft86 (Fig. 32). Seine mesh is generally black or
dark green in color and is composed of braided or twisted nylon or polyethylene twine
with a maximum legal mesh size of 4.5 in. for most of the net (05 AAC 33.332). The top
edge of the net is held at the surface of the water by a 1-in. or thicker braided floating line
attached to 8 in. to 12 in. cork floats. The bottom edge of the net is weighted with a 1-in.
to 1.5-in. line with a leaded core (the ‘lead line’). Attached to the lead line are numerous
rings through which a 2-in. line (the ‘purse line’) runs.87
84 Personal communication from Dave Gordon, ADF&G Commercial Fisheries Division, 304 Lake
Street, Rm. 103, Sitka, AK 99835, February 2006. 85 Personal communication from Michelle Masden, former commercial fisherman, PO Box 7432,
Ketchikan, AK 99901, November 2005. 86 Ibid. 87 Ibid.

109
Figure 31. Main purse seine fishing grounds for salmon in northern SEAK ((traditional common property (hatched areas), terminal harvest areas ( #0), hatchery cost recovery areas ( )).88,89,90 ADF&G Districts that overlap with the study area are indicated in color and numbered.
88 Personal communication from Dave Harris, ADF&G Commercial Fisheries Division, PO Box 240020,
Douglas, AK 99824, January 2006.

110
Figure 32. Diagram of generalized purse seine gear (illustration by Bob Hitz, courtesy of NOAA Alaska Sea Grant).
Purse seine nets are generally deployed during daylight hours.91 The net is deployed off
the stern of the fishing vessel. A skiff is used to hold one end of the net in place while the
larger vessel maneuvers to encircle the fish with the net. After the net has been deployed
for 20 – 30 mins, the purse line is tightened which closes the bottom of the net (Johnson
and Byers 2003).92 The purse line is made of floating line and is generally orange in
color. The total weight of the gear is approximately 8,000 – 10,000 lb.93
From 1994 through 2003, the average number of permit holders in the Southeast Alaska
and Yakutat purse seine fisheries was 416, with an average of 347 permittees actively
89 Personal communication from Dave Gordon, ADF&G Commercial Fisheries Division, 304 Lake
Street, Rm. 103, Sitka, AK 99835, February 2006. 90 Personal communication from Troy Thynes, ADF&G Commercial Fisheries Division, PO Box 667,
Petersburg, AK 99833, February 2006. 91 Ibid. 92 Ibid.
93 Ibid.

111
fishing each year (Bachman et al. 2005). In recent years, fewer have participated in the
fishery: 2004 was the lowest on record with only 211 permittees actively fishing
(Bachman et al. 2005).
Halibut and Sablefish Longline Fisheries
Location
Halibut are harvested with longlines throughout SEAK, typically in water depths of 60 –
1200 ft94 (Fig. 33), while sablefish are harvested from deeper waters (Fig. 34) with most
of the inshore catch in northern SEAK coming from Chatham Strait (Richardson and
O’Connell 2004) in waters below 900 ft.95 Sablefish are also harvested offshore in the
eastern Gulf of Alaska, primarily in water depths of 1,500 – 2,400 ft.96
Season
From the late 1960s through 1976, the halibut longline fishery was generally open from
May to September. Beginning in 1977, the season was limited to four openings totaling
73 days. In subsequent years, the season was progressively shortened as the number of
vessels and the efficiency of the fleet increased. Between 1980 and 1994 the season
evolved into a “derby”-like fishery with annual openings totaling 2 – 10 days divided
primarily across the months of May, June and September.97 The inshore northern SEAK
sablefish longline fishery followed a similar trend. In the 1960s and 1970s, the season
opened between mid-August and mid-September and closed between mid-October and
mid-November. However, beginning in the late 1970s, the season was progressively
shortened as the number of vessels and the efficiency of the fleet increased. The number
of vessels participating in the fishery peaked in the late 1980s and between 1987 and
94 Personal communication from Paul Barnes, commercial fisherman, PO Box 155, Gustavus, AK 99826,
November 2005. 95 Personal communication from Vince Shafer, commercial fisherman, PO Box 172, Gustavus, AK
99826, December 2005. 96 Ibid. 97 IPHC unpublished data.

112
Figure 33. Main longline fishing grounds for halibut in northern SEAK (hatched areas).98 IPHC statistical areas that overlap with ADF&G Districts 9 – 14 are indicated and numbered.
98 Personal communication from Vince Shafer, commercial fisherman, PO Box 172, Gustavus, AK 99826, December 2005.

113
Figure 34. Main longline fishing grounds for sablefish in northern SEAK (hatched areas).99,100 ADF&G groundfish statistical areas that overlap with ADF&G Districts 9 – 14 are indicated and numbered.
99 Ibid.

114
1993 the fishery was open annually for just 24 hours in September (Richardson and
O’Connell 2004).
In 1995, the Alaskan Individual Fishing Quota System (IFQ) was implemented for both
the halibut and the sablefish fisheries. This eliminated very short, derby-style fisheries,
and created an extended 8.5 month season which begins in late February or early March
and ends in mid November each year.
In addition, in 2003 a subsistence halibut program was implemented in Alaska,
authorizing eligible persons to fish for halibut year-round in SEAK using various gear
types, including longlines.
Gear
A longline consist of 1800 ft lengths of groundline; each length is called a ‘skate’ (Fig.
35). Each skate has 75 – 100 hooks attached via shorter lines called gangions, which are
either tied or snapped to the groundline. The total weight of a skate is approximately 60
lb.101 A “set” typically consists of 5 – 10 baited skates tied together and laid on the ocean
bottom for a total length of 3,000 – 6,000 ft per set, with an anchor and a surface buoy
attached at each end.102 The groundline is typically 5/16-in. to 3/8-in. sinking line (e.g.,
leaded polypropylene or nylon).103,104,105 The weight of each anchor varies from 30 to 75
lb.106 The hooks on the groundline are spaced approximately 10 – 20 ft apart for halibut
100 Personal communication from Victoria O’Connell, ADF&G Commercial Fisheries Division, 304
Lake Street, Rm. 304, Sitka, AK 99835, February 2006. 101 Personal communication from Paul Barnes, commercial fisherman, PO Box 155, Gustavus, AK
99826, November 2005. 102 Personal communication from Vince Shafer, commercial fisherman, PO Box 172, Gustavus, AK
99826, October 2005. 103 Ibid. 104 Personal communication from Paul Barnes, commercial fisherman, PO Box 155, Gustavus, AK
99826, November 2005. 105 Personal communication from Pedr Turner, commercial fisherman, PO Box 217, Gustavus, AK
99826, November 2005. 106 Ibid.

115
Figure 35. Diagram of generalized longline gear (illustration by Bob Hitz, courtesy of NOAA Alaska Sea Grant).
and 4 – 6 ft apart for sablefish. Soak times vary from 6 – 24 hours for halibut and from
6 – 12 hours for sablefish.107
Surface buoy line is typically 5/16-in. to 3/8-in. sinking line (e.g., nylon).108,109,110 The
buoy line is typically composed entirely of sinking line, but it may be a combination of
sinking and floating line spliced together. In the latter case, sinking line is used in the
upper part of the water column and floating line is used in the lower part of the water
column leading to the anchor.111 The number of surface buoys used to mark each end of
a set varies from two to five (or more) depending on the current and other local
conditions. Often a combination of inflated poly buoy(s) approximately two feet in
107 Personal communication from Vince Shafer, commercial fisherman, PO Box 172, Gustavus, AK 99826, October 2005.
108 Ibid. 109 Personal communication from Paul Barnes, commercial fisherman, PO Box 155, Gustavus, AK
99826, November 2005. 110 Personal communication from Pedr Turner, commercial fisherman, PO Box 217, Gustavus, AK
99826, November 2005.
111 Personal communication from Vince Shafer, commercial fisherman, PO Box 172, Gustavus, AK 99826, October 2005.

116
diameter and smaller hard plastic buoys are used.112 Typically, a set has two buoy lines
(one at each end of the set); only rarely is a single buoy line used.113 All buoys must be
labeled with the ADF&G license number of the vessel operating the gear (05 AAC
28.050, 05 AAC 28.051).
112 Ibid. 113 Personal communication from Paul Barnes, commercial fisherman, PO Box 155, Gustavus, AK
99826, November 2005.
117
Appendix 3
Humpback Whale Photo Catalogs Used for Individual Identification
CARTWRIGHT, R. Unpublished data. Keiki Kohola Project. Department of Biology, California State University – Channel Islands, One University Dr., Camarillo, CA 93012.
DARLING, J. D. 1991. Humpback Whales in Japanese Waters (Ogasawara and
Okinawa) Fluke Identification Catalogue 1987-1990. World Wide Fund for Nature Japan, Minato-ku, Tokyo, Japan.
JACOBSEN, J. Unpublished data. Department of Biological Sciences, Humboldt State
University, PO Box 4492, Arcata, CA 95518. JURASZ, C. M., AND V. P. PALMER. 1981. Censusing and establishing age
composition of humpback whales (Megaptera novaeangliae), employing photodocumentation in Glacier Bay National Monument, Alaska. Report to the National Park Service, Anchorage, AK, 42 pp.
NATIONAL MARINE MAMMAL LABORATORY. Unpublished data. 7600 Sand
Point Way NE, Seattle, WA 98115. PACIFIC BIOLOGICAL STATION. Photographic Catalogue of Humpback Whales in
British Columbia (http://www-sci.pac.dfo-mpo.gc.ca/sa/cetacean/humpbackwhale/default_e.htm), Cetacean Research Program, Pacific Biological Station, 3190 Hammond Bay Rd., Nanaimo, BC V9T 6N7.
PERRY, A., C. S. BAKER, AND L. M. HERMAN. 1985. The natural history of
humpback whales (Megaptera novaeangliae) in Glacier Bay. Final Report to the National Park Service, Alaska Regional Office, Anchorage, AK, 41 pp.
PERRY, A., J. R. MOBLEY, JR., C. S. BAKER AND L. M. HERMAN. 1988.
Humpback whales of the central and eastern North Pacific. University of Hawaii Sea Grant Miscellaneous Report UNIHI-SEAGRANT-MR-88-02, 236 pp.
SHARPE, F. Unpublished data. Alaska Whale Foundation, 4739 University Way NE
#1239, Seattle, WA 98105.

118
STRALEY, J. M., AND C. M. GABRIELE. 2000. Humpback Whales of Southeastern Alaska. Humpback whale fluke identification catalog (3rd printing), National Park Service, PO Box 140, Gustavus, AK.
UCHIDA, S., AND N. HIGASHI. 1995. Fluke Identification Catalogue of Humpback
Whales in Japanese Waters off Okinawa 1991-1995. Okinawa Expo Aquarium, Motobu-Cho, Okinawa, Japan 905-03.
VON ZIEGESAR, O., B. GOODWIN AND R. DEVITO. 2004. A catalog of humpback
whales in Prince William Sound Alaska 1977-2001, Eye of the Whale Research, PO Box 15191, Homer, AK 99603.