


Human-specific Regulation of Alpha2-6 linked Sialic Acids 2 SUMMARY Many microbial pathogens and...
33
September 17, 2003 Human-specific Regulation of Alpha2-6 linked Sialic Acids Pascal Gagneux#, Monica Cheriyan, Nancy Hurtado-Ziola Els C.M. Brinkman van der Linden##, Dan Anderson*, Harold McClure*, Ajit Varki and Nissi M. Varki** Glycobiology Research and Training Center, Departments of Medicine and Cellular and Molecular Medicine, University of California San Diego, La Jolla, California 92093-0687, U.S.A., *Yerkes National Primate Research Center, Emory University, Atlanta, Georgia 30329 Running title: alpha 2-6 linked Sias in Humans # Current address, Center for Research on Endangered Species, The San Diego Zoo ## Current address, Neose Technologies, Inc, San Diego , California **Address correspondence to: Nissi M. Varki UCSD School of Medicine La Jolla, CA 92093-0687 Phone: (858) 534-4933 Fax: (858) 534-5611 Email: [email protected] JBC Papers in Press. Published on September 18, 2003 as Manuscript M309813200 Copyright 2003 by The American Society for Biochemistry and Molecular Biology, Inc. by guest on July 10, 2018 http://www.jbc.org/ Downloaded from
Transcript of Human-specific Regulation of Alpha2-6 linked Sialic Acids 2 SUMMARY Many microbial pathogens and...
September 17, 2003
Human-specific Regulation of Alpha2-6 linked Sialic Acids
Pascal Gagneux#, Monica Cheriyan, Nancy Hurtado-Ziola
Els C.M. Brinkman van der Linden##, Dan Anderson*,
Harold McClure*, Ajit Varki and Nissi M. Varki**
Glycobiology Research and Training Center,
Departments of Medicine and Cellular and Molecular Medicine,
University of California San Diego, La Jolla, California 92093-0687, U.S.A.,
*Yerkes National Primate Research Center, Emory University, Atlanta, Georgia 30329
Running title: alpha 2-6 linked Sias in Humans
# Current address, Center for Research on Endangered Species, The San Diego Zoo
## Current address, Neose Technologies, Inc, San Diego , California
**Address correspondence to:
Nissi M. Varki
UCSD School of Medicine
La Jolla, CA 92093-0687
Phone: (858) 534-4933
Fax: (858) 534-5611
Email: [email protected]
JBC Papers in Press. Published on September 18, 2003 as Manuscript M309813200
Copyright 2003 by The American Society for Biochemistry and Molecular Biology, Inc.
by guest on July 10, 2018http://w
ww
.jbc.org/D
ownloaded from

2
2
SUMMARY
Many microbial pathogens and toxins recognize animal cells via cell surface sialic acids
(Sias) that are a2-3- or a2-8-linked to the underlying glycan chain. Human influenza A/B
viruses are unusual in preferring a2-6-linked Sias, undergoing a switch from a2-3 linkage
preference during adaptation from animals to humans. This correlates with expression of a2-6-
linked Sias on ciliated human airway epithelial target cells, and of a2-3-linked Sias on secreted
soluble airway mucins, which are unable to inhibit virus binding. Given several known
differences in Sia biology between humans and apes, we asked if this pattern of airway epithelial
Sia linkages is also human-specific. Indeed, we show that since the last common ancestor with
apes, humans underwent a concerted bidirectional switch in a2-6-linked Sia expression between
airway epithelial cell surfaces and secreted mucins. This can explain why the chimpanzee
appears relatively resistant to experimental infection with human Influenza viruses. Other
tissues showed additional examples of human-specific increases or decreases in a2-6-linked Sia
expression, and only one example of a change specific to certain great apes. Furthermore, while
human and great ape leukocytes both express a2-6-linked Sias, only human erythrocytes have
markedly up-regulated expression. These cell-type specific changes in a2-6-Sia expression
during human evolution represent another example of a human-specific change in Sia biology.
Since the data set involves multiple great apes, we can also conclude that Sia linkage expression
patterns can be conserved during millions of years of evolution within some vertebrate taxa,
while undergoing sudden major changes in other, closely related ones.
by guest on July 10, 2018http://w
ww
.jbc.org/D
ownloaded from

3
3
INTRODUCTION
Mammalian cells are covered by a dense glycocalyx consisting of glycolipids,
glycoproteins and proteoglycans. Many of these glycoconjugates carry glycan chains
terminating with sialic acids (Sias) 1, a family of acidic 9-carbon sugars that are prominently
expressed in animals of the deuterostome lineage (1, 2). By virtue of forming the “canopy” of
the glycocalyx, Sias are recognized and used as attachment sites by a large number and wide
variety of microbial pathogens and their toxins. Many Sia-binding proteins of different
pathogens have been well characterized, and generally show a high degree of specificity for
different types of Sias and/or their linkage to the underlying glycan chain (1-5).
Perhaps partly because of the selection pressure exerted by such pathogens, the
expression of Sias is highly regulated. Different cell and tissue types show marked differences in
abundance, types and linkages of Sias. About 20 different sialyltransferases attach Sias to
glycans via a2-3, a2-6, or a2-8 linkages (6-8). These linkages are often critical determinants for
recognition by the Sia-binding proteins of pathogens. In general, most pathogen Sia-binding
proteins seem to prefer a2-3-linked Sias, and some prefer the a2-8 linkage (2, 3). Curiously, the
human influenza A and B viruses are among rare examples of pathogens with known preference
for a2-6 linked Sias (9). Notably, the few other microbes in which direct or indirect evidence
suggests this type of linkage preference are also human pathogens or commensals: human
coronavirus OC43 (5); Polyoma virus JC (10); Adeno-associated virus serotype 5 (11); and
Streptococcus mutans (12).
Influenza A and B viruses cause non-lethal gastrointestinal infections in wild waterfowl.
Co-mingling of domestic fowl, pigs and humans facilitates evolution of human-adapted viruses
by guest on July 10, 2018http://w
ww
.jbc.org/D
ownloaded from

4
4
from avian reservoirs, generating influenza epidemics and pandemics (13). In contrast to human
influenza viruses, avian and other mammalian influenza isolates prefer a2-3-linked Sias (14).
Adaptation of animal influenza viruses to humans correlates with point mutations changing
certain amino acids that switch the Sia linkage specificity from a2-3 to a2-6 (15), with the pig
potentially acting as an intermediate reservoir (14). The reverse switch in linkage specificity
occurs when human isolates are adapted for growth in the amniotic compartment of hen’s eggs
(13, 16). The detection of a2-6-linked Sias on the upper airway epithelial brush border of
humans (17) is consistent with all of the above information, as is the presence of a2-6-linked
Sias on the upper airway epithelium of ferrets (the only effective mammalian model for human
influenza infection) (18). An additional reason for human influenza susceptibility lies in the
selective expression of a2-3-linked Sias in the goblet cells that secrete mucins into the human
upper airway lumen (17, 19). These soluble mucins are unable to adsorb out the a2-6-Sia
binding human viruses before they reach and infect the airway epithelial cells.
The closest living evolutionary relatives of humans are the great apes (chimpanzee,
bonobo, gorilla and orangutan), which share 97-99% DNA sequence identity in alignable
sections of the gene-rich/non-repetitive regions of the genome (20-23). This genetic similarity is
reflected in the rarity of documented biochemical or structural differences amongst these species.
For example, with respect to soluble plasma proteins of humans and great apes, there are
remarkably few differences in overall glycosylation, including the extent of Sia addition (24).
However, among the few documented functional genomic differences between humans and great
apes, two affect Sia biology: an exon deletion in the CMAH gene explaining lack of expression
of the Sia N-glycolylneuraminic acid (Neu5Gc), in humans (25), and a point mutation
eliminating the Sia binding property of human Siglec-L1 (26). Another consequence of the
by guest on July 10, 2018http://w
ww
.jbc.org/D
ownloaded from

5
5
human CMAH loss is an excess of the Sia N-acetylneuraminic acid (Neu5Ac), the precursor for
Neu5Gc (27). This in turn causes a marked increase in ligands for sialoadhesin/Siglec-1 on
human cells, possibly explaining a human-specific difference in the expression and distribution
of this Neu5Ac-preferring lectin on macrophages (28). Our group has also recently found some
other differences in sialic acid biology between humans and great apes (unpublished). Given
less than 100 known genes involved in biosynthesis, transfer, metabolism and recognition of
Sias, it is surprising to find so many differences in Sia biology between humans and great apes.
This prompted us to ask if there are uniquely human features in the expression pattern of a2-6
linked Sias. In initiating this organism-wide exploration of human:great ape Sia linkages we also
wished to ask how much change in Sia linkage expression has occurred during ~13-14 million
years of great ape and human evolution. Such data are currently not available for any such well-
defined clade of related vertebrates.
EXPERIMENTAL PROCEDURES
Lectin histochemistry on tissue sections - Archival paraffin-embedded human tissue sections
were from the University of California San Diego Histology Resource. Archival paraffin blocks
containing great ape tissues samples were from the Yerkes Primate Center. Biotinylated lectins
were from Vector laboratories (Burlingame, CA): Sambuccus nigra Agglutinin (SNA)
recognizes a2-6-linked Sias and Maackia amurensis Hemagglutinin (MAH, also sometimes
called MAL-II) recognizes a2-3 linked Sias (29). Ulex europeaus Agglutinin (UEA) which
recognizes a1-2-fucosylated linkages was used as a positive control for the staining procedure
because these linkages are found on the vasculature of humans and great apes. Thus, positive
staining of the vasculature generally denotes that the tissue was optimally preserved, fixed and
processed, and suitable for use in the analyses.
by guest on July 10, 2018http://w
ww
.jbc.org/D
ownloaded from

6
6
Paraffin-embedded formalin-fixed, tissue sections mounted on glass slides were
deparaffinized, blocked with BSA to prevent spurious staining, and incubated with biotinylated
lectins, appropriately diluted in 1% bovine serum albumin/TBS for 30 minutes, followed by
washing with 0.1% Tween 20 in TBS. Lectin binding was detected using appropriately diluted
alkaline phosphatase labeled streptavidin, followed by washes. Color was developed using
Vector Blue substrate (Vector Laboratories) and nuclei were counter-stained using nuclear fast
red. Slides were cover slipped in aquamount mounting media and viewed using bright field
illumination with a Zeiss microscope. Digitized images were captured with a 3 chip CCD Sony
DKC-5000 Digital Photo Camera using NIH Image software and Adobe Photoshop. Pictures
were examined by a minimum of two different investigators. Treatment with Arthrobacter
ureafaciens sialidase (AUS, Calbiochem, San Diego, CA) was used to control for the Sia-
specific binding of SNA and MAH. Incubation of sections with 2mM sodium periodate to
truncate Sia side chains was also used to confirm specificity of SNA binding (29).
Agglutination of Human and Chimpanzee red blood cells - A fusion protein of Siglec-2 (CD22)
and Human Ig Fc region known to only bind to a2-6-linked Sias was used for human and
chimpanzee red cell agglutination assays (28). Siglec-2-Fc was added in serial dilutions (0.5 – 5
mg in PBS) to wells of round-bottomed 96-well plates. To each well was then added, 25 ml 0.5%
fixed red blood cell suspension from each of two human subjects or from 3 chimpanzees. The
plates were incubated for one hour at room temperature and then observed for agglutination.
Flow Cytometry Analysis – Chimpanzee red cells and leukocytes were isolated from fresh blood
samples collected in EDTA and shipped overnight on ice from the Yerkes Primate Center. Fresh
bonobo blood from the Zoological Society of San Diego was transported on ice and stored
overnight. To assure comparability, human blood samples were collected locally at about the
by guest on July 10, 2018http://w
ww
.jbc.org/D
ownloaded from

7
7
same time, and stored overnight on ice, awaiting arrival of the ape samples. Leukocytes were
prepared from whole blood (30) by PBS wash and two consecutive steps of erythrocytes lysis in
5 volumes of ACK buffer (150mM NH4Cl, 10mM KHCO3, 0.1mM EDTA, pH 7.2). Cells (0.3-1
x 106) were stained for 1 hour at 4°C with Phycoerythrin-conjugated SNA or MAH (5 mg/ml)
and for leukocytes with cell type specific markers (Cy5 conjugated Mabs: CD14 for monocytes,
CD13 for monocytes/granulocytes, CD3 or CD19 for lymphocytes). In some experiments, the
lectin was replaced with Siglec-2-Fc (10 mg/ml) that had been pre-incubated (at least 15 min at
4°C) with 100x diluted phycoerythrin-conjugated goat F (ab’)2 anti-human IgG (dilution
optimized for the batch of secondary antibody). Following washing, cells were resuspended in
PBS, and immediately analyzed on a FACSCalibur (BD Biosciences Immunocytometry
Systems). Controls to show dependence on Sia for lectin or Siglec binding included prior
treatment with mild periodate (31) - or sialidase (AUS) treatment following established
protocols.
ELISA for quantitation of a2-3 and a2-6 linked sialic acids on plasma Proteins. Human plasma
samples from EDTA anti-coagulated blood of 8 human volunteers (with IRB approval) were
stored frozen at –80°C. Great ape blood samples (9 chimpanzees, 5 bonobos, 7 gorillas, and 6
orangutans) were collected in EDTA at the Yerkes Primate Center and shipped on ice to the
laboratory where plasma was collected after centrifugation and then stored at –80°C. Samples
were diluted to concentrations of approx 3 mg/ml (corresponding to a 1:1000 dilution for most
samples, giving saturation of binding sites on the wells). Diluted samples were coated on Costar
ELISA plates in triplicate overnight at 4°C. The plate was washed 4 times with TBS and then
blocked for one hour with freshly made TBST. Plates were then incubated for 2 hours with
biotinylated SNA or MAH (each diluted 1:10,000), washed four times with TBST and then
by guest on July 10, 2018http://w
ww
.jbc.org/D
ownloaded from

8
8
incubated at room temperature with alkaline phosphatase conjugated Streptavidin at 1:1000
dilution for one hour. Plates were developed with AP substrate for 15 minutes and absorption
readings taken at 405 nm.
RESULTS
Unlike humans, great apes do not express high levels of a2-6 linked sialic acids on airway
epithelial cells. - As indicated in Table A (see Supplemental Data), a large number of samples
(295), comprising many different tissue types from humans and all the great apes were analyzed
using lectin histochemistry. The most striking difference between humans and great apes was
evident in the epithelium lining of the trachea and lung airways. All eleven samples of human
trachea and lung samples showed intense SNA lectin staining of the cilia and their basal bodies,
at the lumenal edge of the bronchiolar epithelial cells, indicating the presence of a2-6 linked
sialic acids (See Figure 1 for an example). In contrast, SNA staining was not observed in the
trachea or lung airways from Chimpanzees, Gorillas or Orangutans (see Figure 1 for examples).
Interestingly, similar findings were made in the mouse (Figure 1), which is not a good host for
human influenza viruses, unless subjected to multiple rounds of adaptation. False negatives were
ruled out by virtue of positive staining in endothelia and stroma of the same great ape tissue
sections. Three of ten chimpanzee trachea samples showed occasional epithelial edge staining.
However, these particular samples had some underlying inflammation, during which
upregulation of a2-6 linked sialylation is known to occur in some other tissues (32, 33). Thus,
human (and not great ape) bronchial epithelial cells preferentially express a2-6 linked Sias at
their ciliated borders.
Goblet cells and secreted mucins show an inverse staining pattern-The lumen of airways
contains heavily sialylated soluble mucins, which are secreted by specialized epithelial goblet
by guest on July 10, 2018http://w
ww
.jbc.org/D
ownloaded from

9
9
cells that are interspersed amongst the columnar epithelial cells. The number of such goblet cells
can vary considerably amongst different samples. In keeping with prior reports (18), we noted
that in human samples in which goblet cells were seen, almost all did not stain strongly with
SNA (see Figure 1 for an example). In contrast, those ape samples in which goblet cells were
seen showed intense staining with SNA in six of seven samples, indicating abundant a2-6-
linked Sias. Similar SNA staining of secreted mucin in the lumen of ape samples was detected in
some instances (data not shown). Thus, sometime after the last common ancestor with
chimpanzees and bonobos, human airway epithelium underwent a concerted switch in expression
of a2-6-linked Sias, with the ciliary border of the columnar epithelium strongly up-regulating
this structure, and the goblet cells and secreted mucins down regulating it.
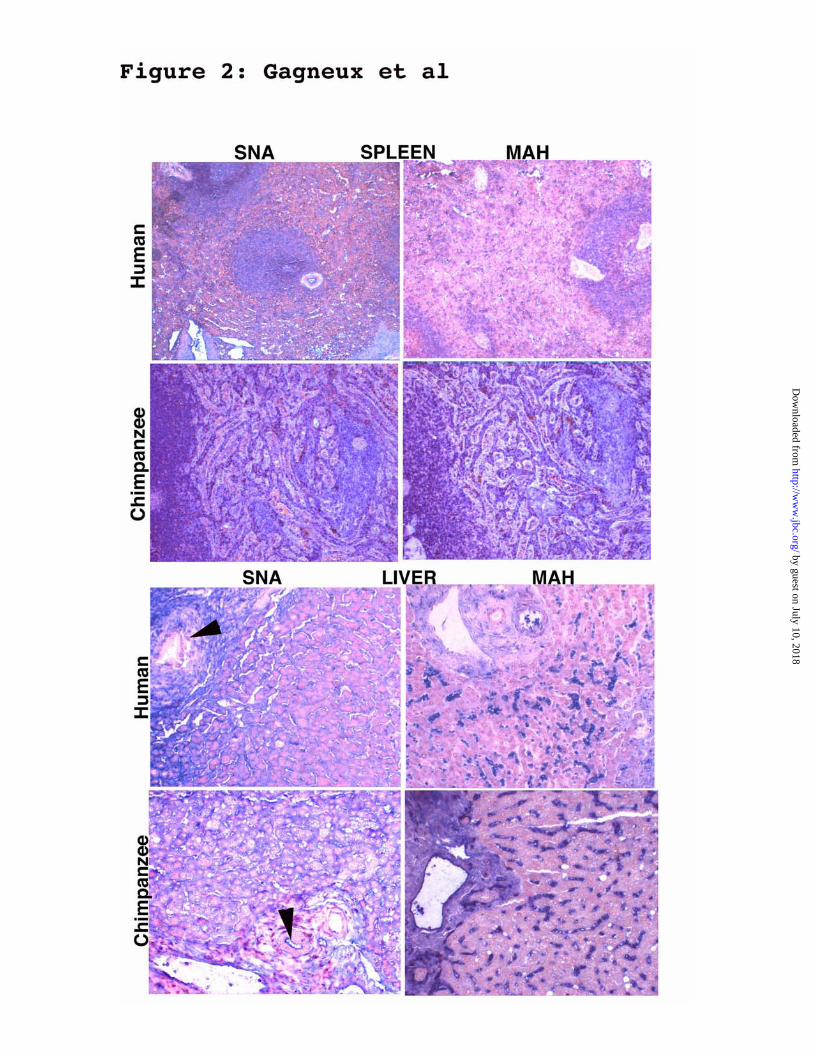
Other human-specific differences in tissue expression of a2-6-linked Sias. - As shown in the
examples in Figure 2 and detailed in Table 1, some tissues other than trachea/lung showed
consistent differences between humans and great apes. In human skin, the SNA lectin bound to
secretions in eccrine sweat glands. This was not seen in samples from the great apes, except for
one orangutan sample. In all samples from great apes (but not humans), the SNA lectin bound
strongly to the stromal elements in the spleen (splenic cords), in addition to binding to lymphoid
follicles and vessels (Figure 2). In liver samples from most great apes (but not humans), the
SNA lectin bound strongly to the luminal edges of the bile ducts in the portal triads (Figure 2).
In ileal samples from some great apes (but not humans), the SNA lectin highlighted the external
longitudinal muscular layer of the muscularis externa. Pancreatic islet cell staining was seen
only in the gorilla and orangutan samples. The human prostate samples showed intense MAH
staining of myoepithelial cells (below the epithelial cell layer), which was not seen in
corresponding great ape samples. In other tissues such as the ovary, testes, tonsils and appendix,
by guest on July 10, 2018http://w
ww
.jbc.org/D
ownloaded from

10
10
the SNA lectin bound to supporting stroma more intensely in the great ape tissues than in
corresponding human samples (data not shown). Overall, the increased expression of a2-6-
linked Sias on human upper airway epithelial cells is accompanied by similar up-regulation on
skin eccrine gland secretions. In contrast, the same structure appears markedly down regulated in
several human tissues such as splenic cords, liver bile ducts, ileal smooth muscle, ovary, testes,
appendix, tonsils, and skin. Thus, we present evidence for multiple changes in a2-6-Sia linkage
expression (up and down regulation) occurring specifically in humans. In contrast, the
expression pattern of a2-6-linked Sias has remained relatively unchanged through 13+ million
years of evolution of the great apes, with the exception of pancreatic islet cells, where a2-6-
sialylation was apparently turned off in the chimpanzee-human-bonobo clade after their common
ancestor with the gorilla and organutan.
Analysis of blood cells also shows human-specific expression pattern of a2-6 linked sialic acids -
Flow cytometry of erythrocytes using fluorescently labeled lectins showed that human but not
chimpanzee or bonobo erythrocytes are strongly positive for a2-6-linked Sia (see Figure 3B for
representative example, note that the X-axis is a log scale). Also, while >95% of erythrocytes
are strongly positive in humans, only 40-68% of chimpanzee and 18-28% of bonobo erythrocytes
are weakly positive. This indicates that the change in the upper airway epithelia is at least
partially mirrored in cells of the erythroid lineage. In contrast, peripheral blood leukocytes
showed comparably high levels of a2-6-linked Sia in humans, chimpanzees and bonobos (see
Figure 3A).
Plasma proteins show a chimpanzee-specific increase in a2-3 linked sialic acids - Most plasma
proteins carry N-glycans that terminate in a2-3 and/or a2-6 linked Sias. The total amount of
plasma proteins and the amount of Sias per mg protein are similar amongst humans and all the
by guest on July 10, 2018http://w
ww
.jbc.org/D
ownloaded from

11
11
great ape plasma samples (unpublished data). ELISAs on human and great ape plasma proteins
revealed that all five species show similar levels of SNA binding (Figure 4). However, while
human, bonobo, gorilla, and orangutan plasma samples show no statistically significant
differences in MAH binding, chimpanzees have uniquely up-regulated binding of this lectin
(Figure 4). Since plasma glycoproteins come primarily from plasma cells (immunoglobulins) and
liver hepatocytes (most other glycoproteins), this result suggests that chimpanzee hepatocytes
and/or plasma cells have increased activity of one or more a2-3 sialyltransferase(s), and that this
change occurred after the common ancestor with the bonobo.
DISCUSSION
Sias have been shown to be essential for the development of the mouse embryo (34).
However, they are also known to be targets for a wide variety of microbial pathogens and toxins.
Thus, despite the highly conserved nature of mammalian sialic acid biosynthesis pathways and
sialyltransferase gene sequences, the tissue- and cell-type specific patterns generated by
differential and combinatorial expression of these enzymes may be an important mechanism for
rapid, pathogen-driven host evolution. (35, 36). Here we have investigated the Sia linkage type
on most major tissues and cell types of humans, in comparison with our closest evolutionary
relatives, the great apes. The most obvious and striking difference was found in the airway
epithelial cells, where only humans prominently up-regulated a2-6-linked Sias on the ciliary
border of columnar epithelial cells, even while down-regulating expression of the same structure
in goblet cells and secreted mucins. This pattern of Sia linkage expression has been implicated
in the adaptation of influenza viruses to infection of humans (15, 37).
Although circulating antibodies indicate that chimpanzees are exposed to human
Influenza A in captivity (38), there are no reports of symptomatic influenza illnesses in these
by guest on July 10, 2018http://w
ww
.jbc.org/D
ownloaded from

12
12
closest evolutionary relatives. Indeed, in the few published reports of experimental infection,
very high virus titers delivered directly into the trachea of chimpanzees did not result in
symptomatology, despite some evidence of virus replication (39-41). This lack of symptoms is
surprising, given that chimpanzees are genetically so similar to humans. We suggest that this
apparent attenuation of human influenza infection in chimpanzees is most likely due to the
absence or low amounts of the receptor (a2-6-linked Sia) on their target respiratory epithelia, as
well as the abundance of the same structure on secreted mucins. Such mucins can act as soluble
decoy for the virus, adsorbing it before it can reach the target cell surfaces.
We also address the general question of how much change in overall sialylation patterns
occurs over millions of years of vertebrate evolution, i.e., the 13+ million years since the last
common ancestor of great apes and humans (42). Our results indicate that while the expression
pattern of a2-6-linked Sias has remained largely conserved during the independent evolution of
the four great ape species, several changes have occurred during human evolution. Taken
together with the other human-specific changes in Sia biology (see introduction, and discussion
below), this suggests that the human lineage underwent one or more selective sweeps driven by
Sia-binding pathogens.
If changes in externally exposed Sia residues are being driven by exposure to Sia-binding
pathogens, one might expect internal structures to exhibit fewer changes between species, due to
less direct interaction with pathogens. However, the sub-epithelial stroma should be in an
intermediate position, as it is the next target following epithelial invasion by a Sia-binding
pathogen. The question arises whether up-regulation of a structure in certain epithelia
accompanied by down-regulation of the same structure in nearby stroma could allow the
organism to generate spatial heterogeneity of receptor molecules to impede rapid systemic spread
by guest on July 10, 2018http://w
ww
.jbc.org/D
ownloaded from

13
13
of Sia-binding pathogens. This possibility is partially supported by our findings that stroma
appears positive for SNA in all hominoid species.
Once a Sia-binding pathogen has invaded past an epithelial surface and the surrounding
stroma, it can enter the bloodstream. Here, it would interact with four general classes of Sia-
bearing endogenous molecules – erythrocyte, leukocyte and endothelial cell surface glycans;
and, soluble plasma proteins. With regard to erythrocytes, humans again appear to be unusual in
strongly expressing a2-6-linked Sias (Figure 3B). This fits with our prior suggestion that these
non-nucleated cells can act as a “sink” to adsorb away viral agents such as human influenza A,
that cannot proliferate in them (35). With regard to plasma proteins, it appears that chimpanzees
are the unusual species, having an increased level of a2-3-linked-Sias (Figure 4). Again, it is
presumed that these species-specific differences were selected by the regime of Sia-binding
pathogens encountered in their past. Interestingly, endothelial cells in the vasculature of all
hominoids appear to carry similar amounts of a2-6-linked-Sias (data not shown).
Ultimately, these changes reflect the consequence of altered action of sialyltransferases,
the Golgi enzymes that attach Sia in different linkages to glycoconjugates destined for the cell
surface or the extra-cellular milieu (6-8). The increase in the common a2-6 linkage of Sia to
Galactose on N-glycan side chains likely explains changes in SNA-staining in human cells. This
Siaa2-6Gal structure is produced primarily by the enzyme ST6Gal-I, which is encoded by the
highly conserved mammalian gene SIAT1 (43, 44). Although a second ST6Gal isozyme has
been recently reported, it is only expressed in the brain (45). The expression of the SIAT1 gene
is controlled by multiple promoter-driven alternatively spliced non-coding exons spanning a
large genomic region upstream of the SIAT1 gene (46). Apart from such spatial regulation of
ST6Gal-I in different tissues (47), there is also well-documented temporal regulation. In
by guest on July 10, 2018http://w
ww
.jbc.org/D
ownloaded from

14
14
mammals, transient up-regulation occurs during acute phase reaction when the organism
experiences trauma or infection (32, 33). This up-regulation ceases when the trauma or infection
is resolved.
Altered regulation of the SIAT1 gene seems a logical explanation for the Human:Ape
differences presented here. Future studies need to determine the nature and content of the
ST6Gal-I mRNAs in tissues from humans and great apes. This task is rendered difficult by the
very limited availability of fresh non-fixed great ape tissues, and by the very low levels of
ST6Gal-I mRNAs in cells (we were unable to isolate full-length cDNAs from the few frozen ape
lung samples available to us). Another difficulty is the very complex promoter region of SIAT1
– which stretches over 160kb of chromosome 3, including several 5’ non-coding exons
alternatively transcribed to form highly regulated tissue-specific mRNAs (48). Furthermore, the
same tissue may contain mRNAs from different cell types that are showing different levels of
up-regulation or down-regulation (e.g., the ciliary epithelial versus goblet cells in the airway
epithelium). On the other hand, it is difficult to carry out in situ hybridization studies on the
limited samples available, without knowing which of the many types of mRNAs might be
present.
While mice that are experimentally rendered null for several of the a2-3
sialyltransferases show compensatory sialylation due to the activity of related isozymes (49),
ST6Gal-I null mice (50) completely lack Sia a2-6 linked to galactose (44). Despite this, they are
viable and fertile and show only impaired B-cell function (that may be due to the loss of ligands
for CD22/Siglec-2)(50). Thus, it remains a mystery why the sialylated structure produced by
ST6Gal-I is so privileged as compared to the other related Sia-containing structures. In this
regard, the selective forces responsible for the human-specific Sia linkage changes are also
by guest on July 10, 2018http://w
ww
.jbc.org/D
ownloaded from

15
15
unknown. Regardless, these changes could be responsible for other disease susceptibility or
phenotypic differences between great apes and humans.
At present, it is also not possible to determine if this difference in Sia biology between
humans and great apes is functionally related to all the other changes reported to date: human
CMAH gene inactivation and loss of Neu5Gc (51); the resulting excess of Neu5Ac; a point
mutation eliminating Sia binding by human Siglec-L1 (26); human-specific increase in ligands
for sialoadhesin/Siglec-1 (28); and the change in expression and distribution of this Neu5Ac-
preferring lectin on macrophages (28). Given that the human genome contains less than 60
known genes directly involved in Sia biology (52), it is reasonable to speculate that these are all
related changes, and that they represent the signature of one or more serious infectious
challenges faced by our hominid ancestors sometime before the common origin of modern
humans, about 100-200 thousand years ago. It also remains to be seen if these differences are
relevant to any other current-day human-specific infectious disease patterns, and if any of these
changes have any direct bearing of the evolution of other human-specific features that
distinguish us from the great apes.
Finally, a recent study found that the rate of gene expression changes for numerous genes
has dramatically changed in the brain but not in other tissues of the human lineage as compared
to the rhesus monkey and chimpanzee (53). In contrast, the results of the present study suggest
that a single gene (ST6Gal-I) has undergone up- or down-regulation in several human tissues.
by guest on July 10, 2018http://w
ww
.jbc.org/D
ownloaded from

16
16
ACKNOWLEDGEMENTS
This work was supported by USPHS grant R01-GM323373, Yerkes NIH Base Grant RR00165,
American Lung Association Research Training Fellowship Award RT043N and NIH Training
Grant 5T32DK07202, (to P.G.), and by the G. Harold and Leila Y. Mathers Charitable
Foundation.
FOOTNOTES
1Abbreviations used: Sias, sialic acids; Neu5Ac, N-acetylneuraminic acid; Neu5Gc, N-
glycolylneuraminic acid; CMAH, CMP-Neu5Ac hydroxylase; DMB, 1,2-diamino-4,5-methylene
dioxybenzene; SNA, Sambucus nigra agglutinin; MAH, Maackia amurensis hemagglutinin;
AUS, Arthrobacter ureafaciens sialidase; BSM, bovine submaxillary mucin; BSA, bovine serum
albumin; RBC, red blood cells; PBS, phosphate buffered saline, TBS, Tris buffered saline.
by guest on July 10, 2018http://w
ww
.jbc.org/D
ownloaded from
17
17
REFERENCES
1. Traving, C. and Schauer, R. (1998) Cell Mol Life Sci 54, 1330-1349
2. Angata, T. and Varki, A. (2002) Chem Rev 102, 439-470
3. Karlsson, K. A. (1995) Curr Opin Struct Biol 5, 622-635
4. Vlasak, R., Luytjes, W., Spaan, W. and Palese, P. (1988) Proc Natl Acad Sci USA 85, 4526-
4529
5. Kunkel, F. and Herrler, G. (1993) Virology 195, 195-202
6. Tsuji, S., Datta, A. K. and Paulson, J. C. (1996) Glycobiology 6,
7. Harduin-Lepers, A., Vallejo-Ruiz, V., Krzewinski-Recchi, M. A., Samyn-Petit, B., Julien, S.
and Delannoy, P. (2001) Biochimie 83, 727-737
8. Tsuji, S. (1996) J Biochem (Tokyo) 120, 1-13
9. Rogers, G. N. and Paulson, J. C. (1983) Virology 127, 361-373
10. Liu, C. K., Wei, G. and Atwood, W. J. (1998) J Virol 72, 4643-4649
11. Kaludov, N., Brown, K. E., Walters, R. W., Zabner, J. and Chiorini, J. A. (2001) J Virol 75,
6884-6893
12. Oho, T., Yu, H., Yamashita, Y. and Koga, T. (1998) Infect Immun 66, 115-121
13. Ito, T., Couceiro, J. N., Kelm, S., Baum, L. G., Krauss, S., Castrucci, M. R., Donatelli, I.,
Kida, H., Paulson, J. C., Webster, R. G. and Kawaoka, Y. (1998) J Virol 72, 7367-7373
14. Webster, R. G., Bean, W. J., Gorman, O. T., Chambers, T. M. and Kawaoka, Y. (1992)
Microbiol Rev 56, 152-179
15. Vines, A., Wells, K., Matrosovich, M., Castrucci, M. R., Ito, T. and Kawaoka, Y. (1998) J
Virol 72, 7626-7631
by guest on July 10, 2018http://w
ww
.jbc.org/D
ownloaded from

18
18
16. Ito, T., Suzuki, Y., Takada, A., Kawamoto, A., Otsuki, K., Masuda, H., Yamada, M., Suzuki,
T., Kida, H. and Kawaoka, Y. (1997) J Virol 71, 3357-3362
17. Baum, L. G. and Paulson, J. C. (1990) Acta Histochem (Jena) 89 Suppl. 40, 35-38
18. Leigh, M. W., Connor, R. J., Kelm, S., Baum, L. G. and Paulson, J. C. (1995) Vaccine 13,
1468-1473
19. Lamblin, G., Lhermitte, M., Klein, A., Roussel, P., van, H. H. and Vliegenthart, J. F. G.
(1984) Biochem Soc Trans 12, 599-600
20. Goodman, M., Bailey, W. J., Hayasaka, K., Stanhope, M. J., Slightom, J. and Czelusniak, J.
(1994) Am J Phys Anthropol 94, 3-24
21. Satta, Y., Klein, J. and Takahata, N. (2000) Mol Phylogenet Evol 14, 259-275
22. Chen, F. C. and Li, W. H. (2001) Am J Hum Genet 68, 444-456
23. Olson, M. V. and Varki, A. (2003) Nat Rev Genet 4, 20-28
24. Gagneux, P., Amess, B., Diaz, S., Moore, S., Patel, T., Dillmann, W., Parekh, R. and Varki,
A. (2001) Am J Phys Anthropol 115, 99-109
25. Chou, H. H., Takematsu, H., Diaz, S., Iber, J., Nickerson, E., Wright, K. L., Muchmore, E.
A., Nelson, D. L., Warren, S. T. and Varki, A. (1998) Proc Natl Acad Sci USA 95, 11751-
11756
26. Angata, T., Varki, N. M. and Varki, A. (2001) J Biol Chem 276, 40282-40287
27. Muchmore, E. A., Diaz, S. and Varki, A. (1998) Am J Phys Anthropol 107, 187-198
28. Brinkman-Van der Linden, E. C. M., Sjoberg, E. R., Juneja, L. R., Crocker, P. R., Varki, N.
and Varki, A. (2000) J Biol Chem 275, 8633-8640
29. Brinkman-Van der Linden, E. C. M., Sonnenburg, J. L. and Varki, A. (2002) Anal Biochem
303, 98-104
by guest on July 10, 2018http://w
ww
.jbc.org/D
ownloaded from

19
19
30. Bossuyt, X., Marti, G. E. and Fleisher, T. A. (1997) Cytometry 30, 124-133
31. Norgard, K. E., Han, H., Powell, L., Kriegler, M., Varki, A. and Varki, N. M. (1993) Proc
Natl Acad Sci USA 90, 1068-1072
32. Jamieson, J. C., McCaffrey, G. and Harder, P. G. (1993) Comp Biochem Physiol [B] 105B,
29-33
33. Dalziel, M., Lemaire, S., Ewing, J., Kobayashi, L. and Lau, J. T. Y. (1999) Glycobiology 9,
1003-1008
34. Schwarzkopf, M., Knobeloch, K. P., Rohde, E., Hinderlich, S., Wiechens, N., Lucka, L.,
Horak, I., Reutter, W. and Horstkorte, R. (2002) Proc Natl Acad Sci U S A 99, 5267-5270
35. Gagneux, P. and Varki, A. (1999) Glycobiology 9, 747-755
36. Baum, J., Ward, R. H. and Conway, D. J. (2002) Mol Biol Evol 19, 223-229
37. Couceiro, J. N. S. S., Paulson, J. C. and Baum, L. G. (1993) Virus Res 29, 155-165
38. Kalter, S. S. and Heberling, R. L. (1978) Proc Soc Exp Biol Med 159, 414-417
39. Snyder, M. H., London, W. T., Tierney, E. L., Maassab, H. F. and Murphy, B. R. (1986) J
Infect Dis 154, 370-371
40. Subbarao, K., Webster, R. G., Kawaoka, Y. and Murphy, B. R. (1995) Virus Res 39, 105-118
41. Murphy, B. R., Hall, S. L., Crowe, J., Collins, P., Subbarao, K., Connors, M., London, W. T.
and Chanock, R. (1992) eds.) pp. 21-27, Diagnon/Bioqual, Inc., Rockville, Maryland
42. Kumar, S. and Hedges, S. B. (1998) Nature 392, 917-920
43. Weinstein, J., Lee, E. U., McEntee, K., Lai, P. H. and Paulson, J. C. (1987) J Biol Chem 262,
17735-17743
44. Martin, L. T., Marth, J. D., Varki, A. and Varki, N. M. (2002) J Biol Chem 277, 32930-
32938
by guest on July 10, 2018http://w
ww
.jbc.org/D
ownloaded from

20
20
45. Takashima, S., Tsuji, S. and Tsujimoto, M. (2002) J Biol Chem 277, 45719-45728
46. Wang, X. C., Vertino, A., Eddy, R. L., Byers, M. G., Jani-Sait, S. N., Shows, T. B. and Lau,
J. T. Y. (1993) J Biol Chem 268, 4355-4361
47. Lo, N. W. and Lau, J. T. Y. (1999) Glycobiology 9, 907-914
48. Lo, N. W. and Lau, J. T. Y. (1996) Biochem Biophys Res Commun 228, 380-385
49. Ellies, L. G., Sperandio, M., Underhill, G. H., Yousif, J., Smith, M., Priatel, J. J., Kansas, G.
S., Ley, K. and Marth, J. D. (2002) Blood 100, 3618-3625
50. Hennet, T., Chui, D., Paulson, J. C. and Marth, J. D. (1998) Proc Natl Acad Sci USA 95,
4504-4509
51. Chou, H. H., Hayakawa, T., Diaz, S., Krings, M., Indriati, E., Leakey, M., Paabo, S., Satta,
Y., Takahata, N. and Varki, A. (2002) Proc Natl Acad Sci U S A 99, 11736-11741
52. Varki, A. (2002) Yearbook Phys Anthropol 44, 54-69
53. Enard, W., Khaitovich, P., Klose, J., Zollner, S., Heissig, F., Giavalisco, P., Nieselt-Struwe,
K., Muchmore, E., Varki, A., Ravid, R., Doxiadis, G. M., Bontrop, R. E. and Paabo, S.
(2002) Science 296, 340-343
by guest on July 10, 2018http://w
ww
.jbc.org/D
ownloaded from
21
21
Figure Legends
Figure 1. Differential expression of a2-6 linked sialic acids between humans and great apes.
Examples of 100X oil-immersion microphotographs of SNA staining of tracheal epithelium in
(a) human, (b) chimpanzee, (c) mouse, and (d) Gorilla. SNA is visualized by the Vector Blue
substrate and cell nuclei counter-stained with Nuclear Fast Red. Red arrows indicate the edge of
the ciliated epithelium facing the lumen. Green arrows indicate examples of mucin-filled goblet
cells. Bonobo and orangutan samples appeared similar to those of chimpanzees and gorillas
(data not shown).
Figure 2 Examples of differences in SNA or MAH staining of human and chimpanzee
tissues. Paraffin-embedded sections were stained with SNA or MAH as described in “Materials
and Methods”. Examples shown are: Spleen and liver. In the samples from the great apes (but
not humans), the SNA lectin bound to the splenic cords (stromal elements) in the spleen, in
addition to binding to lymphoid follicles and vessels. In liver samples of great apes (but not
humans), SNA bound to the luminal edges of bile ducts in the portal triads (see black arrows for
an example). A complete listing of human:ape differences is shown in Table 1.
Figure 3. Selective expression of a2-6 linked sialic acids on human red blood cells. Flow
cytometry for SNA staining of peripheral blood cells (note that the X axis is a log scale).
Human, solid line, chimpanzee long dashes, bonobo: dashed line, unstained control, thin solid
line. A, Total Leukocytes; B, Erythrocytes. Results shown are typical of those seen in samples
from 9 humans, 4 chimpanzees and 4 bonobos.
Figure 4. Comparison of a2-3 and a2-6 linked sialic acids in blood plasma proteins. Mean
absorbance for SNA and MAH staining in ELISA on plated plasma proteins from humans and
by guest on July 10, 2018http://w
ww
.jbc.org/D
ownloaded from
22
22
great apes. Bars indicate standard errors and star indicates significant difference for MAH
binding between chimpanzee and human plasma (unpaired t-test, p< 0.01). B = bonobo; C =
Chimpanzee; G = gorilla; H = human; and, O = orangutan.
by guest on July 10, 2018http://w
ww
.jbc.org/D
ownloaded from

23
23
Table 1: Summary of significant differences observed with SNA and MAH lectin binding
Cell type SNA Staining MAH Staining
Human Great Ape Human Great Ape
Cilia and basal plate of epithelial cells in
trachea and lung bronchioles
11/11 3/10* 0/11 4/10
Goblet cells of tracheal/bronchial epithelium 1/9 6/7 3/8 8/10
Eccrine sweat gland secretions in skin 8/11 1/6** 4/11 1/6*
Splenic cords (stromal elements) 3/7* 10/10 1/7 6/10
Liver bile ducts 2/7* 11/14 0/7 0/14
Ileal smooth muscle 0/5 5/9 0/5 0/9
Pancreatic islet cells 0/7 4/14*** 0/7 0/14
Prostatic myoepithelial cells 0/5 0/4 5/5 0/4
Only cell types in which significant differences between humans and great apes were found are
listed (for more details on all tissues studied, see Supplementary Information). Indicated are the
number of samples in which the observation was made / number of samples in which the cell
type could be evaluated accurately. With the exception of pancreatic islets, all differences are
human specific and general to the great apes as a group.
* = only faint and/or focal expression
** = positive in Orangutan only
*** = positive in Gorilla and Orangutan only
by guest on July 10, 2018http://w
ww
.jbc.org/D
ownloaded from

Table A: Number of tissues that were analysed using lectin histochemistry
Tissue Great Ape Total
Human Chimp Orangutan Gorilla
1 Brain 15 4 2 0 21
2 Heart 13 8 5 3 29
3 Skin 11 5 1 0 17
4 Trachea/lung 11 10 4 3 28
5 Spleen 7 10 4 2 23
6 Thymus/Tonsil 7 6 3 0 16
7 Ileum 8 9 6 0 23
8 Colon /Appendix 11 11 5 1 28
9 Liver 8 8 4 2 22
10 Pancreas 8 8 4 2 22
11 Kidneys 13 8 4 3 28
12 Ovaries 3 3 2 2 10
13 Testes 6 4 1 1 12
14 Prostate 9 3 1 0 13
TOTAL 130 97 46 19 292
by guest on July 10, 2018 http://www.jbc.org/ Downloaded from

2Table B: Summary of Lectin Reactivities on Human and Great Ape Tissues.UEA was used as positive control and stained blood vessels in most tissues.(H) = Human; ( C) = Chimp; (G) = gorilla; (O) = orangutan; n = number of samples stained with results.Grey boxes indicate examples of Human:Ape differences.Organ SNA MAH UEALungs andTrachea (H) n=11
Cilia and luminal edges ofbronchial epithelial cell (11/11),goblet cells (1/9), vessels
stroma, luminal edges of bronchialepithelial cells( 410), goblet cells inbronchial epithelium (3/8)
Vessels, mucin
(C) n= 10 goblet cells in bronchialepithelium(6/7), luminal edges ofbronchial epithelial cells (3/10),vessels
stroma, goblet cells in bronchialepithelium (7/10), luminal edges ofbronchial epithelial cells (7/10)
Vessels, mucin
(G) n=3 goblet cells in bronchialepithelium (1), mucin, stroma,vessels
goblet cells in bronchial epithelium(7/9), parenchyma
Vessels, mucin
(O) n=4 goblet cells in bronchialepithelium (2), stroma, vessels
stroma, vessels Vessels, mucin
Spleen (H) n=7 follicles, vessels, splenic cordsfaint (3/7)
follicles (5/7), sinusoids Sinusoids, vessels
(C) n=10 follicles (8/10) splenic cords,vessels, stroma
follicles (8/10), spleniccords/sinusoids(6/10),vessels,stroma
Perifollicular sheathedcapillaries (6/10)
(G) n= 2 follicles, splenic cords, vessels,stroma
follicles, splenic sinusoids, vessels,stroma
Perifollicular sheathedcapillaries (1/2)
(O) n= 4 follicles, splenic cords, vessels,stroma
follicles, splenic sinusoids, bloodvessels, stroma
Perifollicular sheathedcapillaries (1/4)
Ileum (H) n= 8 stroma, vessels, lymphocytes(2/8)
stroma, vessels, lymphocytes,plexuses
goblet cells (3/8)Auerbach’s plexus, vessels
(C) n=9 stroma, vessels,smooth muscle(5/9),lymphocytes(5/9)
stroma, vessels, lymphocytes,plexuses
goblet cells (5/9) Auerbach’s plexus, vessels
(O) n= 6 Stroma, vessels,smooth muscle(4/6), lymphocytes
stroma, vessels, lymphocytes,plexuses
goblet cells (6/6)Auerbach’s plexus, vessels
by guest on July 10, 2018 http://www.jbc.org/ Downloaded from

3Table B (Continued, Page 2): Summary of Lectin Reactivities on Human and Great Ape Tissues.UEA was used as positive control and stained blood vessels in most tissues.(H) = Human; ( C) = Chimp; (G) = gorilla; (O) = orangutan; n = number of samples stained with results.Grey boxes indicate examples of Human:Ape differences.Organ SNA MAH UEAColon (H) n=11 vessels, stroma (7/11),
lymphocytesgoblet cells (4/11), stroma,lymphocytes, plexus
goblet cells (3/11)Auerbach’s plexus, vessels
(C) n=11 vessels, mucin(5/11),stroma(6/11), lymphocytes
mucin, stroma, lymphocytes,plexuses
goblet cells (7/11)Auerbach’s plexus, vessels
(G) n= 1 vessels, stroma Stroma, vessels, plexuses goblet cells (1/1)Auerbach’s plexus, vessels
(O) n= 5 vessels, stroma, lymphocytes Mucin (4), lymphocytes, plexuses goblet cells (4/5)Auerbach’s plexus, vessels
Liver (H) n=7 Sinusoids, vessels, stroma(4/7) Sinusoids, vessels, stroma Sinusoids, vessels, bile ducts(4/8)
(C) n= 8 sinusoids, vessels, bileducts(6/8)*
sinusoids, vessels, stroma Sinusoids (4/8), vessels, bileducts (6/8)
(G) n= 2 Sinusoids, vessels, bile ducts sinusoids, vessels Hepatocytes, bile ducts, vessels (O) n= 4 sinusoids, vessels, bile ducts sinusoids, vessels Bile ducts (3/4), vessels
Pancreas (H) n=7 vessels, stroma stroma, vessels Acini, ducts, vessels (C) n=10 Acini (4/10), vessels, stroma, stroma vessels Acini, ducts, vessels (G) n= 2 Islets, vessels, stroma vessels Acini, ducts (O) n=2 Islets, vessels, stroma vessels Acini, ducts
Brain (H) n=15 white matter (11/15), vessels grey matter, vessels vessels (C) n=4 white matter (3/4), vessels grey matter, white matter(2/4),
vesselsvessels
(O) n=2 vessels grey matter (1/2), white matter(1/2), vessels
vessels
by guest on July 10, 2018 http://www.jbc.org/ Downloaded from

4Table B (Continued, Page 3): Summary of Lectin Reactivities on Human and Great Ape Tissues.UEA was used as positive control and stained blood vessels in most tissues.(H) = Human; ( C) = Chimp; (G) = gorilla; (O) = orangutan; n = number of samples stained with results.Grey boxes indicate examples of Human:Ape differences.Organ SNA MAH UEAHeart (H) n=13 stroma (5/13), vessels stroma (9/13), vessels vessels (C) n=8 stroma (5/8), vessels stroma (7/8), vessels vessels (G) n=3 stroma (1/3), vessels Stroma (1/3), vessels negative (O) n=5 stroma (3/5), vessels Stroma (1/5, vessels vesssels
Skin (H)n=11 basal layer epidermis, vessels,sebaceous glands, eccrine glandsecretion
epidermis, stroma, eccrine glandsecretion
Upper 1/3 epidermis, vessels,gland secretions
( C) n=5 basal layer epidermis, vessels mid-epidermal cells Epidermis, vessels (O) n=1 epidermis, eccrine gland secretion eccrine gland secretion Upper 1/3 epidermis, vessels
Tonsil (H) n=3 Epithelium, follicles, vessels Epithelium, follicles, vessels,stroma
Epithelium, vessels
(C) n=3 epithelium, follicles, vessels,stroma
Epithelium, parafollicular cells Epithelium, vessels
(O) n=3 epithelium, follicles, vessels,stroma
Epithelium, follicles, vessels Epithelium, follicles, vessels
Thymus (H) n=3 medulla, vessels Cortex , medulla, vessels Hassall’s corpuscles,vessels (C) n=2 medulla, vessels Cortex , medulla, vessels Hassall’s corpuscles,vessels
Prostate(H) n=5 epithelial cells, stroma, vessels,fresh secretions
myoepithelial cells, stroma,vessels, fresh secretions
Vessels, epithelial cells
(C) n= 3 epithelial cells, stroma, vessels,fresh secretions
stroma, vessels Vessels, epithelial cells
(O) n=1 epithelial cells, stroma, vessels,fresh secretions
stroma, vessels Vessels, epithelial cells
by guest on July 10, 2018 http://www.jbc.org/ Downloaded from

5Table B (Continued, Page 4): Summary of Lectin Reactivities on Human and Great Ape Tissues.UEA was used as positive control and stained blood vessels in most tissues.(H) = Human; ( C) = Chimp; (G) = gorilla; (O) = orangutan; n = number of samples stained with results.Grey boxes indicate examples of Human:Ape differences.Organ SNA MAH UEAKidney (H) n=9 glomeruli, vessels , stroma
Bowman’s capsule (4/9),distal tubules (7/9), collectingducts (4/9), loop of Henle (2/9)
glomeruli, vessels , stromaBowman’s capsule (8/9),loop of Henle (3/9),
glomeruli, vessels , stroma (4/9)
(C) n=8 glomeruli, vessels, stromaBowman’s capsule (4/8), distaltubules(7/8), collecting ducts (5/8)
glomeruli, vessels , stromaBowman’s capsule(2/8) distaltubules(5), collecting duct (5)
Glomeruli, distal tubules,collecting ducts, vessels
(G) n=3 glomeruli, vessels, stromadistal tubules (3/3)collecting ducts, stroma
Glomeruli, vessels, stromaLoop of Henle (1/3)
Distal tubules, collecting ducts,loop of Henle
(O) n= 4 glomeruli, vessels, stroma,Bowman’s capsule(2/4) , distaltubules (2/4), collecting ducts(2/4)
glomeruli, vessels, stroma,Bowman’s capsule(2/4) , distaltubules(2/4), loop of Henle (1/4)
Glomeruli, distal tubules,collecting ducts, vessels
Ovary (H) n= 3 stroma, vessels, corpus albicans stroma, vessels, corpus albicans vessels
(C) n= 2 stroma,vessels, epithelium(2),oocytes (1)
Stroma,vessels, epithelium(2/2),oocytes (1/2)
vessels
(G) n= 2 corpus albicans, epithelium(1) stroma, vessels, corpus albicans,epithelium(1/2)
Corpora albicantia
(O) n= 2 stroma, vessels stroma, vessels, corpusalbicans(1/2), epithelium(1/2)
vessels
Testis (H) n= 2 vessels, stroma, Leydig cells (1/2),spermatogonia (1/2)
stroma vessels
(C) n=3 vessels, Leydig cells stroma,vessels vessels
(G) n=1 vessels, stroma, Leydig cells stroma,vessels vessels
(O) n=1 Vessels,stroma stroma vessels
by guest on July 10, 2018 http://www.jbc.org/ Downloaded from

Linden, Dan Anderson, Harold McClure, Ajit Varki and Nissi M. VarkiPascal Gagneux, Monica Cheriyan, Nancy Hurtado-Ziola, Els C.M. Brinkman van der
Human-specific regulation of Alpha2-6 linked sialic acids
published online September 18, 2003J. Biol. Chem.
10.1074/jbc.M309813200Access the most updated version of this article at doi:
Alerts:
When a correction for this article is posted•
When this article is cited•
to choose from all of JBC's e-mail alertsClick here
Supplemental material:
http://www.jbc.org/content/suppl/2003/10/09/M309813200.DC1
by guest on July 10, 2018http://w
ww
.jbc.org/D
ownloaded from
![Biochemical, Cellular,Physiological, and …and some cancers.[42] In the final steps of sialic acid biosynthe-sis, the primary sialic acids of vertebrates (Neu5Acand Kdn) are formed](https://static.fdocuments.net/doc/165x107/5f08023a7e708231d41fdeff/biochemical-cellularphysiological-and-and-some-cancers42-in-the-final-steps.jpg)


![Determination of sialic acids in the nervous system of silkworm … · mammals, the central nervous system has the highest concentration of sialic acids [56]. The majority is pres-ent](https://static.fdocuments.net/doc/165x107/5edd48dfad6a402d66685251/determination-of-sialic-acids-in-the-nervous-system-of-silkworm-mammals-the-central.jpg)