Human Resource Strategies in Response to Local Government ...
199
Human Resource Strategies in Response to Local Government Cutbacks: An Exploratory Study of Determinants, Dimensions, and Effects by Min-Hyu Kim A Dissertation submitted to the Graduate School-Newark Rutgers, The State University of New Jersey In partial fulfillment of the requirements For the degree of Doctor of Philosophy Written under the direction of Professor Gregg G. Van Ryzin And approved by Newark, New Jersey May, 2017
Transcript of Human Resource Strategies in Response to Local Government ...

Human Resource Strategies in Response to Local Government Cutbacks:
An Exploratory Study of Determinants, Dimensions, and Effects
by
Min-Hyu Kim
A Dissertation submitted to the
Graduate School-Newark
Rutgers, The State University of New Jersey
In partial fulfillment of the requirements
For the degree of Doctor of Philosophy
Written under the direction of
Professor Gregg G. Van Ryzin
And approved by
Newark, New Jersey
May, 2017

© 2017 by Min-Hyu Kim
All Rights Reserved.

Dedicated to My Parents, Sooyeon, and Our Children, Doyeon and Taehoon

ii
Abstract
Much of the literature on public sector cutback management is normative and
suggests how to implement cutback strategies as part of strategic management. The
paucity of empirical research is striking, given the importance of cutback management in
assessing future employment needs of public sector agencies. Such research is crucial in
providing sufficient levels of services to fulfill the missions the public has come to expect
from government. Using a mixed methods approach, this study explored various human
resource (HR) strategies used to deal with cutbacks and examined the causes and
consequences of using these strategies.
Drawing on in-depth interviews with 17 directors in 9 local governments in New
York, New Jersey, Connecticut, and Pennsylvania, this study identified key factors that
may account for the use of various HR strategies, including training and development,
HR information technology, diversity management, and the role of unions and political
leadership. Furthermore, this study explored the subsequent consequences of using these
various strategies, with a focus on budgets, capacity and employee morale. To test these
grounded hypotheses systematically, survey questionnaires were administered to health
and human service directors of counties with populations over 10,000 residents, with an
adjusted response rate of 32.8%. In addition to gathering data on actual HR strategies,
the study conducted a survey experiment in which managers were asked how they would
respond to budget cutbacks of varying severity.
The results showed that multiple factors had varied influences on their decisions
about human resource strategies in cutback situations. The regression analyses indicated
that local governments that recognized the importance of information management, state

iii
political leadership, and the role of unions were more active in their implementation of
cutback strategies. The findings of this study indicated as well that restructuring was
associated strongly with lower budgets, capacity, and employee morale. The experiment
found some empirical evidence that public managers reduce direct personnel costs to
maintain the functions of the organization. The study has implications for human
resources practices and theories, as well as important implications for the changing
policies in developing and achieving the strategic goals of their organizations.
iv
Acknowledgement
I am deeply indebted to my committee members, Dean Gregg Van Ryzin, and
Professors Marc Holzer, Madinah Hamidullah and Sanjay Pandey for helpful comments.
I thank Dean Gregg Van Ryzin for his wisdom and guidance throughout my time
in graduate school; my conversations with him remain the most enjoyable of my
experiences at Rutgers. It has truly been a privilege to be in the company of such a great
mind.
Professor Marc Holzer deserves special thanks for his continuous support and
encouragement. Professor Holzer is like a father to me. I thank him for his scholarly and
professional mentorship from the day I set foot on Rutgers’ campus. All have been
instrumental in completing this project.
Professor Yahong Zhang set the bar high for me in the beginning and consistently
challenged me to meet that bar in my writing. My work is far better for it. Since I
contacted her early in the graduate school, she has offered me professional advice,
extremely helpful comments on many early drafts, and kind words to keep me going.
I thank Professor Frank Thompson for all the help he has offered. His quiet, calm
demeanor about how to proceed almost overshadows the remarkably helpful comments
he made. I appreciate them equally, however.
I also thank those who have trained me at Rutgers: Professors Norma Riccucci,
Cleopatra Charles, Hindy Schachter, Arthur Powell, Shatema Threadcraft, Jongmin Shon
and Sebastian Jilke. I have owed the most sincere and earnest gratitude to my academic

v
advisors at Seoul National University as well: Professors Joon-Hyung Hong, Sangheon
Kim and Soo-Young Lee.
Last, but certainly not least, I sincerely thank Professor Gregory Porumbescu for
giving me tremendous encouragement. Thank you all for reading drafts and giving great
feedback. I could not have asked for a better community of scholars.
This work would not have been possible without my family who helped me do
this in so many ways. The first and always most important person to thank is my
incredible wife, Sooyeon Kang. This dissertation is as much a product of her inspiration,
experience, guidance, and support as it is a product of the research I conducted. I would
like to acknowledge my beautiful and bright children, Doyeon and Taehoon who
motivate and inspire me each day. Both of them made this journey both challenging and
much more worthwhile. I thank my parents, Shin-Do Kim and Hyun-Sook Park for their
unwavering support and encouragement. I am also grateful to my parents-in-law, Soo
Yong Kang and Hae Kyong Chong.
I thank Father Robert Wister for spiritual support. It was a great strength for my
family. I would like to thank Charles Gillon who provided survey support and generously
participated in the study. I also want to express my gratitude to Dr. Lisa Mahajan-Cusack
for going before me.
Furthermore, I also owe my special thanks to the Korean Government
Scholarships. The years of my doctoral study at Rutgers would not have been possible
without their enduring support. Thank you for your commitment to supporting Korean
scholars in academia. Lastly, I also owe gratitude to the School of Public Affairs and
Administration for the Dissertation Fellowship.

vi
Table of Contents
Abstract……………………………………………………………………………………ii
Acknowledgement……………………………………………………………….…….…iv
Table of Contents…………………………………………………………………………vi
List of Tables……………………………………………………………………………..xi
List of Figures……………………………………………………………………………xii
Chapter One: Introduction………………………………………………………………..1
Context…………………………………………………………………………….1
Purpose of the Study………………………………………………………………4
Significance of the Study………………………………………………………….6
Outline of the Dissertation………………………………………………………...7
Chapter Two: Literature Review and Hypotheses………………………………………...8
Previous Research on Cutback Management……………………………………...8
Cutback Management Framework………………………………………………...8
The relationship between changes in resource levels and HR strategies...………10
Budget Maximization Theory…..………….…………………………………….14
Survivor Syndrome…..……………….………………………………………….15
Hypotheses……………………………………………………………………….17
What Influences HR Strategies in Response to Local Government Cutbacks…..17
Training and Development…………..……………………………………….17
Information Management………..……………………………………………18
Political Leadership…..………………………………………………………19

vii
Diversity as a Goal…..……………………………………………………….20
Role of Unions……….………………………………………………………21
What changes did local governments make?..........................................................22
Increasing Employees’ Contributions to Pensions or Health Benefits………22
Employee Salary Freezes………………………………………………….....22
Restructuring…………………………………………………………………23
Alternative Work Arrangements…………………………………………......23
Increased Use of Technology…………………………………………….......23
Telework…………………………………………………………………......24
Revenue Enhancement……………………………………………………….24
Partnerships…………………………………………………………………..25
What are the Consequences of HR Strategies?......................................................25
Organizational Capacity……………………………………………………...26
Morale and Trust…………………………..…………………………………27
Effect on HR Strategies of the Level of Cutbacks……………………………….30
Summary………………………………………………………............................30
Chapter Three: Research Design………………………………………………………32
Rationale for, and Summary of the use of Mixed Methods……………………...32
The Use of Mixed Methods in Public Personnel Research……………..........34
The Type of Mixed Methods Approach in this Study………………….........35
Stage One: Qualitative Interviews………………………………………….........37
Qualitative Sample Selection………..……………………………………….39
Qualitative Data Collection……………………………………………..........40

viii
Qualitative Data Analysis……………………………………………………40
Stage Two: Quantitative Survey…………………………………………………41
Selection of the Self-administered Web Survey……………………...……...41
Study Population………………………………………………………..........43
Designing the Questionnaire…………………………………………………45
Survey Experiment Embedded in the Questionnaire…………………...........47
Survey Data Collection………………………………………………………49
Quantitative Data Analysis……………………………………………..........51
Ethical Considerations…………………………………………………………...52
Chapter Four: Results of Qualitative Interviews………………………………………...53
Profile of the Respondents as a Group…………………………………………...53
Description of Organizations Interviewed……………………………………….54
Results……………………………………………………………………………55
Word Cloud and Cluster Analysis…………………………………………...55
Determinants of Local Government Cutback Strategies…………………….58
Training and development……………………………………………….60
HRIS use…………………………………………………………………61
Diversity as a goal………………………………………………………..63
The role of unions………………………………………………………64
State political leadership…………………………………………............65
Dimensions of local government cutback strategies……………………..68
Outcomes of Local Government Cutback Strategies…………..…….………69
Budgets and administrative capacity…………………………….............69

ix
Morale and trust………………………………………………….............70
Summary…………………………………………………………………………72
Chapter Five: Survey Results…………………………………………………………….74
Response Rate……………………………………………………………………74
Representativeness and Description of the Population……………………..........74
Descriptive Results………………………………………………………………78
Regression Analyses and Results………………………………………………...88
Determinants of Local Government Cutback Strategies…………………….88
Outcomes of Local Government Cutback Strategies……………….…..........97
Summary…………………………………………………………………..........102
Chapter Six: Experimental Results……………………………………………………..106
Descriptive Results………………………………………………………..........107
Results Overall…………………………………………………………...……..107
Cost Reductions in Compensation………………………………….………109
Program and Organization Restructuring…………………………………..110
Alternative Work Arrangements…………………………………………....113
Greater Use of Technology…………………………………………………118
Revenue Enhancement……………………………………………………...121
Partnerships…………………………………………………………………125
Summary…………………………………………………………………..........127
Chapter Seven: Discussion, Limitations, and Implications……………………….........130
Summary………………………………………………………………..............130
Limitations……………………………………………………………………...134

x
Implications……………………………………………………………………..136
Implications for Future Research………….…………………………….……...138
References…………………………………………………………………………........141
Appendix A. Interview Protocol…………………………………………………..........160
Appendix B. Survey Questionnaire……………………………………………….........163
Appendix C. Survey Invitation Messages………………………………………………178
Appendix D. Demographic Comparison across Groups…………………………..........183

xi
List of Tables
Table 2-1. Changes in Resource Levels and HR Strategies………………………………9
Table 3-1. Summary of Research Design…………………………………………...33
Table 4-1. Budget Size and Population of Organizations Interviewed……………..46
Table 4-2. Sample Characteristics…………………………………………………..47
Table 5-1. Which of the Following Best Describes Your Current Position?..............67
Table 5-2. Respondents’ Characteristics and Organization/Context……………….70
Table 5-3. Importance of Functions and Activities………………………………….73
Table 5-4. Dimensions of Cutback Strategies………………………………………78
Table 5-5. Outcomes of Cutback Strategies………………………………………...80
Table 5-6. How Would You Describe Your Budget Cutbacks in the Last Five
Years?...............................................................................................................82
Table 5-7. Regression Analyses of Determinants of Cutback Strategies…………...85
Table 5-8. Regression Analyses of Outcomes of Cutback Strategies………………92

xii
List of Figures
Figure 2-1. Cutback Management Framework……………………………………...9
Figure 2-2. Conceptual Framework…………………………………………………27
Figure 3-1. Experimental Design……………………………………………………42
Figure 4-1. Word Cloud of Interview Transcripts…………………………………..50
Figure 4-2. Clusters of Words that Appeared Frequently in Interview Transcripts...51
Figure 5-1. Rank Order of the Programs that Agency Administers………………...68
Figure 5-2. Rank Order of the Cutback Strategies that Agency Administered in
the Last Five Years………………………………………………………….76
Figure 6-1. Increase Employees’ Contributions to Pensions or Health Benefits…...102
Figure 6-2. Employee Salary Benefits………………………………………………103
Figure 6-3. Reprioritize Spending…………………………………………………..104
Figure 6-4. Consolidate Departments or Offices……………………………………104
Figure 6-5. Consolidate or Reduce Services………………………………………..105
Figure 6-6. Transfer Responsibilities to another Level of Government……………106
Figure 6-7. Reduce Work Schedules………………………………………………..107
Figure 6-8. Furloughs……………………………………………………………….108
Figure 6-9. Lay-offs…………………………………………………………………108
Figure 6-10. Use Volunteers Rather than Paid Employees…………………………109
Figure 6-11. Do not Fill Vacant Positions…………………………………………..110
Figure 6-12. Retirement Incentives…………………………………………………111
Figure 6-13. Virtual Meetings………………………………………………………112
Figure 6-14. Increased Use of Electronic Documents……………………………...112
xiii
Figure 6-15. Employees’ Increased Use of Technology……………………………113
Figure 6-16. Telework (i.e., telecommuting)……………………………………….114
Figure 6-17. Tax Increases………………………………………………………….115
Figure 6-18. Use of Rainy Day Funds………………………………………………116
Figure 6-19. Increase Fees for Services………………………………………….…117
Figure 6-20. Refinance Debt ………………..……………………………………...118
Figure 6-21. Partnerships with private Companies…………………………………119
Figure 6-22. Partnerships with Nonprofit Agencies………………………………..119
Figure 6-23. Partnerships with Other Government Agencies……………………...120

1
Chapter One: Introduction
Context
During the Great Recession between December 2007 and June 2009, governments
faced significant revenue shortfalls and struggled to balance their budgets. Under these
circumstances, local governments were forced to explore creative ways to deliver
services at reduced costs. Among many strategies available to manage organizational
decline and cutbacks, governments have faced difficulties using strategies to reduce labor
costs (S. Lee & Sanders, 2013; Trusts, 2013). Labor cost reduction, including pension
and benefits, can be a critical factor for governments when considering the effects on
budgets of labor costs, pensions, and other postemployment benefits.
Public sector human resource management (HRM) has encountered numerous
opportunities and challenges in managing employees in contemporary organizations
(Goodman, French, & Battaglio, 2013). Changes in public sector employment—civil
service reform, labor relations, information technology, social media, privatization and
outsourcing—have shifted traditional public HRM to transformational practices and
procedures. The 2008 financial crisis and subsequent economic recession increased
further the need for a more cost-effective public sector (van der Voet & Van de Walle,
2015), and many public organizations had to reduce their budgets and activities. Thus,
the financial and economic crisis has required more radical methods to reduce expenses
in public organizations than in the past decades. Because of these issues, cutback
management is once again a central issue in both public management practice and
research (Bozeman, 2010; Dougherty & Klase, 2009; Pandey, 2010; Pollitt, 2010; Raudla,
2
Douglas, Randma‐Liiv, & Savi, 2015; Roberge, Jesuit, Cepiku, & Bonomi Savignon,
2012; van der Voet & Van de Walle, 2015).
Cutback management can be defined as “…managing organizational change
toward lower levels of resource consumption and organizational activity” (Levine, 1979,
p. 180). Although growth occurs incrementally and naturally in public organizations,
decline does not occur in a reverse fashion (Levine, 1979). Moreover, cutback
management generally is not part of the organization’s long-term strategy, but achieves
results through many hard choices and paradoxes, and thus poses a considerable
challenge for many public organizations, and particularly for their leaders (van der Voet
& Van de Walle, 2015).
In this era of fiscal retrenchment processes, cutback management does not apply
solely to the private sector. Many cases of downsizing for economic reasons exist in the
public sector. The issues that public organizations and managers faced during the
downturn remain as challenging as ever. This is because a public organization is subject
to various restrictions due to its nature of publicness (Pandey, 2010). During periods of
local budget shortfalls, political pressure is likely to be high, and previously held areas of
managerial autonomy come under pressure. Thus, public officials are affected by
cutbacks (van der Voet & Van de Walle, 2015).
According to the previous literature, the negative effects of cutback management
are longer-term than most would like to admit. The immediate negative consequences
include loss of morale, distrust, and decreased performance, as well as employees
becoming self-centered and risk averse. Prior studies have stressed long-term effects,
such as employees’ lack of commitment to their employers, which ultimately results in
3
recurring transactions and greater turnover in government agencies (Amundson, Borgen,
Jordan, & Erlebach, 2004; Armstrong-Stassen, 2004, 2005; Armstrong‐Stassen, 2002,
2006; Campbell & Pepper, 2007).
As thinking about human resources strategically is integrated fully into a public
organization’s long-term strategy, the importance of HR strategies is evident in cutback
situations. It becomes an important task for both scholars and practitioners to focus on
both the supervisory and strategic roles that HRM play in the overall success of public
organizations. The implementation of cutbacks results in many hard choices and
paradoxes, thus poses a considerable challenge for many public organizations (van der
Voet & Van de Walle, 2015). Despite the fact that organizational downsizing in the
private sector has attracted increased attention, less attention has been directed to
studying cutback management in the public sector. Furthermore, cutback management
research has focused on the perspective of government budget cutbacks (Bartle, 1996;
Chen, 2016), while limited attention has been paid to cutbacks and related strategies in
the area of personnel management (S. Lee & Sanders, 2013; van der Voet & Van de
Walle, 2015).
Cutbacks are likely to have a direct influence on public officials in government
agencies. Therefore, much attention needs to be paid to the determinants, dimensions,
and consequences of personnel management in cutback situations.

4
Purpose of the Study
Much of the literature on public sector cutback management is normative and
suggests how to implement cutback strategies as part of strategic management. The
paucity of empirical research is striking, given the importance of cutback management in
assessing the future employment needs of public sector agencies. Such research is crucial
in providing sufficient levels of services to fulfill the missions the public has come to
expect from government (Sally Coleman Selden, 2008).
Since the 2008 financial crisis, and in its aftermath, a number of counties have
taken various steps to reduce their personnel costs. These reforms have received national
attention and debate, and have even led to lawsuits (Chen, 2013). This study examined
these major HRM cutback strategies in local governments that are subject to fiscal stress.
This study applied a cutback management framework that Charles Howard Levine, Rubin,
and Wolohojian (1981) developed to explain the patterns of human resource strategies in
response to local government cutbacks.
The first research question in this study was, “What influences HR strategies in
response to local government cutbacks?” Five critical factors in HRM identified in this
study included training and development; information management systems; political
leadership; diversity as a goal, and the role of unions. HRM in counties varies in its
decision-making with respect to the importance that local government places on these
five factors. The cutback management framework was tested with respect to decision-
making in local government HRM.
The second question, “What are the changes local governments made?” explored
the dimensions of human resource strategies in response to local government cutbacks.

5
This study examined increasing employees’ contributions to pensions or health benefits,
employee salary freezes, restructuring, alternative work arrangements, technology,
telework, revenue enhancement, and partnerships. The purpose of the study was to
discuss and analyze original survey data concerning the way in which, and the extent to
which, cutback strategies are used at the local level.
The third question, “What are the consequences of HR strategies?” investigated
the subsequent consequences of HR strategies in response to local government cutbacks.
The budget maximization and survivor syndrome theories suggest that, because of
cutbacks, government employees see their budgets decrease, which in turn may have
negative effects on their (future) income and career opportunities, as well as the prestige
of their organization. Despite a recent renewed academic interest in the implementation
of cutbacks in the public sector (Bozeman, 2010), there is a dearth of empirical evidence
concerning the way in which cutbacks or downsizing may affect the work attitudes of
government employees. The model in this study included variables suggested by these
theories to see whether this is the case with local government HRM.
The last question, “What are the effects of the level of cutbacks on HR strategies?”
examined whether public managers choose more severe strategies if their county
governments experience greater cutbacks. The cutback management framework suggests
that local governments will follow a sequence of cutback strategies in response to
different levels of fiscal stress (Charles Howard Levine et al., 1981). This study used an
experimental design to understand the way in which the level of cutbacks affected
directors’ willingness to choose more severe HR strategies.

6
Significance of the Study
This study explored the way in which U.S. local governments have responded to
cutbacks in terms of personnel management. This research will review what kind of HR
strategies government organizations have implemented in response to fiscal stress.
This research has implications for public HRM on several levels—practice, policy,
and knowledge generation. First, the study will provide practical implications for
designing HR strategies that local governments can use in the future. A number of local
governments have implemented the cost savings methods mentioned in this study as
proactive ways to reduce their costs, increase efficiency, and/or help employees obtain a
more desirable work/life balance. Therefore, it is important for practitioners to
understand the ways in which local governments manage human resources.
Second, this research has important implications for policy, particularly
considering the fact that identifying efficient and effective new ways of doing business
through continuous quality improvement is a key to managing and reducing future budget
shortfalls. Maintaining the discipline to manage human resources under budget
constraints is critical to minimizing the effects of budgetary shortfalls caused by periodic
economic recessions. Indeed, on the local level, government agencies have been diligent
in their efforts to maximize all of their revenues to build healthy reserves for local
funding.
Finally, this research also provided exploratory knowledge about the novel and
unique phenomenon of local government employees undergoing highly stressful
experiences. This could guide further research and development of theory regarding
HRM in response to local government cutbacks. This study provides a new

7
understanding of the experiences of public managers, which could help both practitioners
and researchers focus their work with civil servants more clearly.
Outline of the Dissertation
Chapter 2 begins by reviewing the literature on cutback management in local
governments. After discussing factors in cutback management and subsequent outcomes,
a set of hypotheses is presented. Chapter 3 describes the mixed-methods approach of the
study. Chapter 4 reports the results from 17 in-depth, qualitative interviews with local
government directors. Chapter 5 presents the results of a survey of 497 health and human
service agencies in various counties. Chapter 6 explains the results of the survey
experiment, and the last chapter discusses the implications of the study for the theory and
practice of HRM in local governments, its limitations, and makes suggestions for future
research.

8
Chapter Two: Literature Review and Hypotheses
This chapter reviews the relevant literature and theoretical foundations for this
study. It begins with a review of a theoretical framework suggested by Charles Howard
Levine et al. (1981). Next, it reviews the literature on budget maximization theory
(Niskanen, 1971) and survivor syndrome (Brockner & Greenberg, 1990). The chapter
continues to review ways to measure various factors, followed by a series of hypotheses
about the determinants and outcomes of cutback strategies in local governments.
Previous Research on Cutback Management
Cutback management framework
Using the case study of New York City, Charles Howard Levine et al. (1981)
developed a cutback management framework. According to this framework, local
governments’ strategies are determined by the interactions of several factors: changes in
financial resource levels, the formal authority of governments, and the power of interest
groups. The “outcomes” cluster accounts for short- and long-term secondary effects of
this process. Financial resources refer to the strength of growth or the severity of decline
in financial resources (Chen, 2013). The formal authority structure refers to the scope
and power legally granted to local administrators and elected officials (p. 36). The
interest group structure refers to the presence or absence of interest groups, their activity
levels during both growth and retrenchment, and whether they act individually or in
coalitions (p. 37). The combined effects of financial resources, formal authority, and
interest groups determine the strategies in response to cutbacks.

9
Figure 2-1. Cutback Management Framework
Source: Levine et al. (1981, p. 35). The figure is adjusted to reflect the relationships
examined in this study.
As the figure shows, Levine et al. (1981) described four relationships among
financial resources, formal authority, interest groups, administrative responses, and
outcomes. They assumed that administrative responses are associated directly with the
changes in resource levels (relationship #1). The activities and structures of interest
groups and formal authority, also affect the administrative responses (relationships #2, 3).
It is hypothesized that stronger authority will enable officials to make deeper and more
targeted cuts than officials with less formal authority (p. 42). However, where interest
groups are strong and active, actual cuts will be avoided or limited to shallow across-the-
board responses (Levine et al. 1981, p. 42). Finally, the administrative responses to fiscal
stress determine the outcomes (relationship #4).
Changes in
Resource Levels
Formal Authority
Structure
Interest Group
Structure
Administrative
Responses
Outcomes (1)
(2)
(3)
(4)

10
This study tests relationships these four relationships in this model. These four
relationships represent the influences of financial resources, formal authority, and interest
groups on the administrative responses. Because this study focused on HR strategies in
response to cutbacks, it examined the effects of financial resources, formal authority, and
interest groups. This study also incorporated training and development, information
management, and diversity as factors that influence HR strategies in response to local
government cutbacks. Training and development methods are vital to successful HR
reforms and ensuring the continuity of services and mission implementation (Goodman et
al., 2013). Furthermore, integrated information management is a key component in
effective HRM, and allows public managers improved access to data needed for
workforce analyses and forecasting (Sally Coleman Selden, 2008). In addition,
incorporating “diversity considerations” is one of the most important practices in HR
planning (Schreiber, Price, & Morrison, 1993).
The relationship between changes in resource levels and HR strategies
Levine et al. (1981) identified three levels of resource decline: slow or no growth,
moderate decline, and severe decline. Their theory suggests that there are several stages
of administrative response to different levels of fiscal stress. The first is “denial and delay
strategies,” associated with slow or no growth in financial resources. The second stage is
“stretching and resisting strategies,” and is associated with moderate decline. The third
stage is “cutting and smoothing strategies” that are associated with severe decline.
Other scholars also have discussed the sequence of cutbacks associated with the
severity of financial stresses. Using a case study in the U.K., Dunsire, Hood, and Huby

11
(1989) find that the government’s approach towards the need for cutbacks changes as the
crisis deepens or as the period of fiscal restraint lengthens. They suggest that the first
choice that presents itself to the manager faced with the need to reduce expenditures or
staff numbers is between percentage cuts all round and selective cutbacks. Wolman and
Davis (1980) argued that a local government’s first response to fiscal pressure is using
“buying-time” techniques which at a minimum buy time and delay the necessity of
choosing between revenue increases and expenditure-reduction strategies. After
implementing these strategies, local governments facing pressure must choose either to
increase revenues or reduce expenditures. Their studies suggest that local governments
facing fiscal pressure will first attempt to increase intergovernmental revenues. If local
governments are unable to generate sufficient additional intergovernmental revenues,
they must then confront the choice of self-funded revenue increases or expenditure
cutbacks. For a local government which engages in expenditure reduction, it appears that
the first line of attack is to attempt to reduce self-funded spending through means which
do not result in a lower level of service received by citizens. Such strategies include
greater use of automatic data-processing systems, contracting out, reducing compensation
of local government employees and transferring responsibilities to another level of
government. Chen (2013) argued that, if the strategies above have been used already, the
government will begin to make selective reductions, which proceed from relatively
invisible to visible areas.
12
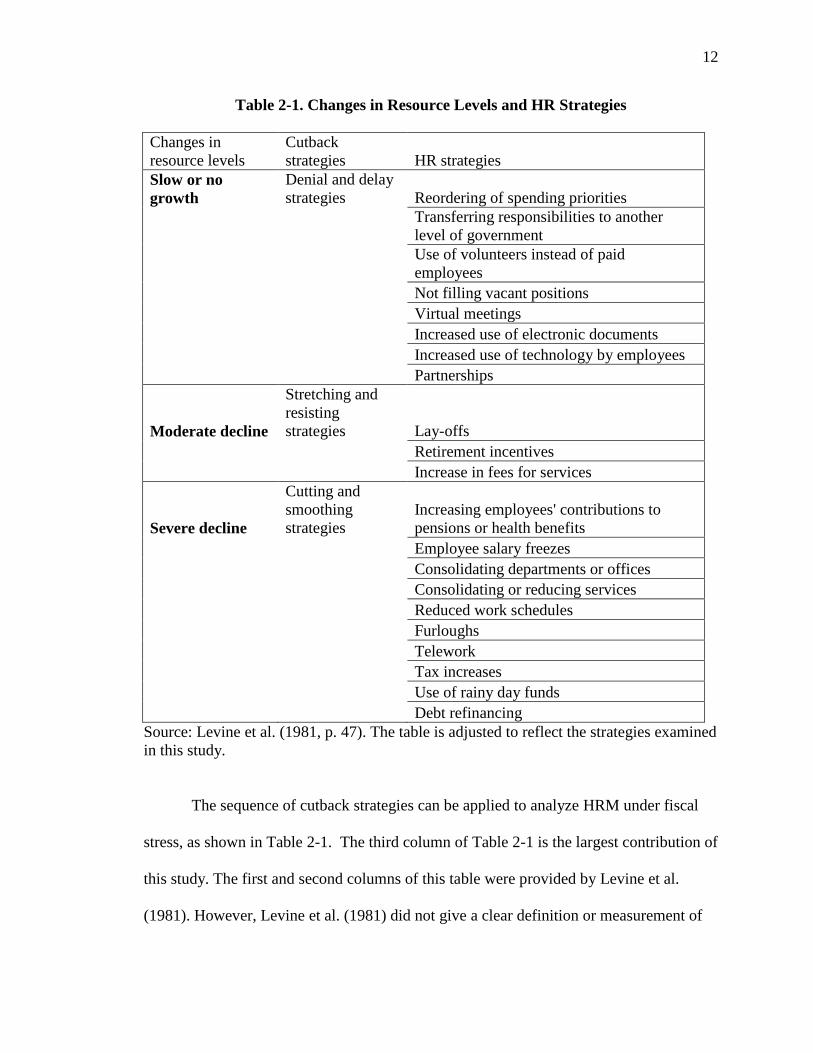
Table 2-1. Changes in Resource Levels and HR Strategies
Changes in
resource levels
Cutback
strategies HR strategies
Slow or no
growth
Denial and delay
strategies Reordering of spending priorities
Transferring responsibilities to another
level of government
Use of volunteers instead of paid
employees
Not filling vacant positions
Virtual meetings
Increased use of electronic documents
Increased use of technology by employees
Partnerships
Moderate decline
Stretching and
resisting
strategies Lay-offs
Retirement incentives
Increase in fees for services
Severe decline
Cutting and
smoothing
strategies
Increasing employees' contributions to
pensions or health benefits
Employee salary freezes
Consolidating departments or offices
Consolidating or reducing services
Reduced work schedules
Furloughs
Telework
Tax increases
Use of rainy day funds
Debt refinancing
Source: Levine et al. (1981, p. 47). The table is adjusted to reflect the strategies examined
in this study.
The sequence of cutback strategies can be applied to analyze HRM under fiscal
stress, as shown in Table 2-1. The third column of Table 2-1 is the largest contribution of
this study. The first and second columns of this table were provided by Levine et al.
(1981). However, Levine et al. (1981) did not give a clear definition or measurement of
13
the three levels of resource decline. Because Levine’s model has this limitation, through a
survey experiment of two treatment groups, this study will examine whether there are
differences in the managers’ preferred strategies depending on the cutback levels.
According to experimental results, some strategies were seen as cutting strategies under
severe declines, whereas other strategies were seen as denial and delay strategies under
slow or no growth.
Reordering spending priorities, transferring responsibilities to another level of
government, using volunteers rather than paid employees, and not filling vacant positions
are strategies to “buy time,” delay payment, manipulate the budget, or borrow from other
funds. Reordering spending priorities is another technique to delay payment. By
transferring responsibilities to another level of government, the government can defer the
payment to the future, expecting the economy will change for the better. Using
volunteers rather than paid employees and not filling vacant positions are likely to
decrease personnel costs, which is another way to buy time. All of these strategies are
included in the first category, “denial and delay,” in Charles Howard Levine et al.
(1981)’s cutback strategy model.
Lay-offs and retirement incentives are the second category of “stretching revenues”
strategies. Lay-offs and retirement incentives are assumed to be ways to decrease
employee numbers to reduce personnel costs. According to Charles Howard Levine et al.
(1981)’s model, lay-offs and retirement incentives follow the “stretching revenues”
strategy because they trigger resistance from interest groups. Therefore, the decision to
lay-off or offer retirement incentives depends on the expertise of the decision makers in

14
HRM. It requires complicated knowledge in HR to develop and adopt effective lay-offs
and retirement incentives.
The last category, “cutting strategies,” includes increasing employees’
contributions to pensions or health benefits, employee salary freezes, consolidating
departments or offices, consolidating or reducing services, reducing work schedules, and
using furloughs. Charles Howard Levine et al. (1981) theory predicts that interest groups
will resist these strategies and they will not be used unless there is an acute resource
decline. These strategies usually are subject to legislative debates, public hearings, and
often collective bargaining, a process that may take a long time. Further, some strategies
in this category apply only to new employees because they are implemented based on
seniority in the government workplace.
Budget maximization theory
The negative effects of cutback strategies on employee well-being have been
documented well in the management literature, although the empirical evidence in the
public sector remains limited (van der Voet & Van de Walle, 2015). Previous literature
has argued that negative consequences of cutbacks on employee morale, job satisfaction,
work motivation, work-related stress, and intention to leave are inevitable (M. K. De
Vries & Balazs, 1996; Kiefer, Hartley, Conway, & Briner, 2014; Charles H Levine, 1978,
1984; K. E. Mishra, Spreitzer, & Mishra, 1998; Raudla, Savi, & Randma-Liiv, 2013).
Much of this work has examined the relationship between cutbacks and the work-related
attitudes of employees in the private sector, while those individuals in government
organizations have received far less attention.

15
Niskanen’s (1971) budget maximizing model can be used to explain the
relationship between cutbacks and work-related attitudes (van der Voet & Van de Walle,
2015). This model argues that public officials, referred to as bureaucrats in this line of
work, may derive positive outcomes from the budget size of their department. In this
view, outcomes such as income, prestige, and power are a function of the budget size.
Therefore, government employees can be expected to maximize their budgets. Because
of cutbacks, however, civil servants see their budgets reduced, which in turn may have
negative effects on their (future) income and career opportunities, as well as their
organization’s prestige. Thus, the negative relationship between cutbacks and public
officials’ work attitudes is a reaction to the negative consequences to the prestige, power,
and legitimacy of their organization, as well as their personal interests.
Survivor syndrome
The general management and psychology literature indicates that downsizing
decreases the work related well-being of the employees who remain, which has been
referred to as survivor syndrome (Appelbaum, Everard, & Hung, 1999; Brennan &
Skarlicki, 2004; Brockner, Davy, & Carter, 1985; Brockner, DeWitt, Grover, & Reed,
1990; Brockner, Wiesenfeld, & Martin, 1995; Davy, Kinicki, Scheck, & Sutton, 1988; M.
F. K. De Vries & Balazs, 1997; Kernan & Hanges, 2002; A. K. Mishra & Spreitzer, 1998;
Shah, 2000; Van Dierendonck & Jacobs, 2012). Many previous studies have focused on
the survivor syndrome in the private sector. For example, Brennan and Skarlicki (2004)
suggested that downsizing can result in negative outcomes in terms of survivors’ job
attitudes and behaviors. In a similar vein, Brockner et al. (1985) found that layoffs

16
caused participants to experience increased feelings of remorse and develop more
negative attitudes toward their co-workers. M. F. K. De Vries and Balazs (1997) found
that downsizing can be a destructive process, but reframing downsizing as a continuous
process of corporate transformation and change is a more constructive approach. A. K.
Mishra and Spreitzer (1998) described two factors, trust in top management, and the
perceived justice of the downsizing implementation, that shape the primary appraisal
process by reducing the evaluation of the threat inherent in downsizing. Using an
extensive literature review, Appelbaum et al. (1999) addressed the approaches to
downsizing and their specific strategies, such as workforce reduction, work redesign, and
systemic strategy.
Several studies of survivor syndrome have explored ways in which layoffs affect
public servants’ job attitudes in the public sector. However, although Levine et al.
developed their framework to explain cutback strategies in local governments, previous
studies are limited to research on federal governments or privatized organizations in the
U.S., Canada, and U.K. For example, drawing on research on survivors of downsizing
carried out by the U.S. Department of Energy, Campbell and Pepper (2007) found that a
critical factor that influenced these responses is not downsizing, which is the exposure
faced by those who lose their jobs, but the loss of social cohesion that downsizing
ultimately represents to survivors. Amundson et al. (2004) conducted thirty-one
interviews of downsizing survivors in both the public and private sectors to determine
incidents that either helped or hindered their transition through one or more
organizational downsizings. Using a 3-year longitudinal panel study of employees in the
Canadian federal government during a large scale reduction in their workforce (more than

17
20 percent), Armstrong‐Stassen (2002) found that survivors’ perceptions of job security
decreased continuously throughout the period surveyed. Campbell-Jamison, Worrall, and
Cooper (2001) examined the psychological effects of downsizing and redundancy in a
recently privatized organization in the U.K. However, there is still a gap in the literature
with respect to survivor syndrome among U.S. local government officials. Thus, to fill
this gap, the unit of analysis in this study was U.S. county governments.
Hypotheses
What influences HR strategies in response to local government cutbacks?
Five areas contributed in building a theoretical model to begin to answer whether
public managers implement HR strategies in response to local government cutbacks.
Because there is little known about the use of HR strategies in response to cutbacks, this
study drew from public management and related literature to develop the testable
hypotheses discussed in the following sections. Furthermore, the exploratory interviews
supported theory development and shaped the hypotheses discussed in the following
sections.
Training and development
As a large percentage of the workforce prepares for retirement, local governments
will have to replace a greater percentage of knowledge workers than will the private
sector. These workers require specialized training and education that enable them to fill
various roles, such as healthcare worker, legal professional, natural scientist, engineer,
educator, and manager (Jacobson, 2009). If local governments wish to do more with less,
they must develop strategies to maximize their human capabilities (Goodman et al., 2013).
18
In this respect, HRM must integrate training and development in their core functions.
Training and development include, among other things, mentoring, cross training, and
professional development (J. Pynes, 2003). These training methods are important in
successful cutback management, and ensuring continuity of services and mission
implementation (Goodman et al., 2013). As such, the first hypothesis states:
Hypothesis 1: There is a relationship between the importance a local government
places on training and development and the personnel strategies that it chooses to respond
to cutbacks.
Information management
Beginning in the 1960s, personnel systems began using computers to store and
analyze employment records to comply with new federal and state laws (Goodman et al.,
2013). As information technology became more accessible during the 1980s and 1990s,
the role of HRM began to shift from being primarily concerned with “…transactional and
traditional HR activities to dealing with more transformational ones” (Thite, Kavanagh,
& Johnson, 2012). HR information systems (HRIS) allowed HR managers to generate
reports that enabled organizations to “translate” their “strategic plans to operational
decisions” (Kavanagh & Thite, 2009).
Thite et al. (2012) stated that HRIS supports various organizational levels from
operational, to managerial and executive processes. At the operational level, HRIS helps
reduce transaction costs and increase efficiency. For example, HRIS can be used to
process payroll, track time and attendance, and create and disseminate online applications.
At the managerial level, HRIS is used to produce reports, calculate merit increases, and
help with recruiting decisions. At the executive level, HRIS provides data for reporting
19
and evaluation, such as balanced scorecards, and also is used across boundaries. It helps
assess staffing needs, and conduct labor market analyses, employee skill matching,
training, and scheduling (Goodman et al., 2013). Integrated information management is a
key component in effective personnel management that allows public managers to access
data needed for workforce analyses and forecasting more effectively (Sally Coleman
Selden, 2008; Sally C Selden & Jacobson, 2007). In summary, adequate HRIS is
important when public managers administer human resources in response to cutbacks
(CedarCrestone, 2011; Kavanagh & Thite, 2009). Thus, the second hypothesis states:
Hypothesis 2: There is a relationship between the importance a local government
places on HR information technology and the personnel strategies that it chooses to
respond to cutbacks.
Political leadership
Political leadership may influence the strategies county governments choose in
response to cutbacks. Liberal governments generally are believed to spend more on
welfare than do conservative governments. For example, Liu and Mikesell (2014) found
that states that have Democrat governors spend more. This becomes clearer when we
think about the importance of a governor’s leadership on labor-management relations.
Public administration scholars have long considered managerial leadership an important
factor in the effective functioning of government organizations, including the delivery of
higher quality and efficient services (Andrews & Boyne, 2010; Brewer & Selden, 2000;
Hassan & Hatmaker, 2014; Meier & O’Toole Jr, 2002; Rainey, 2009; Rainey &
Steinbauer, 1999; Terry, 2003; Wart, 2003). However, research on political influence
within the public sector literature lags behind that of broader organizational scholarship

20
and questions in what way, and to what degree, it still matters. This research attempted
to advance this work by examining the way in which state-level politics shape local
governments’ choice of personnel strategies in response to cutbacks. The third
hypothesis states:
Hypothesis 3: There is a relationship between the importance a local government
places on political leadership (at the state and county levels) and the human resource
strategies it chooses to respond to cutbacks.
Diversity as a goal
Incorporating “diversity considerations” has been identified as one of the most
important practices for HRM (Schreiber et al., 1993). Managing diversity refers to
leaders’ ability to develop strategies, as well as programs and policies, that accommodate
diversity in their workplaces (N. Riccucci, 2002). In addition, governmental regulations
with respect to hiring female and minority workers have heightened the need for
personnel strategies that address diversity in an entity’s workforce (West & Berman,
1993). Diversity management also has become increasingly important because of the
changes evidenced in the government workforce at all levels, and because of the
increasingly diverse communities that public administrators serve. The implications of
this diversity are important considerations for public administrators at the local
government level as they develop their organization’s missions, strategic plans, and
leadership training programs (Soni, 2004). The fourth hypothesis states:
Hypothesis 4: There is a relationship between the level of importance a local
government places on diversity and the human resource strategies it chooses to respond
to cutbacks.
21
Role of unions
Unions may be considered an external interest group because of their affiliation
with larger external organizations (de Lancer Julnes & Holzer, 2001). There is a long
history of debate about the appropriateness of unionism in the public sector (Bent &
Reeves, 1978; Kearney & Mareschal, 2014; Klinger Donald & Nalbandian, 2003; Nigro,
Nigro, & Kellough, 2013; Perry, 1985; N. Riccucci, 1990; Rosenbloom & Shafritz, 1985;
Wellington & Winter, 1969). Examples suggest that the effects of unions can be positive
or negative, depending on the circumstances (de Lancer Julnes & Holzer, 2001). Fiscal
and performance pressures may lead to union cooperation in reform efforts. In New
York City, the municipal unions have long cooperated in productivity improvements as a
function of fiscal pressures (de Lancer Julnes & Holzer, 2001; Holzer, 1988). Unions
also may feel justified in opposing change when it may have negative consequences for
its members. For example, the Oregon Department of Transportation’s implementation
of performance measures eliminated one third of all management positions—a favorable
outcome for the agency, but not for the employees involved (de Lancer Julnes & Holzer,
2001; J. E. Pynes, 2008). Although employers are free to ignore the view of the unions
and make unilateral decisions with respect to the terms and conditions of employment (J.
E. Pynes, 2008), unions become an inevitable partner with top management in
implementing personnel strategies. Therefore, I hypothesized,
Hypothesis 5: There is a relationship between the level of importance a local
government places on the role of unions and the HR strategies that it chooses to respond
to cutbacks.

22
What changes did local governments make?
Local governments can make various changes in their HR practices and strategies
in response to cutbacks, including increasing employees’ contributions to pensions or
health benefits, freezing salaries, restructuring, alternative work arrangements, increasing
the use of technology to reduce costs, telework, enhancing revenues, and partnerships.
As HR activities are integrated fully into the public organization’s long-term strategy, the
importance of HR strategies in the cutback climate is evident. The information provided
by these managerial tools allows the organization to anticipate its current and future
staffing needs to meet the demands of the external environment, and also implement HR
activities, policies, practices, and changes that are needed to support or improve the
organization’s operational and strategic objectives overall (J. E. Pynes, 2004).
Increasing employees’ contributions to pensions or health benefits
In local pension or health benefits systems, employee contributions are usually
fixed at certain rates that also are specified in the state statutes or contracts that establish
pension plans. Decisions about employee contribution rates are subject to legal
constraints similar to those for benefits, because increasing employee contributions is
another way to cut pension or health benefits. The same influencing factors that affect
benefits, including executive proposal, legislative review, and negotiation with unions,
also affect decisions related to employee contributions (Chen, 2016).
Employee salary freezes
Numerous state and local governments enacted pay freezes while they trimmed
budgets during the Great Recession, and some remain in place. The implications of these
long-term pay freezes have been far-reaching, from hindering employee retention to
23
damaging morale. Using a randomized field experiment, Schaubroeck, May, and Brown
(1994) found that the fairness of the decision process mitigated the effect of the ongoing
pay freeze on employee attitudes, turnover intentions, and perceptions of procedural
justice.
Restructuring
Faced with economic hardship and greater demands for cost controls,
organizations are taking the fast track to cost-cutting by downsizing, reorganizing their
divisions, streamlining their operations, and closing down unprofitable divisions. G. Lee
and Teo (2005) found that both trust and satisfaction on the part of employees in an
organization declined significantly when compared to pre-restructuring levels.
Alternative work arrangements
Reilly and Reed (2011) found that local governments have implemented reduced
work schedules and lay-offs, used volunteers rather than paid employees, not filled
vacant positions and offered retirement incentives to reduce costs. S. Lee and Sanders
(2013) confirmed these results and found that governments also are relying on four-day
work weeks and furloughs. In addressing financial crises and the trend toward
privatization, governments have become more strategic, particularly when handling
personnel. Options that prevent lay-offs, i.e., furloughs, hiring freezes, wage cuts, and
pay schedule delays, have been adopted (S. Lee & Sanders, 2013).
Increased use of technology
More and more governments have begun to use information and communication
technology (ICTs) tools, including virtual meetings, and have increased their use of
electronic applications/paperwork (e.g., licenses, requests for services, etc.) to reduce
24
costs in HR management (Kavanagh & Thite, 2009). The use of information
technologies, or e-government, has several advantages compared with traditional
methods of HR management, including reducing employee costs in time and money,
promoting more effective and efficient two-way interactions, and so on. However, Sally
C Selden and Jacobson (2007) indicated that cities are the least likely type of government
to operate integrated HRIS. The following question explored whether county
governments have made increased use of technology to reduce costs in response to
cutbacks.
Telework
Telework has several other advantages for organizations with respect to cost
savings related to office maintenance, transportation, energy, and the environment, as
well as the increased continuity of operations in emergency situations and natural
disasters (Caillier, 2011; D. Lee & Kim, 2016; Major, Verive, & Joice, 2008; Maruyama,
Hopkinson, & James, 2009; Overmyer, 2011). Rather than resorting to budget cuts, local
governments have implemented telework as a proactive way to reduce costs, increase
efficiency, and help employees obtain a more desirable work/life balance.
Revenue enhancement
This study also added revenue or financial strategies, because some of these
strategies are related to HR. For example, tax increases can be used as local government
strategies instead of cutting wages. An increase in fees for services can also be an
alternative to making staff cuts. Therefore, this study added revenue enhancement
strategies, such as taxes and debts to HR strategies.

25
Using data from a survey of county and city governments, Perlman and Benton
(2012) found that local governments introduced recovery strategies such as tax increases,
tax structure reform, use of rainy day funds, increased fees for services, or debt
restructuring to enhance revenue in response to the changes brought on by the recession.
The goals local governments often are trying to achieve might be categorized as
temporarily buttressing shortfalls and reducing their greater costs. Local governments are
trying to manage and hope that fiscal pressures will decrease (Perlman & Benton, 2012).
Partnerships
In dealing with financial crises, governments have reduced costs by increasing
partnerships—those with the private sector, with non-profits, with academic institutions,
and by privatizing services or contracting with other local governments (Grossman, 2012).
Grossman (2012) emphasized that the skills of public-private partnership management
are required as we move toward more and more forms of partnership governance to solve
social and technical problems, reduce investment risk in public projects, and provide a
variety of public services.
What are the consequences of HR strategies?
The strategies discussed above have various consequences for local government
organizations, including organizational capacity, employee morale, and trust. These
effects are significant because “…public organizations must shoulder the burdens of
publicness” (Pandey, 2010). However, the link between cutback management and its
effects is difficult to assess, and evidence for theory is weak (CEPIKU, MUSSARI, &
26
GIORDANO, 2015; Lodge & Hood, 2012; McCann, 2013; Posner & Sommerfeld, 2013;
Schick, 2011).
Organizational capacity
Organizational capacity is the foundation necessary for governments to perform
well and achieve their goals. Capacity takes many forms (Collins & Gerber, 2006, 2008;
Denhardt & Denhardt, 2000; Hall, 2008a, 2008b; Terman & Feiock, 2014), and many of
these may be relevant to implementation. However, local administrative and fiscal
capacity have proven to be particularly salient (Howlett, 2009; Terman & Feiock, 2014).
Although these studies have examined many factors, limitations still exist, in that
there are few to no evaluations of the effects of cutback strategies on government
capacity. Without a reasonable level of capacity and resources, it is difficult for local
governments to provide public services to constituents.
This study was designed to fill this gap in the previous literature and explain the
consequences of personnel strategies from the perspective of government capacity. The
research questions are as follows: What are the effects of personnel strategies on budgets
and administrative capacity? Do personnel strategies reduce the timeliness and accuracy
of public service delivery to meet the citizens’ needs?
Hypothesis 6: The personnel strategies used to respond to cutbacks have negative
effects on local governments’ budgets.
Hypothesis 7: The personnel strategies used to respond to cutbacks have negative
effects on local governments’ administrative capacity.

27
Morale and trust
Trust includes both internal (organizational) and external (environmental)
perspectives (Battaglio & Condrey, 2009; Nyhan, 2000). The external view has received
the most consideration pertaining to trust and power in government by examining the
level of trust or confidence the public has in public institutions and their goods and
services (Battaglio & Condrey, 2009; Nyhan, 2000). However, the former view,
although no less important, has received considerably less attention. The internal
perspective focuses on the “…dynamics of interpersonal trust within public organizations”
and has garnered attention more recently with respect to its influence on organizational
performance overall (Battaglio & Condrey, 2009; Condrey, 1995; Gersick, 1994;
Greeberg, 1996; Morgan & Zeffane, 2003; Neves & Caetano, 2006; Nyhan, 2000;
Sheppard, Lewicki, & Minton, 1992; Tzafrir, 2005).
According to Battaglio and Condrey (2009), based on Nyhan (2000) extensive
review of the literature, trust consists of “…three major overlapping constructs: fairness,
confidence, and risk taking.” According to Nyhan (2000), these constructs serve as the
“antecedents” in his conceptual model of trust. Confidence and fairness are reliable
attributes of trust (Battaglio & Condrey, 2009; Nyhan, 2000). Furthermore, there is a
difference between the “dyadic” relationship of the supervisor and subordinate with
respect to trust, versus the issue of employee trust in the organization (Battaglio &
Condrey, 2009; Nyhan, 2000). Employees who have consistent confidence in the
fairness of the organization and in their dyadic relationships experience trust as a measure
of reciprocity, a notion grounded in social exchange theory (Tzafrir, 2005). Employing
Nyhan (2000) and Battaglio and Condrey (2009) approach, this research proposed the

28
following four hypotheses to measure the effect of personnel strategies on employees’
trust in management and the organization as a whole.
Hypothesis 8: The personnel strategies used in response to local government
cutbacks have negative effects on employees’ trust in the organization.
Hypothesis 9: The personnel strategies used in response to local government
cutbacks have negative effects on employees’ perceptions of teamwork.
Hypothesis 10: The personnel strategies used in response to local government
cutbacks have negative effects on employee morale.
Hypothesis 11: The personnel strategies used in response to local government
cutbacks have negative effects on job satisfaction.

29
Figure 2-2. Conceptual Framework
Determinants HR strategies in Response to
Local Government Cutbacks Consequences
Training and
Development
Information
Management
Political Leadership
Diversity as a Goal
Role of Unions
Increasing Employees’
benefits to pensions or
health benefits
Employee Salary
Freezes
Restructuring
Alternative Work
Arrangements
Technology
Telework
Revenue Enhancement
Job Satisfaction
Budgets
Capacity
Trust
Teamwork
Morale
Partnerships

30
Effect on HR strategies of the level of cutbacks
One of the purposes of this study was to examine the relation between cutback
levels and local government behavior using an experimental design. Specifically, this
study tested the way in which the level of cutbacks affected directors’ willingness to
choose more severe HR strategies. Thus, this study tested the following hypothesis:
Hypothesis 12: Public managers will choose more severe strategies if they
experience greater cutbacks.
Summary
This chapter began with a review of cutback management frameworks, budget
maximization theory, and survivor syndrome. HR management is an integral part of
local government operations. State and county political leadership vary in their authority
in decision making about local government personnel management, which may influence
the outcomes of decisions. The adverse effects of cutbacks on employee well-being have
been documented well in the literature. However, no study has organized cutbacks’
determinants and subsequent consequences in a theoretical framework. This study
examined the influences of fiscal stress on various aspects of HRM. It also examined the
effect of cutback strategies on budgets, capacity, and work attitudes in local governments.
Since the Great Recession that persisted from December 2007 to June 2009, local
governments have adopted a series of cutback strategies as counties experienced
decreasing revenues and large budgetary gaps. Thus, they implemented strategies to
reduce personnel costs. Borrowing from previous studies of public personnel

31
administration, this study adopted multiple indicators to measure the different
determinants of HR strategies to study their influences on local governments’ HRM.
This chapter discussed the pattern of cutback strategies in local governments, and
adopted Charles Howard Levine et al. (1981) framework to explain the patterns of
cutback strategies in local governments. Following this framework, the study anticipated
that political leadership on the part of the state and the role of unions world influence
personnel decisions. This study also hypothesized the way in which the importance of
training and development, information management systems, and diversity as a goal
affect the patterns of cutback strategies. Furthermore, this study hypothesized that when
subjected to different levels of fiscal stress, county governments respond with a sequence
of cutback strategies.
This chapter also reviewed the subsequent consequences of cutback strategies.
Previous literature has suggested that negative consequences of cutbacks on employee
morale, job satisfaction, work motivation, work-related stress, and intention to leave are
inevitable. Various theories have been applied in the cutback management literature to
explain the relation between cutbacks and employees’ work-related attitudes. Such
theories include the budget maximization and survivor syndrome theories. This study
used budgets, capacity, trust, teamwork, morale, and job satisfaction to measure the
negative consequences of cutback strategies. These variables were organized into a
theoretical framework, and hypotheses were proposed according to the predictions in the
previous literature. The next chapter discusses the definitions, measurements, and data
sources for the variables, as well as the methodologies used in estimation.
32
Chapter Three: Research Design
This chapter outlines the research design, research methods employed, sample
selected, instruments, and data collection procedures. The cutbacks that resulted from the
fiscal and economic effects of the Great Recession have constituted one of the most
important challenges facing those who participate in the management of American local
government (Box, 1997). This study used a mixed methods approach to study the
complexity of the phenomenon, as well as the intricate context of interest. A qualitative
pilot study was conducted first and used a theory-building exercise through in-depth
qualitative interviews. Together with the literature review, the results of this initial
qualitative stage were then used to develop a primary survey to allow systematic testing
of the propositions. This mixed methods approach made it possible to converge lines of
inquiry across multiple data sources and increased the reliability of the study’s findings
(Kim, 2014). Each step is explained in greater detail after discussing the rationale for the
use of mixed methods.
Rationale for, and Summary of the Use of Mixed Methods
There has been considerable philosophical and methodological controversy about
the relative merits of qualitative versus quantitative research in social sciences (Jennifer
C. Greene, 2008; Remler & Van Ryzin, 2010). The selection of appropriate research
methods relies largely on the researcher’s philosophical perspective, the nature and
purpose of the research question, and resources available (Jennifer C. Greene, 2008; Kim,
2014; N. M. Riccucci, 2010). Both quantitative and qualitative approaches have value;

33
in fact, they complement each other because the two traditions represent distinct cultures
that have different values, beliefs, and norms (Mahoney & Goertz, 2006).
According to Yin (2013), “Mixed methods research can permit investigators to
address more complicated research questions and collect a richer and stronger array of
evidence than can be accomplished by any single method alone.” Thus, this study
employed a mixed methodology to investigate personnel strategies in response to
cutbacks in U.S. counties. Clark and Creswell (2011) explained that mixed methods
research involves “…philosophical assumptions that guide the direction of the collection
and analysis and the mixture of qualitative and quantitative approaches in many phases of
the research process.” They suggested that a combination of quantitative and qualitative
data collection and analysis in a single study or series of studies “…provides a better
understanding of research problems than either approach alone” (Clark & Creswell,
2011). N. M. Riccucci (2010) believed that the use of mixed methods “…combines the
benefits of qualitative and quantitative methods,” as well as “…provides flexibility in
efforts to find solutions to practical, real-world problems.”
To answer the research questions in this study, information about both the
qualitative component and quantitative component must be obtained. This is because the
research questions embed both quantitative and qualitative research questions within
them.
This dissertation reflects the pragmatic stance and was designed to use both
qualitative and quantitative methodologies as appropriate for the research topic.
According to Johnson, Onwuegbuzie, and Turner (2007), mixed method research is the
research paradigm that partners with the philosophy of pragmatism. Onwuegbuzie,

34
Johnson, and Collins (2009) argue that the mixed methods research paradigm offers an
important approach for generating important research questions and providing warranted
answers to those questions. Based on this pragmatic approach, the pragmatist researcher
who holds a mixture of philosophical positions (i.e. belonging to both quantitative and
qualitative traditions) finds it natural to combine statistical analyses with an array of
qualitative analyses (Onwuegbuzie et al., 2009).
The use of mixed methods in public personnel research
Mixed methods have been used increasingly in the public administration context,
which was dominated previously by quantitative research. Mixed methods research is
considered to be an alternative in public personnel management studies to counter the
weaknesses of quantitative methodology. Pitts and Wise (2010) examined diversity
management research, identified articles on workforce diversity published in a core set of
public administration journals between 2000 and 2008, and found that roughly 11 percent
of the articles used mixed methods, while 55.1 percent used quantitative, and only 3.4
percent used qualitative methods. According to Jennifer C Greene (2005), mixed
methods can be implemented well in complex, real world contexts, because they include
characteristics that are both unique to a particular context and shared across contexts.
This is another reason that mixed methods were used in this study of personnel strategies
in response to local government cutbacks.

35
The type of mixed methods approach in this study
Because there are three main types of mixed methods based on the sequence in
which the quantitative and qualitative methods are used (Clark & Creswell, 2011), it is
important to choose whether to conduct qualitative research first, after, or simultaneously
to study the research topic comprehensively. For little researched topics, such as cutback
management, qualitative methods can be used to explore the issues and develop survey
questionnaires. However, a qualitative study has limitations, in that it usually excludes
large numbers of people from the selection process, and relies mostly on people who
volunteer to participate (Dillman, Smyth, & Christian, 2014). In contrast, using a
probability sampling method, quantitative research can produce population estimates and
provide results that can be generalized to a larger target population. However, without
prior in-depth qualitative investigations, quantitative research may fail to include crucial
issues and therefore not reflect the cultural context properly.
Accordingly, this study used an exploratory mixed method wherein the researcher
conducted in-depth interviews during the first phase and then a quantitative survey during
the second. By implementing an exploratory mixed method, this study tried to include
organizational and contextual factors that may influence personnel strategies and the way
in which these strategies shape administrative capacity and trust. An initial qualitative
phase prevented this study from overlooking crucial issues, and helped develop and
elaborate the survey questionnaire. A second quantitative phase can help test hypotheses
that evolved from the first phase, and yield results useful for explanation, prediction, and
broader generalization (Remler & Van Ryzin, 2010).

36
After the qualitative phase, a closed-ended, self-administered survey was given to
a larger random sample of county health and human services departments across the
United States to provide more quantitative evidence of patterns and causal relationships.
Table 3-1. Summary of Research Design
Stage First-exploratory Second-explanatory
Approach Qualitative Quantitative
Source of
Data In-depth interviews Original survey responses
Sample
Size 17 497
Goal
To explore factors based on
grounded theory
To test theoretical hypothesis
presented in chapter 2

37
Stage One: Qualitative Interviews
In the first stage, this study uses open-ended interviews with local government
employees to generate considerable information, which may lead to reconceptualization
of the issues under study. In accordance with grounded theory, stage one was designed to
develop theory through systematic examination of the phenomenon (Corbin & Strauss,
2014; Kim, 2014). In this sense, the first stage was intended to search for patterns to
understand better what influences HR strategies and how they affect budgets and
employee morale. Qualitative interviews are often used in initial studies on topics
unfamiliar to researchers, which is very important in cross-cultural and multicultural
research when the psychological repertoire of a population is not readily known (Teddlie
& Tashakkori, 2009).
The researcher used pilot testing using two local government employees. A pilot
phase was utilized to solidify the interview approach, determine the appropriateness of
the questions, and how much time to allow for the total interviews as well as
opportunities for revisions if necessary. The sample size was 17, which is an appropriate
size for phenomenological research.
A series of face-to-face, semi-structured, open-ended questions in a relaxed,
cooperative environment of the participant’s choosing were used. After success of the
pilot testing one-on-one interviews were conducted on 17 participants that fit the criteria.
Context for the study was local governments in New York, New Jersey, Connecticut, and
Pennsylvania. 9 agencies were narrowed to include only those organizations that fit the
following criteria: 1) municipal or county governments, 2) human resources or social
services agencies. Following a grounded theory approach (Glaser & Strauss, 2009), a

38
search was made for patterns in earlier interviews that led to questioning some of the
factors further during the course of later ones (Kim, 2014). When the interviews were
conducted, interviewees were asked about their work experience and involvement in HR
issues in their department. The initial interview protocol is provided in Appendix A.
The researcher is the instrument of the data collection. An interview protocol was
used and time for interviews was between 30 minutes and 1 hour. The interviewer used
one-on-one semi-structured questions. The participants were recorded on two different
digital tape recorders. Researcher took notes during the interview to pace the
conversation, refocus with distractions and probe. Qualitative questions focus on the
meanings given, not cause-and-effect.
39
Qualitative sample selection
As stated in the previous chapter, the target population of the study was health
and human service departments in county governments in the U.S. For the first,
qualitative phase of the study, a small, purposive sample was selected to participate in the
interviews. A purposive sampling scheme is added to generate new theories, insights,
fresh perspective, guided by the research question and the conceptual framework (Miles,
Huberman, & Saldaña, 2014). The primary goal was to explore what influences HR
strategies and the way in which they affect budgets and employee morale in county
governments. Therefore, this study drew a purposeful sample of county governments that
experienced budget cutbacks, as such a sample can be more useful in revealing HR
strategies in response to cutbacks.
Invitations to participate in interviews were e-mailed to directors in the sampling
process and those who responded were contacted. One of the greatest challenges was
that many managers rejected the requests for interviews. Despite this, the results were
satisfactory, as a total of seventeen directors from nine local governments were
interviewed by June 16th
2016. The participants were identified from contact information
available publicly. Nine local governments constituted a balanced mix of county
governments located in rural, suburban, and urban areas across the states. Personnel,
Human Service, Social Services, or Business Administration agencies in local
governments in New York, New Jersey, Pennsylvania, and Connecticut were included in
the final sample of the qualitative study.
This study was targeted at top-level public managers, because they are involved in
the overall HR administration from recruitment to discipline to dismissal in cutback
40
situations. Therefore, participants in this study primarily were directors who are involved
in the daily supervision of all of their staff, and in all interviewing and staff selection as
well.
Qualitative data collection
The public managers from Personnel, Human Services, Social Services, and
Business Administration agencies at the local governments selected were interviewed on-
site. A series of personal, semi-structured, open-ended questions was asked in a relaxed,
cooperative environment of the participant’s choosing. Conducting face-to-face
interviews made it possible to obtain a full range and depth of information, as well as
make observations of government offices.
Prior to the interview, all participants were provided a full description of the
purpose and confidentiality of the study, were informed of the voluntary nature of their
participation, and that they could stop the interview for any reason at any time without
explanation. Participants were also asked for permission to record the interviews. The
Rutgers University Institutional Review Board (IRB) for the protection of human subjects
in research reviewed and approved the interview protocol and consent form.
Qualitative data analysis
The content analyses of the words in the transcripts aim to add anything new to
our understanding on HR strategies in response to local government cutbacks. The
content analyses, which were accompanied by word clouds and cluster analyses, were
conducted by reading, coding and analyzing the full text of transcripts. Research mode is

41
reflective, so data analysis occurred throughout the research process. A professional
transcriptionist was contracted to prepare verbatim transcripts of each interview. Analysis
of the audio-recorded, transcribed interview contents were performed with R. In addition
to word cloud and cluster analyses, these qualitative data were used to develop the
study’s hypotheses, create an original survey questionnaire, and provide specific
examples that help interpret the quantitative results.
Stage Two: Quantitative Survey
The second, quantitative stage focused on exploring what influences HR
strategies in response to cutbacks, and the way in which they affect budgets and
employee morale. A web-based questionnaire, the primary instrument for collecting the
quantitative data, was designed based on both the qualitative findings from the interviews,
as well as on the previous literature (Battaglio & Condrey, 2009; Goodman et al., 2013).
The initial survey invitation, which included an embedded link to the online survey, was
sent via the USPS to county governments with populations of at least 10,000 residents.
Health and human services managers’ addresses from across the U.S. were collected by
searching sources available publicly, primarily, although not exclusively, on each county
government’s official website.
Selection of the self-administered web survey
The questionnaire was based on web surveys but added multiple modes of
communication to gain more opportunities to increase benefits, decrease costs and build
trust (Dillman et al., 2014). This is because this study targets local government

42
employees, especially those leading public organizations. In general, it is a dominant
view that surveys on public officials produce lower response rates. Therefore, various
methods have been used to achieve high response rates and to save costs.
The basic method is a web survey for the following two reasons. First, it is
inevitable to use a web survey for random assignment of survey experiments. In the
experiments, we randomly assign respondents to treatment groups in order to eliminate
systematic differences between treatment and control groups (Gerber & Green, 2012).
Using the randomizer feature of Qualtrics, the researcher can completely randomly assign
respondents to the treatment groups. Second, the interviewees preferred web surveys to
paper questionnaires in the qualitative phase. The reasons for this are that paper
questionnaires are easily lost, and mobile surveys can be implemented by using smart
phones or tablet PCs at home after work.
Using multiple contact attempts and varying the timing, delivery method, and
mode of those attempts are a few ways that the researcher produced higher response rates
(Dillman et al., 2014). This study used mailed letters with an embedded link to the online
survey, because it was not always possible to acquire valid e-mail addresses. After the
initial invitations were sent, the first and second reminders were sent to those managers
with valid e-mail addresses. Phone reminders were made to the respondents whose email
addresses were not known between the initial invitation and the first reminder. This is
because in order to obtain a response, the researcher first had to make contact with the
members of the population and then the researcher had to convince them to cooperate
with his request to complete the survey (Dillman et al., 2014). Follow-up phone calls

43
were made to a total of 546 agencies sampled randomly that did not have valid e-mail
addresses.
Study population
The population sampled was health and human services agencies in county
governments with populations of at least l0,000 citizens. A database was developed
using Excel, and a total of 1,995 agencies was generated as the final sample. Although
some states were overrepresented slightly, the final sample overall represents this study’s
sampling frame in the U.S. A self-administered survey requires obtaining the addresses
of selected county governments’ health and human service directors. This was
accomplished by visiting each county government’s webpage. If a government did not
disclose its contact information publicly, the next government on the list was tried until
one was found that listed its human service director’s address.
The research sample for this study was health and human services directors for
the following reasons. First, directors make HR decisions from a holistic perspective,
while HR directors have a narrower perspective. Second, health and human services
agencies experience budget cutbacks because they rely on block grants from federal or
state government. Because the largest portion of the budget is used for personnel, a
budget cutback influences HR management in health and human services agencies
significantly. Finally, these agencies are responsible for one of the most important
government functions, in that they serve needy populations, such as aged or disabled
citizens. Therefore, conducting research on HRM in health and human services agencies

44
helps us understand better the way in which cutback management influences public
service delivery.
This study uses a nationwide probability sampling with a good response rate. My
sampling strategy may need more explanation and, importantly, some discussion should
be added about how generalizable the results are likely to be. There are at least two
aspects to address: How representative is your sample of health and human services
directors nationwide? And, how representative are health and human services agencies of
public organizations more generally in terms of their HR policies and practices?
First, there are regional and state differences. According to Table 5-2, the
Northeast was 14.14%, the Midwest was 40.45%, the South was 31.76%, and the West
was 13.65%. This shows that the response rates in the Northeast and the West are lower
than the Midwest and South. As a result there would be nonresponse error.
Second, health and human services agencies may not completely represent
government operations. There is a difference in the labor structure between the health and
human services agencies and other agencies. As a result, union structure can be different.
In the health and human services agencies, civil servants are professional workers, such
as doctors, nurses, laboratory technicians and clinical social workers. On the contrary
there are many blue collar workers in the operational division, such as transportation,
education and law enforcement. Therefore, unions can be stronger in policing.
Furthermore, a union is more powerful in education. Although health and human services
are major areas of government, the labor structure can be different from other operational
divisions.
45
Designing the questionnaire
The survey questionnaire went through a very long creation-to-implementation
process involving dozens of people in different work groups, from those who participated
in the dissertation committee to those who are potential respondents working in local
governments. Parts of a survey or questionnaire are sometimes examined in detail and
changes made independently from others. It is not surprising that many surveys include
features that disproportionately affect the cost-benefit-trust evaluations they make
(Dillman et al., 2014). Efforts to find and eliminate, or at least reduce, these features are a
major concern from the creation of the questions to computer programming to make the
survey work.
Until the initial invitation was sent on September 1, 2016, the survey
questionnaire had been constantly reviewed by the committee members, other faculty
members and local government employees in terms of reducing the burden of length,
asking interesting questions, making the questionnaire relevant to the respondents, and
reducing complexity. The researcher started to create a survey questionnaire from
September 1, 2015 when he first began his interviews through an independent study.
After reflecting on comments from interviewees, the first draft questionnaire was
reviewed by the committee members in the proposal defense on May 5, 2016.
The qualitative data were used to create an original survey questionnaire. For the
second stage, this study conducted a national survey of health and human services leaders.
This study collected original data. The researcher sent out survey invitation to health and
human services directors in counties with populations over 10,000 residents. The survey
used primarily close-ended questions. The last question is: Are there any comments you

46
would like to add? [Optional] The comments provided specific examples that help
interpret the quantitative results.
This study focused on making a concise and interesting survey questionnaire.
Reducing length takes on increased importance as a way to increase response rates. This
is because length is a huge cost of being a respondent (Dillman et al., 2014). Furthermore,
when questions are interesting, so will be the answers.
In the beginning, participants were asked a direct question: what importance do
you assign to health and human services? Further, they were asked to indicate how many
years they had worked in the public sector. Questions in the main section were divided
into separate blocks to facilitate viewing each question on the screen. Questions covered
what influences HR strategies in response to cutbacks, what changes local governments
made, and the effects of HR strategies on budgets and employee morale.
Participants were instructed to answer most questions based on their organizations’
experience in the last five years. The last section was devoted to respondents’
demographic information, including gender, age, race, population, and region of the
country. Demographic variables can have rich explanatory powers in HRM research
(Edgar & Geare, 2004; Goodman et al., 2013).
The complete questionnaire is shown in Appendix B, and presents the sources
from which the questions were either adopted directly or adopted with modifications.
The questions were selected based on the results of the interviews conducted in the
previous stage, in addition to the literature review. Some of the survey questionnaires are
from the County Administrator Survey conducted by the University of Florida in 2012.
They are adjusted to reflect the HR strategies examined in this study. This is because

47
there are a series of questions that have aspects related to HRM, but the County
Administrator Survey was originally collected to study management changes in local
governments as a result of the Great Recession.
Furthermore, the questionnaire was shared with committee members and
professors to evaluate each item with respect to unclear directions, confusing choices,
ambiguous items, and unnecessary overlap among the elements. In collaboration with
local government professionals, this study used the survey questionnaire in a way which
is more helpful for the respondents to memorize how often their agencies have
implemented the HR strategies in the last five years.
The survey and invitation message were pre-tested before distribution to the
counties selected randomly. Before the launch, a pre-test was sent to 100 organizations
to validate the instrument and test its reliability. The results of the pre-testing confirmed
the questionnaire’s content validity.
Survey experiment embedded in the questionnaire
Experimental research designs have the important advantage of increasing the
internal validity of a study, and thus are especially strong in demonstrating causal
relationships (Remler & Van Ryzin, 2010; Shadish, Cook, & Campbell, 2002). In certain
social science disciplines, such as psychology or political science, the use of experiments,
particularly survey experiments, has become more common in recent years (Morton &
Williams, 2010; Van de Walle & Van Ryzin, 2011). However, in the public personnel
sector, only a few studies to date have used experimental methods. For example, Van
Ryzin (2015) used an experimental design to examine the way in which cognitive bias

48
affects the work motivations of public service professionals. Moreover, Weibel, Rost,
and Osterloh (2010) used an experimental design to explore the way in which pay for
performance influenced performance in the public sector. However, no previous
literature in the public personnel literature of which I am aware has employed the
experimental method to examine HR strategies in response to local government cutbacks.
Thus, the questionnaire included an embedded experiment in which participants
were assigned randomly to one of two treatment groups, which will be described in detail
shortly. Respondents were presented with one of two hypothetical cutbacks: (1) 2
percent, and (2) 10 percent. In particular, this study sought to test in what way/s the
severity of cutbacks influenced the willingness of public managers to choose varied
cutback strategies. One group was asked to imagine 2 percent cutbacks, while the other
was asked to assume 10 percent cutbacks. This study used these percentage cuts from the
budget sequestration in 2013 that the federal government implemented. Through a
special provision in the Budget Control Act of 2011, Medicare spending rates were
reduced by a fixed 2 percent per year versus the other domestic percents planned for the
sequester. Defense spending likewise was reduced by 10 percent in 2013. Federal pay
rates (including military) were unaffected, but the sequestration did result in involuntary
unpaid time off, also known as furloughs. Local governments were influenced directly
by these federal spending cuts. Therefore, it would be instructive for policymakers to
understand the way in which local cutback levels are related to the likelihood to
implement cutback strategies. This varied description constituted the experimental
treatment, the purpose of which was to see its influence on respondents’ choices of HR

49
strategies in response to cutbacks. Figure 3-1 shows the experimental design of the
research.
Figure 3-1. Experimental Design
In the experiment, this study considers 2 percent to be nominal cutbacks, while 10
percent are significant cutbacks. The present study was designed to compare the baseline
willingness (2 percent) with the effects of much larger cutbacks (10 percent). This study
sees 2 percent as a reasonable benchmark.
Survey data collection
This study adopted a web-based survey accompanied by multiple contacts to
maximize responses. In order to obtain a response, the researcher first has to make
contact with the members of the population, and then he has to convince them to
All respondents (N=439)
Survey questions
Random assignment
Counties with a 2 percent
cutback
N=219
(Group I)
Counties with a 10 percent
cutback
N=220
(Group II)
50
cooperate with his request to complete the survey (Dillman et al., 2014). Respondent-
friendly questionnaires, shorter (rather than longer) survey instruments and follow-up
requests that target likely nonrespondents are a few ways that are intended to increase the
likelihood of the members of the population cooperating with the request.
The first-round postal invitations to respond to the web survey were sent to all
panel members with a message that described the survey and the way in which they could
contact the primary investigator to ask any questions they might have. The invitation
contained the embedded URL to the web survey, and explained that they were selected
randomly for a national study of health and human service directors, as well as the
importance of their participation. Each questionnaire asked the name of the county to
track it conveniently. Most importantly, it emphasized the confidentiality of the data.
The questionnaire instrument was administered using Qualtric’s online survey software
(which stores the data automatically) to which respondents were directed by entering the
link. On Thursday, September 1st 2016, an invitation was sent to the leaders of all 1,995
agencies via letter, and was followed by two reminders sent two weeks and a month after
the initial invitation.
On Thursday, September 22nd
2016, the first round of follow-up e-mails was sent
to the respondents with valid e-mail addresses. Approximately two thirds of the survey
population was constituted of agencies for which the directors’ e-mail addresses were not
identified. The reminder contained the embedded URL to the web survey. Over the
course of survey administration, several calls and e-mails were received to ask either
about the legitimacy or procedures of the survey.
51
On Friday, October 21st 2016, the second-round of follow-up e-mails was sent to
all non-respondents with valid e-mail addresses. The reminder highlighted the
importance of the response rate and the contribution the research could bring to practice.
To improve the response rate, follow-up phone calls were made to 546 agencies
sampled randomly that did not have valid e-mail addresses. One of the greatest
challenges was the low response rate. In the phone calls, the purpose of the research and
its contribution to the field were described briefly. The survey was closed on Friday,
November 4th
2016. The initial invitation and two reminders are shown in Appendix C.
Quantitative data analysis
Factor analysis and multivariate regression typically are employed to analyze
quantitative data. Factor analyses are used to identify a feasible factor structure within a
given set of observed data, i.e., survey responses (Remler & Van Ryzin, 2010).
Multivariate regression analysis is undoubtedly the most important and widely-used
statistical method in research today (Remler & Van Ryzin, 2010; Tabachnick, Fidell, &
Osterlind, 2001). Conducting a multivariate regression analysis served to answer the
research questions by exploring the relation between the explanatory variables created
from the factor analysis procedure and the dependent variables. In the analysis of the
survey experiment, cross-tabulations and Chi-squared tests of association were employed.
STATA version 14 was used for all statistical analyses.
52
Ethical Considerations
Because this research involved human participants, separate IRB approvals were
obtained for the qualitative interviews (IRB# E16-187) and the online survey
questionnaire (IRB# E17-030). Each application to the IRB review described the project,
methods and procedures, and sample selection. Informed consent was provided to, and
obtained from, all interview participants, and their confidentiality was protected by
coding each interviewee numerically and using pseudonyms. Interview participants were
informed that their real names and those of their organizations would not appear in any
written reports. All research data were stored in a secure location, and all information
that matched individual respondents with their answers, including audio tapes and the
code to cipher identifying numbers will be destroyed after a reasonable period.

53
Chapter Four: Results of Qualitative Interviews
In the initial phase of this study, interviews were conducted with public managers
from counties and municipalities. Their feedback was instrumental in designing the
project survey, which represents the second and third phases of the study (findings are
presented in the following two chapters). This chapter presents the results of the
qualitative interviews and explores the major factors and outcomes of cutback
management. The chapter begins with a description of each of the nine organizational
directors who were interviewed. Responses were gathered from four states, and their
feedback revealed several important insights and interpretations.
Profile of Respondents as a Group
For this phase of the study, organizations were selected purposefully from the
states of New Jersey, New York, Pennsylvania, and Connecticut. The organizations
varied in their sizes and annual budgets. Table 4-1 summarizes the total expenses and
population estimate in fiscal year 2015.
Table 4-1 Budget Size and Population of Interviewed Organizations
State Name of the County Total Expenditures 2015 Population 2015
NJ Union County $522,239,696 555,786
NJ Morris County $342,091,270 499,509
NJ City of Newark $660,956,519 281,944
NJ Middlesex County $453,143,356 840,900
NJ Mercer County $302,266,856 371,398
NJ Sussex County $104,565,938 145,930
PA Bucks County $393,275,600 627,367
CT Fairfield County $291,088,646 948,053
NY Greene County $107,599,581 47,625
Total Interviewed Organization 9
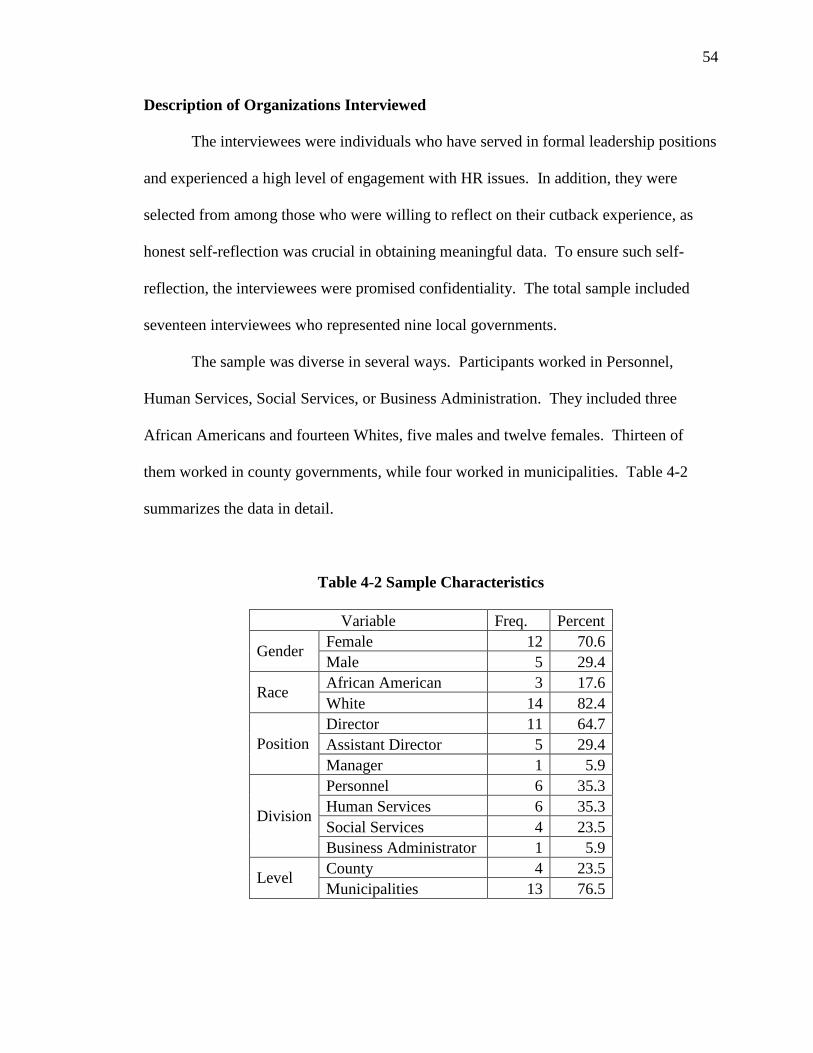
54
Description of Organizations Interviewed
The interviewees were individuals who have served in formal leadership positions
and experienced a high level of engagement with HR issues. In addition, they were
selected from among those who were willing to reflect on their cutback experience, as
honest self-reflection was crucial in obtaining meaningful data. To ensure such self-
reflection, the interviewees were promised confidentiality. The total sample included
seventeen interviewees who represented nine local governments.
The sample was diverse in several ways. Participants worked in Personnel,
Human Services, Social Services, or Business Administration. They included three
African Americans and fourteen Whites, five males and twelve females. Thirteen of
them worked in county governments, while four worked in municipalities. Table 4-2
summarizes the data in detail.
Table 4-2 Sample Characteristics
Variable Freq. Percent
Gender Female 12 70.6
Male 5 29.4
Race African American 3 17.6
White 14 82.4
Position
Director 11 64.7
Assistant Director 5 29.4
Manager 1 5.9
Division
Personnel 6 35.3
Human Services 6 35.3
Social Services 4 23.5
Business Administrator 1 5.9
Level County 4 23.5
Municipalities 13 76.5

55
Results
The organizations of all participants interviewed had experienced budget cutbacks
during the past five years. However, the determinants and strategies differed depending
on various contextual factors. Each organization has its own political culture, mission,
program, and infrastructure, and no single element appeared to be salient across agencies.
Nevertheless, the results of the interviews indicated that certain factors were influential in
shaping an organization’s response to cutbacks. This chapter first presents the results of
the word cloud and clustering based on the content analyses of the interview transcripts,
and then discusses each determinant and outcome of cutback management.
Word cloud and cluster analyses
A systematic and more objective content analysis of words in the interview
transcripts was confirmed. The content analysis, which used word clouds and clusters to
identify important topics, was based on Li and Van Ryzin (2017). Figures 4 and 5
illustrate the word clouds and clusters, respectively, that were used frequently in these
transcripts.

56
Figure 4-1. Word cloud of interview transcripts

57
Figure 4-2. Word clusters that appeared frequently in interview transcripts

58
The word cloud in Figure 4-1 shows the words used most frequently across
transcripts: the larger the font size, the higher the frequencies. The word cloud included
the main topics, “county,” “work,” and “employees.” “Services,” “budget,” and “union”
then were the words used most frequently because of their relevance to the theme (Figure
4). Figure 4 also shows that most of the interviewers focused on “state,” “budget,”
“personnel,” “social,” and “union.” However, the word cloud alone did not provide
precise information about linkages between words. Thus, Figure 4-2 shows a related
cluster analysis that presents the way in which these words were linked in the transcripts.
The cluster anlysis shows strategies, unions, budget, employees, states, staff, social, and
county, and a large and rather mixed cluster composed of a variety of other words that
appeared in the transcripts. These results complemented the previous categorization of
topics and suggested that strategies, unions, budget, employees, states, staff, social, and
county are some of the most common themes to date in the practices of cutback
management.
Determinants of local government cutback strategies
The results of the qualitative interviews indicated that all of the organizations
interviewed experienced particular kinds of cutbacks that influenced local governments’
personnel strategies directly. One manager stated:
If you took a look at the budget, it is probably 75percent salary and salary related
items. As an example, the City of Newark’s operating budget is approximately
$600 million, and $100 million of that [are] employee healthcare expenses. So,
when I say, the budget is 75percent of salaries, when you consider everything it

59
takes to hire an employee, you get employee healthcare, worker compensation,
social security… you have all of these costs, and personnel makes up a huge part
of the city’s budget. If you are going to reduce expenses, it most likely is going to
be by reducing your headcount or the number of employees that you have
working.
As this manager noted, pay and benefits constitute a large proportion of an
agency’s budget. Thus, both HR managers and budget officers are involved heavily in
budget management throughout the year. Agency managers and supervisors play the
primary role because they are responsible for controlling and reallocating human
resources to meet program priorities within budget constraints. Agency personnel
managers respond to the priorities managers set by filling positions, paying employees,
and otherwise implementing their decisions. In a cutback situation, agency personnel
managers may have to help prepare plans to reduce personnel expenditures. Commonly,
these include freezes on hiring and promotions, and cutbacks on hours worked, proposed
reductions in benefits, and the replacement of permanent workers with part-time or
temporary employees or volunteers (Klingner, Nalbandian, & Llorens, 2015).
No single characteristic or set of circumstances explained the personnel strategies
in response to local government cutbacks fully, and, indeed, the interviews revealed that
it is often difficult to make a clear distinction between each strategy. Nevertheless, the
findings of the qualitative interviews indicated that certain factors seem to be influential
in shaping an organization’s response to cutbacks.

60
Training and development. Most of the managers interviewed mentioned that
training and development methods are important to successful implementation of
personnel strategies in response to local government cutbacks. One interviewee said:
Training and development is a key to any kind of redevelopment or changes. And,
so, we have a very robust training program as it is. It is about 6 months for a
person to be hired and to be able to process claims independently. So, one of the
things that we had to do is redevelop a modified version, if you will, for some of
them [who]… were familiar and trained in areas that they will go back to and
others will not be. So, there is going to have to be a training component built into
it, and that is very critical to this whole process. So, yes, there will be modified
expectations, if you will, in the sense that we are really going to have to work
with staff to get them up to speed.
The need for greater investment in training and development of public employees
is recognized widely and is an element of strategic thought. When training is a
component of the strategic planning process, it broadens the development focus to
encompass individuals, groups, and the organization as a whole (Klingner et al., 2015).
Because cutback management is accompanied necessarily by changes in personnel,
training and development are essential to enable employees to adapt to new roles.
Although not all, some of the interviewees indicated that training and
development is an ongoing issue, because it takes time for local governments to respond
to recent cutbacks. One of the interviewees, for example, put ongoing training and
development in this way: “That [training and development] is ongoing. That hasn’t been
affected by the budget. Our training programs that we have in place still exist. That

61
hasn’t been cut down. So, whether it is a new employee or whether it is a tenured
employee, they are still receiving their annual training.”
Unlike the expectation that training and development will be cut first when
budgets are reduced, they appear to be consistently important regardless of fund changes.
In conclusion, training and development seemed to be one of the crucial factors
that influenced personnel strategies of local governments. Another manager noted,
Some employees did require intensive training. We have a training unit that
mainly helped. They were a big help in doing that. Some of the employees had
to be placed in the classroom for a few weeks to learn their new jobs. Other times
the trainers came out and gave training, [for example] to the clericals. They
trained them on certain ways to do things that they didn’t do before. Some of the
trainings took an hour, some took weeks. But, yes, our training staff was
instrumental in helping us in accomplishing that.
Training facilitates learning current responsibilities and tasks. Much of this
learning focuses on building skills, but also can include understanding concepts and
theories, as well as increasing self-awareness of one’s own personal attributes,
perceptions, attitudes, and ways of thinking (Klingner et al., 2015). Because changes in
the appearance of the organizations require continuous training and development to
maintain the nature of the institutions, these are important factors in determining cutback
strategies.
HRIS use. Most of the managers interviewed stated that HRIS helps reduce
transaction costs and increases efficiency. For example, one interviewee indicated that
HRIS allows HR managers to generate reports that enable organizations to “translate”

62
their “strategic plans to operational decisions” (Thite et al., 2012). She emphasized, “I
think the office of information technology absolutely plays a role in helping us, county
government, manage the many issues that can help track and measure results.” The
ability to think and plan strategically depends in part on access to reliable information
about the past, present, and future, as well as the ability to integrate information produced
in the past by separate administrative processes that may be maintained in separate
databases (Klingner et al., 2015). For example, knowing the seniority breakdown of an
organization’s workforce will alert managers to staffing issues related to cutback
management. This means that a strategic HRIS plays an important role in achieving data-
driven HRM in organizational downsizing.
Consistent with the historical development of HRIS, the role of HRM has altered.
The concern has shifted from “…traditional HR activities to dealing with more
transactional ones such as computing technology became more accessible through the
1980s and 1990s” (Thite et al., 2012). For example, one of the interviewees stated,
Originally, when we first started there were multiple programs. There is the
Temporary Assistance to Needy Families program. There is the food stamp
program, and there is the Medicaid programs. All of them had different computer
systems. None of them talked to each other in the beginning. Now, we can just
do one [application]. In fact, in the old days, we would have to do separate
applications for each one of those programs. Now, because of technology, we can
do one application for all the questions of all the programs that our agency offers.
It is possible to design, purchase, or contract a management information system
that collects information routinely on various factors that contribute to organizational
63
effectiveness, and presents this information to managers as reports they can use to make
necessary changes in policies or procedures. An agency might collect information
routinely on equipment and personnel costs, overtime, and productivity. HRIS also is
integrated routinely with accounting, purchasing, and budgeting software (Klingner et al.,
2015). The introduction of technology has helped reduce time and money, which means
that it is now indispensable in the government sector.
Diversity as a goal. Contrary to expectations, diversity management does not
seem to play a role in implementing personnel strategies. The most important reason for
this is the civil service rule determines who to lay off based on employees’ seniority after
local government submits the cutback plan to the civil service department. Thus, local
governments lay off employees based on seniority when they have to downsize. When
asked about the issues of race or gender in implementing personnel strategies, one
respondent said, “We did not focus on race or gender in our decisions. Once we
[Director and Assistant Director] put together our plan and the county put together their
entire plan and submitted everything to civil service, civil service made the decision on
who had seniority, who had bumping rights, who would go out the door.” Thus, there is
no room for race or gender to intervene in actual individuals’ layoffs.
Another case also showed that the civil service rule is more influential in local
governments’ decision making than is diversity management. A county government’s
Assistant Director of Personnel said, “The thing is [that] when we laid off those people,
let’s say there were about 25 clericals as an example, we laid them off. We follow our
civil service rules because we go by civil service.” Because a civil service system is a
complete system, HRM has a balanced emphasis on each of the four major personnel

64
functions—Planning, Acquisition, Development, and Sanction (Klingner et al., 2015).
Whether or not to lay off employees depends solely on their seniority. Further, because
the civil service rules are applied very strictly to workforce reductions, diversity is not
considered at all.
The role of unions. The majority of interviewees indicated that management-
union relations are critical in operating personnel strategies during cutbacks. One
interviewee stated, “I had discussed this matter with labor relations and our attorneys and
our leadership. Then, the Director of off-temporary assistance had meetings with them
just to let everybody know. We had meetings with the staff, I was there with the staff to
let everybody know that there was [sic] no layoffs, and that everybody was going to be
retrained.” Leaders communicated with unions to persuade them that there were
sufficient reasons for such layoffs.
Although not invariably, the majority of interviewees indicated that there is a
positive relationship between the importance leaders place on management-union
relations and successful implementation of personnel strategies under fiscal stress. One
of the interviewees, for example, has regular meetings with labor unions to involve their
voice in management. The director explained that a harmonious relationship with unions
can help employees maintain trust in management:
A harmonious management/union relationship is very important. It really doesn’t
work to have an antagonistic or confrontational relationship with the union. It
really doesn’t work. It doesn’t work for management, and it doesn’t work for the
laborers either. And, another thing is that over the 25 years of my position, I have
developed a certain level of trust with the unions. They trust me, because when I

65
tell them that we are going to do X, Y, and Z, we actually do [it]. I don’t mislead
them or give them false information. I’m never untruthful to them. That is very
important, to be able to give and keep you word with the union. Then you
develop a level of trust and honesty with them that they appreciate.
The strength of collective bargaining as a public personnel system is affected by
unions’ ability to persuade the public and its leaders that strong unions are associated
with vital public policy concerns that transcend the more narrow economic concerns of
their current members. The number of union members in the public sector has leveled off,
and traditional adversarial relationships are giving way to partnerships and alternative
methods to resolve disputes (Klingner et al., 2015). This interviewee’s response showed
that a discussion with unions enables top management to establish mutual trust, which is
necessary in successful cutback management.
State political leadership. Most of the respondents agreed that the Governor’s
party can influence local governments’ personnel strategies in nontrivial ways. One
interviewee said,
I absolutely do [agree that Governor’s party shapes personnel strategies]. What I
will say is that each county has its own political climate. That is why I think
unifying things at the state level is difficult. Because, there are very localized
priorities and localized climates. So, one of the things that I always think and say
to people who are asking about this kind of a pilot, because again it is big, an
outsourcing relationship is not going to be for every county. It might not even get
past an initial conversation in some counties, because when the numbers started to
grow for Medicaid, a lot of counties went out and hired 20-60 people and other

66
counties. Their freeholders and leadership were not vested in increasing the
staffing footprint by that many number. So, I think an opportunity for us to
address it in this unique way is probably because our political climate is open to it.
But, again, it is not going to be for every county. I don’t know if every county
would be open to something like that. So, I do agree.
The interviewee’s response indicated that the state political leadership plays a
crucial role in shaping cutback strategies. Because pay and benefits constitute the largest
part of agency budgets, personnel departments cannot design jobs or fill positions until
elected officials do their jobs. Furthermore, political leaders must designate and
authorize the personnel system (Klingner et al., 2015). Therefore, state political
leadership inevitably will influence personnel administration during cutback situations.
The majority of interviewees indicated that the Governor’s own values are critical,
and influence local governments’ personnel strategies. For example, in New Jersey,
Governor Chris Christie signed Chapter 78 into law, effective in June 2011. According
to Chapter 78, all state and local government employees have to contribute to their
healthcare benefits cumulatively based on their annual income. One assistant director
explained,
Chris Christie overhauled it and Chapter 78 was adopted. Now people are
paying…We used to pay a certain percentage of our salary. Now were paying…it
is done by a formula depending on the plan you have, if you have a single plan…
I’ll provide you with a copy of the information. If you have a single plan, or a
parent/child, or husband/wife, or family plan, there is a matrix grid of what you
make and what the percentage is that you should be paying. Every time you get a

67
raise, it goes up. It has become quite expensive for people to have their health
benefits now. I don’t know about state employees, I don’t think that they paid for
years, but local government employees paid into their benefits. Now it has gotten
quite expensive. It is difficult for people. Every time they get a raise, it gets
eaten up by this Chapter 78 contribution.
Because of Chapter 78, the New Jersey state government is facing an angry
backlash from government employees. This is a good example of the importance of state
political leadership. Elected officials, such as governors, are responsible for setting
agency missions and objectives legislatively, and for engaging administrative officials,
hopefully in a partnership, to control agency resources externally. Furthermore, their
concern may be to develop and implement administratively sound and politically
sensitive HR plans that reflect strategic thought (Klingner et al., 2015).

68
Dimensions of local government cutback strategies
Local governments’ use of strategies varied. For example, Bucks County,
Pennsylvania introduced a rainy day fund when there was a budget impasse in July, 2016.
The director of an agency explained his motive in this way:
We introduced the rainy day funds when there was no money coming from the
state. Bucks County chose to take money out of our general fund out of the
county reserves while we were waiting for the county budget to come through.
The county laid out over $30 million of cash reserves to keep human services
going while they were waiting for the state to approve the budget.
A rainy day fund is critical to most counties’ operations, as they do not permit
their governments to assume debt, because services would have to be cut in the absence
of reserve funds.
Technology also has been used to a greater extent as a cutback strategy. For
example, one of the interviewees gave tablet PCs to caseworkers. In explaining why they
began to move in this direction, one director mentioned,
I think greater uses of technology are all good, and we've already, as I said,
started to move in this direction where we gave them tablets. We are trying to go
paperless as much as we can; the state has done that. Putting a lot of forms and
things that were on paper and now have it all be electronic…If you’re asking me
to prioritize these, I would say the increases of technology and going paperless are
probably the two biggest ones.
As Schmenner and Lackey (1994) stated, technology decreased the time that
managers spent “pushing paper work” significantly. Interestingly, during the interview,
69
he emphasized that technology played a role in cutback management despite the cost of
introducing new equipment.
Outcomes of local government cutback strategies
The interviewees also had various opinions about the outcomes of cutback
management, and indicated that there were many ways to respond to their negative
consequences. Importantly, the results of cutback management were influenced by many
contextual factors. Thus, the consequences for local government differed for each state.
Budgets and administrative capacity. Most of the interviewees agreed that
personnel strategies help local governments improve budget deficits. However, they
were worried about compromised administrative capacity with respect to the timeliness
and accuracy of public service delivery. For example, one assistant director of personnel
indicated that her organization goes through audits after it lays off all the provisional
street level employees. She mentioned,
We did the best that we could with what we were left with, but that resulted in
problems with timeliness, processing the cases and accuracy. We ended up
resulting in a federal audit that we are under now. Because our timeliness became
so poor. So, we are under this audit now, and they expect to see 98percent
timeliness on the processing of cases, which we have been able to meet.
Most of the supervisors stated that they are significantly understaffed. This
indicates that some cutback strategies can hamper administrative capacity significantly.
For example, as contracting increases, in-house government capacity diminishes because
of staffing cuts and resource constraints (Auger, 1999; Girth, 2014; Milward & Provan,
2000; Van Slyke, 2003, 2007).

70
A subset of organizations interviewed appeared to lay off employees in response
to cutbacks, and the number of employees in one office decreased from eight to one. The
assistant director stated,
So, that is just an example of how we have lost staff and when we had eight
people, you still had a lot of overtime. Now, to just go down to one person, so
you know that critical things are just not being done. But, this is what happens
when you have a layoff that is that significant. So, yeah, we still have impacts
from that. And, so far, now there are two people who work in the benefits office,
and the second of which just started working here eight weeks ago, if that. And, it
is still a huge deficit, because he didn’t have a background that suited him for this
particular office, so there is a lot of training that has to be done.
This meant that one employee had to do the work that several people had
performed in the past. This is because they had to maintain the essential functioning of
the agency even if the organization’s external appearance changed.
Morale and trust. Despite the fact that personnel strategies might have
improved the budget balance of local governments, the majority of interviewees indicated
that those strategies aggravated the remaining employees’ trust in the organization and
management. One of the interviewees explained the damaged trust in this way:
Those layoffs have damaged that trust [in] trying to operate and make this agency
function. The morale here is horrible. The people who are left here to do the jobs
[are], for the most part, your rank-and-file employees and a lot of your middle
management supervisors. I think that they have a great lack of trust in our ability
to manage. I don’t think that they can appreciate the decisions that were made

71
and why they were made, because they don’t know all of the details that go into
why we have to make the decisions that we do. The morale is very poor in the
agency, because we have increased the caseload. In five years, we have doubled
it, and now you are cutting the staff. We didn’t have enough staff to do the job
before, and now we have made it that much worse. It is wonderful that the county
has agreed that we need the staff here in social services, and they have agreed to
fund some extra staff for us, but it has caused a lot of damage to our relationship
with the staff, I feel.
This interviewee’s response illustrated that survivor syndrome applies equally to
civil servants, in that, after the organizational downsizing, the remaining employees must
continue to work under the stress of not knowing when they also are going to be laid off.
The case of one municipality also indicated that personnel strategies destroyed
employees’ trust in management and the organization. While explaining her
organizations’ cutbacks, one assistant director mentioned,
The layoff happened, and employee morale, of course, goes down the
drain…Everybody got a layoff notice. No matter who you were, you got a notice
from the city saying, “We are going to be doing a layoff. You may be affected.”
So, people are afraid that they are about to lose their jobs. So, when you do that
to people, they have no trust in management; they have no trust in the
administration. And, people are very angry and upset because they are just
waiting to find out, “Am I the one who is going to be laid off?
Layoffs result in the loss of job security and damage trust in management and the
organization further. This study began with the assumption that there would be fewer

72
negative side effects of layoffs in the public than in the private sector, because public
officials have higher public service motivation. The results of the interviews, however,
demonstrated that layoffs also affect public officials adversely.
Summary
In summary, these interviews shed light on the factors that drive cutback
management and their subsequent outcomes. The interview data revealed the
significance of training and development, information management, state political
leadership, and the role of unions. Interviews with leaders of these agencies
demonstrated that they are conscious of the key issues that will influence cutback
management. It was clear that strategic applications varied according to the state’s
political leadership. The leaders also spoke of the negative effects of cutback
management and their serious concerns about the solutions. Finally, the use of the semi-
structured protocol made it possible to pursue peripheral topics as they arose during the
course of interviews, particularly the importance of technology, revenue enhancement,
and partnerships.
There are some unexpected findings I gathered from interviewing health and
human services directors. One finding is the fact that diversity is not considered when
implementing HR strategies in cutback situations. When local governments lay off
employees due to budget cuts, public managers only consider the seniority. They do not
take diversity into account. This is because it requires strict compliance with civil service
rules.
Overall, the qualitative interview protocol was effective in both serving as a guide
and allowing variation as the interviews progressed. In particular, the last question asked

73
about suggestions for surveys. All of the interviewees provided very helpful suggestions,
because they said that they preferred web-based to paper surveys. A few reviewed the
survey items during additional meetings after the interview. The key findings of this
qualitative study, together with the literature review in the previous chapter, were
instrumental in designing the survey questionnaire reported in the following chapters.
74
Chapter Five: Survey Results
Response Rate
By the close of data collection, 497 health and human services agencies had
participated in the survey. After excluding responses completed only in part, 414
completed responses remained. These came from 1,995 agencies (after excluding 60
mails that were returned), for a response rate of 24.9%. The initial survey invitations sent
to health and human services managers in county governments with populations of at
least 10,000 residents were followed by reminder phone calls. Among 546 phone calls to
managers in a list sampled randomly, 143 had retired, moved, resigned, or could not be
reached because of the outdated information. Considering those agencies, 1,517 agencies
were estimated to have received the survey, representing an adjusted response rate of
32.8%. Of the 414 observations that could be analyzed, 87 respondents chose to leave
comments about the survey, which were helpful in understanding the survey outcomes
better.
Representativeness and Description of the Population
As described earlier, all survey invitations were addressed to directors or those in
equivalent positions at health and human services agencies in county governments. As
Table 5-6 shows, nearly 65% of responses (N=300) were completed by those who
identified themselves as a commissioner/director/deputy director when asked, “Which of
the following best describes your current position?” Some respondents who chose
“other” specified their job as a “Health Commissioner” or “Director, Public Health
Practice.” Given the substantial number of surveys completed by leaders at each agency,
this study reported the way in which health and human services leaders responded to

75
local government cutbacks, and examined the factors and outcomes of the cutback
strategies.
Table 5-1. Which of the Following Best Describes Your Current Position?
Freq. Percent
Commissioner 19 4.08
Director 264 56.65
Deputy Director 17 3.65
County Administrator 44 9.44
County Manager 19 4.08
Program Manager 37 7.94
Other 66 14.16
Total 466 100
The survey asked organizations to indicate what programs their agencies
administered. The 24 survey items, adopted from the National Association of County &
City Health Officials (NACCHO)’s 2013 National Profile of Local Health Departments,
were designed to measure organizational engagement in a wide variety of health and
human services programs. The study asked respondents to check all that applied to their
organization. Figure 5-1 shows the results ranked in order of involvement.
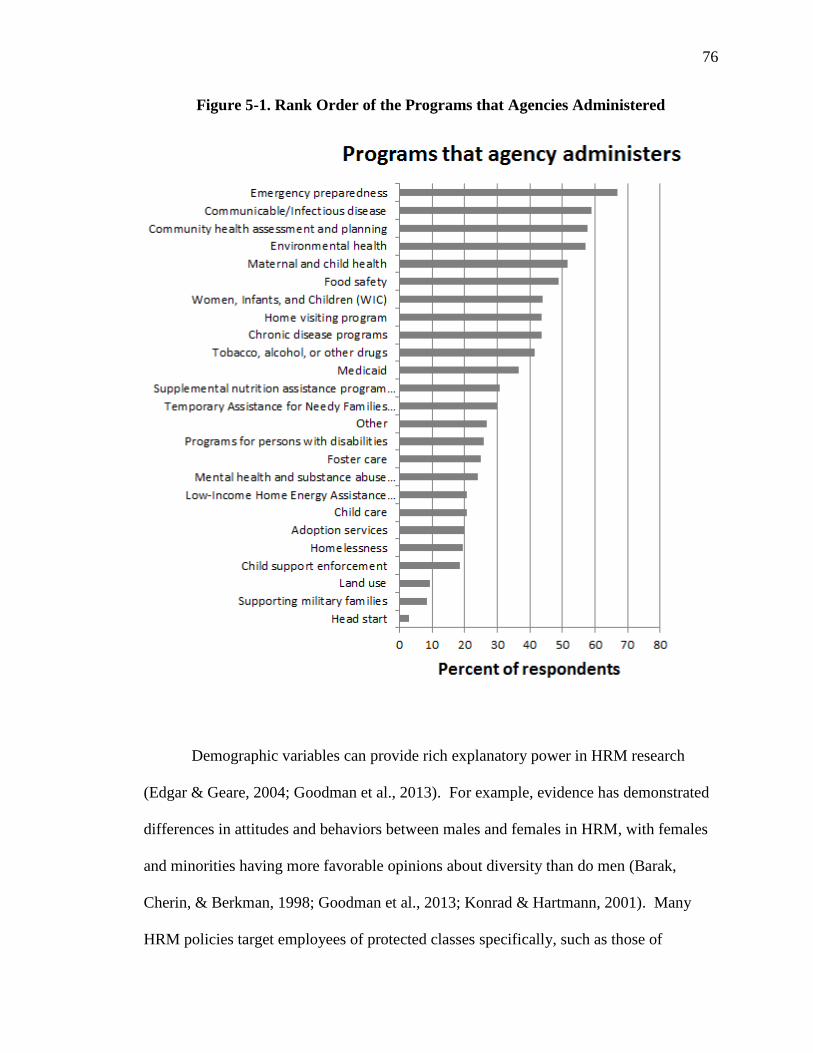
76
Figure 5-1. Rank Order of the Programs that Agencies Administered
Demographic variables can provide rich explanatory power in HRM research
(Edgar & Geare, 2004; Goodman et al., 2013). For example, evidence has demonstrated
differences in attitudes and behaviors between males and females in HRM, with females
and minorities having more favorable opinions about diversity than do men (Barak,
Cherin, & Berkman, 1998; Goodman et al., 2013; Konrad & Hartmann, 2001). Many
HRM policies target employees of protected classes specifically, such as those of

77
underrepresented races and gender (Goodman et al., 2013). As women and minorities
take on larger roles in organizations, they can represent actively those issues that are
important to underrepresented groups (Goodman et al., 2013; Sally Coleman Selden,
1997). Table 5-2 provides a summary of the descriptive statistics from survey items that
asked public managers about respondents’ characteristics and organizational contexts. Of
the total population that completed the surveys, approximately 72% were female. A
dummy variable was used to control for the gender of the survey respondents (coded 1
for female and 0 for male).
Regarding race/ethnicity, 4.4% were African American, 89% were white, 0.5%
were Asian, 1.5% were Native American, and the rest indicated other or preferred not to
answer. The variable of race was used as a control in the model (coded 1 for minority
and 0 for nonminority).
With respect to organizational context, 49% were health agencies, and the
remaining organizations indicated that they provided human services, health and human
services, social services, or other. With respect to the counties’ size, 13% were 10,000 to
24,999, 18% were 25,000 to 49,999, 26% were 50,000 to 99,999, 21% were 100,000 to
249,999, 9% were 250,000 to 499,999, and 9% were 500,000 or more. 14% were in the
Northeast, 40% were in the Midwest, 32% were in the South, and 14% were in the West.

78
Table 5-2 Respondents Characteristics and Organization/Context
Variable Variable name Mean SD
Respondent characteristics
Race
Minority Coded (0= White, 1=Black/African
American, Asian/Pacific Islander, Native
American, Other, Prefer not to answer) 0.11 0.31
Gender Gender Coded (0=male, 1=female) 0.73 0.44
Organization/context
Whether it is a
health agency or
not Health Coded (0=other, 1=health) 0.51 0.50
Population Size of county
Region N
Proportion
(N=403)
Northeast 57
14.14%
Midwest 163
40.45%
South 128
31.76%
West 55 13.65%
Descriptive Results
Table 5-3 summarizes the findings from the survey items that asked public
managers about the importance of functions and activities in their agencies. The first
hypothesis tested focused on training and development and their influence on cutback
strategies. The first hypothesis stated, There is a positive relationship between a local
government that places more importance on training and development and the cutback
strategies it chooses. To measure training and development, this study constructed an
index that captured their importance to local government directors. Table 5-3 reports
three survey items that measured training and development issues. A large percentage of
respondents indicated that professional development (81.5%), cross training (73.7%), and
mentoring (58.1%) are very important functions in HRM today. To measure the
importance of training and development, an index was created by summing the three
survey items reported in the top portion of Table 5-3 to create the training and

79
development index. The index ranged from 1.3 to 3, with a mean of 2.7. The Cronbach’s
α was 0.54, which represents a moderate degree of internal reliability.
HRIS and subsequent automation are important tools in human capital
management (Goodman et al., 2013). The second hypothesis addressed the relationship
between HRIS (technology) and cutback strategies, and stated, There is a positive
relationship between a local government that places more importance on HR information
technology and the personnel strategies it chooses. To test this hypothesis, an index was
constructed to measure HRIS/technology. The middle portion of Table 5-3 reports
survey responses to the question about the importance of various information applications
used commonly by health and human services agencies. The table indicates that 24.2%
of local government managers believed it is very important to master HRM software.
Similarly, 15.9% believed that computer-assisted testing is a very important aspect of
their jobs. 11.6% of the survey respondents reported that resume databases were very
important in today’s HRM. As mentioned above, the study developed a proxy variable
for integrated IT systems by summing the three survey items reported in the middle of
Table 5-3 to form the HRIS. The HRIS index ranged from 1 to 3 with a mean of 1.8.
The Cronbach’s α was 0.77, and indicated that the index had a high degree of internal
validity.
The third hypothesis tested stated, There is a positive relationship between the
level of the importance local government places on diversity management and the
personnel strategies that it chooses. The survey asked local government supervisors to
rate the importance of diversity as an HR management goal in response to cutbacks in the
last five years. The survey item was measured on a Likert-type scale that ranged from

80
Not important (1) to Very important (3). Responses ranged from 1 to 3, with a mean of
2.35. A large percentage (44.35%) indicated that diversity as a goal was a very important
part of HRM.
The fourth hypothesis stated, The role of unions is a necessary part of the process
when local governments choose personnel strategies in response to cutbacks. The role of
unions was measured on a scale of 1-3, where 1 was “Not important,” 2 “Somewhat
important,” and 3 “Very important.” 11.9% indicated the role of unions was very
important.
The final hypotheses stated, There is a positive relationship between state
political leadership and the implementation of cutback strategies and there is a positive
relationship between county political leadership and the implementation of cutback
strategies. Political leadership was measured by a survey item, where “Not important”
was coded as 1, “Somewhat important” as 2, and “Very important” as 3. Most survey
respondents (45.9%) answered that state political leadership was very important.
Similarly, 52.5% indicated that county political leadership was very important.
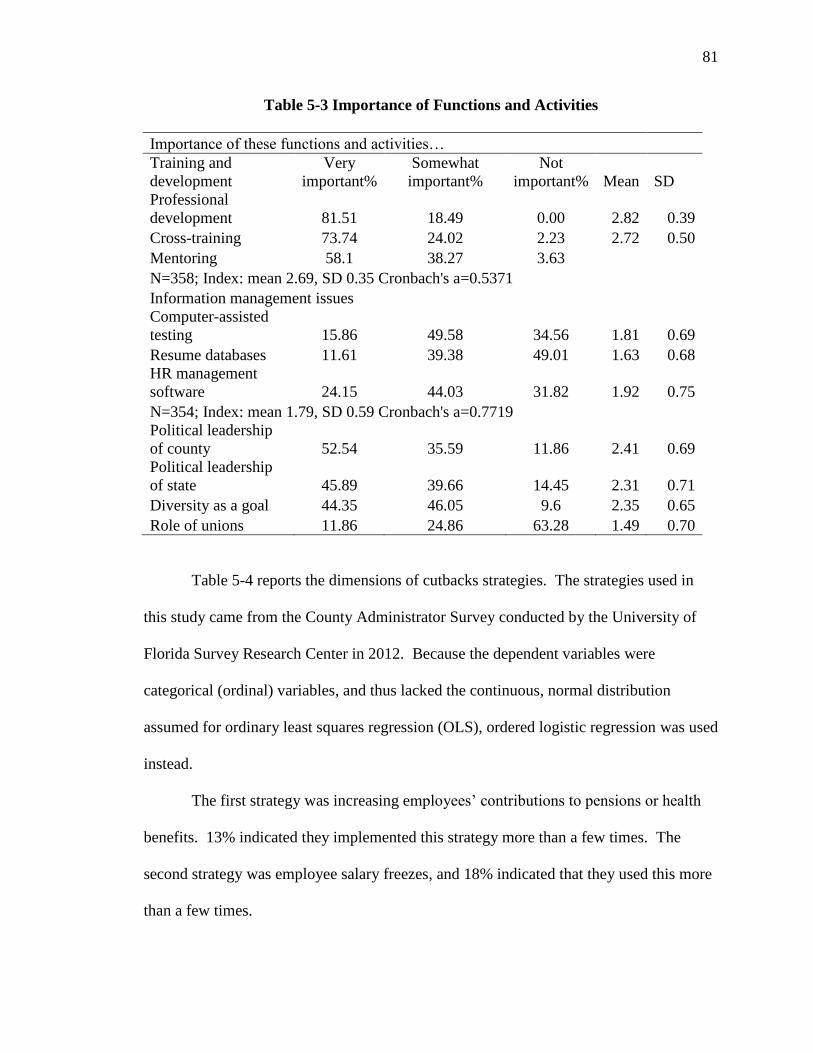
81
Table 5-3 Importance of Functions and Activities
Importance of these functions and activities…
Training and
development
Very
important%
Somewhat
important%
Not
important% Mean SD
Professional
development 81.51 18.49 0.00 2.82 0.39
Cross-training 73.74 24.02 2.23 2.72 0.50
Mentoring 58.1 38.27 3.63
N=358; Index: mean 2.69, SD 0.35 Cronbach's a=0.5371
Information management issues
Computer-assisted
testing 15.86 49.58 34.56 1.81 0.69
Resume databases 11.61 39.38 49.01 1.63 0.68
HR management
software 24.15 44.03 31.82 1.92 0.75
N=354; Index: mean 1.79, SD 0.59 Cronbach's a=0.7719
Political leadership
of county 52.54 35.59 11.86 2.41 0.69
Political leadership
of state 45.89 39.66 14.45 2.31 0.71
Diversity as a goal 44.35 46.05 9.6 2.35 0.65
Role of unions 11.86 24.86 63.28 1.49 0.70
Table 5-4 reports the dimensions of cutbacks strategies. The strategies used in
this study came from the County Administrator Survey conducted by the University of
Florida Survey Research Center in 2012. Because the dependent variables were
categorical (ordinal) variables, and thus lacked the continuous, normal distribution
assumed for ordinary least squares regression (OLS), ordered logistic regression was used
instead.
The first strategy was increasing employees’ contributions to pensions or health
benefits. 13% indicated they implemented this strategy more than a few times. The
second strategy was employee salary freezes, and 18% indicated that they used this more
than a few times.

82
The third strategy was restructuring, which was measured with four survey items.
Large percentages of respondents indicated that reordering spending priorities (33.8%),
consolidating departments or offices (14.3%), and consolidating or reducing services
(16.9%) occurred more than a few times. Smaller percentages answered that they
transferred responsibilities to another level of government (4.6%) more than few times.
To measure restructuring, an index was created by summing the four survey items. The
index ranged from 1 to 3, with a mean of 1.85. The Cronbach’s α was 0.68, indicating
that the index had a moderate degree of internal reliability.
The fourth strategy was alternative work arrangements. A large percentage of
respondents indicated that not filling vacant positions (35.9%) was used more than a few
times. A smaller percentage believed that reducing work schedules (2.3%), lay-offs
(2.0%), using volunteers rather than paid employees (6.0%), and retirement incentives
(2.6%) were used more than a few times. To measure alternative work arrangements, an
index was created by summing the five survey items. The index ranged from 1 to 3, with
a mean of 1.53. The Cronbach’s α of 0.47 indicated that the index had a moderate degree
of internal reliability.
The fifth strategy was greater use of technology to reduce costs. A large
percentage of respondents indicated that virtual meetings (49.2%), increased use of
electronic documents (61.0%), and employees’ increased use of technology (61.7%) were
used more than a few times. To measure technology, an index was created by summing
the three survey items. The index ranged from 1 to 3, with a mean of 2.5. The
Cronbach’s α of 0.85 indicated that the index had a high degree of internal reliability.

83
The sixth strategy was telework. 11.9% indicated they implemented this strategy
more than a few times. The seventh strategy was revenue enhancement, and a large
percentage of respondents indicated that they increased fees for services (13.3%) more
than a few times. A small percentage of respondents answered that tax increases (1.5%),
use of rainy day funds (8.2%), and debt refinancing (0.9%) were used more than a few
times. To measure revenue enhancement, an index was created by summing the four
survey items. The index ranged from 1 to 2.75, with a mean of 1.46. The Cronbach’s α
of 0.55 indicated that the index had a moderate degree of internal reliability.
The last strategy was partnerships. A small percentage of respondents indicated
that partnerships with private companies (3.2%), nonprofit agencies (5.8%), and other
government agencies (2.0%) were used more than a few times. To measure partnerships,
an index was created by summing the three survey items. The index ranged from 1 to 3,
with a mean of 1.42. The Cronbach’s α of 0.72 indicated that the index had a high degree
of internal reliability.
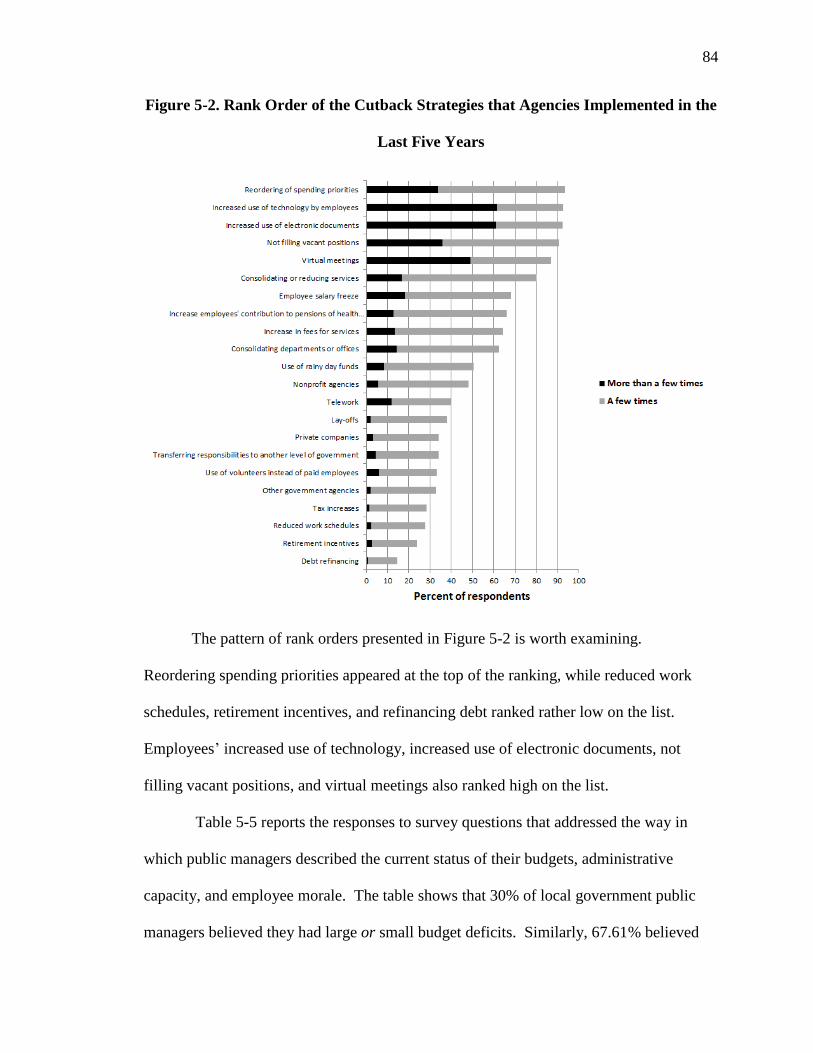
84
Figure 5-2. Rank Order of the Cutback Strategies that Agencies Implemented in the
Last Five Years
The pattern of rank orders presented in Figure 5-2 is worth examining.
Reordering spending priorities appeared at the top of the ranking, while reduced work
schedules, retirement incentives, and refinancing debt ranked rather low on the list.
Employees’ increased use of technology, increased use of electronic documents, not
filling vacant positions, and virtual meetings also ranked high on the list.
Table 5-5 reports the responses to survey questions that addressed the way in
which public managers described the current status of their budgets, administrative
capacity, and employee morale. The table shows that 30% of local government public
managers believed they had large or small budget deficits. Similarly, 67.61% believed

85
their agencies were very understaffed or somewhat understaffed. With respect to trust,
12.18% disagreed strongly or somewhat strongly with the statement that employees
trusted each other. 5.35% disagreed strongly or somewhat strongly with the statement
that employees worked well together. With respect to employee morale, 35.21%
believed that employee morale in their organizations was low, and with respect to job
satisfaction, 15.34% disagreed strongly or somewhat strongly that most of the employees
were satisfied with their jobs.
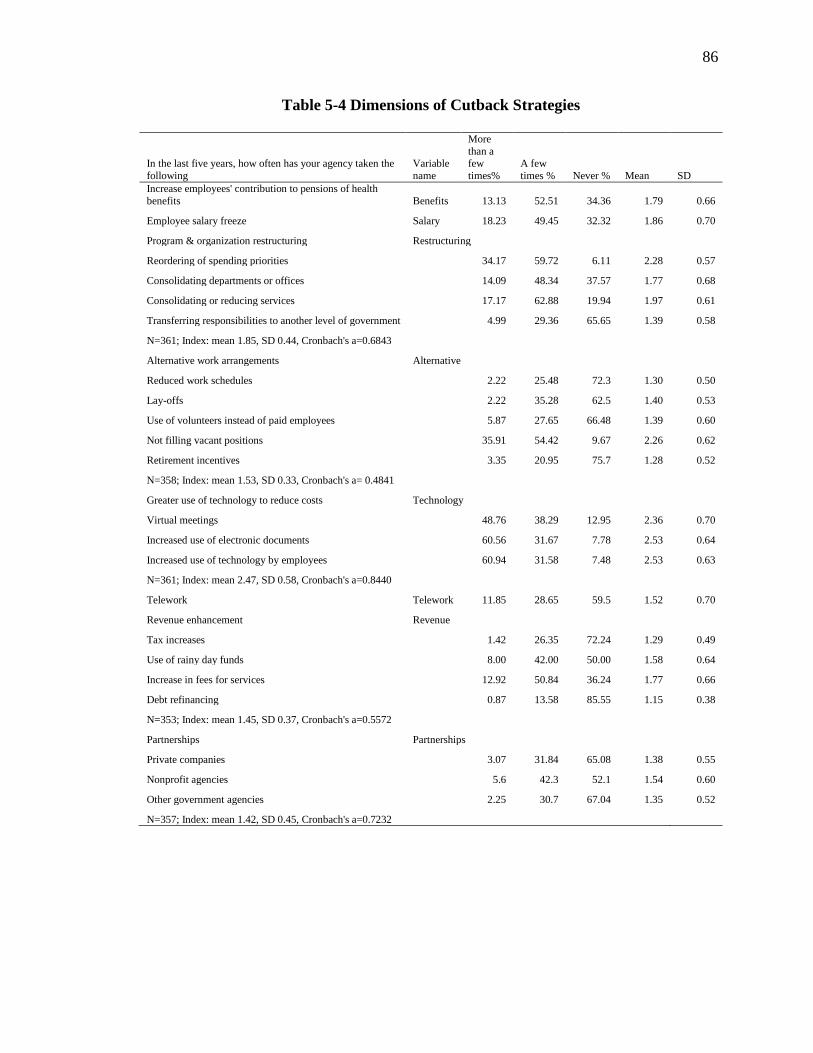
86
86
Table 5-4 Dimensions of Cutback Strategies
In the last five years, how often has your agency taken the
following
Variable
name
More
than a few
times%
A few
times % Never % Mean SD
Increase employees' contribution to pensions of health
benefits Benefits 13.13 52.51 34.36 1.79 0.66
Employee salary freeze Salary 18.23 49.45 32.32 1.86 0.70
Program & organization restructuring Restructuring
Reordering of spending priorities 34.17 59.72 6.11 2.28 0.57
Consolidating departments or offices 14.09 48.34 37.57 1.77 0.68
Consolidating or reducing services 17.17 62.88 19.94 1.97 0.61
Transferring responsibilities to another level of government 4.99 29.36 65.65 1.39 0.58
N=361; Index: mean 1.85, SD 0.44, Cronbach's a=0.6843
Alternative work arrangements Alternative
Reduced work schedules 2.22 25.48 72.3 1.30 0.50
Lay-offs
2.22 35.28 62.5 1.40 0.53
Use of volunteers instead of paid employees 5.87 27.65 66.48 1.39 0.60
Not filling vacant positions 35.91 54.42 9.67 2.26 0.62
Retirement incentives 3.35 20.95 75.7 1.28 0.52
N=358; Index: mean 1.53, SD 0.33, Cronbach's a= 0.4841
Greater use of technology to reduce costs Technology
Virtual meetings 48.76 38.29 12.95 2.36 0.70
Increased use of electronic documents 60.56 31.67 7.78 2.53 0.64
Increased use of technology by employees 60.94 31.58 7.48 2.53 0.63
N=361; Index: mean 2.47, SD 0.58, Cronbach's a=0.8440
Telework Telework 11.85 28.65 59.5 1.52 0.70
Revenue enhancement Revenue
Tax increases 1.42 26.35 72.24 1.29 0.49
Use of rainy day funds 8.00 42.00 50.00 1.58 0.64
Increase in fees for services 12.92 50.84 36.24 1.77 0.66
Debt refinancing 0.87 13.58 85.55 1.15 0.38
N=353; Index: mean 1.45, SD 0.37, Cronbach's a=0.5572
Partnerships Partnerships
Private companies 3.07 31.84 65.08 1.38 0.55
Nonprofit agencies 5.6 42.3 52.1 1.54 0.60
Other government agencies 2.25 30.7 67.04 1.35 0.52
N=357; Index: mean 1.42, SD 0.45, Cronbach's a=0.7232
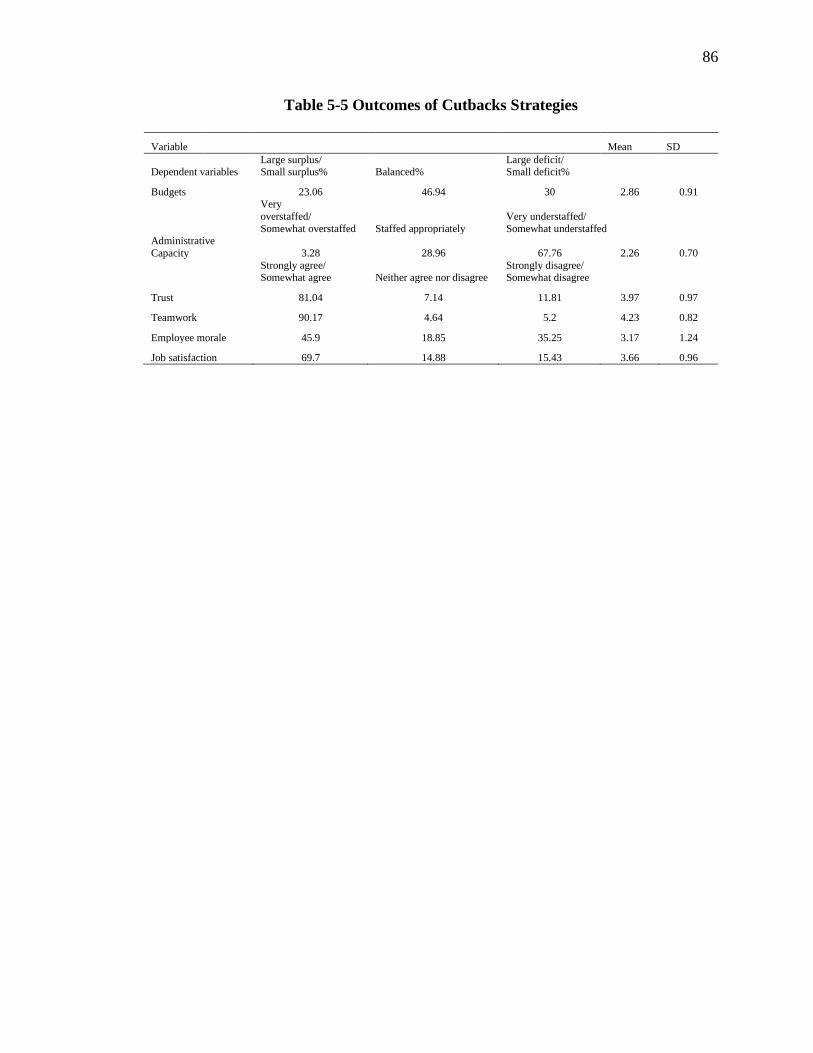
86
87
Table 5-5 Outcomes of Cutbacks Strategies
Variable Mean SD
Dependent variables Large surplus/ Small surplus% Balanced%
Large deficit/ Small deficit%
Budgets
23.06 46.94 30 2.86 0.91
Very
overstaffed/
Somewhat overstaffed Staffed appropriately
Very understaffed/
Somewhat understaffed Administrative
Capacity 3.28 28.96 67.76 2.26 0.70
Strongly agree/ Somewhat agree Neither agree nor disagree
Strongly disagree/ Somewhat disagree
Trust
81.04 7.14 11.81 3.97 0.97
Teamwork 90.17 4.64 5.2 4.23 0.82
Employee morale 45.9 18.85 35.25 3.17 1.24
Job satisfaction 69.7 14.88 15.43 3.66 0.96

88
The focus of the regression analyses in the next section was limited to only those
agencies that actually experienced budget cutbacks in the last five years. Table 5-6
reports that 70 respondents (15.09%) answered, “No budget cutbacks” when asked, “How
would you describe the budget cutbacks in the last five years?” Organizations that did
not experience cutbacks in the last five years were removed because of concerns that they
might not be able to answer the questions that asked whether cutback strategies exist in
fact, and not merely as a possibility.
Table 5-6 How Would You Describe the Budget Cutbacks in the Last Five Years?
Freq. Percent
No budget cutbacks 70 15.09
Modest budget cutbacks 265 57.11
Substantial budget cutbacks 129 27.80
Total 464 100.00
Regression Analyses and Results
Determinants of local government cutback strategies
Table 5-5 presents the findings from an ordered logistic regression for eight
models. The likelihood ratios (χ2) indicated that the model as a whole was statistically
significant, indicating that it is extremely unlikely that these results were due to chance.
Table 5-5 reports the coefficients for the independent variables, which gives us an
appreciation for the magnitude of their effects. The coefficients can be interpreted as the
degree to which a particular variable increases or decreases the likelihood of
implementing cutback strategies.
A brief overview of the regression results is given first, before turning to a more
detailed interpretation of their meaning and implications. First, looking at various
89
cutbacks strategies, the information management index appeared to have strong and
significant relations with the likelihood that a local government implemented salary
freezes, program and organizational restructuring, alternative work arrangements,
telework, and revenue enhancement strategies. This supports earlier findings from the
qualitative study and confirms Hypothesis 2 in part. Second, the importance of state
political leadership also was a significant predictor of program and organizational
restructuring, alternative work arrangements, technology, telework, and partnerships.
The regression results showed that the importance of state political leadership appeared to
play a role in implementing those cutbacks strategies, which supports Hypothesis 5-A in
part. Third, the training and development index did not appear to be related statistically
significantly to cutback strategies, except partnerships, and therefore, provided only
partial support for Hypothesis 1. Fourth, the variable that measured the importance of
county political leadership provided mixed results, but the regression results showed that
county political leadership appeared to play an important role in implementing revenue
enhancement strategies. Thus, Hypothesis 5-B also was supported only in part. Fifth,
diversity as a goal also was a significant predictor of increasing employees’ contributions
to pensions or health benefits. Therefore, Hypothesis 3 was accepted only in part.
Finally, the importance of unions showed mixed results, although the regression showed
that unions appear to be associated positively with program and organizational
restructuring. Overall, the information management index and importance of state
political leadership appeared to matter most in predicting a higher level of
implementation of cutback strategies. In addition, the importance of county political
leadership was related strongly and negatively to a higher likelihood of applying cutback
90
strategies. This provides evidence that cutback strategies are important tools for public
managers in managing a county’s human capacity strategically when an organization is
struggling to weather difficult times. In general, the quantitative findings supported the
results from the qualitative phase.

91
Table 5-7. Regression Analyses of Determinants of Cutback Strategies
Benefits Salary Restructuring Alternative Technology Telework Revenue Partnerships
Training and
Development
Index -0.381 0.062 -0.126 -0.094 0.279 0.048 -0.104 0.417* Information
Management
Index 0.104 0.443** 0.544*** 0.785*** 0.137 0.273* 0.300* 0.183 Importance of
Political
leadership of county -0.057 0.041 -0.062 -0.342** 0.210 -0.412** 0.341** -0.086
Importance of
Political leadership of
state 0.236 0.105 0.370** 0.343** 0.269* 0.438** 0.164 0.257*
Diversity as a
goal 0.341** -0.082 0.048 0.039 0.126 0.239 -0.003 -0.160
Importance of
unions -0.050 -0.047 0.253* -0.017 -0.271** -0.171 0.092 -0.048
Respondent characteristics
Minority -0.410 0.222 -0.307 -0.085 -0.788** -0.352 0.072 -0.463*
Gender 0.312 -0.182 0.230 0.355* -0.039 -0.101 -0.150 -0.265
Organization/contexts
Health -0.918*** 0.124 -0.465** 0.036 -0.170 -0.258 0.402** -0.423** Size of
county 0.118* 0.147** 0.162** 0.318*** 0.153** 0.026 0.048 0.080
Region
Northeast -0.540 -0.030 -0.399 -0.493 -0.671 -1.026**
-0.756** -0.314
Midwest -0.229 0.208 0.476* 0.018 0.243 -0.384 0.330 -0.342
South -0.423 0.540* 0.348 -0.038 -0.014 -0.320 -0.280 -0.038
/cut1 -0.590 0.886 -1.360 -0.826 -1.267 0.782 0.417 0.500
/cut2 2.198 3.195 0.134 1.213 -0.581 2.451 1.635 1.424
Observations 321 325 326 323 325 324 323 324
Χ2 31.7*** 19.21* 39.74*** 47.64*** 27.42*** 19.95** 27.7*** 15.85
Pseudo R2 0.051 0.029 0.032 0.039 0.026 0.033 0.025 0.257
Note: Table shows standardized coefficients. Reference region = West.
* p< 0.10, **p < 0.05, ***p < 0.01 (one-tailed tests).

92
Specifically, the results showed that the information management index is related
positively to implementing salary freezes, program and organizational restructuring,
alternative work arrangements, telework, and revenue enhancement. The effects of the
information management index on increasing employees’ contributions to pensions and
health benefits, technology, and partnerships were not significant, but the pattern of the
findings was in the same direction. This suggests that public managers who place more
importance on automation and HRIS implemented higher levels of cutback strategies.
Information systems provide the tools managers need to minimize operating costs while
maintaining the level of services. Thus, respondents who indicated a greater emphasis on
information management systems, such as computer-assisted testing, resume databases,
and HRM software, were more likely to implement cutback strategies.
The importance placed on state political leadership also resulted in a significant
relationship with implementing program and organizational restructuring, alternative
work arrangements, technology, telework, and partnerships. The importance of state
political leadership refers to the scope and amount of power granted legally to local
administrators and state elected officials. According to Charles Howard Levine et al.
(1981), formal authority is conditioned by the charters of local governments, which
delineate the degree of local authority granted by the state and other aspects of state-local
relations. State statutes that regulate labor relations and collective bargaining also may
constrain formal authority. The charter also typically prescribes several other aspects of
formal authority, including the executive’s power over the budget, power related to
vetoing city council actions, power to appoint and remove department heads, and other
employees, and the terms of office, salary, and method of selection and removal of the

93
executive and other elected and appointed officials (Charles Howard Levine et al., 1981).
The results of this study confirmed Charles Howard Levine et al. (1981) theoretical
framework by showing that public managers are more likely to implement cutback
strategies as information management becomes more important.
The training and development index was statistically significant in partnerships,
but not for the remaining strategies. The relation was in the direction hypothesized for
salary freezes, technology, and telework. Counties that placed importance on training
and development issues formed partnerships with private companies, nonprofit agencies,
and other government agencies. Public agencies are working increasingly with private
and nonprofit organizations, as well as other agencies across multiple levels of
government to deliver services more efficiently and effectively. In this environment, one
of the strongest arguments against partnerships is private producers’ failure to embrace
broader public values in the delivery of services (Frederickson, 2006). Counties that
place importance on training and development issues, such as professional development,
cross training, and mentoring, used partnerships to ensure cost efficient quality control.
It is noteworthy that the variable that measured the importance of county political
leadership showed mixed results. The importance of county political leadership is related
positively to implementing revenue enhancement strategies, while it is related negatively
to applying alternative work arrangements and telework. However, the importance of
county political leadership does not show any statistically significant influence an
increase of employees’ contribution to pension or health benefits, salary freezes, program
and organizational restructuring, technology, or partnerships. One of the reasons for the
mixed results is that the majority of counties do not have elected officials. For example,

94
in New Jersey, only three counties—Mercer, Essex and Bergen—have elected county
executives. Although counties have their own political culture, public managers
perceived that the degree of local authority granted by the state influences state-local
relations more than does county political leadership.
The importance placed on managing for diversity had a strong positive
relationship with increasing employees’ contributions to pensions or health benefits.
Diversity as a goal had no significant relationship with the level of implementing the
remainder of the cutback strategies reported. I found in the interview phase that public
managers considered seniority when they made a decision in response to local
government cutbacks. Therefore, the non-effect of diversity as a goal on administering
cutback strategies is consistent with the findings from the interviews. This is an area that
future research should address, because managing for diversity and cutback management
are two necessities in 21st century management.
The role of unions has both positive and negative effects on the propensity to use
various strategies. Unlike the previous literature, the importance of unions has a positive
effect on restructuring and a negative effect on technology. First, the finding suggests that
managers who value unions are more likely to implement organization-level strategies
rather than individual-level strategies. This is because unions are more involved in
individual well-being, such as defined contributions, salary freezes and alternative work
arrangements. On the contrary, restructuring is more about the consolidation of
departments or offices, which has a minimal impact on individual well-being.
Second, the results reveal that negative effects of unions on technology can be
explained by the job displacement from technology. Public managers who value unions

95
are more likely to worry about the fact that technology may replace human workers.
Automation has been the bigger long-term threat to blue-collar jobs. Although increased
automation would create new, better jobs, there will be very little employment increases
in other occupations to offset the job losses of blue-collar men without college degrees.
With respect to respondent characteristics, first, minority public managers were
less likely to use technology and partnerships. Second, female public managers were
more likely to implement alternative work arrangements. These are areas for future
research because demographic variables can have strong explanatory power in HRM
research (Edgar & Geare, 2004; Goodman et al., 2013). However, race and gender had
no significant relationships with the level of implementation reported for the remaining
cutback strategies. The absence of race and gender effects in implementing cutback
strategies is consistent with the findings from the previous interviews, which indicated
that seniority had the highest priority when public managers made layoff decisions in
response to local government cutbacks.
With respect to the agencies’ functions, pure health agencies were less likely to
increase employees’ contributions to pensions or health benefits, restructure programs
and organizations, or implement partnerships. On the other hand, they were more likely
to carry out revenue enhancement. For example, they were less likely to consolidate or
reduce services, because it has adverse effects on the quality of life of most citizens.
Therefore, public managers preferred to increase funding sources with tax increases, use
of rainy day funds, increases in fees for services, or debt refinancing. By doing so, health
agencies can minimize service effects ono residents while they overcome fiscal crisis.

96
With respect to organizational context, the size of the county appeared to be
important, because it was related positively to the likelihood of implementing increased
employees’ contributions to pensions or health benefits, salary freezes, program and
organizational restructuring, alternative work arrangements, and technology. With
respect to telework, revenue enhancement, and partnerships, the relationship was not
significant, but was in the direction hypothesized. When the size of the county is larger,
public managers were more likely to implement cutback strategies. In summary, these
analyses suggested that it is critical to understand respondent characteristics and
organizational contexts to understand the factors that influence cutback strategies.

97
Outcomes of local government cutback strategies
Table 5-8 reports the results of the six ordered logistic models. The likelihood
ratios (χ2) indicated that the models as a whole are statistically significant, thus
illustrating that is extremely unlikely that these results were due to chance.
In examining the various cutback strategies, some had significantly negative
effects on the outcomes variables. First, as hypothesized, program and organizational
restructuring, telework, and revenue enhancement had strong and negative influences on
budgets. However, partnerships were related positively to budgets. Therefore,
Hypotheses 6 was supported in part. Second, program and organizational restructuring,
and revenue enhancement were related negatively to administrative capacity. However,
cutback strategies did not appear to be statistically significant, except for those two, and
therefore, Hypothesis 7 was substantiated only in part. Third, employee salary freezes,
program and organizational restructuring, and alternative work arrangements were
associated negatively with organizational trust at p < 0.10 or lower. However, the results
provided no evidence for an influence on organizational trust of increasing employees’
contributions to pensions or healthcare benefits, technology, or revenue enhancement and
partnerships. Thus, Hypothesis 8 was accepted in part. Fourth, no variable that measured
cutback strategies appeared to be statistically significant, except for technology, and
therefore, provided only partial support for Hypothesis 9. Fifth, employee salary freezes,
program and organizational restructuring, and partnerships were associated negatively
with employee morale at p < 0.05 or lower, while technology had a positive relationship
with employee morale at p < 0.05. Other strategies had no statistically significant effects,
and accordingly, Hypothesis 10 was accepted only in part. Finally, employee salary

98
freezes, program and organizational restructuring, and alternative work arrangements had
negative associations with job satisfaction at p < 0.10 or lower, while technology and
partnerships were associated positively with job satisfaction at p < 0.10, thus providing
partial support for Hypothesis 11.
Overall, cutback strategies in the last five years appeared to have negative effects
on the current budgets and administrative capacity. Further, implementing cutback
strategies eroded organizational trust, teamwork, employee morale, and workers’ job
satisfaction, just as the theories of survivor syndrome suggest (Brockner & Greenberg,
1990). Interestingly, program and organizational restructuring was associated strongly
with the reduced level of budgets, capacity, trust, employee morale, and job satisfaction.
In response to fiscal stress, supervisors used cutback strategies to increase efficiency and
achieve their goals. While these strategies were effective in responding to fiscal stress,
they had perceived negative consequences. This study provided evidence that health and
human services leaders’ perceptions of cutback strategies were indeed detrimental
overall, because they had negative side effects on budgets and organizational capacity, as
well as the wellbeing of surviving employees.
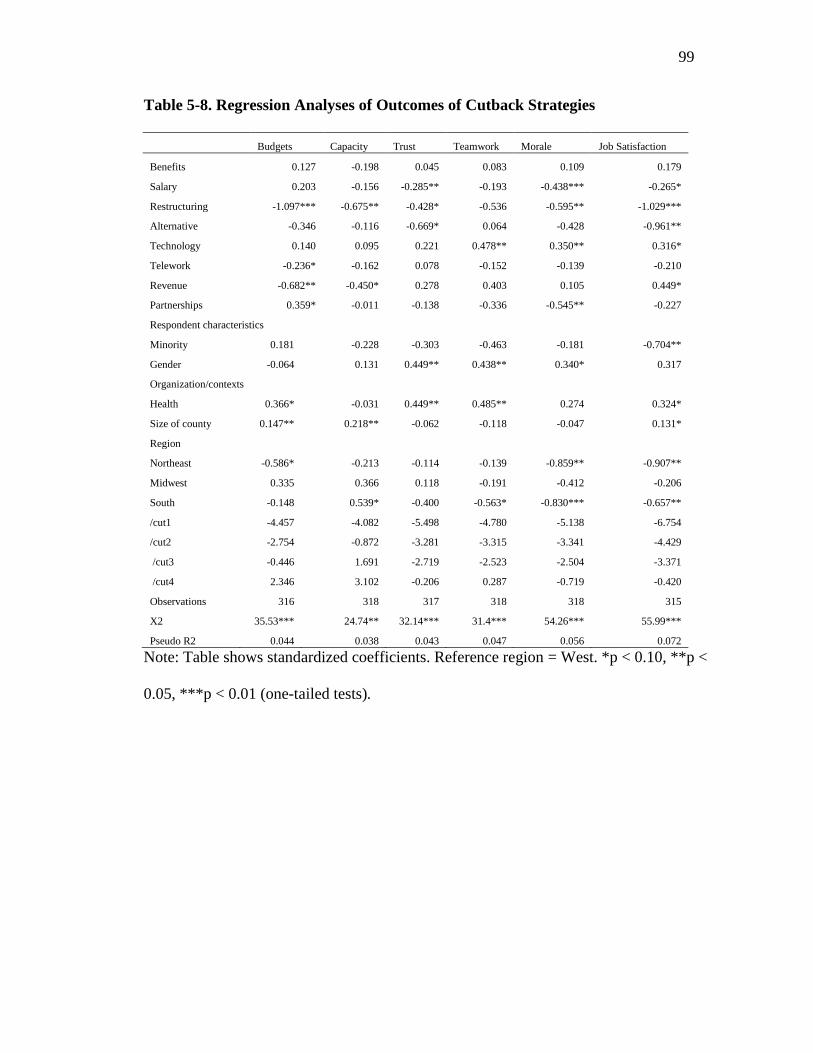
99
99
Table 5-8. Regression Analyses of Outcomes of Cutback Strategies
Budgets Capacity Trust Teamwork Morale Job Satisfaction
Benefits 0.127 -0.198 0.045 0.083 0.109 0.179
Salary 0.203 -0.156 -0.285** -0.193 -0.438*** -0.265*
Restructuring -1.097*** -0.675** -0.428* -0.536 -0.595** -1.029***
Alternative -0.346 -0.116 -0.669* 0.064 -0.428 -0.961**
Technology 0.140 0.095 0.221 0.478** 0.350** 0.316*
Telework -0.236* -0.162 0.078 -0.152 -0.139 -0.210
Revenue -0.682** -0.450* 0.278 0.403 0.105 0.449*
Partnerships 0.359* -0.011 -0.138 -0.336 -0.545** -0.227
Respondent characteristics
Minority 0.181 -0.228 -0.303 -0.463 -0.181 -0.704**
Gender -0.064 0.131 0.449** 0.438** 0.340* 0.317
Organization/contexts
Health 0.366* -0.031 0.449** 0.485** 0.274 0.324*
Size of county 0.147** 0.218** -0.062 -0.118 -0.047 0.131*
Region
Northeast -0.586* -0.213 -0.114 -0.139 -0.859** -0.907**
Midwest 0.335 0.366 0.118 -0.191 -0.412 -0.206
South -0.148 0.539* -0.400 -0.563* -0.830*** -0.657**
/cut1 -4.457 -4.082 -5.498 -4.780 -5.138 -6.754
/cut2 -2.754 -0.872 -3.281 -3.315 -3.341 -4.429
/cut3 -0.446 1.691 -2.719 -2.523 -2.504 -3.371
/cut4 2.346 3.102 -0.206 0.287 -0.719 -0.420
Observations 316 318 317 318 318 315
X2 35.53*** 24.74** 32.14*** 31.4*** 54.26*** 55.99***
Pseudo R2 0.044 0.038 0.043 0.047 0.056 0.072
Note: Table shows standardized coefficients. Reference region = West. *p < 0.10, **p <
0.05, ***p < 0.01 (one-tailed tests).

100
Specifically, the results showed that program and organizational restructuring,
telework, and revenue enhancement were related negatively to the agencies’ budgets at p
< 0.10 or lower. Among cutback strategies, program and organizational restructuring had
the strongest effect. This suggests that organizations still undergo budget deficits even
though they have applied these strategies in the last five years. Contrary to expectations,
partnerships were associated positively with budgets, in that partnerships with private
companies, nonprofit agencies, or other government agencies appeared to improve
budgets.
With respect to administrative capacity, program and organizational restructuring,
and revenue enhancement were related negatively to administrative capacity at p < 0.10
or lower. Although not statistically significant, the remaining cutback strategies, except
for technology, were in the direction expected. These regression results largely
confirmed the detrimental effects of cutback strategies on organizations’ administrative
capacity.
Employee salary freezes, program and organizational restructuring, and
alternative work arrangements were related negatively to organizational trust at p < 0.10
or lower. This finding is consistent with the previous literature, which has indicated that
organizational downsizing has a negative influence on “survivors’” trust (Brockner,
1990).
Concerning teamwork, greater use of technology led to a higher level of trust in
the organization at p < 0.05. This is consistent with previous studies that more integrated
and better use of IT allows public managers to downsize more rationally and efficiently
without decreasing employee teamwork (Pinsonneault & Kraemer, 2002). For example,

101
Pinsonneault and Kraemer (1990) found that electronic meetings had a positive effect on
group processes and outcomes. Similarly, greater use of technology, such as virtual
meetings, increased use of electronic documents, and employees’ increased use of
technology appeared to have positive outcomes.
With respect to employee morale, salary freezes, program and organizational
restructuring, and partnerships had negative effects on surviving employees’ morale.
Again, this result is consistent with the previous literature on survivors’ reactions to job
layoffs (Brockner & Greenberg, 1990). On the other hand, greater use of technology had
a positive effect on survivors’ morale (p < 0.05). Clearly, this finding is consistent with
much of the literature on the effects of electronic meetings on group processes
(Pinsonneault & Kraemer, 1990).
Employee salary freezes, program and organizational restructuring, and
alternative work arrangements were associated negatively with workers’ job satisfaction,
consistent with previous studies (Brockner et al., 1994), while greater use of technology
had a positive effect on survivors’ job satisfaction. Contrary to expectation and the
qualitative findings, revenue enhancement had a statistically significant effect on job
satisfaction. Nonetheless, analyses that are more rigorous are necessary to examine this
subtle relationship between revenue enhancement and survivors’ job satisfaction.
The absence of effects of increasing employees’ contributions to pensions and
health benefits is interesting. No clear relationship was found between increasing
employees’ contributions and outcomes. This is contrary to the hypothesis that it may
have damaged outcomes. For example, the qualitative findings suggested that workers
experienced decreased morale after Governor Christie signed Chapter 78 to introduce

102
pension and health benefit reforms in 2011. The absence of a statistically significant
relationship between increasing employees’ contributions to pensions and health benefits
and outcomes raises an interesting issue for future exploration.
To conclude, the results shown in Table 5-8 provided evidence that cutback
strategies, except technology, resulted in decreased budgets, capacity, trust, morale, and
job satisfaction. This conclusion largely confirms the previous literature on survivor
syndrome (Brockner & Greenberg, 1990). In addition, the positive effect of technology
on teamwork and morale is congruent with existing studies that have suggested that
electronic meetings increase confidence in decisions and group members’ satisfaction
with those decisions (Pinsonneault & Kraemer, 1990).
Summary
What influences cutback strategies?
The first research question asked what factors influence cutback management at
the local government level? The models presented in this study provided empirical
evidence for the importance of variables stressed in normative analyses of cutback
management, and illustrated the ways in which local governments use cutback strategies.
The results showed that counties that place importance on training and development
issues used partnerships. Training and development are important tools that local
governments must take seriously if they expect to continue to provide services as more
and more employees are laid off. Paradoxically, training and development tended to be
the first budget items cut, regardless of how vital they are in securing a talented

103
workforce (Goodman et al., 2013). This is why training and development were not
significant in the other variables except for partnerships.
The information management index was significant in the models of salary
increase, restructuring, alternative work arrangements, telework, and revenue
enhancement. A HRIS is critical for adequate cutback management, as information
management provides for future needs and helps public managers accordingly (Goodman
et al., 2013).
Managers who recognized the importance of state political leadership saw the
need to implement cutback strategies. Another important finding was the significance of
diversity as a goal. In the model, managers who viewed diversity as important were more
likely to increase employees’ contributions to pensions or health benefits. Also
unexpected was the positive relationship between union presence and restructuring. It
appeared that unions are partners in restructuring, while they are a hindrance in
implementing technology. This finding warrants further research.
How cutback strategies influence outcomes
As the preceding results section indicated, past employee experiences with
restructuring in the workplace was the most consistent variable across the models. As
hypothesized, the perception that the agency implemented restructuring more than a few
times had adverse effects on managers’ perceptions of budgets, capacity, trust, morale,
and job satisfaction. The results also indicated that salary freezes were detrimental to
employees’ trust, morale, and job satisfaction. These findings are consistent with
previous literature on the effects of downsizing and staff dismissals on survivors’ work
104
related attitudes and behaviors (Appelbaum, Delage, Labib, & Gault, 1997; Astrachan,
1995; Brockner, Grover, Reed, DeWitt, & O'Malley, 1987; Brockner, Grover, Reed, &
Dewitt, 1992; Gilson, Hurd, & Wagar, 2004; Luthans & Sommer, 1999). If this is so,
cutback strategies indeed may undermine the very public management systems they were
intended to strengthen.
As hypothesized, the perception that the agency used technology to reduce costs
affected employees’ teamwork, morale and job satisfaction positively. This finding
confirmed the previous literature that has suggested that IT can be a catalyst in the
redesign of business processes (Pinsonneault & Kraemer, 2002). Information technology
includes virtual meetings, increased use of electronic documents, and employees’
incremental application of technology. IT also can enhance the depth of analysis of
groups, increase participation, decrease domination by a few members, and increase
decision quality (Pinsonneault & Kraemer, 1990). This indicates that increased use of
technology to reduce costs may be the best alternative plan in response to local
government cutbacks.
Interestingly, county size also was a significant predictor, indicating that
respondents in larger counties tended to have larger budgets, capacity, and higher levels
of job satisfaction. With respect to an agency’s function, health agencies reported that
their employees were more trusting, teamwork oriented, and satisfied. It also is
interesting to note that female respondents tended to report that their employees were
more trusting, teamwork-oriented, and satisfied. One way to interpret these findings is
that female managers adopt a more democratic (or participative) style than do their male
counterparts (Eagly, Karau, & Johnson, 1992). Perhaps female managers’ “…less

105
hierarchical and more participatory, interactional, flexible, consociational, and
multifaceted” (Meier, O’Toole, & Goerdel, 2006, p. 25) management style enables
employees to be more trusting, teamwork-oriented, and satisfied in response to cutbacks,
although this relationship needs further investigation.

106
Chapter Six: Experimental Results
As Chapter 3 described, the experimental design included two groups—one group
was asked to imagine 2 percent cutbacks, while the other was asked to assume 10 percent
cutbacks. This study used these two conditions from the budget sequestration in 2013
that was implemented by the federal government. Through a special provision in the
Budget Control Act of 2011, Medicare spending rates were reduced by a fixed 2 percent
per year versus the other domestic percents planned for the sequestration. Defense
spending likewise was reduced by 10 percent in 2013. Federal pay rates (including
military) were unaffected, but the sequestration did result in furloughs. Because they
benefitted from federal support, federal spending cuts affected local governments directly.
Therefore, it would be instructive for policymakers to understand the way in which local
cutback levels are related to the likelihood of implementing cutback strategies.
This chapter focuses on managers’ reactions to budget cutbacks under the two
cutback scenarios. As discussed in Chapter 2, there are various cutbacks strategies. Cost
reductions in compensation involve increasing employees’ contributions to pensions or
health benefits and employee salary freezes. Program and organizational restructuring
encompasses reordering spending priorities, consolidating departments or offices,
consolidating or reducing services, and transferring responsibilities to other levels of
government. Alternative work arrangements include reduced work schedules, furloughs,
lay-offs, using volunteers rather than paid employees, not filling vacant positions, and
retirement incentives. Increased use of technology to reduce costs consists of virtual
meetings, increased use of electronic documents, and employees’ increased use of
technology, as well as telework (i.e., telecommuting). Revenue enhancement comprises

107
tax increases, use of rainy day funds, increased fees for services, and debt refinancing.
Finally, partnerships include those with private companies, nonprofit agencies, and other
government agencies.
This chapter begins by presenting descriptive findings, including measures of
cutback strategies in local governments. It then presents Chi-squared test results that
examined whether the level of hypothetical cutbacks influenced the strategies leaders
chose.
Descriptive Results
Appendix D shows the number of participants in each of the two treatment groups,
as well as their demographic characteristics and counties. In a typical fully randomized
design, the treatment and control groups should have the same characteristics with the
exception of the treatment they are given (Remler & Van Ryzin, 2010). Comparison of
the profiles of responding organizations and respondents did not demonstrate any
significant differences between the two. Thus, it appears that there was no obvious,
systematic difference or potential bias in the two groups related to the types of
organizations, and the individuals who responded. The absence of statistically significant
differences across groups assigned randomly to each condition confirmed the statistical
equivalence of the experimental groups (Appendix A).
Results Overall
It is important and necessary to compare whether different levels of cutbacks
generated preferences for different strategies. This study used Chi-squared tests to
compare the results of the 2 percent and 10 percent cutback conditions with respect to the
strategies used. The following results are organized by strategy type, specifically

108
compensation, restructuring, work arrangements, technology, revenue enhancement, and
partnerships.
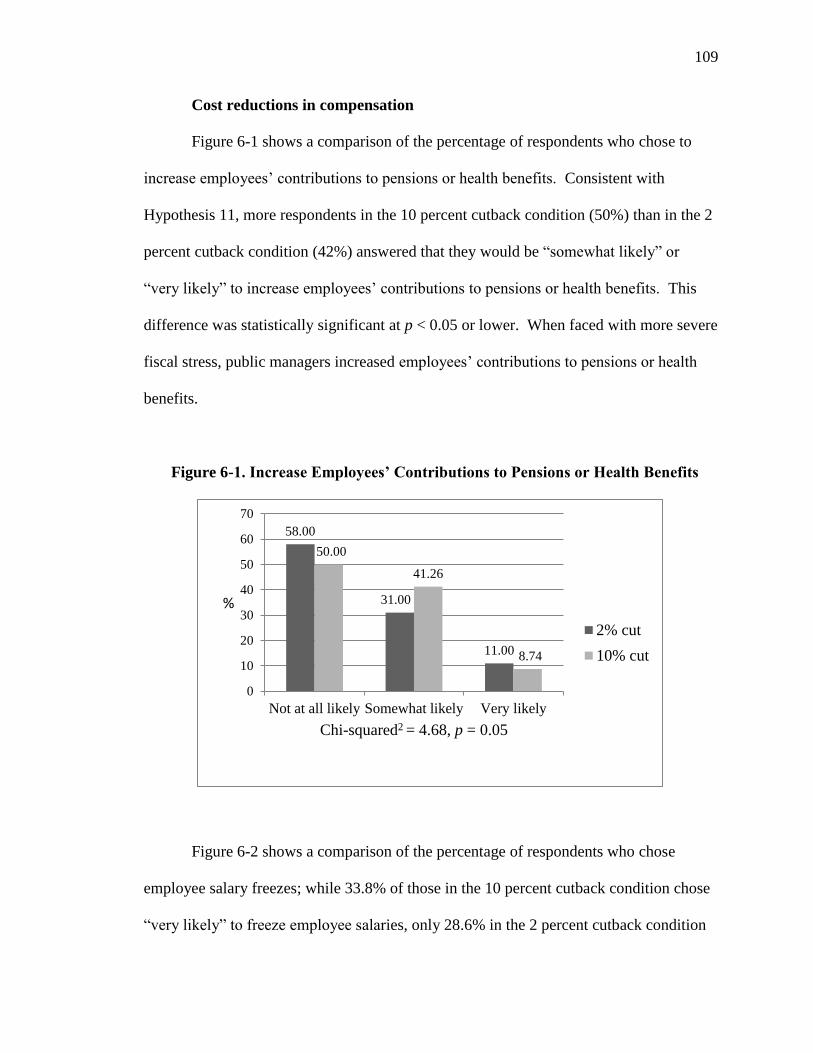
109
Cost reductions in compensation
Figure 6-1 shows a comparison of the percentage of respondents who chose to
increase employees’ contributions to pensions or health benefits. Consistent with
Hypothesis 11, more respondents in the 10 percent cutback condition (50%) than in the 2
percent cutback condition (42%) answered that they would be “somewhat likely” or
“very likely” to increase employees’ contributions to pensions or health benefits. This
difference was statistically significant at p < 0.05 or lower. When faced with more severe
fiscal stress, public managers increased employees’ contributions to pensions or health
benefits.
Figure 6-1. Increase Employees’ Contributions to Pensions or Health Benefits
Figure 6-2 shows a comparison of the percentage of respondents who chose
employee salary freezes; while 33.8% of those in the 10 percent cutback condition chose
“very likely” to freeze employee salaries, only 28.6% in the 2 percent cutback condition
58.00
31.00
11.00
50.00
41.26
8.74
0
10
20
30
40
50
60
70
Not at all likely Somewhat likely Very likely
%
Chi-squared2 = 4.68, p = 0.05
2% cut
10% cut

110
made this choice. This difference was statistically significant at p < 0.01 or lower. This
finding again provides clear support for Hypothesis 11 that administrative responses are
associated directly with changes in resource levels. When the decline in financial
resources becomes severe, governments begin to use targeted cutting strategies (Chen,
2016).
Figure 6-2. Employee Salary Freezes
Program and organization restructuring
Figure 6-3 reports a comparison of the percentage of respondents who chose to
reorder spending priorities. There was no significant difference between those in the 2
percent and 10 percent cutback conditions, thus providing no support for Hypothesis 11.
However, the patterns of the findings was in the same direction as the previous findings.
Figure 6-4 shows a comparison of the percentage of respondents who chose to
consolidate departments or offices. 69.9% in the 10 percent cutback condition indicated
33.17
38.12
28.71
20.29
45.89
33.82
0
5
10
15
20
25
30
35
40
45
50
Not at all likely Somewhat likely Very likely
%
Chi-squared2 = 4.68, p = 0.007
2% cut
10% cut
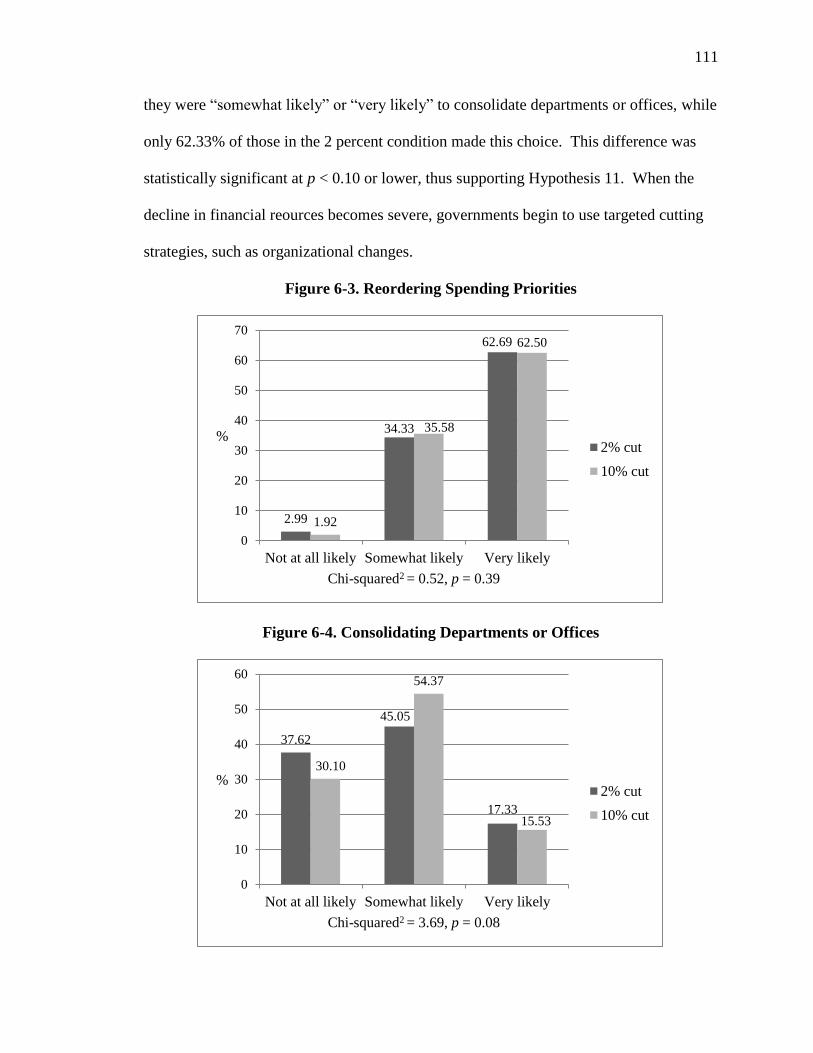
111
they were “somewhat likely” or “very likely” to consolidate departments or offices, while
only 62.33% of those in the 2 percent condition made this choice. This difference was
statistically significant at p < 0.10 or lower, thus supporting Hypothesis 11. When the
decline in financial reources becomes severe, governments begin to use targeted cutting
strategies, such as organizational changes.
Figure 6-3. Reordering Spending Priorities
Figure 6-4. Consolidating Departments or Offices
2.99
34.33
62.69
1.92
35.58
62.50
0
10
20
30
40
50
60
70
Not at all likely Somewhat likely Very likely
%
Chi-squared2 = 0.52, p = 0.39
2% cut
10% cut
37.62
45.05
17.33
30.10
54.37
15.53
0
10
20
30
40
50
60
Not at all likely Somewhat likely Very likely
%
Chi-squared2 = 3.69, p = 0.08
2% cut
10% cut

112
Figure 6-5 reports a comparison of the percentage of respondents who chose to
consolidate or reduce services. There was no significant difference between the two
cutback conditions. This finding suggests clearly that, with respect to service cuts, public
managers tended to either ignore problems or postpone spending to the future.
Figure 6-6 reports a comparison of the percentage of respondents who chose to
transfer responsibilities to another level of government. 26.70% in the 10 percent cut
chose “somewhat likely” to do so, and 22.73% in the 2 percent condition made this
choice, which was not a significant difference, again providing no evidence to support
Hypothesis 11.
Figure 6-5. Consolidating or Reducing Services
24.62
48.24
27.14
18.45
54.85
26.70
0
10
20
30
40
50
60
Not at all likely Somewhat likely Very likely
%
Chi-squared2 = 2.66, p = 0.13
2% cut
10% cut

113
Figure 6-6. Transferring Responsibilities to another Level of Government
Alternative work arrangements
Figure 6-7 reports a comparison of the percentage of respondents who chose to
reduce work schedules. While 52.91% in the 10 percent condition chose “somewhat
likely” or “very likely” to reduce work schedules, only 39.2% in the 2 percent condition
made this choice. The difference was statistically significant at p < 0.01 or lower. This
finding supported Hypothesis 11, in that the comparisons confirmed that governments
began to use targeted cutting strategies when the decline in financial resources was severe.
72.22
22.73
5.05
70.87
26.70
2.43
0
10
20
30
40
50
60
70
80
Not at all likely Somewhat likely Very likely
%
Chi-squared2 = 2.54, p = 0.14
2% cut
10% cut
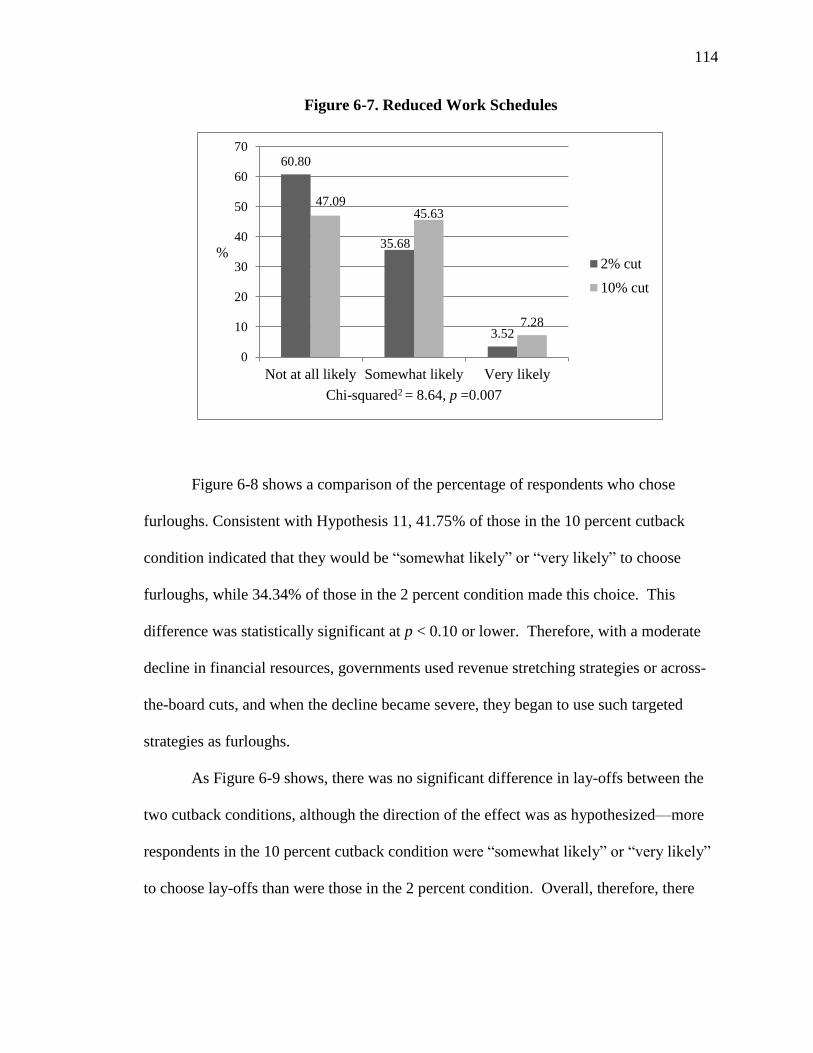
114
Figure 6-7. Reduced Work Schedules
Figure 6-8 shows a comparison of the percentage of respondents who chose
furloughs. Consistent with Hypothesis 11, 41.75% of those in the 10 percent cutback
condition indicated that they would be “somewhat likely” or “very likely” to choose
furloughs, while 34.34% of those in the 2 percent condition made this choice. This
difference was statistically significant at p < 0.10 or lower. Therefore, with a moderate
decline in financial resources, governments used revenue stretching strategies or across-
the-board cuts, and when the decline became severe, they began to use such targeted
strategies as furloughs.
As Figure 6-9 shows, there was no significant difference in lay-offs between the
two cutback conditions, although the direction of the effect was as hypothesized—more
respondents in the 10 percent cutback condition were “somewhat likely” or “very likely”
to choose lay-offs than were those in the 2 percent condition. Overall, therefore, there
60.80
35.68
3.52
47.09 45.63
7.28
0
10
20
30
40
50
60
70
Not at all likely Somewhat likely Very likely
%
Chi-squared2 = 8.64, p =0.007
2% cut
10% cut

115
was no direct relation between the severity of cutbacks and lay-offs. Increasing the level
of cutbacks may not be sufficient to lead leadership to lay off employees.
Figure 6-8. Furloughs
Figure 6-9. Lay-offs
65.66
30.30
4.04
58.25
33.01
8.74
0
10
20
30
40
50
60
70
Not at all likely Somewhat likely Very likely
%
Chi-squared2 = 4.59, p = 0.05
2% cut
10% cut
56.35
35.53
8.12
50.00
40.29
9.71
0
10
20
30
40
50
60
Not at all likely Somewhat likely Very likely
%
Chi-squared2 = 1.65, p = 0.22
2% cut
10% cut

116
Figure 6-10 shows the results of a Chi-squared test on the use of volunteers rather
than paid employees. 7.21% of respondents in the 10 percent condition chose “very
likely” to reduce paid employees work schedules, and 7% in the 2 percent condition did
the same. There difference were not significant, again providing no support for
Hypothesis 11. According to the findings, public managers in local governments did not
use volunteers rather than paid employees strategically in response to budget cutbacks.
Instead, they were likely to maintain the status quo.
Figure 6-10. Use of Volunteers Rather than Paid Employees
Figure 6-11 reports comparisons of the percentage of respondents who chose not
to fill vacant positions. 62.98% in the 10 percent cutback condition chose “very likely”
to reduce work schedules, and 62.07% in the 2 percent condition made this choice, a non-
significant difference that provided no support for Hypothesis 11. Although the results
were not significant, the patterns of the findings were in the same direction. One possible
61.50
31.50
7.00
62.50
30.29
7.21
0
10
20
30
40
50
60
70
Not at all likely Somewhat likely Very likely
%
Chi-squared2 = 0.07, p = 0.48
2% cut
10% cut

117
reason for this finding is that the level of cutbacks simply was not enough to represent a
significant change in cutback strategies. When financial resources decline, but only
slightly, governments tend to either ignore problems or postpone spending to the future—
the “denial and delay” strategy (Chen, 2016). Not filling vacant positions is such a
strategy, in that 62.07% of respondents in the 2 percent cutback condition were very
likely to choose not to fill vacant positions.
Figure 6-11. Not Filling Vacant Positions
Figure 6-12 reports comparisons of the percentage of respondents who chose to
offer retirement incentives. 8.74% of those in the 10 percent cutback condition chose
“very likely” to provide retirement incentives, and 8% in the 2 percent condition made
this choice. There was no significant difference between these, which again, provided no
evidence to support Hypothesis 11. 72.5% of respondents in the 2 percent cutback
condition chose “not at all likely” to provide retirement incentives compared to 68.96%
5.42
32.51
62.07
4.33
32.69
62.98
0
10
20
30
40
50
60
70
Not at all likely Somewhat likely Very likely
%
Chi-squared2 = 0.27, p = 0.44
2% cut
10% cut

118
in the 10 percent condition. Therefore, increasing the level of cutbacks may not be
sufficient to cause leadership to offer retirement incentives.
Figure 6-12. Retirement Incentives
Greater use of technology
Figure 6-13 shows comparisons of the percentage of respondents who chose
virtual meetings. 32.37% in the 10 percent cutback condition chose “very likely” to have
virtual meetings, and 29.85% in the 2 percent condition made this choice. The two
percentages did not differ significantly, and thus did not support Hypothesis 11.
Therefore, there was no direct relation between the level of cutbacks and virtual meetings.
Figure 6-14 reports comparisons of the percentage of respondents who chose
increased use of electronic documents. 34.78% in the 10 percent cutback condition chose
“somewhat likely” to increase use of electronic documents, and 33.33% in the 2 percent
condition did so, a non-significant difference that did not support Hypothesis 11.
72.50
19.50
8.00
67.96
23.30
8.74
0
10
20
30
40
50
60
70
80
Not at all likely Somewhat likely Very likely
%
Chi-squared2 = 1.05, p = 0.30
2% cut
10% cut

119
Figure 6-13. Virtual Meetings
Figure 6-14. Increased Use of Electronic Documents
Figure 6-15 shows comparisons of the percentage of respondents who chose
increased use of electronic documents. 58.65% in the 10 percent cutback condition chose
“somewhat likely” to increase employees’ use of technology, and 54.46% in the 2 percent
11.44
29.85
58.71
10.14
32.37
57.49
0
10
20
30
40
50
60
70
Not at all likely Somewhat likely Very likely
%
Chi-squared2 = 0.40, p = 0.41
2% cut
10% cut
9.45
33.33
57.21
8.21
34.78
57.00
0
10
20
30
40
50
60
70
Not at all likely Somewhat likely Very likely
%
Chi-squared2 = 0.24, p = 0.44
2% cut
10% cut

120
condition made this choice. There was no significant difference between the two cutback
conditions, again providing no evidence to support Hypothesis 11.
Figure 6-15. Employees’ Increased Use of Technology
Figure 6-16 shows comparisons of the percentage of respondents who chose
telework. While 22.82% of those in the 10 percent condition chose “very likely” to
implement telework, only 18% in the 2 percent condition made this choice. This
difference was statistically significant at p < 0.10 or lower, consistent with Hypothesis 11.
In organizations in which the leaders perceived severe cutbacks, they were more likely to
respond with greater use of telework. Although an improved work-life balance is one of
the primary benefits of telework, such arrangements have several other advantages for
organizations in cost savings related to office maintenance, transportation, energy, and
the environment, as well as the increased continuity of operations in emergency situations
and natural disasters (Caillier, 2011; D. Lee & Kim, 2016; Major et al., 2008; Maruyama
10.89
34.65
54.46
8.65
32.69
58.65
0
10
20
30
40
50
60
70
Not at all likely Somewhat likely Very likely
%
Chi-squared2 = 0.96, p = 0.31
2% cut
10% cut
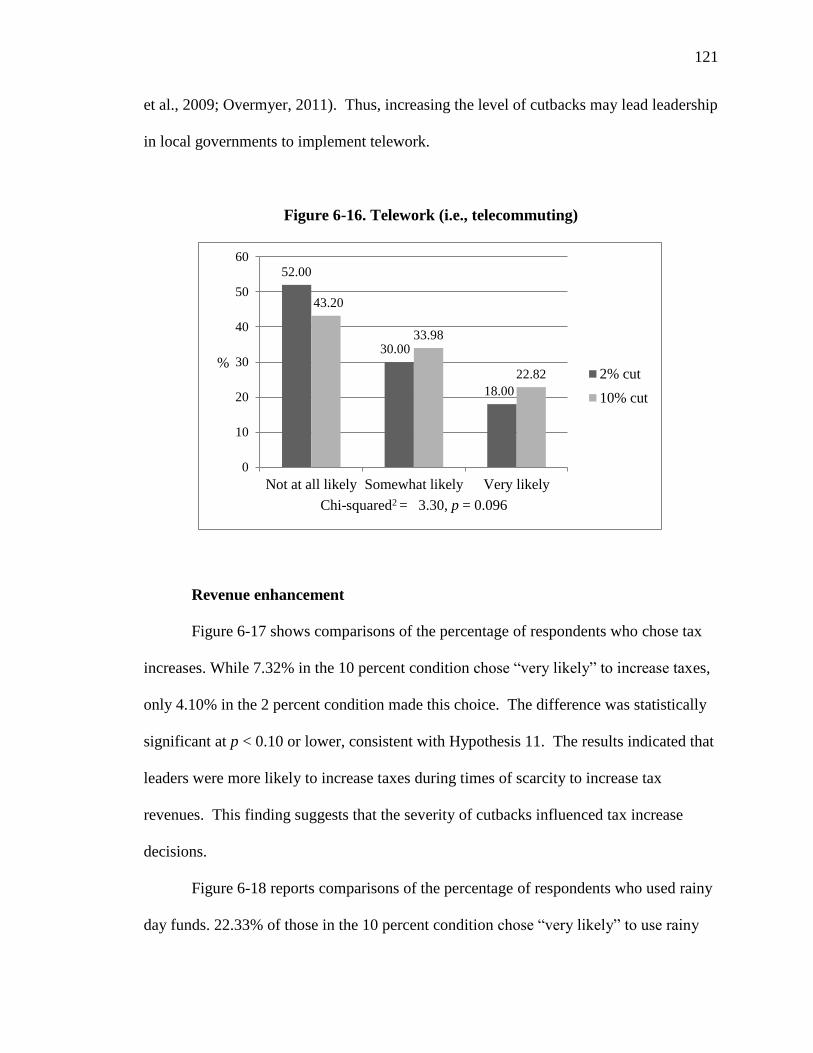
121
et al., 2009; Overmyer, 2011). Thus, increasing the level of cutbacks may lead leadership
in local governments to implement telework.
Figure 6-16. Telework (i.e., telecommuting)
Revenue enhancement
Figure 6-17 shows comparisons of the percentage of respondents who chose tax
increases. While 7.32% in the 10 percent condition chose “very likely” to increase taxes,
only 4.10% in the 2 percent condition made this choice. The difference was statistically
significant at p < 0.10 or lower, consistent with Hypothesis 11. The results indicated that
leaders were more likely to increase taxes during times of scarcity to increase tax
revenues. This finding suggests that the severity of cutbacks influenced tax increase
decisions.
Figure 6-18 reports comparisons of the percentage of respondents who used rainy
day funds. 22.33% of those in the 10 percent condition chose “very likely” to use rainy
52.00
30.00
18.00
43.20
33.98
22.82
0
10
20
30
40
50
60
Not at all likely Somewhat likely Very likely
%
Chi-squared2 = 3.30, p = 0.096
2% cut
10% cut

122
day funds, while only 14.95% in the 2 percent condition made this choice. This
difference was statistically significant at p < 0.05 or lower, consistent with Hypothesis 11.
Use of rainy day funds, also known as budget stabilization funds (BSF), is an alternative
to avoid cyclical revenue volatility by setting aside funds during prosperous years to
cover shortfalls during economic downturns. The results suggested that public managers
would spend rainy day funds to meet unmet needs in response to the 10 percent cutback,
but were likely to maintain these funds in response to the 2 percent cutback.
Figure 6-17. Tax Increases
67.18
28.72
4.10
58.54
34.15
7.32
0
10
20
30
40
50
60
70
80
Not at all likely Somewhat likely Very likely
%
Chi-squared2 = 3.92, p = 0.07
2% cut
10% cut

123
Figure 6-18. Use of Rainy Day Funds
Figure 6-19 reports comparisons of the percentage of respondents who chose to
increase fees for services. 24.64% in the 10 percent condition chose “very likely” to
increase fees for services, and 23.86% in the 2 percent condition made this choice. There
was no significant difference between the two conditions, again providing no evidence to
support Hypothesis 11.
45.36
39.69
14.95
34.95
42.72
22.33
0
5
10
15
20
25
30
35
40
45
50
Not at all likely Somewhat likely Very likely
%
Chi-squared2 = 5.83, p = 0.03
2% cut
10% cut
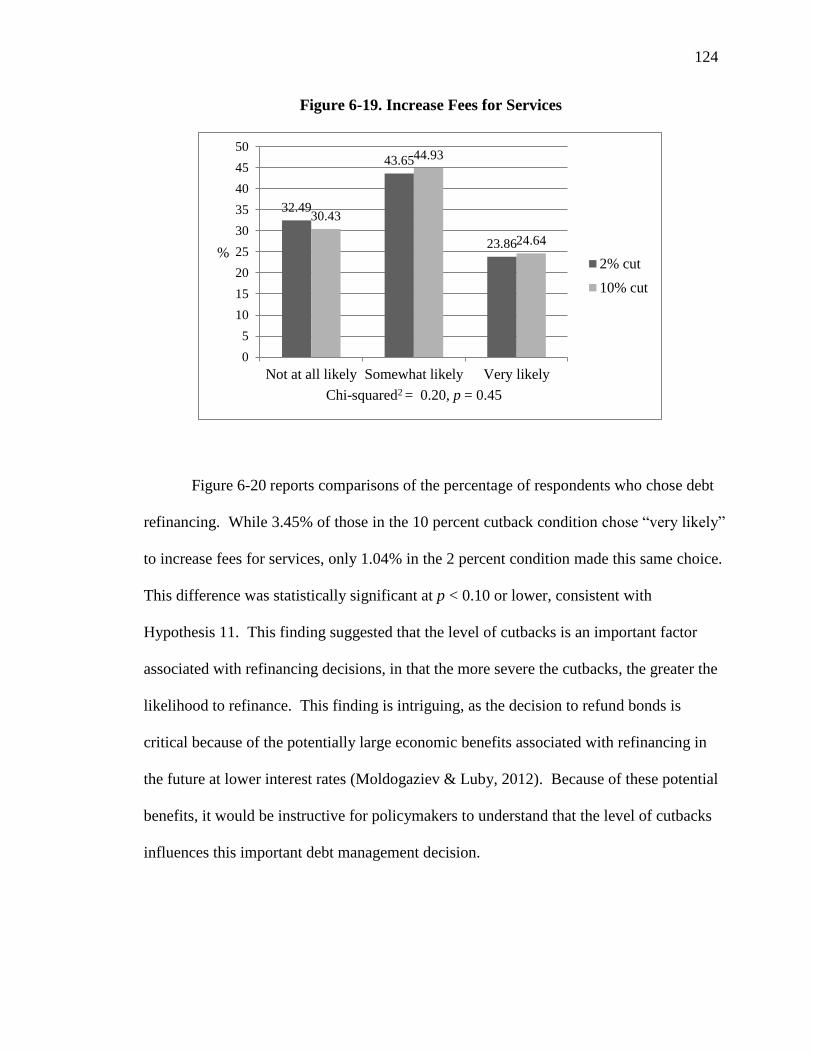
124
Figure 6-19. Increase Fees for Services
Figure 6-20 reports comparisons of the percentage of respondents who chose debt
refinancing. While 3.45% of those in the 10 percent cutback condition chose “very likely”
to increase fees for services, only 1.04% in the 2 percent condition made this same choice.
This difference was statistically significant at p < 0.10 or lower, consistent with
Hypothesis 11. This finding suggested that the level of cutbacks is an important factor
associated with refinancing decisions, in that the more severe the cutbacks, the greater the
likelihood to refinance. This finding is intriguing, as the decision to refund bonds is
critical because of the potentially large economic benefits associated with refinancing in
the future at lower interest rates (Moldogaziev & Luby, 2012). Because of these potential
benefits, it would be instructive for policymakers to understand that the level of cutbacks
influences this important debt management decision.
32.49
43.65
23.86
30.43
44.93
24.64
0
5
10
15
20
25
30
35
40
45
50
Not at all likely Somewhat likely Very likely
%
Chi-squared2 = 0.20, p = 0.45
2% cut
10% cut
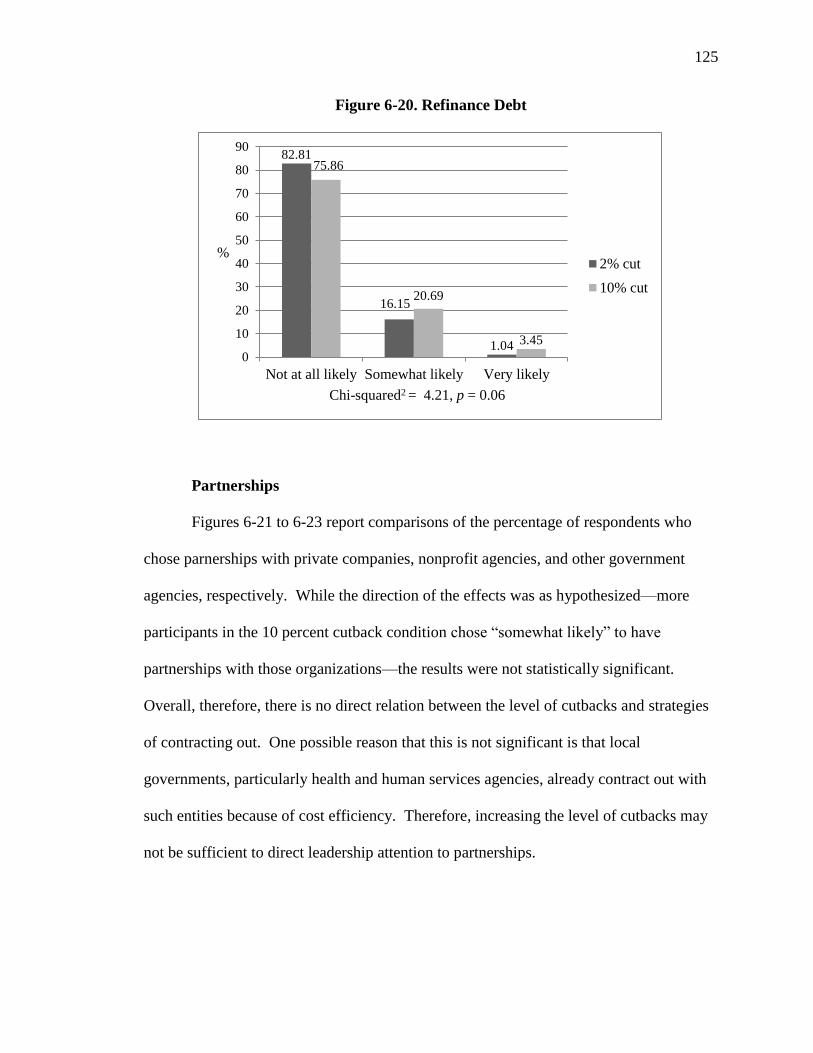
125
Figure 6-20. Refinance Debt
Partnerships
Figures 6-21 to 6-23 report comparisons of the percentage of respondents who
chose parnerships with private companies, nonprofit agencies, and other government
agencies, respectively. While the direction of the effects was as hypothesized—more
participants in the 10 percent cutback condition chose “somewhat likely” to have
partnerships with those organizations—the results were not statistically significant.
Overall, therefore, there is no direct relation between the level of cutbacks and strategies
of contracting out. One possible reason that this is not significant is that local
governments, particularly health and human services agencies, already contract out with
such entities because of cost efficiency. Therefore, increasing the level of cutbacks may
not be sufficient to direct leadership attention to partnerships.
82.81
16.15
1.04
75.86
20.69
3.45
0
10
20
30
40
50
60
70
80
90
Not at all likely Somewhat likely Very likely
%
Chi-squared2 = 4.21, p = 0.06
2% cut
10% cut

126
Figure 6-21. Partnerships with Private Companies
Figure 6-22. Partnerships with Nonprofit Agencies
67.01
28.93
4.06
63.59
31.07
5.34
0
10
20
30
40
50
60
70
80
Not at all likely Somewhat likely Very likely
%
Chi-squared2 = 0.68, p = 0.36
2% cut
10% cut
44.95 45.96
9.09
39.61
49.76
10.63
0
10
20
30
40
50
60
Not at all likely Somewhat likely Very likely
%
Chi-squared2 = 1.23, p = 0.27
2% cut
10% cut

127
Figure 6-23. Partnerships with Other Government Agencies
Summary
In summary, the experimental findings confirmed the preliminary conclusion of
the qualitative phase of this study, in that the level of cutbacks influenced cost reductions
in compensation, increasing employees’ contributions to pensions or health benefits, and
employee salary freezes. With respect to program and organizational restructuring,
consolidating departments or offices was associated with the severity of cutbacks.
However, the experimental results showed no evidence that cutback levels influenced
reordering spending priorities, consolidating or reducing services, or transferring
responsibilities to another level of government. Among alternative work arrangements,
the results showed some empirical evidence that the severity of cutbacks led to reduced
work schedules and furloughs. However, there was no effect on lay-offs, using
volunteers rather than paid employees, not filling vacant positions, or offering retirement
incentives. With respect to greater use of technology to reduce costs, the experiment
55.61
39.29
5.10
55.67
39.90
4.43
0
10
20
30
40
50
60
Not at all likely Somewhat likely Very likely
%
Chi-squared2 = 0.10 p = 0.50
2% cut
10% cut

128
indicated that the level of cutbacks was related closely to managers’ approaches to
telework. However, there were no significant effects on virtual meetings, increased use
of electronic documents, or employees’ increased use of technology. With respect to
revenue enhancement, the results showed especially significant effects on tax increases,
use of rainy day funds, and debt refinancing, although varying the level of cutbacks did
not have an effect on increased fees for services. With respect to partnerships, cutback
level had no effects on the likelihood of forming partnerships with private companies,
nonprofit agencies, and other government agencies.
Consistent with the previous literature, the severity of cutbacks appeared to be
one of the most important factors in explaining why some local governments made these
important cutback management decisions, especially increasing employees’ contributions
to pensions or health benefits, freezing employee salaries, consolidating departments or
offices, reducing work schedules, and increasing furloughs, telework, taxes, use of rainy
day funds, and debt refinancing. These results confirm Rubin and Willoughby (2009)
finding that the severity of budgetary crises affects state budgetary decisions. The
experiment found empirical evidence that public managers take advantage of direct
personnel costs, organizational restructuring, and revenue enhancement to reduce costs
and keep the organization functioning.
The lack of significant findings are also important, as they suggest that the effects
of cutback levels may be strategy-specific. There are three strategies used in
administrative responses to different levels of fiscal stress: denial and delay, stretching
revenue, and cutting and smoothing strategies (Charles Howard Levine et al., 1981).
Wolman and Davis (1980) argued that local governments under fiscal stress will respond
129
first with strategies to “buy time” to delay the necessary actions to increase revenues or
cut spending. After employing these strategies, governments consider increasing
intergovernmental revenues or own-source revenues (Chen, 2013). The authors argued
further that, if the above strategies have already been used, the government will begin to
make selective reductions, which proceed from relatively invisible to visible areas.
Hence, it is possible that with respect to some strategies, such as partnerships, and
shifting service responsibilities to other government agencies, public managers are likely
to maintain the status quo.
130
Chapter Seven: Discussion, Limitations, and Implications
This chapter summarizes the findings, discusses the study’s limitations, as well as
both its theoretical and practical implications, and provides suggestions for future
research.
Summary of the Study
This study was designed to explore the factors and outcomes of HR strategies in
response to cutbacks. The theoretical framework of this study described the relations
among the financial resources, formal authority, interest groups, administrative responses,
and outcomes (Charles Howard Levine et al., 1981). This framework was useful in
explaining local governments’ responses to the 2009 recession. This is one of the first
studies that explored empirically factors that influence the ways in which local
governments react to cutbacks, and the outcomes of cutback management.
Drawing on in-depth interviews with executive directors at 17 health and human
services agencies across the U.S., the study first identified the main factors that account
for HR strategies in response to local government cutbacks: training and development,
information management, political leadership, diversity as a goal, and the role of unions.
A sample of 394 health and human services directors who actually experienced budget
cutbacks in the past five years suggested that reordering spending priorities was the
strategy used most frequently, while reduced work schedules, retirement incentives, and
debt refinancing ranked rather low on the list. Increased use of technology on the part of
employees, increased use of electronic documents, not filling vacant positions, and virtual
meetings also ranked high on the list. Furthermore, the HR strategies in response to
131
cutbacks appeared to have negative effects on budgets, administrative capacity, trust in
organizations, teamwork, employee morale, and job satisfaction.
Results from the analyses of the survey showed that the information management
index was a significant predictor of the use of salary cuts, restructuring, alternative work
arrangements, telework, and revenue enhancement. Respondents who placed a greater
emphasis on information management systems, such as computer-assisted testing, resume
databases, and HR management software, were more likely to employ these cutback
strategies. The findings showed that a HRIS is critical in adequate cutback management,
as it accounts for future needs and helps public managers accordingly (Goodman et al.,
2013).
Furthermore, managers who recognized the importance of state political
leadership were likely to implement cutback strategies. The results of this study
suggested that the influence of the state government, especially the governor, is an
important determinant of HR strategies. With respect to budgets, state politics and
county administrations are related closely. According to the qualitative interviews, New
Jersey, which has a Republican governor, and Pennsylvania, which has a Democratic
governor, responded differently to budget cutbacks. In New Jersey, Governor Christie
signed Chapter 78 to introduce pension and health benefit reforms in 2011. Accordingly,
New Jersey county governments increased employees’ contributions to pensions and
health benefits. In contrast, when Pennsylvania experienced a state budget impasse
between June 2015 and March 2016, some of the county governments chose to use rainy
day funds. Not surprisingly, the importance of state political leadership was a significant
predictor of the implementation of program and organizational restructuring, alternative
132
work arrangements, technology, telework, and partnerships. This finding reflects the so-
called “politics” school, which illustrates that politics is very much a part of
administration.
The results of this study demonstrated that restructuring was associated strongly
with reduced budgets, capacity, trust, employee morale, and job satisfaction. The
negative influence of restructuring on trust, employee morale, and job satisfaction is
consistent with the survivor syndrome literature, which suggests a possible negative
association between cutback management and government employees’ work attitudes,
including their level of job satisfaction (Jilke, 2015).
The study also showed that technology is related positively to teamwork,
employee morale, and job satisfaction. These findings suggested that information
technology can be a successful strategy in mitigating several negative effects of cutback
management. Public managers perceived that greater use of technology to reduce costs
can minimize detrimental effects while maintaining the same level of services. These
findings warrant further research.
What we can conclude more broadly about the experimental study is the
following. Charles Howard Levine et al. (1981) identified three stages of administrative
response to different levels of fiscal stress. The first stage, “denial and delay strateges,”
is associated with slow or no growth in financial resources. The second, “stretching
revenue strategies,” is associated with moderate decline, and the third, “cutting and
smoothing strategies,” is associated with severe declines. However, this study suggested
that there are at least two types of HR strategies. First, employees’ contributions to
pensions or health benefits are increased, employee salaries are frozen, departments or

133
offices are consolidated, servies are consolidated or reduced, work schedules are reduced,
and furloughs are increased. Second, HR reorders spending priorities, transfers
responsibilities to another level of government, implements lay-offs, uses volunteers
rather than paid employees, does not fill vacant positions, and offers retirement incentives.
The experimental findings suggested that the cutback levels affected increasing
employees’ contributions to pensions or health benefits, employee salary freezes,
consolidating departments or offices, consolidating or reducing services, reducing work
schedules, and increasing furloughs. However, the experimental results showed no
evidence that cutback levels influenced reordering spending priorities, transferring
responsibilities to another level of government, lay-offs, use of volunteers rather than
paid employees, not filling vacant positions, or retirement incentives. The experiment
found some empirical evidence that public managers use direct personnel costs and
organizational restructuring to reduce costs and keep the organization functioning. The
lack of significant findings suggested that the effects of cutback levels may be strategy-
specific.
Overall, the major contribution of this study is that an increased emphasis on
information management and state political leadership is essential, as local governments
responded strategically to cutbacks rather than reacting passively to their effects. The
survey results also indicated that cutback management can have negative effects on
budgets, capacity, and work related well-being. The experimental results showed that as
the severity of cutbacks changed, local governments operated strategically to maintain
existing functions without altering the organizations’ important services. It is necessary
for local governments to preserve the quality of public service delivery while minimizing

134
the side effects that cutback management can bring. This is especially true when one
considers that it is relatively more difficult for public organizations to manage their
human resources effectively because of the nature of being public.
Limitations
This study had a number of limitations that must be addressed before discussing
the implications of the study’s findings for theory and practice. First, variables were
measured by self-reported responses, so common source bias (CSB) could have affected
the results. CSB has potential effects when scholars employ the same data source,
typically a survey, to measure both independent and dependent variables simultaneously
(Favero & Bullock, 2014; Jakobsen & Jensen, 2015; Podsakoff, MacKenzie, Lee, &
Podsakoff, 2003; Spector, 2006). George and Pandey (2017) advised authors to
“incorporate multiple data sources in their analyses if a distinct data source was available
and relevant.” Thus, it would be worth using secondary data available, such as the U.S.
Census data, to reduce the possibility of CSB. Future studies should include such
secondary data to enhance the validity and reliability of their analyses.
Second, this study was based on a cross-sectional survey, but panel observations
may provide reliable data to examine causal relationships. Although conducting this type
of survey every year would be costly and time consuming, it would be worth performing
a survey to investigate the differences between 2016 and 2017. President Trump’s
election in 2016 may be one of the factors that influenced the possible disparity between
the results from 2016 and 2017 surveys. For example, in one of his first actions as
president, Trump announced a hiring freeze on federal jobs on January 23, 2017 to send a

135
signal to congressional Republicans that he is serious about administrative reform.
Furthermore, the fact that Trump signed the Executive Order to abolish the Affordable
Care Act is likely to affect cutbacks in block grants for state and local government health
agencies. In addition, the White House has proposed deep cuts to the Environmental
Protection Agency’s budget that would reduce the agency’s staff by one-fifth in the first
year, and eliminate dozens of programs, according to details of a plan reviewed by The
Washington Post (2017). Therefore, if this study can be expanded to examine the effect
of Trump’s election on HR strategies in local governments, more research projects can be
performed to understand the nature of cutback management more fully.
Third, having respondents make choices on scales that ranged from 1 to 3 or 1 to
5 may create greater bias. However, in an in-depth consultation with the health and
human services leaders prior to this survey, I found that scales that range from 0 to 100
may be confusing. For example, this study used a three point Likert scale to measure the
importance of the factors and how often the agencies had implemented various HR
strategies in the past five years. Furthermore, this study used five levels, from “strongly
disagree” to “strongly agree” to measure the extent to which they agreed or disagreed
with statements about the outcomes of cutback management. One might argue that if this
study gave the respondents a scale that ranged from 0 to 100, the results would have been
less biased. However, especially with respect to the experimental manipulation, the
organizations’ leaders suggested that it would be more effective to address cutback
administration on a three-point scale. This study used a five-point scale in the outcomes
following the Federal Employee View Point Survey, which the local government leaders
136
approved. This study provided a real world perspective to explore the way in which local
governments responded to cutbacks in the aftermath of the Great Recession.
Fourth, my array of HR strategies, which are grounded in the literature and
qualitative interviews, may still be missing a few strategies that have been important in
the public sector, such as job sharing. When employers must staff a position on a full-
time basis, job sharing is an option. Job sharing is a form of part-time employment in
which one position is filled with two or more part-time employees. Job sharing has added
benefits for management. In this study, a reduced work schedule replaces job sharing.
The study of job sharing needs further research.
Finally, this study was not able to include the national leadership in the model and
focused only on the state political leadership. Although this study was not able to model
it statistically, the federal policy of the national government is very important. This is
because the federal government’s policies and funding greatly influence health and
human services agencies. Federal government plays a key role in shaping the policy
environment. This study did not mean to diminish the importance of the federal
government.
Implications
Notwithstanding the limitations above to this largely exploratory study, the
analytic results suggested that 394 of 464 organizations (85%) experienced modest or
substantial budget cutbacks in the last five years. Respondents who placed a greater
emphasis on information management systems were more likely to implement HR
strategies in response to cutbacks. Furthermore, greater use of technology to reduce costs
137
appeared to be related positively to individual level work attitudes. Appelbaum et al.
(1999) argued that technology can be used to increase the extent of managers’ control.
Mid-level managers derived the most benefit from the application of technology,
including virtual meetings, Smartphone applications, and voice mail and government
websites. As Schmenner and Lackey (1994) stated, technology has decreased
significantly the time that mid-level managers spend “pushing paper work”. One
comment in the survey summarized the public managers’ perceptions well. “We have
implemented some of the cost savings methods mentioned in this survey as a proactive
way to reduce our costs, increase our efficiency, or help employees obtain a more
desirable work/life balance rather than as a result of budget cuts.” Some of the strategies,
such as technology, can be proactive ways to reduce costs in response to cutbacks.
One of the interesting findings from the experiment was that telework helped
local governments reduce costs. Telework has several other advantages in cost savings
for organizations, including office maintenance, transportation, energy, and the
environment, as well as the increased continuity of operations in emergency situations
and natural disasters (Caillier, 2011; D. Lee & Kim, 2016; Major et al., 2008; Maruyama
et al., 2009; Overmyer, 2011). Previous literature on telework has focused solely on the
federal government. However, 40% of respondents indicated that local governments
implemented telework in response to budget cutbacks in the last five years. Furthermore,
existing studies on telework have demonstrated that improved work-life balance is its
primary benefit, but none of the studies has explored telework from the perspective of
cost savings. In this respect, this study contributed to the prior personnel administration

138
literature, in that telework can be an innovative strategy for local governments to use to
reduce costs and improve work-life balance.
The findings of this study offered two important implications for managing
human resources more effectively in response to cutbacks. The first relates to the
importance of strategic HRM. Strategic HRM is a core component in today’s efforts to
improve public sector organizations by tying HR activities to missions, rather than
reacting to traditional HR needs (Goodman et al., 2013). A second important practical
implication is that public managers used different HR strategies according to the severity
of fiscal stress, such that HRM may follow a sequence of cutback strategies in response
to different levels of fiscal stress. As such, when fiscal stress is intense, public managers
implemented cutting strategies; however, when fiscal stress is weak, they tended to use
denial and delay strategies. This tendency on the part of public managers to rationalize
personnel decisions can be used to formulate a more effective HR strategy to maintain
persistent recruitment and retention, as well as preserve a balanced budget.
Implications for Future Research
According to publicness theory, unlike the private sector, a public organization is
subject to various restrictions because of its public nature. Therefore, we must consider
the difference between the public and private sectors with respect to cutback management
and organizational performance. For example, it would be enlightening to examine the
way in which the survivor syndrome damages public service motivation, and public value
moderates the adverse outcomes of cutback strategies, or whether survivor syndrome is
more serious in government.

139
The limitations and implications of this study lead to a set of future research
agendas that remain to be explored. With respect to performance, future research should
investigate the long-term performance of downsized organizations through longitudinal
studies. Government should not view cutback management as a one-time, quick fix
solution, but rather as part of the organization’s long-term strategy (Appelbaum et al.,
1999; Cameron, 1994; Cascio, 1993). Public organizations that plan to downsize must
avoid short-term actions, as they threaten long-term performance. Cameron, Freeman,
and Mishra (1991) suggested that downsizing is a proactive strategy that provides a
present solution to an end, and an increase in performance in the long term. One
comment reflected that cutback management is generally not part of the organization’s
long-term strategy, but takes the form of a short-term, reactive mix (Pandey, 2010). “We
are a county agency. We are funded through county tax dollars but the State of Iowa sets
limits on the county levy. Politics at the state level has a great influence on our situation
and the range of solutions available to us. Forced regionalization and privatization of
Medicaid over the last two years has fundamentally changed how we do business. We
are still trying to sort our way through the challenges while trying to ensure that direct
services that people should rely on are not cut.” This comment leads to the next question:
under budget constraints, what will bring maximum performance to government
organizations in the long term without damaging publicness?
Concerning process, it would be worthwhile to examine whether two factors can
moderate the threat inherent in the downsizing. A. K. Mishra and Spreitzer (1998)
described trust in top management and perceptions of organizational justice as two
factors that shape the primary appraisal process by reducing the harmful effect of

140
downsizing. In the psychology and business administration literature, trust in top
management and perceived justice lead to more constructive survivor responses by
reducing the ambiguity in the cutback management process (A. K. Mishra & Spreitzer,
1998). As public organizations pursue a variety of ambiguous goals, it is valuable to
study public officials to see the way in which these two factors can alleviate the side
effects of survivor syndrome.
Another future research topic is the way in which cutback management affects
local government performance in mainland China. Although a number of empirical
studies have examined the effects of cutback management in other countries, little
research has focused on the Chinese context. A study on mainland China could help U.S.
practitioners develop strategic policies to prepare effectively for the challenges of
globalization and an information-oriented society.
Understanding the advantages of providing personal and financial counseling for
laid-off employees can not only help them combat their feelings of despair, but also help
survivors maintain their sense of agency (K. E. Mishra et al., 1998). In the qualitative
phase, this study found that the City of Newark provides employee assistance programs
to remaining employees. However, only the federal government provides outplacement
services. Further studies that explore such programs would be of value to both victims
and survivors.

141
References
Amundson, N. E., Borgen, W. A., Jordan, S., & Erlebach, A. C. (2004). Survivors of
downsizing: Helpful and hindering experiences. The Career Development
Quarterly, 52(3), 256-271.
Andrews, R., & Boyne, G. A. (2010). Capacity, leadership, and organizational
performance: Testing the black box model of public management. Public
Administration Review, 70(3), 443-454.
Appelbaum, S. H., Delage, C., Labib, N., & Gault, G. (1997). The survivor syndrome:
aftermath of downsizing. Career Development International, 2(6), 278-286.
Appelbaum, S. H., Everard, A., & Hung, L. T. (1999). Strategic downsizing: Critical
success factors. Management Decision, 37(7), 535-552.
Armstrong-Stassen, M. (2004). The influence of prior commitment on the reactions of
layoff survivors to organizational downsizing. Journal of occupational health
psychology, 9(1), 46.
Armstrong-Stassen, M. (2005). Coping With Downsizing: A Comparison of Executive-
Level and Middle Managers. International Journal of Stress Management, 12(2),
117.
Armstrong‐Stassen, M. (2002). Designated redundant but escaping lay‐off: A special
group of lay‐off survivors. Journal of Occupational and Organizational
Psychology, 75(1), 1-13.
Armstrong‐Stassen, M. (2006). Determinants of how managers cope with organisational
downsizing. Applied Psychology, 55(1), 1-26.

142
Astrachan, J. H. (1995). Organizational departures: The impact of separation anxiety as
studied in a mergers and acquisitions simulation. The Journal of applied
behavioral science, 31(1), 31-50.
Auger, D. A. (1999). Privatization, contracting, and the states: Lessons from state
government experience. Public Productivity & Management Review, 22(4), 435-
454.
Barak, M. E. M., Cherin, D. A., & Berkman, S. (1998). Organizational and personal
dimensions in diversity climate ethnic and gender differences in employee
perceptions. The Journal of applied behavioral science, 34(1), 82-104.
Bartle, J. R. (1996). Coping with cutbacks: City response to aid cuts in New York State.
State & Local Government Review, 28(1), 38-48.
Battaglio, R. P., & Condrey, S. E. (2009). Reforming public management: Analyzing the
impact of public service reform on organizational and managerial trust. Journal of
public administration research and theory, 19(4), 689-707.
Bent, A. E., & Reeves, T. Z. (1978). Collective Bargaining in the Public Sector: Labor-
Management Relations and Public Policy. San Francisco, CA: Benjamin-
Cummings Publishing Company.
Box, R. C. (1997). Citizen governance: Leading American communities into the 21st
century: Sage Publications.
Bozeman, B. (2010). Hard lessons from hard times: Reconsidering and reorienting the
“managing decline” literature. Public Administration Review, 70(4), 557-563.

143
Brennan, A., & Skarlicki, D. P. (2004). Personality and Perceived Justice as Predictors of
Survivors’ Reactions Following Downsizing1. Journal of Applied Social
Psychology, 34(6), 1306-1328.
Brewer, G. A., & Selden, S. C. (2000). Why elephants gallop: Assessing and predicting
organizational performance in federal agencies. Journal of public administration
research and theory, 10(4), 685-712.
Brockner, J. (1990). Scope of justice in the workplace: how survivors react to co‐worker
layoffs. Journal of Social Issues, 46(1), 95-106.
Brockner, J., Davy, J., & Carter, C. (1985). Layoffs, self-esteem, and survivor guilt:
Motivational, affective, and attitudinal consequences. Organizational Behavior
and Human Decision Processes, 36(2), 229-244.
Brockner, J., DeWitt, R. L., Grover, S., & Reed, T. (1990). When it is especially
important to explain why: Factors affecting the relationship between managers'
explanations of a layoff and survivors' reactions to the layoff. Journal of
Experimental Social Psychology, 26(5), 389-407.
Brockner, J., & Greenberg, J. (1990). The impact of layoffs on survivors: An
organizational justice perspective. Applied social psychology and organizational
settings, 45, 75.
Brockner, J., Grover, S., Reed, T., DeWitt, R., & O'Malley, M. (1987). Survivors'
reactions to layoffs: We get by with a little help for our friends. Administrative
science quarterly, 32(4), 526-541.
144
Brockner, J., Grover, S., Reed, T. F., & Dewitt, R. L. (1992). Layoffs, job insecurity, and
survivors' work effort: Evidence of an inverted-U relationship. Academy of
Management Journal, 35(2), 413-425.
Brockner, J., Konovsky, M., Cooper-Schneider, R., Folger, R., Martin, C., & Bies, R. J.
(1994). Interactive effects of procedural justice and outcome negativity on victims
and survivors of job loss. Academy of Management Journal, 37(2), 397-409.
Brockner, J., Wiesenfeld, B. M., & Martin, C. L. (1995). Decision Frame, Procedural
Justice, and Survivors′ Reactions to Job Layoffs. Organizational Behavior and
Human Decision Processes, 63(1), 59-68.
Caillier, J. G. (2011). The impact of teleworking on work motivation in a US federal
government agency. The American Review of Public Administration, 42(4), 461-
480.
Cameron, K. S. (1994). Strategies for successful organizational downsizing. Human
Resource Management, 33(2), 189-211.
Cameron, K. S., Freeman, S. J., & Mishra, A. K. (1991). Best practices in white-collar
downsizing: Managing contradictions. The Executive, 5(3), 57-73.
Campbell-Jamison, F., Worrall, L., & Cooper, C. (2001). Downsizing in Britain and its
effects on survivors and their organizations. Anxiety, Stress and Coping, 14(1),
35-58.
Campbell, R., & Pepper, L. (2007). Downsizing and social cohesion: the case of
downsizing survivors. New Solutions: A journal of environmental and
occupational health policy, 16(4), 373-393.
145
Cascio, W. F. (1993). Downsizing: What do we know? What have we learned? The
Academy of Management Executive, 7(1), 95-104.
CedarCrestone. (2011). CedarCrestone 2011-2012 HR systems survey: HR technologies,
deployment approaches, value, and metrics (14th
ed.). Alpharetta, GA: Sierra-
Cedar. Retrieved from
http://www.cedarcrestome.com/serv_research_whitepapers.php
Cepiku, D., Mussari, R., & Giordano, F. (2015). Local governments managing austerity:
Approaches, determinants and impact. Public Administration, 94(1), 223-243.
Chen, G. (2013). Cutback strategies in state pension systems under state fiscal stress:
University of Nebraska at Omaha.
Chen, G. (2016). Understanding Decisions in State Pension Systems: A System
Framework. The American Review of Public Administration, 0275074016675242.
Clark, V. L. P., & Creswell, J. W. (2011). Designing and conducting mixed methods
research: Thousand Oaks, CA: Sage.
Collins, B. K., & Gerber, B. J. (2006). Redistributive policy and devolution: Is state
administration a road block (grant) to equitable access to federal funds? Journal
of public administration research and theory, 16(4), 613-632.
Collins, B. K., & Gerber, B. J. (2008). Taken for granted? Managing for social equity in
grant programs. Public Administration Review, 68(6), 1128-1141.
Condrey, S. E. (1995). Reforming human resource management systems: Exploring the
importance of organizational trust. The American Review of Public Administration,
25(4), 341-354.
146
Corbin, J., & Strauss, A. (2014). Basics of qualitative research: Techniques and
procedures for developing grounded theory: Sage publications.
Davy, J. A., Kinicki, A. J., Scheck, C. L., & Sutton, C. L. (1988). Developing and Testing
an Expanded Model of Survivor Responses to Layoffs: A Longitudinal Field Study.
Paper presented at the Academy of Management Proceedings.
de Lancer Julnes, P., & Holzer, M. (2001). Promoting the utilization of performance
measures in public organizations: An empirical study of factors affecting adoption
and implementation. Public Administration Review, 61(6), 693-708.
De Vries, M. F. K., & Balazs, K. (1997). The downside of downsizing. Human Relations,
50(1), 11-50.
De Vries, M. K., & Balazs, K. (1996). The human side of downsizing. European
Management Journal, 14(2), 111-120.
Denhardt, R. B., & Denhardt, J. V. (2000). The new public service: Serving rather than
steering. Public Administration Review, 60(6), 549-559.
Dillman, D. A., Smyth, J. D., & Christian, L. M. (2014). Internet, phone, mail, and
mixed-mode surveys: the tailored design method: John Wiley & Sons.
Dougherty, M. J., & Klase, K. A. (2009). Fiscal retrenchment in state budgeting:
Revisiting cutback management in a new era. Intl Journal of Public
Administration, 32(7), 593-619.
Dunsire, A., Hood, C., & Huby, M. (1989). Cutback management in public
bureaucracies: Popular theories and observed outcomes in Whitehall: Cambridge
University Press.

147
Eagly, A. H., Karau, S. J., & Johnson, B. T. (1992). Gender and leadership style among
school principals: A meta-analysis. Educational Administration Quarterly, 28(1),
76-102.
Edgar, F., & Geare, A. (2004). Employee demographics in human resource management
research. Research and Practice in Human Resource Management, 12(1), 61-91.
Favero, N., & Bullock, J. B. (2014). How (not) to solve the problem: An evaluation of
scholarly responses to common source bias. Journal of public administration
research and theory, 25(1), 285-308.
Frederickson, D. G. (2006). Measuring the performance of the hollow state: Georgetown
University Press.
Gerber, A. S., & Green, D. P. (2012). Field experiments: Design, analysis, and
interpretation: WW Norton.
Gersick, C. J. (1994). Social Psychology in Organizations: Advances in Theory and
Research. Academy of Management. The Academy of Management Review, 19(1),
144.
Gilson, C., Hurd, F., & Wagar, T. (2004). Creating a concession climate: The case of the
serial downsizers. The International Journal of Human Resource Management,
15(6), 1056-1068.
Girth, A. M. (2014). A closer look at contract accountability: Exploring the determinants
of sanctions for unsatisfactory contract performance. Journal of public
administration research and theory, 24(2), 317-348.
Glaser, B. G., & Strauss, A. L. (2009). The discovery of grounded theory: Strategies for
qualitative research. Hawthorne, NY: Transaction Publishers.

148
Goodman, D., French, P. E., & Battaglio, R. P. (2013). Determinants of local government
workforce planning. The American Review of Public Administration, 45(2), 135-
152.
Greeberg, J. (1996). The quest for Justice on the Job. Thousand Daks, CA: Sage.
Greene, J. C. (2005). The generative potential of mixed methods inquiry 1. International
Journal of Research & Method in Education, 28(2), 207-211.
Greene, J. C. (2008). Is mixed methods social inquiry a distinctive methodology? Journal
of mixed methods research, 2(1), 7-22.
Grossman, S. A. (2012). Public-Private Partnerships: Introduction: The Emerging Role of
Partnership Governance (II). Public Performance & Management Review, 36(2),
183-186.
Hall, J. L. (2008a). Assessing local capacity for federal grant-getting. The American
Review of Public Administration, 38(4), 463-479.
Hall, J. L. (2008b). Moderating Local Capacity: Exploring EO 12372's Intergovernmental
Review Effects on Federal Grant Awards. Policy Studies Journal, 36(4), 593-613.
Hassan, S., & Hatmaker, D. M. (2014). Leadership and Performance of Public
Employees: Effects of the Quality and Characteristics of Manager-Employee
Relationships. Journal of public administration research and theory, 25(4), 1127-
1155.
Holzer, M. (1988). Productivity in/garbage out: The case of the New York City
Department of Sanitation. Public Productivity Review, 6(3), 37-50.
Howlett, M. (2009). Policy analytical capacity and evidence‐based policy‐making:
Lessons from Canada. Canadian public administration, 52(2), 153-175.
149
Jacobson, W. S. (2009). Planning for today and tomorrow: Workforce planning. In S. W.
Hays, R. C. Kearney & J. D. Coggburn (Eds.), Public Human Resource
Management: Problems and Prospects (5th
ed., pp. 179-202). New York, NY:
Longman.
Jakobsen, M., & Jensen, R. (2015). Common method bias in public management studies.
International Public Management Journal, 18(1), 3-30.
Jilke, S. (2015). Job Satisfaction and Regime Change: Evidence from a Natural
Experiment. International Public Management Journal, 19(3), 1-27.
Johnson, R. B., Onwuegbuzie, A. J., & Turner, L. A. (2007). Toward a definition of
mixed methods research. Journal of mixed methods research, 1(2), 112-133.
Kavanagh, M. J., & Thite, M. (2009). Human resource information systems: Basics,
applications, and future directions: Sage.
Kearney, R. C., & Mareschal, P. M. (2014). Labor relations in the public sector. Boca
Raton, FL: CRC Press.
Kernan, M. C., & Hanges, P. J. (2002). Survivor reactions to reorganization: antecedents
and consequences of procedural, interpersonal, and informational justice. Journal
of applied psychology, 87(5), 916.
Kiefer, T., Hartley, J., Conway, N., & Briner, R. B. (2014). Feeling the squeeze: Public
employees’ experiences of cutback-and innovation-related organizational changes
following a national announcement of budget reductions. Journal of Public
Administration Research and Theory, 25(4), 1279-1305.
Kim, M. (2014). Balancing Civic and Market Functions: A Study of Nonprofit Arts
Organizations. Citeseer.

150
Klinger Donald, E., & Nalbandian, J. (2003). Public Personnel Management: Contexts
and Strategies. New York, NY: Pearson Longman Publishing.
Klingner, D., Nalbandian, J., & Llorens, J. J. (2015). Public personnel management:
Routledge.
Konrad, A. M., & Hartmann, L. (2001). Gender differences in attitudes toward
affirmative action programs in Australia: Effects of beliefs, interests, and attitudes
toward women. Sex Roles, 45(5-6), 415-432.
Lee, D., & Kim, S. Y. (2016). A Quasi-Experimental Examination of Telework
Eligibility and Participation in the US Federal Government. Review of Public
Personnel Administration, 0734371X16680269.
Lee, G., & Teo, A. (2005). Organizational restructuring: Impact on trust and work
satisfaction. Asia Pacific Journal of Management, 22(1), 23-39.
Lee, S., & Sanders, R. M. (2013). Fridays Are Furlough Days The Impact of Furlough
Policy and Strategies for Human Resource Management During a Severe
Economic Recession. Review of Public Personnel Administration, 33(3), 299-311.
Levine, C. H. (1978). Organizational decline and cutback management. Public
Administration Review, 38(4), 316-325.
Levine, C. H. (1979). More on cutback management: Hard questions for hard times.
Public Administration Review, 39(2), 179-183.
Levine, C. H. (1984). Retrenchment, Human Resource Erosion, and the Role of the
Personnel Manager. Public Personnel Management, 13(3), 249-263.

151
Levine, C. H., Rubin, I. S., & Wolohojian, G. G. (1981). The politics of retrenchment:
How local governments manage fiscal stress (Vol. 130): SAGE Publications,
Incorporated.
Lin, W. & Van Ryzin, G. G. (2011). Web and mail surveys: An experimental comparison
of methods for nonprofit research. Nonprofit and Voluntary Sector Quarterly,
41(6), 1014-1028.
Lincoln, Y. S., Lynham, S. A., & Guba, E. G. (2011). Paradigmatic controversies,
contradictions, and emerging confluences, revisited. In N. K. Denzin & Y. S.
Lincoln (Ed.), The Sage handbook of qualitative research (4th
ed., pp. 97-128).
Thousand Oaks, CA: Sage.
Liu, C., & Mikesell, J. L. (2014). The impact of public officials’ corruption on the size
and allocation of US state spending. Public Administration Review, 74(3), 346-
359.
Lodge, M., & Hood, C. (2012). Into an age of multiple austerities? Public management
and public service bargains across OECD countries. Governance, 25(1), 79-101.
Luthans, B. C., & Sommer, S. M. (1999). The impact of downsizing on workplace
attitudes: Differing reactions of managers and staff in a health care organization.
Group & Organization Management, 24(1), 46-70.
Mahoney, J., & Goertz, G. (2006). A tale of two cultures: Contrasting quantitative and
qualitative research. Political Analysis, 14(3), 227-249.
Major, D. A., Verive, J. M., & Joice, W. (2008). Telework as a dependent care solution:
Examining current practice to improve telework management strategies. The
Psychologist-Manager Journal, 11(1), 65-91.

152
Maruyama, T., Hopkinson, P. G., & James, P. W. (2009). A multivariate analysis of
work–life balance outcomes from a large‐scale telework programme. New
Technology, Work and Employment, 24(1), 76-88.
Maxwell, S. E., & Delaney, H. D. (2004). Designing experiments and analyzing data: A
model comparison perspective (Vol. 1). New York, NY: Psychology Press.
McCann, L. (2013). Reforming public services after the crash: the roles of framing and
hoping. Public administration, 91(1), 5-16.
Meier, K. J., & O’Toole Jr, L. J. (2002). Public management and organizational
performance: The impact of managerial quality. Journal of Policy Analysis and
Management, 21(4), 629-643.
Miles, M. B., Huberman, A., & Saldaña, J. (2014). Qualitative data analysis: A methods
sourcebook. Thousand Oaks, Califorinia: SAGE Publications, Inc.
Milward, H. B., & Provan, K. G. (2000). Governing the hollow state. Journal of public
administration research and theory, 10(2), 359-380.
Mishra, A. K., & Spreitzer, G. M. (1998). Explaining how survivors respond to
downsizing: The roles of trust, empowerment, justice, and work redesign.
Academy of Management Review, 23(3), 567-588.
Mishra, K. E., Spreitzer, G. M., & Mishra, A. K. (1998). Preserving employee morale
during downsizing. Sloan management review, 39(2), 83.
Moldogaziev, T. T., & Luby, M. J. (2012). State and Local Government Bond
Refinancing and the Factors Associated with the Refunding Decision. Public
Finance Review, 40(5), 614-642.

153
Morgan, D., & Zeffane, R. (2003). Employee involvement, organizational change and
trust in management. International journal of human resource management, 14(1),
55-75.
Morton, R. B., & Williams, K. C. (2010). Experimental political science and the study of
causality: From nature to the lab. New York, NY: Cambridge University Press.
Neves, P., & Caetano, A. (2006). Social exchange processes in organizational change:
The roles of trust and control. Journal of Change Management, 6(4), 351-364.
Nigro, L., Nigro, F., & Kellough, J. (2013). The new public personnel administration.
Boston, MA: Cengage Learning.
Niskanen, W. A. (1971). Bureaucracy and representative government. New Brunswick,
NJ: Transaction Publishers.
Nyhan, R. C. (2000). Changing the paradigm trust and its role in public sector
organizations. The American Review of Public Administration, 30(1), 87-109.
Onwuegbuzie, A. J., Johnson, R. B., & Collins, K. M. (2009). Call for mixed analysis: A
philosophical framework for combining qualitative and quantitative approaches.
International journal of multiple research approaches, 3(2), 114-139.
Overmyer, S. P. (2011). Implementing telework: Lessons learned from four federal
agencies: IBM Center for the Business of Government.
Pandey, S. K. (2010). Cutback management and the paradox of publicness. Public
Administration Review, 70(4), 564-571.
Perlman, B. J., & Benton, J. E. (2012). Going It Alone New Survey Data on Economic
Recovery Strategies in Local Government. State and Local Government Review,
44(1 suppl), 5S-16S.
154
Perry, J. L. (1985). The "Old Testament": A litany of beliefs about public sector labor
relations - A symposium. Review of Public Personnel Administration, 5(2), 1-4.
Pinsonneault, A., & Kraemer, K. L. (1990). The effects of electronic meetings on group
processes and outcomes: an assessment of the empirical research. European
Journal of Operational Research, 46(2), 143-161.
Pinsonneault, A., & Kraemer, K. L. (2002). Exploring the role of information technology
in organizational downsizing: a tale of two American cities. Organization science,
13(2), 191-208.
Pitts, D. W., & Wise, L. R. (2010). Workforce diversity in the new millennium: Prospects
for research. Review of Public Personnel Administration, 30(1), 44-69.
Podsakoff, P. M., MacKenzie, S. B., Lee, J.-Y., & Podsakoff, N. P. (2003). Common
method biases in behavioral research: a critical review of the literature and
recommended remedies. Journal of applied psychology, 88(5), 879.
Pollitt, C. (2010). Cuts and reforms—Public services as we move into a new era. Society
and Economy, 32(1), 17-31.
Posner, P. L., & Sommerfeld, M. (2013). The politics of fiscal austerity. OECD Journal
on Budgeting, 13(1), 141-174.
Pynes, J. (2003). Strategic human resources management (pp. 93-105): Upper Saddle
River, NJ: Prentice Hall.
Pynes, J. E. (2004). The implementation of workforce and succession planning in the
public sector. Public Personnel Management, 33(4), 389-404.
Pynes, J. E. (2008). Human resources management for public and nonprofit
organizations: A strategic approach (Vol. 30): John Wiley & Sons.
155
Rainey, H. G. (2009). Understanding and managing public organizations: John Wiley &
Sons.
Rainey, H. G., & Steinbauer, P. (1999). Galloping elephants: Developing elements of a
theory of effective government organizations. Journal of public administration
research and theory, 9(1), 1-32.
Raudla, R., Douglas, J. W., Randma‐Liiv, T., & Savi, R. (2015). The Impact of Fiscal
Crisis on Decision‐Making Processes in European Governments: Dynamics of a
Centralization Cascade. Public Administration Review, 75(6), 842-852.
Raudla, R., Savi, R., & Randma-Liiv, T. (2013). Literature review on cutback
management. COCOPS - (COordinating for COhesion in the Public Sector of the
future). Retrieved from http://hdl.handle.net/1765/40927.
Reilly, T., & Reed, M. B. (2011). Budget shortfalls, employee compensation, and
collective bargaining in local governments. State and Local Government Review,
43(3), 215-223.
Remler, D. K., & Van Ryzin, G. G. (2010). Research methods in practice: Strategies for
description and causation: Sage Publications.
Riccucci, N. (1990). Women, minorities, and unions in the public sector (Vol. 28).
Westport, CT: Praeger Pub Text.
Riccucci, N. (2002). Managing diversity in public sector workforces. Cambridge, MA:
Westview Press.
Riccucci, N. M. (2010). Public administration: Traditions of inquiry and philosophies of
knowledge. Washington, DC: Georgetown University Press.

156
Roberge, I., Jesuit, D. K., Cepiku, D., & Bonomi Savignon, A. (2012). Governing
cutback management: is there a global strategy for public administrations?
International Journal of Public Sector Management, 25(6/7), 428-436.
Rosenbloom, D. H., & Shafritz, J. M. (1985). Essentials of labor relations. Reston, VA:
Reston Publishing Company.
Rubin, M. M., & Willoughby, K. G. (2009). State budget balancing strategies: Riding
into the future on lessons learned from the past. Paper presented at the 5TAD
Conference, Washington, DC.
Schaefer, D. R., & Dillman, D. A. (1998). Development of a standard e-mail
methodology: Results of an experiment. Public Opinion Quarterly, 62(3), 378-
397.
Schaubroeck, J., May, D. R., & Brown, F. W. (1994). Procedural justice explanations and
employee reactions to economic hardship: A field experiment. Journal of applied
psychology, 79(3), 455.
Schick, A. (2011). Repairing the budget contract between citizens and the state. OECD
Journal on Budgeting, 11(3), 1.
Schmenner, R., & Lackey, C. (1994). “Slash and burn” doesn't kill weeds: Other ways to
downsize the manufacturing organization. Business Horizons, 37(4), 80-87.
Schreiber, C. T., Price, K. F., & Morrison, A. (1993). Workforce diversity and the glass
ceiling: Practices, barri. People and Strategy, 16(2), 51.
Selden, S. C. (1997). The promise of representative bureaucracy: Diversity and
responsiveness in a government agency. Armonk, NY: ME Sharpe.

157
Selden, S. C. (2008). Human capital: Tools and strategies for the public sector.
Washington, DC: CQ Press.
Selden, S. C., & Jacobson, W. (2007). Government’s largest investment: Human resource
management in states, counties, and cities. In P. W. Ingraham (Ed.) In pursuit of
performance: Management systems in state and local government (82-116).
Baltimore, MD: Johns Hopkins University Press.
Shadish, W. R., Cook, T. D., & Campbell, D. T. (2002). Experimental and quasi-
experimental designs for generalized causal inference: Wadsworth Cengage
learning.
Shah, P. P. (2000). Network destruction: The structural implications of downsizing.
Academy of Management Journal, 43(1), 101-112.
Sheppard, B. H., Lewicki, R. J., & Minton, J. W. (1992). Organizational justice: The
search for fairness in the workplace. New York, NY: Lexington
Books/Macmillan.
Soni, V. (2004). From Crisis to Opportunity: Human Resource Challenges for the Public
Sector in the Twenty‐First Century. Review of Policy Research, 21(2), 157-178.
Spector, P. E. (2006). Method variance in organizational research truth or urban legend?
Organizational research methods, 9(2), 221-232.
Tabachnick, B. G., Fidell, L. S., & Osterlind, S. J. (2001). Using multivariate statistics
(6th
ed.). Cranbury, NY: Pearson.
Teddlie, C., & Tashakkori, A. (2009). Foundations of mixed methods research:
Integrating quantitative and qualitative approaches in the social and behavioral
sciences: Sage.

158
Terman, J. N., & Feiock, R. C. (2014). Improving outcomes in fiscal federalism: Local
political leadership and administrative capacity. Journal of Public Administration
Research and Theory, 25(4), 1059-1080.
Terry, L. D. (2003). Leadership of public bureaucracies: The administrator as
conservator. Armonk, NY: ME Sharpe.
Thite, M., Kavanagh, M. J., & Johnson, R. D. (2012). Evolution of human resource
management and human resource information systems. In M. J. Kavanagh, M.
Thite, & R. D. Johnson (Eds.), Human resource information systems: Basics,
applications, and future directions (2 ed., pp. 2-34): Sage.
Trusts, P. C. (2013). America’s Big Cities in Volatile Times: Meeting Fiscal Challenges
and Preparing for the Future. Washington, DC: The Pew Charitable Trusts.
Tzafrir, S. S. (2005). The relationship between trust, HRM practices and firm
performance. The International Journal of Human Resource Management, 16(9),
1600-1622.
Van de Walle, S., & Van Ryzin, G. G. (2011). THE ORDER OF QUESTIONS IN A
SURVEY ON CITIZEN SATISFACTION WITH PUBLIC SERVICES:
LESSONS FROM A SPLIT‐BALLOT EXPERIMENT. Public administration,
89(4), 1436-1450.
van der Voet, J., & Van de Walle, S. (2015). How Cutbacks and Job Satisfaction Are
Related The Role of Top-Level Public Managers’ Autonomy. Review of Public
Personnel Administration, 0734371X15609409.

159
Van Dierendonck, D., & Jacobs, G. (2012). Survivors and victims, a meta‐analytical
review of fairness and organizational commitment after downsizing. British
Journal of Management, 23(1), 96-109.
Van Slyke, D. M. (2003). The mythology of privatization in contracting for social
services. Public Administration Review, 63(3), 296-315.
Van Slyke, D. M. (2007). Agents or stewards: Using theory to understand the
government-nonprofit social service contracting relationship. Journal of public
administration research and theory, 17(2), 157-187.
Wart, M. V. (2003). Public‐Sector leadership theory: An assessment. Public
Administration Review, 63(2), 214-228.
Weibel, A., Rost, K., & Osterloh, M. (2010). Pay for performance in the public sector—
Benefits and (hidden) costs. Journal of public administration research and theory,
20(2), 387-412.
Wellington, H. H., & Winter, R. K. (1969). The limits of collective bargaining in public
employment. Yale Law Journal, 78(7), 1107-1127.
West, J. P., & Berman, E. (1993). Human resource strategies in local government: A
survey of progress and future directions. The American Review of Public
Administration, 23(3), 279-297.
Wolman, H., & Davis, B. (1980). Local government strategies to cope with fiscal
pressure. Washington, DC: Urban Institute.
Yin, R. K. (2013). Case study research: Design and methods: Sage publications.
160
Appendix A. Interview Protocol
<Intro>
Hello. Thank you very much for taking time to speak with me.
<Main>
*Probing questions will not be asked if interviewee readily addresses certain issues
when asked main questions. 1. What is the title of your current position?
2. How many years have you been in your current position?
How are you involved in personnel issues or human resources management?
3. Have you experienced any cutbacks recently?
4. Tell me about the human resource strategies your local government used in response to
government cutbacks.
Please describe these strategies. How big were they? What kind of cutbacks?
In what ways were these strategies successful? Why not so successful?
Training and development? HR information technology? Diversity management?
Union issues?
be: In what ways politics influence personnel strategies local government can use
and can’t use?
3. How did these personnel strategies influence administrative capacity, trust in
management and trust in the organization?
4. On the following page, you will read a list of strategies that some local governments
have instituted to responding to economic and social conditions after the Great Recession
in their communities. Which of the following strategies, if any, would your county
institute in the hypothetical 2%, 5%, or 10% cutbacks? [Please mark all that apply]
2% cutbacks 5% cutbacks 10% cutbacks
Cost Reductions
1 Employee pension/retirement restructuring
2 Employee benefits restructuring
3 Employee salary freeze
4 Service reduction (level of overall services or elimination of specific services)

161
5 Reordering of spending priorities
6 Consolidating departments or offices
7 Consolidating services
8 Transferring responsibilities to another level of government
9 None of these
Personnel Work Time
1 Reduced work hours
2 Four-day work weeks
3 Furloughs
4 Lay-offs
5 Use of volunteers instead of paid employees
6 Not filling vacant positions
7 Retirement incentives
8 None of these
Greater Use of Technology to Reduce Costs
1 Virtual meetings
2
Increased use of electronic applications/paperwork (e.g. licenses, requests for service,
etc.)
3 Increased use of electronic payments (e.g. taxes, fees, etc.)
4 Increased use of technology by employees
5 None of these
Revenue Enhancement
1 Tax increases
2 Tax structure reform
3 Use of rainy day funds
4 Increase in fees for services
5 Debt restructuring
6 None of these
Partnerships
1 Partnerships with the private sector
2 Partnerships with non-profits
3 Partnerships with academic institutions
4 Privatizing services
5 Contracting with other local governments
6 None of these
5. Are there any other strategies your county would institute to respond to budget
cutbacks in your community? Please describe these strategies.
162
<Closing> I‘m planning a survey that examines how local governments manage the personnel side
of cutbacks. Are there any issues that you would recommend I include in my survey?
Paper survey or web based survey?
Thank you very much for speaking with me today. I would be happy to send you a copy
of the final report generated by this project.

163
Appendix B. Survey Questionnaire
National Survey of Health and Human Services Leaders
**The questionnaire has been programmed into Qualtrics online survey software.**
Thank you for participating in this survey, which will take about 15 minutes or less to
complete. Your answers will remain anonymous, and results will be published only in
aggregate or summary form. If you have any questions about this survey, please email
Q1. How much of a need is there in your area for health and human services, in
your view?
A lot
A fair amount
Some
Only a little
Q2. Which of the following best describes your current position?
Commissioner
Director
Deputy Director
County Administrator
County Manager
Program Manager
Other (Specify: ____________________
Q3. Which department do you belong to?
Health
Human Services
Health and Human Services
Social Services
Other (Specify: ____________________

164
Q4. How many years have you worked in the public sector?
Less than 5 years
5-10 years
11-15 years
16-20 years
21-25 years
26 years or more
Q5. Please indicate which of these programs your agency administers. [Check all
that apply.]
Medicaid
Temporary Assistance for Needy Families (TANF)
Child Support Enforcement
Foster Care
Homelessness
Programs for persons with disabilities
Supplemental Nutrition Assistance Program (SNAP)
Women, Infants, and Children (WIC)
Head Start
Child Care
Adoption services
Home visiting programs
Low-Income Home Energy Assistance Program (LIHEAP)
Mental health and substance abuse prevention
Supporting military families
Emergency Preparedness
Community Health Assessment and Planning
Tobacco, Alcohol, or Other Drugs
Communicable / Infectious Disease
Maternal and Child Health
Environmental Health
Chronic Disease Programs
Food Safety
Land Use
Other (Specify: ____________________

165
Q6. How would you describe the budget cutbacks, if any, your agency has had in the
last five years?
No budget cutbacks
Modest budget cutbacks
Substantial budget cutbacks
If No budget cutbacks Is Selected, Then Skip To How important are these activities in...
Q7. Please indicate the importance of the following activities in managing human
resources in your agency.
Not important Somewhat
important
Very important
Professional
development
Cross-training
Mentoring
Q8. Please indicate the importance of the following information management issues
in your agency.
Not important Somewhat
important
Very important
Computer-assisted
testing
Resume databases
HR management
software

166
Q9. Please indicate the importance of the following influences in shaping your
human resource strategies.
Not important Somewhat
important
Very important
Political leadership
of county
Political leadership
of state
Diversity as a goal
Role of unions
Q10. In the last five years, how often has your agency taken the following cost
reduction strategies in response to budget cutbacks?
Never A few times More than a few
times
Increase employee’s
contribution to
pensions or health
benefits
Employee salary
freeze
Reordering of
spending priorities
Consolidating
departments or
offices
Consolidating or
reducing services
Transferring
responsibilities to
another level of
government

167
Q11. In the last five years, how often has your agency taken the following work time
strategies in response to budget cutbacks?
Never A few times More than a few
times
Reduced work
schedules
Lay-offs
Use of volunteers
instead of paid
employees
Not filling vacant
positions
Retirement
incentives
Q12. In the last five years, how often has your agency taken the following technology
strategies in response to budget cutbacks?
Never A few times More than a few
times
Virtual meetings
Increased use of
electronic documents
Increased use of
technology by
employees
Telework (e.g.
telecommuting)

168
Q13. In the last five years, how often has your agency taken the following revenue
enhancement strategies in response to budget cutbacks?
Never A few times More than a few
times
Tax increases
Use of rainy day
funds
Increase in fees for
services
Debt refinancing
Q14. In the last five years, how often has your agency outsourced activities to the
following in response to budget cutbacks?
Never A few times More than a few
times
Private companies
Nonprofit agencies
Other government
agencies
Q15. How would you describe the current status of your budget?
Large deficit
Small deficit
Balanced
Small surplus
Large surplus

169
Q16. How would you characterize the current administrative capacity of your
agency?
Very understaffed
Somewhat understaffed
Staffed appropriately
Somewhat overstaffed
Very overstaffed
Q17. Please indicate the extent to which you agree or disagree with the following
statements about employees in your organization
Strongly
disagree
Somewhat
disagree
Neither
agree nor
disagree
Somewhat
agree
Strongly
agree
People here
trust each
other.
Work well
together.
Morale in my
organization
is low.
Most of the
people here
are satisfied
with their
jobs.
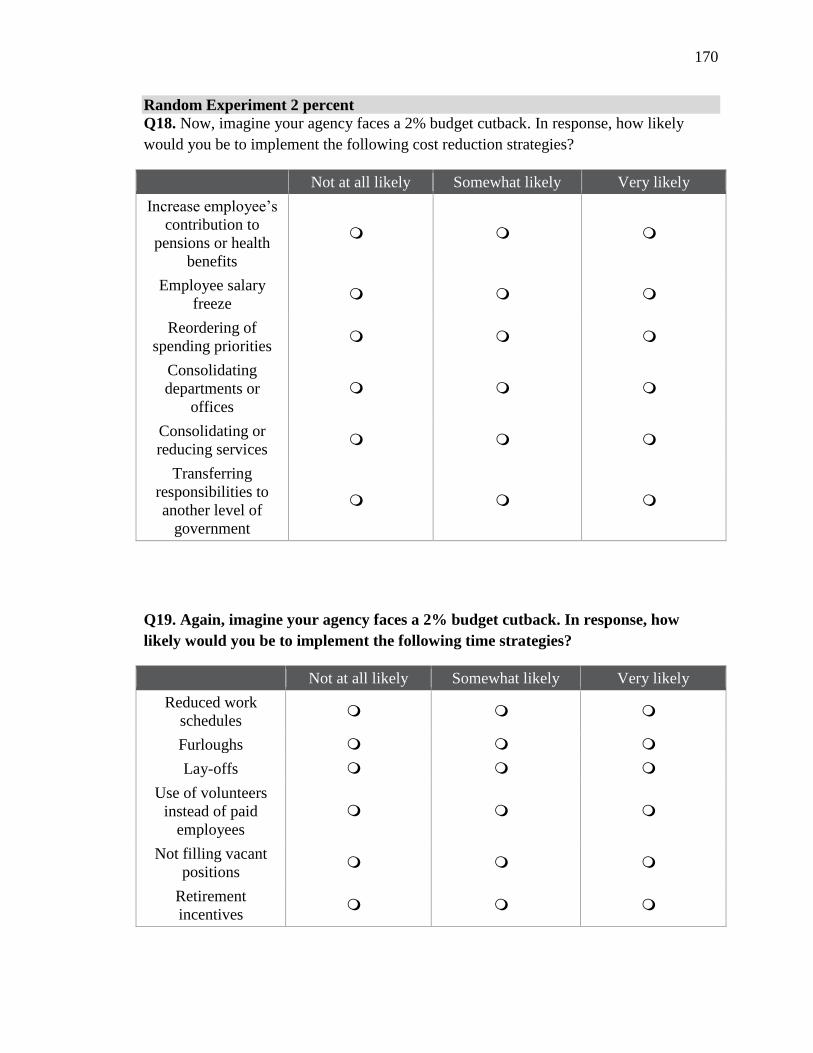
170
Random Experiment 2 percent
Q18. Now, imagine your agency faces a 2% budget cutback. In response, how likely
would you be to implement the following cost reduction strategies?
Not at all likely Somewhat likely Very likely
Increase employee’s
contribution to
pensions or health
benefits
Employee salary
freeze
Reordering of
spending priorities
Consolidating
departments or
offices
Consolidating or
reducing services
Transferring
responsibilities to
another level of
government
Q19. Again, imagine your agency faces a 2% budget cutback. In response, how
likely would you be to implement the following time strategies?
Not at all likely Somewhat likely Very likely
Reduced work
schedules
Furloughs
Lay-offs
Use of volunteers
instead of paid
employees
Not filling vacant
positions
Retirement
incentives

171
Q20. Again, imagine your agency faces a 2% budget cutback. In response, how
likely would you be to implement the following technology strategies?
Not at all likely Somewhat likely Very likely
Virtual meetings
Increased use of
electronic documents
Increased use of
technology by
employees
Telework (e.g.
telecommuting)
Q21. Again, imagine your agency faces a 2% budget cutback. In response, how
likely would you be to implement the following revenue enhancement strategies?
Not at all likely Somewhat likely Very likely
Tax increases
Use of rainy day
funds
Increase in fees for
services
Debt refinancing
Q22. Lastly, imagine your agency faces a 2% budget cutback. In response, how
likely would you be to outsource activities to the following in response to budget
cutbacks?
Not at all likely Somewhat likely Very likely
Private companies
Nonprofit agencies
Other government
agencies

172
Random Experiment 10 percent
Q18. Imagine your agency faces a 10% budget cutback. In response, how likely
would you be to implement the following cost reduction strategies?
Not at all likely Somewhat likely Very likely
Increase employee’s
contribution to
pensions or health
benefits
Employee salary
freeze
Reordering of
spending priorities
Consolidating
departments or
offices
Consolidating or
reducing services
Transferring
responsibilities to
another level of
government
Q19. Again, imagine your agency faces a 10% budget cutback. In response, how
likely would you be to implement the following time strategies?
Not at all likely Somewhat likely Very likely
Reduced work
schedules
Furloughs
Lay-offs
Use of volunteers
instead of paid
employees
Not filling vacant
positions
Retirement
incentives
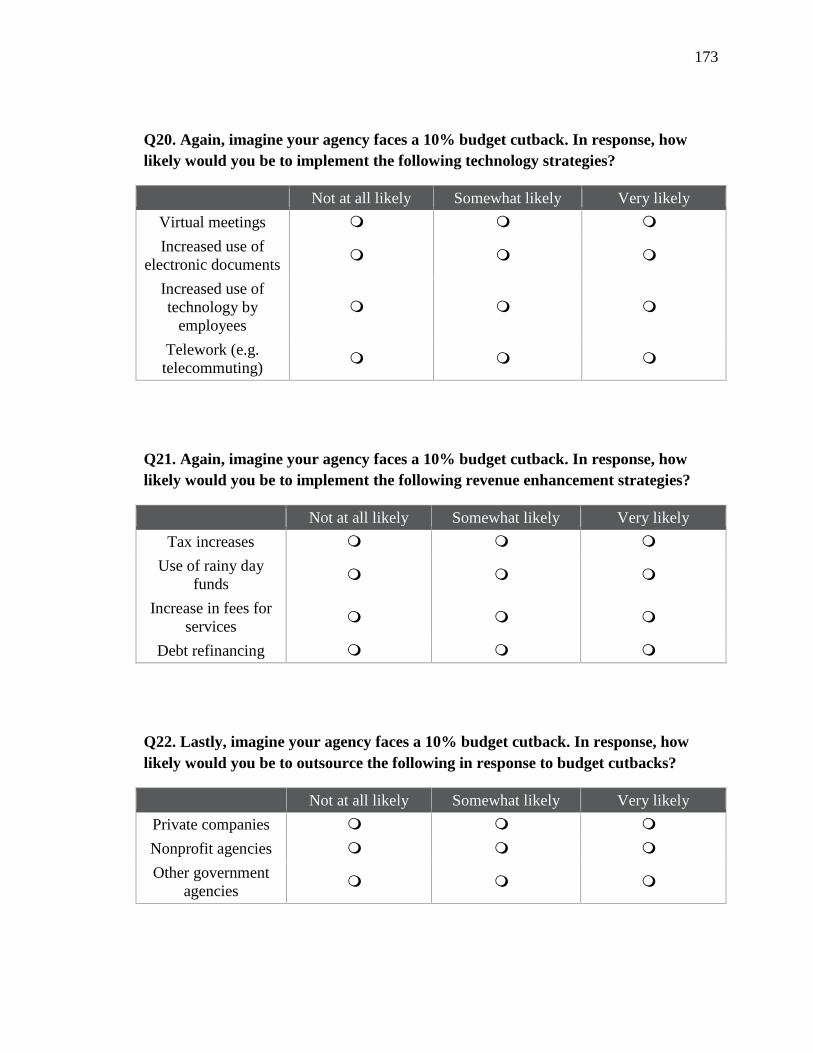
173
Q20. Again, imagine your agency faces a 10% budget cutback. In response, how
likely would you be to implement the following technology strategies?
Not at all likely Somewhat likely Very likely
Virtual meetings
Increased use of
electronic documents
Increased use of
technology by
employees
Telework (e.g.
telecommuting)
Q21. Again, imagine your agency faces a 10% budget cutback. In response, how
likely would you be to implement the following revenue enhancement strategies?
Not at all likely Somewhat likely Very likely
Tax increases
Use of rainy day
funds
Increase in fees for
services
Debt refinancing
Q22. Lastly, imagine your agency faces a 10% budget cutback. In response, how
likely would you be to outsource the following in response to budget cutbacks?
Not at all likely Somewhat likely Very likely
Private companies
Nonprofit agencies
Other government
agencies

174
The next few questions just ask for some facts about you for statistical purposes
only.
Q23. What is the highest level of education you have completed?
High school diploma
2-year college degree
4-year college degree
Master's degree
Law degree
PhD or equivalent
Medical degree (M.D.)
Other (Specify: ____________________
Q24. What is your specialty area in education?
Medicine
Public health
Psychology / psychiatry / mental health
Social Work
Public policy or administration
Business administration
Other (Specify: ____________________
Q25. What is your gender?
Female
Male
Q26. What is your age range?
24 or less
25-34
35-44
45-54
55-64
65 or over

175
Q27. What is the population of the county for which you work?
10,000 to 24,999
25,000 to 49,999
50,000 to 99,999
100,000 to 249,999
250,000 to 499,999
500,000 or more
Not sure
Refuse
Q28. Are you Spanish, Hispanic, or Latino? [For example, Cuban, Puerto Rican,
Mexican American, etc.]
Yes
No
Q29. Which of the following best describe your race? [Please mark all that apply.]
Black/African American
White
Asian/Pacific Islander
Native American
Other (describe: ____________________
Prefer not to answer

176
Q30. In which state do you currently serve?
Alabama
Alaska
Arizona
Arkansas
California
Colorado
Connecticut
Delaware
District of Columbia
Florida
Georgia
Hawaii
Idaho
Illinois
Indiana
Iowa
Kansas
Kentucky
Louisiana
Maine
Maryland
Massachusetts
Michigan
Minnesota
Mississippi
Missouri
Montana
Nebraska
Nevada
New Hampshire
New Jersey
New Mexico
New York
North Carolina
North Dakota
Ohio
Oklahoma
Oregon
Pennsylvania
177
Puerto Rico
Rhode Island
South Carolina
South Dakota
Tennessee
Texas
Utah
Vermont
Virginia
Washington
West Virginia
Wisconsin
Wyoming
I do not reside in the United States
Q31. What is the name of the county you serve?
Q32. Are there any comments you would like to add? [Optional]
Q33. If you would like to receive a summary of the survey findings, please enter
email address. Your email address will be separated from the survey results to keep
all identities confidential.
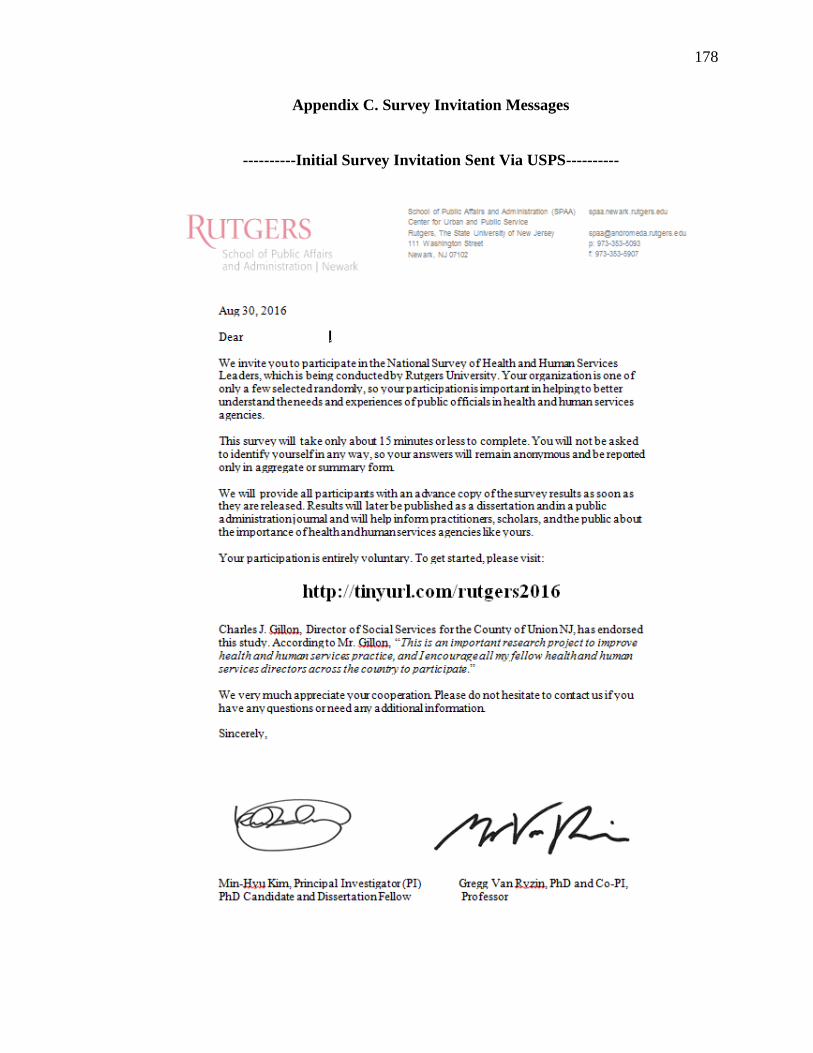
178
Appendix C. Survey Invitation Messages
----------Initial Survey Invitation Sent Via USPS----------

179
----------First Reminder Sent Via E-Mail------------
From: Rutgers University [mailto:[email protected]]
Sent:
To: [XYZ]
Subject: [Reminder] Invitation to Participate in a National Survey of Health and Human
Services Leaders
Dear Title First name Last name,
About a week ago, you should have received a letter inviting you to participate in a
national survey of health and human services leaders. Your organization is one of a few
selected randomly for this nationwide study, which is being conducted by Rutgers
University.
We are following up with this friendly reminder because of the importance of including
your views and the experiences of your organization. The survey should take only about
13 minutes or less of your time to complete, all answers are completely confidential, and
results will be reported only in aggregate form.
We will provide all participants with an advance copy of the survey results as soon as
they are released. Results will later be published in a public administration journal and
will help inform practitioners, scholars, and the public about the importance of
organizations like yours.
Your participation is entirely voluntary. To get started, follow this link to the Survey:
Take the survey
If you have already completed the survey, THANK YOU – and please disregard this
email reminder. We appreciate your participation in this important survey.
If you have not had a chance yet to participate, we hope that you will take the time now
to do so. We thank you in advance for your participation.
Please do not hesitate to contact us if you have any questions or need any additional
information.
Min-Hyu Kim, PI, PhD Candidate and Dissertation Fellow
180
Gregg Van Ryzin, PhD and Co-PI, Professor
School of Public Affairs and Administration, Rutgers University
111 Washington Street
Newark, NJ 07102
Tel: (201) 983-7357
Email: [email protected]

181
----------Final Reminder Sent Via E-Mail------------
From: Rutgers University [mailto:[email protected]]
Sent:
To: [XYZ]
Subject: Final Reminder: Invitation to Participate in a National Survey of Health and
Human Services Leaders
Dear Title First name Last name,
About three weeks ago, you should have received a letter inviting you to participate in a
national survey of health and human services leaders. Your organization is one of a few
selected randomly for this nationwide study, which is being conducted by Rutgers
University.
We are following up with this friendly reminder because of the importance of including
your views and the experiences of your organization. The survey should take only about
15 minutes or less of your time to complete, all answers are completely confidential, and
results will be reported only in aggregate form.
Your participation is entirely voluntary. To get started, follow this link to the Survey:
Take the survey
If you have already completed the survey, THANK YOU – and please disregard this
email reminder. We appreciate your participation in this important survey.
If you have not had a chance yet to participate, we hope that you will take the time now
to do so. We thank you in advance for your participation.
Please do not hesitate to contact us if you have any questions or need any additional
information.
Min-Hyu Kim, PI, PhD Candidate and Dissertation Fellow
Gregg Van Ryzin, PhD and Co-PI, Professor
School of Public Affairs and Administration, Rutgers University
111 Washington Street
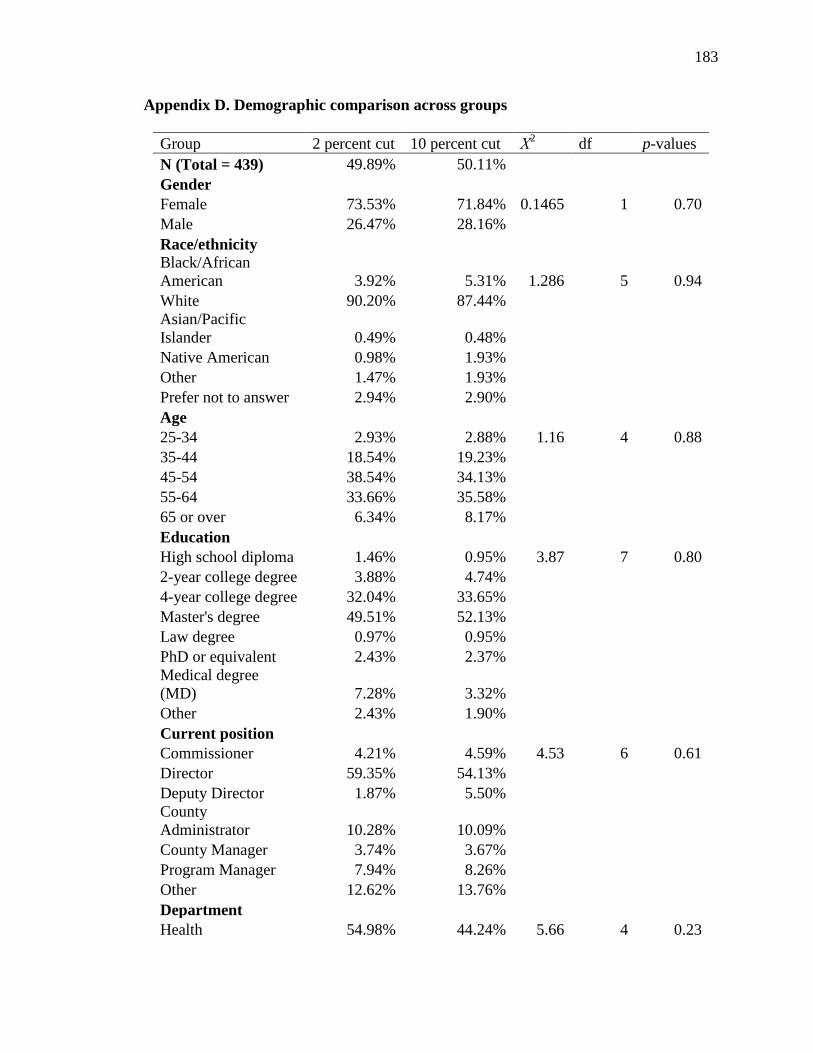
183
Appendix D. Demographic comparison across groups
Group 2 percent cut 10 percent cut Χ2 df p-values
N (Total = 439) 49.89% 50.11%
Gender
Female 73.53% 71.84% 0.1465 1 0.70
Male 26.47% 28.16%
Race/ethnicity
Black/African
American 3.92% 5.31% 1.286 5 0.94
White 90.20% 87.44%
Asian/Pacific
Islander 0.49% 0.48%
Native American 0.98% 1.93%
Other 1.47% 1.93%
Prefer not to answer 2.94% 2.90%
Age
25-34 2.93% 2.88% 1.16 4 0.88
35-44 18.54% 19.23%
45-54 38.54% 34.13%
55-64 33.66% 35.58%
65 or over 6.34% 8.17%
Education
High school diploma 1.46% 0.95% 3.87 7 0.80
2-year college degree 3.88% 4.74%
4-year college degree 32.04% 33.65%
Master's degree 49.51% 52.13%
Law degree 0.97% 0.95%
PhD or equivalent 2.43% 2.37%
Medical degree
(MD) 7.28% 3.32%
Other 2.43% 1.90%
Current position
Commissioner 4.21% 4.59% 4.53 6 0.61
Director 59.35% 54.13%
Deputy Director 1.87% 5.50%
County
Administrator 10.28% 10.09%
County Manager 3.74% 3.67%
Program Manager 7.94% 8.26%
Other 12.62% 13.76%
Department
Health 54.98% 44.24% 5.66 4 0.23

184
Human Services 11.37% 12.90%
Health and Human
Services 10.43% 15.21%
Social Services 15.64% 19.82%
Other 7.58% 7.83%
Population
10,000 to 24,999 14.08% 12.44% 3.94 7 0.79
25,000 to 49,999 15.53% 20.10%
50,000 to 99,999 26.21% 25.84%
100,000 to 249,999 23.79% 19.14%
250,000 to 499,999 8.25% 10.53%
500,000 or more 9.71% 9.09%
Not sure 97.00% 1.91%
Refuse 1.46% 0.96%
Region
Northeast 16.18% 12.38% 2.89 3 0.41
Midwest 37.25% 41.43%
South 34.80% 30.95%
West 11.76% 15.24%