Human health risk assessment of toxic metals
81
HUMAN HEALTH RISK ASSESSMENT OF TOXIC METALS Ph.D. THESIS EMESE SIPTER, M.D., M.Sc. Semmelweis University Doctoral School of Pathological Sciences Research in Public Health and Health Science Study supervisors: Erzsébet Tátrai, M.D., Ph.D., D.Sc. Katalin Gruiz, M.Sc., Ph.D. Official reviewers: Tibor Kerényi, M.D., Ph.D., D.Sc. Sándor Tömösközi, M.Sc., Ph.D. Chair of the examination board: Béla Novák, M.Sc., Ph.D., D.Sc. Members of the examination board: Elemér László, M.Sc., Ph.D., D.Sc. Miklós Moser, M.Sc., Ph.D., D.Sc. Éva Fenyvesi, M.Sc., Ph.D. Gabriella Gáspár, M.Sc., Ph.D. Tibor Szili-Kovács, M.Sc., Ph.D. Budapest 2008
Transcript of Human health risk assessment of toxic metals

HUMAN HEALTH RISK ASSESSMENT OF TOXIC
METALS
Ph.D. THESIS
EMESE SIPTER, M.D., M.Sc.
Semmelweis University Doctoral School of Pathological Sciences
Research in Public Health and Health Science
Study supervisors: Erzsébet Tátrai, M.D., Ph.D., D.Sc. Katalin Gruiz, M.Sc., Ph.D.
Official reviewers: Tibor Kerényi, M.D., Ph.D., D.Sc. Sándor Tömösközi, M.Sc., Ph.D. Chair of the examination board: Béla Novák, M.Sc., Ph.D., D.Sc. Members of the examination board: Elemér László, M.Sc., Ph.D., D.Sc. Miklós Moser, M.Sc., Ph.D., D.Sc. Éva Fenyvesi, M.Sc., Ph.D. Gabriella Gáspár, M.Sc., Ph.D. Tibor Szili-Kovács, M.Sc., Ph.D.
Budapest
2008

CONTENTS
1. INTRODUCTION .............................................................................................................3
1.1. Theory of risk assessment ..........................................................................................3
1.2. Main properties of metals ..........................................................................................7
1.3. Health effect of metals..............................................................................................15
1.4. Risk assessment of metals ........................................................................................28
2. AIMS.................................................................................................................................31
3. MATERIALS AND METHODS....................................................................................32
3.1. Area description........................................................................................................32
3.2. Field experiment .......................................................................................................33
3.3. Pot experiment ..........................................................................................................35
3.4. Laboratory analyses .................................................................................................36
3.5. Questionnaire, statistical analyses and geochemical mapping .............................37
3.6. Risk assessment.........................................................................................................38
4. RESULTS.........................................................................................................................40
4.1. Arsenic and heavy metal content of soils................................................................40
4.2. Arsenic and heavy metal content of plants.............................................................45
4.3. Bioconcentration factors ..........................................................................................48
4.4. Risk assessment.........................................................................................................50
5. DISCUSSION...................................................................................................................55
6. CONCLUSION ................................................................................................................61
7. SUMMARY......................................................................................................................62
8. ACKNOWLEDGEMENTS ............................................................................................64
9. REFERENCES ................................................................................................................65
10. APPENDIX ......................................................................................................................77
11. PUBLICATIONS.............................................................................................................80
1

ABBREVIATIONS OF NOTES
ADD Average Daily Dose
AT Average Time
ATSDR Agency for Toxic Substances and Disaese Registry
BCF Bioconcentration Factor
BW Body Weight
C Concentration
DEFRA Department for Environment, Food and Rural Affairs
ED Event Duration
EF Event Frequention
EHC Environmental Health Criteria
HQ Hazard Quotient
IR Ingestion Rate
LOAEL Lowest Observed Adverse Effect Level
LOD Limit of Detection
NOAEL No Observed Adverse Effect Level
RfC Reference Concentration
RfD Reference Dose
RDA Recommended Dietery Allowances
US EPA United States Environmental Protection Agency
WHO World Health Organization
WMU Waste Management Unit
2

1. INTRODUCTION
1.1. Theory of risk assessment
People are exposed to a variety of potentially harmful agents in the air they
breathe, the liquids they drink, the food they eat, the surfaces they touch and the
products they use. An important aspect of public health protection is the prevention or
reduction of exposures to environmental agents that contribute, either directly or
indirectly, to increased rates of premature death, disease, discomfort or disability
(WHO, 2000).
Chemicals have become an indispensable part of human life, sustaining activities
and development, preventing and controlling many diseases, and increasing agricultural
productivity. Despite their benefits, chemicals may, especially when misused, cause
adverse effects on human health and environmental integrity. The widespread
application of chemicals throughout the world increases the potential of adverse effects.
The growth of chemical industries, both in developing as well as in developed countries,
is predicted to continue to increase. In this context, it is recognized that the assessment
and management of risks from exposure to chemicals are among the highest priorities in
pursuing the principles of sustainable development (WHO, 1999).
Since about 1970 the field of risk assessment has received widespread attention
within both the scientific and regulatory communities (Paustenbach, 2002). Risk
assessment is a conceptual framework that provides the mechanism for a structured
review of information relevant to estimating health or environmental outcomes. In
conducting risk assessments, the National Academy of Sciences risk assessment
paradigm has proven to be an useful tool (National Reasearch Council, 1983). This
paradigm divides the risk assessment process into four distinct steps: hazard
identification, dose-response assessment, exposure assessment and risk characterization
(Cirone and Duncan, 2000).
The purpose of hazard identification is to evaluate the weight of evidence for
adverse effects in humans based on assessment of all available data on toxicity and
mode of action. It is designed to address primarily two questions: (1) whether an agent
may pose a health hazard to human beings, and (2) under what circumstances an
identified hazard may be expressed. Hazard identification is based on analyses of a
3

variety of data that may range from observations in humans to analysis of structure-
activity relationships. The result of the hazard identification exercise is a scientific
judgement as to whether the chemical evaluated can, under given exposure conditions,
cause an adverse health effect in humans. Generally, toxicity is observed in one or more
target organ(s). Often, multiple end-points are observed following exposure to a given
chemical. The critical effect, which is usually the first significant adverse effect that
occurs with increasing dose, is determined.
Dose-response assessment is the process of characterizing the relationship
between the dose of an agent administered or received and the incidence of an adverse
health effect. For most types of toxic effects (i.e. organ-specific,
neurological/behavioural, immunological, non-genotoxic carcinogenesis, reproductive
or developmental), it is generally considered that there is a dose or concentration below
which adverse effects will not occur (i.e. a threshold). For other types of toxic effects, it
is assumed that there is some probability of harm at any level of exposure (i.e. that no
threshold exists). At the present time, the latter assumption is generally applied
primarily for mutagenesis and genotoxic carcinogenesis.
If a threshold has been assumed, traditionally, a level of exposure below which it
is believed that there are no adverse effects, based on a NOAEL/LOAEL (no/lowest-
observed adverse effect level) and uncertainty factors, has been estimated.
Alternatively, the magnitude by which the NOAEL/LOAEL exceeds the estimated
exposure (i.e. the "margin of safety") is considered in light of various sources of
uncertainty. In the past, this approach has often been described as a "safety evaluation".
Therefore, the dose that can be considered as a first approximation of the threshold is
critical. Increasingly, however, the "benchmark dose", a model-derived estimate (or its
lower confidence limit) of a particular incidence level for the critical effect, is being
proposed for use in quantitative assessment of the dose-response for such effects. There
is no clear consensus on appropriate methodology for the risk assessment of chemicals
for which the critical effect may not have a threshold (i.e. genotoxic carcinogens and
germ cell mutagens). Indeed, a number of approaches based largely on characterization
of dose-response have been adopted for assessment in such cases. Therefore, the critical
data points are those that define the slope of the dose-response relationship (rather than
the NOAEL, which is the first approximation of a threshold).
4

The third step in the process of risk assessment is the exposure assessment,
which has the aim of determining the nature and extent of contact with chemical
substances experienced or anticipated under different conditions. Multiple approaches
can be used to conduct exposure assessments. Generally, approaches include indirect
and direct techniques, covering measurement of environmental concentrations and
personal exposures, as well as biomarkers. Questionnaires and models are also often
used. Exposure assessment requires the determination of the emissions, pathways and
rates of movement of a substance and its transformation or degradation, in order to
estimate the concentrations to which human populations or environmental spheres
(water, soil and air) may be exposed. Depending on the purpose of an exposure
assessment, the numerical output may be an estimate of either the intensity, rate,
duration or frequency of contact exposure or dose (resulting amount that actually
crosses the boundary). Three main exposure routes are determined in exposure
assessment: dermal, oral and respiratory. For risk assessments based on dose-response
relationships, the output usually includes an estimate of dose. It is important to note that
the internal dose, not the external exposure level, determines the toxicological outcome
of a given exposure. The general equation of selected exposure route is the following:
ATBW EDEFIRC
ADD×
×××= .
In this equation C is concentration in the media (mg kg-1), IR is ingestion rate
(kg day-1), EF is exposure frequency (days year-1), ED is exposure duration (years), BW
is body weight (kg), AT is average time (days).
The term "worst case exposure" has historically meant the maximum possible
exposure, or where everything that can plausibly happen to maximize exposure,
happens. While in actuality, this worst case exposure may fall on the uppermost point of
the population distribution, in most cases, it will be somewhat higher than the individual
in the population with the highest exposure. The worst case represents a hypothetical
individual and an extreme set of conditions; this will usually not be observed in an
actual population (US EPA, 1992).
Therfore in most risk assessments the "weakest link" is the exposure assessment
(Bridges, 2003). In one hand the uncertainty of exposure assessment is caused by the
calculation of residues in soil, water or air, which is often not a good indicator of
5

bioavailability. The use of biomarkers may provide our information about the pollution
(Kakkar and Jaffery, 2005). In the other hand pollution often occurs in hotspots due to
point sources and it is inadequate to assume that the whole population is exposed to the
same, maybe average, contaminant level. By maintinaing the spatial distribution of soil
contaminant levels and receptors, it is possible, via the source-pathway-receptor
paradigm to calculate more realistic contaminant intake and hence risks (Gay and Korre,
2006). Site-specific risk assessment is based on location specific exposure patways and
land-uses, hence get more realistic results, but often is limited to high-profile studies
and large projects (Lester et al., 2007).
Risk characterization is the final step in risk assessment. It is designed to support
risk managers by providing, in plain language, the essential scientific evidence and
rationale about risk that they need for decision-making. In risk characterization,
estimates of the risk to human health under relevant exposure scenarios are provided.
Thus, a risk characterization is an evaluation and integration of the available scientific
evidence used to estimate the nature, importance, and often the magnitude of human
and/or environmental risk, including attendant uncertainty, that can reasonably be
estimated to result from exposure to a particular environmental agent under specific
circumstances.
The term "risk management" encompasses all of those activities required to
reach decisions on whether an associated risk requires elimination or necessary
reduction. Risk management strategies/or options can be broadly classified as
regulatory, non-regulatory, economic, advisory or technological, which are not mutually
exclusive. Key decision factors such as the size of the population, the resources, costs of
meeting targets and the scientific quality of risk assessment and subsequent managerial
decisions vary enormously from one decision context to another.
It is also recognized that risk management is a complex multidisciplinary
procedure which is seldom codified or uniform, is frequently unstructured, but which
can respond to evolving input from a wide variety of sources. Increasingly, risk
perception and risk communication are recognized as important elements, which must
also be considered for the broadest possible public acceptance of risk management
decisions (WHO, 1999; WHO, 2000; Paustenbach, 2002).
6

1.2. Main properties of metals
1.2.1. Arsenic
Arsenic (atomic number 33; relative atomic mass 74.91) is a metalloid widely
distributed in the earth’s crust and present at an average concentration of 2 mg kg-1. It
occurs in trace quantities in all rock, soil, water and air. Arsenic can exist in four
valency states: –3, 0, +3 and +5. Under reducing conditions, arsenite (As3+) is the
dominant form; arsenate (As5+) is generally the stable form in oxygenated
environments. Elemental arsenic is not soluble in water. Arsenic salts exhibit a wide
range of solubilities depending on pH and the ionic environment (WHO, 2001b).
Arsenic is the main constituent of more than 200 mineral species, of which about
60% are arsenate, 20% sulfide and sulfosalts and the remaining 20% include arsenides,
arsenites, oxides and elemental arsenic. The most common of the arsenic minerals is
arsenopyrite (FeAsS), and arsenic is found associated with many types of mineral
deposits, especially those including sulfide mineralization (Alloway, 1995). Volcanic
action is the most important natural source of arsenic, followed by low-temperature
volatilization. Inorganic arsenic is found in groundwater used as drinking-water in
several parts of the world: in Taiwan (Chen et al., 1994), West Bengal, India (Mandal et
al., 1996) and more recently in most districts of Bangladesh (Dhar et al., 1997; Biswas
et al., 1998). Mining, smelting of non-ferrous metals and burning of fossil fuels are the
major industrial processes that contribute to anthropogenic arsenic contamination of air,
water and soil. Historically, use of arsenic-containing pesticides has left large tracts of
agricultural land contaminated. The use of arsenic in the preservation of timber has also
led to contamination of the environment.
Background concentrations in soil range from 1 to 40 mg kg-1, with a mean
value of 5 mg kg-1. Naturally elevated levels of arsenic in soils may be associated with
geological substrata such as sulfide ores. Terrestrial plants may accumulate arsenic by
root uptake from the soil or by adsorption of airborne arsenic deposited on the leaves.
Arsenic levels are higher in biota collected near anthropogenic sources or in areas with
geothermal activity.
7

Non-occupational human exposure to arsenic in the environment is primarily
through the ingestion of food and water. Of these, food is generally the principal
contributor to the daily intake of total arsenic. In some areas arsenic in drinking-water is
a significant source of exposure to inorganic arsenic. In these cases, arsenic in drinking-
water often constitutes the principal contributor to the daily arsenic intake.
Contaminated soils such as mine tailings are also a potential source of arsenic exposure
(Alam et al., 2003; Caussy, 2003).
The US EPA has determined that the reference dose (RfD) for inorganic arsenic
is 0.0003 mg kg-1 day-1. This RfD is derived from the NOAEL of 0.009 mg l-1 using an
uncertainty factor of 3. The NOAEL was established based on the occurrence of skin
lesions in humans exposed to arsenic. Skin lesions are the most sensitive indicator of
systemic toxicity resulting from chronic oral exposure (LeCoultre, 2001; DEFRA,
2002a).
8

1.2.2. Cadmium
Cadmium (atomic number 48; relative atomic mass 112.40) is a metallic element
belonging to group IIb of the periodic table. Some cadmium salts, such as the sulfide,
carbonate and oxide, are practically insoluble in water; these can be converted to water-
soluble salts in nature. The sulfate, nitrate, and halides are soluble in water. The
speciation of cadmium in the environment is of importance in evaluating the potential
hazard (WHO, 1992a).
Cadmium is closely associated with Zn in its geochemistry; both elements have
similar ionic structures and both are strongly chalcophile. The most abundant sources of
cadmium are the ZnS minerals sphalerite and wurtzite and secondary minerals, such as
ZnCO3 (smithsonite) (Alloway, 1995).
Values for total cadmium concentrations in unpolluted soils vary from
<0.01 to 2.50 mg kg-1. European studies reported that the Cd concentrations in
European soils ranged from 0.06 mg kg-1 in Finland to 0.50 mg kg-1 in the UK,
depending on the nature of the parent material (Jensen and Bro-Rasmussen, 1992;
Krishnamurti et al., 2005).
Cadmium is readily accumulated by many organisms, particularly by
microorganisms and molluscs where the bioconcentration factors are in the order of
thousands. Soil invertebrates also concentrate cadmium markedly. Most organisms
show low to moderate concentration factors of less than 100. Cadmium is bound to
proteins in many tissues. Specific heavy-metal-binding proteins (metallothioneins) have
been isolated from cadmium-exposed organisms. The concentration of cadmium is the
greatest in the kidney, gills, and liver (or their equivalents). Elimination of the metal
from organisms probably occurs principally via the kidney, although significant
amounts can be eliminated via the shed exoskeleton in crustaceans. In plants, cadmium
is concentrated primarily in the roots and to a lesser extent in the leaves. Cadmium
affects the growth of plants in experimental studies, although no field effects have been
reported. The metal is taken up into plants more readily from nutrient solutions than
from soil; effects have been mainly shown in studies involving culture in nutrient
solutions. Stomatal opening, transpiration, and photosynthesis have been reported to be
affected by cadmium in nutrient solutions (WHO, 1992b).
9
Exposure to cadmium produces a wide variety of effects involving many organs
and systems. From the point of view of preventive medicine, the detection of early
effects on the kidneys more serious renal effects and those on the lungs or bones. The
discovery that Cd pollution from a basic metal mining operation could cause serious
illness and possibly death has led to public anxiety as well as medical interest, owing to
reports from Japan of "Ouch-Ouch" (Itai-Itai in Japanese) disease (Emmerson, 1970).
The RfD is determined using the NOAEL and an uncertainty factor of 10. The
uncertainty factor is used to take into account biological variability. EPA has
established RfDs for Cd of 0.001 mg kg-1 day-1 for food and 0.0005 mg kg-1 day-1 for
water. These amounts represent an estimated daily oral exposure that is likely not to
cause adverse health effects (WHO, 1992a; WHO, 1992b; DEFRA, 2002b).
10

1.2.3. Lead
Lead (atomic number 82; relative atomic mass 207.19) is a soft, silvery grey
metal, melting at 327.5°C. It is highly resistant to corrosion, but is soluble in nitric and
hot sulfuric acids. The usual valence state in inorganic lead compounds is +2.
Solubilities in water vary, lead sulfide and lead oxides being poorly soluble and the
nitrate, chlorate and chloride salts are reasonably soluble in cold water. Lead also forms
salts with such organic acids as lactic and acetic acids, and stable organic compounds
such as tetraethyllead and tetramethyllead (WHO, 1989).
The level of lead in the earth's crust is about 20 mg kg-1. It is seldom found in its
elemental form; however, it is part of several ores including its own (galena, PbS). Lead
in the environment may derive from either natural or anthropogenic sources. Natural
sources of atmospheric lead include geological weathering and volcanic emissions and
have been estimated at 19 000 tonnes per year, compared to an estimate of 126 000
tonnes per year emitted to the air from the mining, smelting and consumption of over 3
million tonnes of lead per year. Ambient air levels over 10 µg m-3 have been reported in
urban areas near a smelter, whereas lead levels below 0.2 µg m-3 have been found in
cities where leaded petrol is no longer used. Background levels of lead in soil range
between 10 and 70 mg kg-1 and a mean level near roadways of 138 mg kg-1 has been
reported. Present levels of lead in water rarely exceed a few μg l-1; the natural
concentration of lead in surface water has been estimated to be 0.02 µg l-1. Lead and its
compounds may enter the environment at any point during mining, smelting,
processing, use, recycling or disposal. Major uses are in batteries, cables, pigments,
petrol (gasoline) additives, solder and steel products. Lead and lead compounds are also
used in solder applied to water distribution pipes and to seams of cans used to store
foods, in some traditional remedies, in bottle closures for alcoholic beverages and in
ceramic glazes and crystal tableware. In countries where leaded petrol is still used, the
major air emission is from mobile and stationary sources of petrol combustion (urban
centres). Areas in the vicinity of lead mines and smelters are subject to high levels of air
emissions. Airborne lead can be deposited on soil and water, thus reaching humans
through the food chain and in drinking-water (WHO, 1995; LeCoultre, 2001).
11

In the general non-smoking adult population, the major exposure pathway is
from food and water. Airborne lead may contribute significantly to exposure, depending
upon such factors as use of tobacco, occupation, proximity to motorways, lead smelters,
etc., and leisure activities (e.g. arts and crafts, firearm target practice). Food, air, water
and dust/soil are the major potential exposure pathways for infants and young children.
For infants up to 4 or 5 months of age, air, milk, formulae and water are the significant
sources of lead exposure. Lead intake from air can vary from 4 µg day-1 to more than
200 µg day-1. The level of dietary exposure to lead depends upon many lifestyle factors,
including foodstuffs consumed, processing technology, use of lead solder, lead levels in
water, and use of lead-glazed ceramics. Inhalation is the dominant pathway for lead
exposure of workers in industries producing, refining, using or disposing of lead and
lead compounds. During an 8-h shift, workers can absorb as much as 400 µg lead, in
addition to the 20-30 µg day-1 absorbed from food, water and ambient air; significant
intake may occur from ingestion of large inhaled particulate material (WHO, 1989;
WHO, 1995).
The US EPA considered that it was inappropriate to set a RfD for ingestion of
inorganic lead (US EPA, 2006). They noted that "by comparison to most other
environmental toxicants, the degree of uncertainty about the health effects of lead is
quite low. It appears that some of these effects, particularly changes in the levels of
certain blood enzymes and in aspects of children’s neurobehavioral development, may
occur at blood lead levels so low as to be essentially without a threshold" (DEFRA,
2002c). JECFA set the provisional tolerable weekly intake (PTWI) for all age groups at
25 μg kg–1 week-1, thus the PTWI/7 formula can replace the RfD (JECFA, 1993).
12

1.2.4. Zinc
Zinc (atomic number 30; relative atomic mass 65.38) is a metallic element
belonging to group IIb and the fourth period of the periodic table. Zinc is a chalcophilic
element like copper and lead, and a trace constituent in most rocks. Zinc rarely occurs
naturally in its metallic state, but many minerals contain zinc as a major component
from which the metal may be economically recovered. Sphalerite (ZnS) is the most
important ore mineral and the principal source for zinc production (WHO, 2001a).
For non-contaminated soils worldwide, Adriano reported average zinc
concentrations of 40–90 mg kg-1, with a minimum of 1 mg kg-1 and a maximum of 2000
mg kg-1. Low levels are found in sandy soils (10–30 mg kg-1), while high contents are
found in clays (95 mg kg-1) (Adriano, 1986).
The fate and transport of zinc (Zn2+) in the environment is dependant on cation
exchange capacity, pH, organic matter content, nature of complexing ligands, and the
concentration of the metal in the soil. As pH increases, there is an increase in negatively
charged binding sites on soil particles, which facilitates the adsorption of zinc ions and
removal from solution. The zinc concentration in the soil and clay content are positively
correlated. The most common form of zinc in anaerobic soils is the insoluble zinc
sulfide. Therefore, mobility is limited in anaerobic conditions. Zinc mobility increases
with low pH under oxidizing conditions and low cation exchange capacity. The
presence of competing metal ions and organic ions such as humic material may cause
the adsorption of Zn2+ ions to the soil, particularly in soils with an elevated pH, via
ligand exchange reactions. These reactions reduce the solubility of zinc in the soil
solution and, therefore, reducing its mobility and limit its bioavailability (LeCoultre,
2001).
Studies have shown that the uptake of zinc by terrestrial plants is significantly
increased at a low soil pH, but reduced when there is a high content of organic matter.
Normal levels of zinc in most crops and pastures range from 10 mg kg-1 to 100 mg kg-1.
Some plant species are zinc accumulators, but the extent of the accumulation in plant
tissues varies with soil properties, plant organ and tissue age. Zinc toxicity in plants
generally causes disturbances in metabolism, which are different from those occurring
13

in zinc deficiency. The critical leaf tissue concentration of zinc for an effect on growth
in most species is in the range 200–300 mg kg-1 (WHO, 2001a).
Zinc is an essential element in the human diet thus zinc deficiency in the diet
may be more detrimental to human health. The human health effects associated with
zinc deficiency are numerous, and include neurosensory changes, oligospermia,
impaired neuropsychological functions, growth retardation, delayed wound healing,
immune disorders and dermatitis. These conditions are generally reversible when
corrected by zinc supplementation. A disproportionate intake of zinc in relation to
copper has been shown to induce copper deficiency in humans, resulting in increased
copper requirements, increased copper excretion and impaired copper status.
Pharmacological intakes of zinc have been associated with effects ranging from
leukopenia and/or hypochromic microcytic anaemia to decreases in serum high-density
lipoprotein concentrations. These conditions were reversible upon discontinuation of
zinc therapy together with copper supplementation (Institute of Medicine, 2001).
The recommended dietary allowance (RDA) for zinc is 11 mg day-1 in men and
8 mg day-1 in women; these correspond to approximately 0.16 mg kg-1 day-1 for men
and 0.13 mg kg-1 day-1 for women. Higher RDAs are recommended for women during
pregnancy and lactation. The RfD is determined using the LOAEL (60 mg day-1) and an
uncertainty factor of 3. US EPA has established RfD for Zn of 0.3 mg kg-1 day-1
calculating with average bodyweight (70 kg) (US EPA, 2006).
14

1.3. Health effect of metals
1.3.1. Arsenic
The most characteristic effect of long-term oral exposure to inorganic arsenic
compounds is the development of skin lesions; these lesions are often used as diagnostic
criteria for arsenicosis. The three lesions most often associated with chronic arsenicosis
are hyperkeratinization of the skin (especially on the palms and soles), formation of
multiple hyperkeratinized corns or warts, and hyperpigmentation of the skin with
interspersed spots of hypopigmentation. Numerous studies of long-term, low-level
exposure to inorganic arsenic in humans have reported the presence of these lesions. In
general, they begin to manifest at chronic exposure levels >0.02 mg kg-1 day-1. Chronic
oral studies of lower exposure levels, ranging from 0.0004 to 0.01 mg kg-1 day-1, have
generally not reported dermal effects. The mechanism by which inorganic arsenic
causes dermal effects is not well-understood. Elucidating the mechanism of dermal
effects has been particularly difficult because the dermal effects common in humans
have not been seen in studies in animals. Dermal effects have also been reported
following inhalation exposures to inorganic arsenic, although they are not as diagnostic
as for oral exposure. Direct dermal contact with inorganic arsenicals may cause
irritation and contact dermatitis. Usually, the effects are mild (erythema and swelling),
but may progress to papules, vesicles, or necrotic lesions in extreme cases; these
conditions tend to heal without treatment if exposure ceases (Holmquist, 1951; ATSDR,
2007a).
A large number of studies in humans have reported cardiovascular effects
following oral exposure to inorganic arsenic compounds. The cardiac effects of arsenic
exposure are numerous, and include altered myocardial depolarization (prolonged QT
interval, nonspecific ST segment changes), cardiac arrhythmias, and ischemic heart
disease. These effects have been seen after acute and long-term exposure to inorganic
arsenic in the environment, as well as side effects from intravenous therapy with arsenic
trioxide for acute promyelocytic leukemia. Exposure levels for environmental exposures
have not been well characterized, but intravenous doses for arsenic trioxide therapy are
generally on the order of 0.15 mg kg-1 day-1. Chronic exposure to inorganic arsenic has
15

also been shown to lead to effects on the vascular system. The most dramatic of these
effects is “blackfoot disease,” a disease characterized by a progressive loss of
circulation in the hands and feet, leading ultimately to necrosis and gangrene. Blackfoot
disease is endemic in an area of Taiwan where average drinking water levels of arsenic
range from 0.17 to 0.80 ppm, corresponding to doses of 0.014–0.065 mg kg-1 day-1.
Arsenic exposure in Taiwan has also been associated with an increased incidence of
cerebrovascular and microvascular diseases and ischemic heart disease. While blackfoot
disease itself has not been reported outside of Taiwan, other vascular effects are
common in areas with high arsenic exposures, and include such severe effects as
increases in the incidences of Raynaud's disease and of cyanosis of fingers and toes as
well as hypertension, thickening and vascular occlusion of blood vessels, and other
unspecified cardiovascular conditions (Little et al., 1990; Chen et al., 1994; Cullen et
al., 1995; Mumford et al., 2007).
While case reports and small cohort studies have routinely reported an increase
in respiratory symptoms of humans exposed occupationally to inorganic arsenic, dose-
response data for these symptoms are generally lacking. The only study that evaluated
respiratory effects (changes in chest X-ray or respiratory performance) reported an
exposure estimate did not report significant changes at an exposure level of
0.613 mg m-3. Exposed workers often report irritation of the mucous membranes of the
nose and throat, which may lead to laryngitis, bronchitis, or rhinitis. Increased mortality
due to respiratory disease has been reported in some cohort mortality studies of arsenic-
exposed workers, but no conclusive evidence of an association of these diseases with
arsenic exposure has been presented. It is not known whether respiratory effects
following inhaled inorganic arsenic compounds are due to a direct effect of arsenic on
respiratory tissues, general effects of foreign material in the lungs, or an effect of
arsenic on the pulmonary vasculature. Respiratory effects have also been reported
following oral exposure of humans to inorganic arsenic. In general, respiratory effects
have not been widely associated with long-term oral exposure to low arsenic doses.
However, some studies have reported minor respiratory symptoms, such as cough,
sputum, rhinorrhea, and sore throat, in people with repeated oral exposure to
0.03–0.05 mg kg-1 day-1. More serious respiratory effects, such as bronchitis and
sequelae (bronchiectasia, bronchopneumonia) have been observed in patients
16

chronically exposed to arsenic and at autopsy in some chronic poisoning cases (Milton
and Rahman, 2002).
Both short-term and chronic oral exposures to inorganic arsenicals have been
reported to result in irritant effects on gastrointestinal tissues. Numerous studies of
acute, high-dose exposure to inorganic arsenicals have reported nausea, vomiting,
diarrhea, and abdominal pain, although specific dose levels associated with the onset of
these symptoms have not been identified. Chronic oral exposure to 0.01 mg kg-1day-1
generally results in similar reported symptoms. For both acute and chronic exposures,
the gastrointestinal effects generally diminish or resolve with cessation of exposure.
Similar gastrointestinal effects have been reported after occupational exposures to
inorganic arsenicals, although it is not known if these effects were due to absorption of
arsenic from the respiratory tract or from mucociliary clearance resulting in eventual
oral exposure (WHO, 2001b; ATSDR, 2007a).
A common effect following both oral and inhalation exposure to inorganic is the
development of peripheral neuropathy. Following occupational exposure to inorganic
arsenic in pesticide plants or smelters, exposed workers have shown increased incidence
of neurological changes, including altered nerve conduction velocities. Histological
features of the neuropathy include a dying-back axonopathy and demyelinisation.
Following removal from exposure, the neuropathy is only partially reversible and what
recovery does occur is generally slow. Reports of neurological effects at lower arsenic
levels (0.004–0.006 mg kg-1day-1) have been inconsistent, with some human studies
reporting fatigue, headache, depression, dizziness, insomnia, nightmare, and numbness
while others reported no neurological effects. Some studies also have reported that
exposure to arsenic may be associated with intellectual deficits in children. The
mechanism of arsenic-induced neurological changes has not been determined (Gerr et
al., 2000).
There is clear evidence from studies in humans that exposure to inorganic
arsenic by either the inhalation or oral routes increases the risk of cancer. Numerous
studies of copper smelters or miners exposed to arsenic trioxide have reported an
increased risk of lung cancer. Increased incidence of lung cancer has also been observed
at chemical plants where exposure was primarily to arsenate. Other studies suggest that
residents living near smelters or arsenical chemical plants may have increased risk of
17

lung cancer, although the reported increases are small and are not clearly detectable in
all cases. There is convincing evidence from a large number of epidemiological studies
and case reports that ingestion of inorganic arsenic increases the risk of developing skin
cancer. The most common tumors seen are squamous cell carcinomas, which may
develop from the hyperkeratotic warts or corns commonly seen as a dermal effect of
oral inorganic arsenic exposure. Early studies of populations within the United States
did not suggest an increased risk of cancer from oral inorganic arsenic exposure. Later
studies have found suggestive evidence that the possibility of arsenic-induced skin
cancers cannot be discounted based on an association between toenail arsenic levels and
incidence of skin cancer. There is increasing evidence that long-term exposure to
arsenic can result in the development of bladder cancer, with transitional cell cancers
being the most prevalent. While studies have noted statistical dose-response trends in
arsenic-induced bladder cancers, reliable quantitative assessments of dose-response
relationships have not been presented. Several studies have also shown that chronic oral
exposure to arsenic results in the development of respiratory tumors, making lung
cancer an established cause of death from exposure to arsenic in drinking water (Chen et
al., 1988; Moore et al., 1994; Enterline et al., 1995; ATSDR, 2007a).
18

1.3.2. Cadmium
Acute inhalation exposure to cadmium at concentrations above about 5 mg m-3
may cause destruction of lung epithelial cells, resulting in pulmonary oedema,
tracheobronchitis, and pneumonitis. The respiratory response to cadmium is similar to
the response seen with other agents that produce oxidative damage. There typically is an
alveolar pneumocyte type 2 cell hyperplasia in response to type 1 cell damage and
necrosis. Long-term inhalation exposure at lower levels also leads to decreased lung
function and emphysema. Some tolerance to cadmium-induced lung irritation develops
in exposed humans, and respiratory function may recover after cessation of cadmium
exposure. Another effect of long-term inhalation cadmium exposure is damage to the
olfactory function. Nonoccupational exposure to cadmium is unlikely to be high enough
to cause significant respiratory effects (Leduc et al., 1993; Sorahan and Lancashire,
1997).
Conflicting evidence has been obtained for the effect of cadmium exposure on
the cardiovascular system. In some studies on rats, rabbits, and monkeys, cadmium
exposure was shown to increase blood pressure, or to cause cardiac lesions. However,
studies of exposed humans have found positive, negative and no association between
cadmium exposure and hypertension. This suggests that if cadmium does affect blood
pressure, the magnitude of the effect is small compared to other determinants of
hypertension. Death rates for cardiovascular disease do not appear to be elevated in
populations exposed to cadmium by inhalation or in the diet. Overall, the weight of
evidence suggests that cardiovascular effects are not a sensitive end point indicator for
cadmium toxicity (Kopp, 1982; Steassen and Lauwerys, 1993).
The gastrointestinal tract is the target organ for high-level, acute, oral exposure
to cadmium in both humans and animals, due to direct irritation of the gastric
epithelium. The main symptoms following ingestion of cadmium at doses above about
0.07 mg kg-1 in humans are nausea, vomiting, and abdominal pain. Gastrointestinal
toxicity is not observed after lower levels of oral exposure or after inhalation exposure
to cadmium, indicating that gastrointestinal effects are not likely to occur from
environmental exposures to cadmium (Shipman, 1986).
19
Both oral and inhalation exposure to cadmium can cause anaemia. Oral
exposure to cadmium has been shown to reduce uptake of iron from the diet in animals.
It is likely that cadmium transported to the gastrointestinal system from the lung
following inhalation exposure would also reduce iron absorption. Therefore, anaemia
induced by inhalation exposure to cadmium is likely to be caused by reduced iron
absorption (Friberg et al., 1985).
Prolonged inhalation or ingestion exposure of humans to cadmium causing renal
dysfunction can lead to painful and debilitating bone disease in individuals with risk
factors such as poor nutrition. Evidence from human studies suggests that low-level
chronic exposure to cadmium causes alternations in renal metabolism of vitamin D,
which then may cause milder bone effects (osteoporosis). These effects may be
compounded by loss of calcium and phosphate with more severe renal damage, leading
to osteomalacia. A recent large-scale cohort study in Belgium found that increased
urinary calcium excretion was significantly associated with urinary cadmium levels, an
index of kidney cadmium burden. This evidence suggests that either cadmium may have
a direct effect on bone at levels lower than those causing kidney damage, or that
interference with vitamin D metabolism in the proximal tubule may be a more sensitive
indicator of cadmium-induced renal damage than proteinuria (Jarup et al., 1998;
Steassen et al., 1999).
The kidney is the main target organ for cadmium toxicity following
intermediate- or chronic-duration exposure by the inhalation or oral routes, as has been
shown by numerous studies. The first manifestation of kidney damage is decreased
reabsorption of filtered low molecular-weight proteins, indicating damage to the renal
tubules. Production of tubular proteinuria is a relatively specific effect of cadmium on
the kidneys and has been observed even following acute parenteral exposure in animals.
This damage has been associated with increased urinary levels of β2-microglobulin,
retinol-binding protein, or other low-molecular-weight proteins. At higher levels or
durations of exposure, increased excretion of high molecular-weight proteins occurs,
indicating either glomerular damage or severe tubular damage. The sensitivity of the
kidney to cadmium is related to the metabolism of cadmium in the body. Except for
extremely high-dose exposure, cadmium exists in the body primarily bound to
metallothionein. The Cd-metallothionein complex is readily filtered at the glomerulus
20

and reabsorbed in the proximal tubule. Within the tubular cells, the metallothionein is
degraded in lysosomes and free cadmium is released. The synthesis of endogenous
metallothionein by the tubular cells is then stimulated, but when the total cadmium
content in the renal cortex exceeds approximately 200 μg g-1 wet weight, the amount of
cadmium not bound to metallothionein becomes sufficiently high to cause tubular
damage (Waalkes and Goering, 1990; Buchet et al., 1999)
The health significance of the early kidney damage is difficult to assess. The
decreased resorption of low molecular-weight proteins is not adverse in and of itself,
but may be indicative of increased excretion of other solutes. Deaths from renal failure
due to cadmium exposure are rare, but even after cadmium exposure ceases, the renal
damage continues to progress. Evidence that cadmium exposure may affect kidney
vitamin D metabolism with subsequent disturbances in calcium balance and bone
density suggests that decreased bone density, particularly in elderly women, may be a
significant adverse effect of kidney cadmium accumulation (WHO, 1992a; WHO,
1992b; ATSDR, 1999).
.
21
1.3.3. Lead
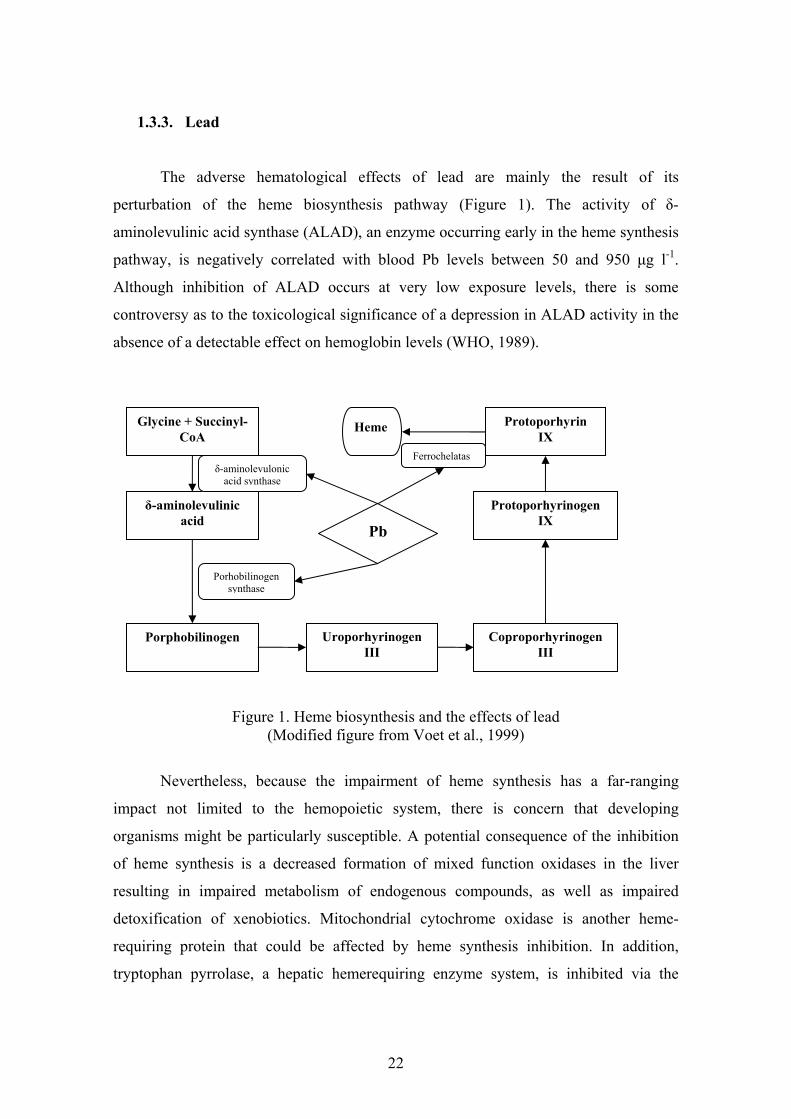
The adverse hematological effects of lead are mainly the result of its
perturbation of the heme biosynthesis pathway (Figure 1). The activity of δ-
aminolevulinic acid synthase (ALAD), an enzyme occurring early in the heme synthesis
pathway, is negatively correlated with blood Pb levels between 50 and 950 μg l-1.
Although inhibition of ALAD occurs at very low exposure levels, there is some
controversy as to the toxicological significance of a depression in ALAD activity in the
absence of a detectable effect on hemoglobin levels (WHO, 1989).
Glycine + Succinyl-CoA
Protoporhyrin IX
δ-aminolevulinic acid
Porphobilinogen Uroporhyrinogen III
Coproporhyrinogen III
Heme
Protoporhyrinogen IX
δ-aminolevulonic acid synthase
Porhobilinogen synthase
Ferrochelatas
Pb
Figure 1. Heme biosynthesis and the effects of lead (Modified figure from Voet et al., 1999)
Nevertheless, because the impairment of heme synthesis has a far-ranging
impact not limited to the hemopoietic system, there is concern that developing
organisms might be particularly susceptible. A potential consequence of the inhibition
of heme synthesis is a decreased formation of mixed function oxidases in the liver
resulting in impaired metabolism of endogenous compounds, as well as impaired
detoxification of xenobiotics. Mitochondrial cytochrome oxidase is another heme-
requiring protein that could be affected by heme synthesis inhibition. In addition,
tryptophan pyrrolase, a hepatic hemerequiring enzyme system, is inhibited via the
22

reduction in the free hepatic heme pool (Kwong et al., 2004). This could ultimately lead
to increased levels of the neurotransmitter serotonin in the brain and increased aberrant
neurotransmission in serotonergic pathways. Inhibition of heme synthesis also results in
increased levels of δ-aminolevulinic acid (ALA), which has a structure similar to that of
the inhibitory neurotransmitter gamma-aminobutyric acid (GABA), and therefore,
interferes with GABA neurotransmission (Sakai, 2000). Anemia occurs at blood Pb
levels of ≥200 μg l-1. The combined effects of rudeced heme body pool is demonstrated
in Figure 2 (WHO, 1995; ATSDR, 2007b).
Reduction of heme body pool
Anaemia Neural effects Renal endocrine effects Hepatic effects
Hypoxic effects
Impaired myelinization Impaired development
Reduced vitamin D
Impaired calcium role Impaired bone development
Impaired detoxification
Figure 2. The effects of reduced heme body pool (Modified figure from WHO, 1995)
Lead can impair cognitive function in children and adults, but children are more
vulnerable than adults. Although the inhalation and oral routes are the main routes of
exposure for both adults and children, children are more likely to have contact with
contaminated surfaces due to playing on the ground and to hand-to-mouth activities.
However, perhaps more important is the fact that the developing nervous system is
especially susceptible to lead toxicity. During brain development, lead interferes with
the trimming and pruning of synapses, migration of neurons, and neuron/glia
interactions. The time of exposure-specific response appears to have contributed to the
failure to identify a "behavioral signature" of lead exposure. Other factors that may
affect individual vulnerability are certain genetic polymorphisms, such as that for the
23

vitamin D receptor, the lead-binding enzyme ALAD, or the ApoE genotype. One
important additional factor shown to influence the toxicity of lead is the characteristics
of the child’s rearing environment, a modifying factor. Most importantly, no threshold
for the effects of lead on IQ has been identified (Davis and Svendsgaard, 1987; Goering,
1993; Schwartz, 1994).
Although lead has been shown to produce various cardiovascular and renal
effects in animals, end points of greatest concern for humans at low exposures and low
blood Pb levels are elevations in systemic blood pressure and decrements in glomerular
filtration rate. These effects may be mechanistically related and, furthermore, can be
confounders and covariables in epidemiological studies. Decrements in glomerular
filtration rate may contribute to elevations in blood pressure, and elevated blood
pressure may predispose people to glomerular disease. Meta-analyses of the
epidemiological findings have found a persistent trend in the data that supports a
relatively weak, but significant association. Quantitatively, this association amounts to
an increase in systolic blood pressure of approximately 1 Hgmm with each doubling of
blood Pb level. The results of more recent epidemiology studies indicate that the lead
contribution to elevated blood pressure is more pronounced in middle age than at
younger ages. Lead poisoning in childhood has also been associated with hypertension
during adulthood in the absence of clinically significant renal disease and discernable
elevations in blood Pb level (Hertz-Picciotto and Croft, 1993; WHO, 1995).
Classic lead nephrotoxicity is characterized by proximal tubular nephropathy,
glomerular sclerosis, interstitial fibrosis and related functional deficits, including
enzymuria, low- and high-molecular weight proteinuria, impaired transport of organic
anions and glucose, and depressed glomerular filtration rate. In humans, the overall
dose-effect pattern suggests an increasing severity of nephrotoxicity associated with
increasing blood Pb level, with effects on glomerular filtration evident at blood Pb level
below 100 μg l-1, enzymuria and proteinuria becoming evident above 300 μg l-1, and
severe deficits in function and pathological changes occurring in association with blood
Pb level exceeding 500 μg l-1. Furthermore, as noted previously, hypertension can be
both a confounder in studies of associations between lead exposure and creatinine
clearance as well as a covariable with lead exposure. (Bernard and Becker, 1988; Goyer,
1993; ATSDR, 2007b).
24

1.3.4. Zinc
Zinc is an essential nutrient for humans that is necessary for the function of a
large number of metalloenzymes, including alcohol dehydrogenase, alkaline
phosphatase, carbonic anhydrase, leucine aminopeptidase, and superoxide dismutase.
Zinc deficiency has been associated with dermatitis, anorexia, growth retardation, poor
wound healing, hypogonadism with impaired reproductive capacity, impaired immune
function, and depressed mental function; an increased incidence of congenital
malformations in infants has also been associated with zinc deficiency in the mothers.
Zinc deficiency may also have an impact on the carcinogenesis of other chemicals,
although the direction of the influence seems to vary with the carcinogenic agent
(Institute of Medicine, 2001).
The effects of inhalation exposure to zinc and zinc compounds vary somewhat
with the chemical form of the zinc compound, but the majority of the effects seen will
occur within the respiratory tract. Following inhalation of zinc oxide, and to a lesser
extent zinc metal and many other zinc compounds, the most commonly reported effect
is the development of “metal fume fever.” Metal fume fever, a well-documented acute
disease induced by inhalation of metal oxides, especially zinc, impairs pulmonary
function but does not usually progress to chronic lung disease. Symptoms generally
appear within a few hours after acute exposure, usually with dryness of the throat and
coughing. The most prominent respiratory effects of metal fume fever are substernal
chest pain, cough, and dyspnoe. The impairment of pulmonary function is characterized
by reduced lung volumes and a decreased diffusing capacity of carbon monoxide.
Leukocytosis persisting for approximately 12 hours after the fever dissipates is also a
common manifestation of metal fume fever. In general, the symptoms of metal fume
fever resolve within 1–4 days after cessation of exposure and do not lead to long-term
respiratory effects. The exact mechanism behind the development of metal fume fever is
not known, but it is believed to involve an immune response to the inhaled zinc oxide. It
has been suggested that the zinc oxide causes inflammation of the respiratory tract and
the release of histamine or histamine-like substances. In response, an allergen-antibody
complex is formed that may elicit an allergic reaction upon subsequent exposure to the
allergen. In response to the allergen-antibody complex, an anti-antibody is formed. The
25
anti-antibody dominates with continued exposure to the zinc oxide, thereby producing a
tolerance. When the exposure is interrupted and re-exposure occurs, the allergen-
antibody complex dominates, producing an allergic reaction and symptoms of metal
fume fever (Malo et al., 1990; Lindahl et al., 1998).
Nausea has been reported by humans exposed to high concentrations of zinc
oxide fumes (300–600 mg m-3) and zinc chloride (~120 mg m-3) smoke, as well as
following oral exposure to zinc chloride and zinc sulfate. Other gastrointestinal
symptoms reported in cases of excess zinc exposure include vomiting, abdominal
cramps, and diarrhea, in several cases with blood. In general, oral exposure levels
associated with gastrointestinal effects of zinc have not been reliably reported, but the
limited available data suggest that oral concentrations of 910 mg l-1 or single-dose
exposures of ~140–560 mg (acute oral doses of 2–8 mg kg-1 day-1) are sufficient to
cause these effects. The noted effects are consistent with gastrointestinal irritation. It is
unclear in the majority of human studies whether the gastrointestinal effects seen
following zinc inhalation were due to systemic zinc or were the result of direct contact
with the gastrointestinal tract following mucociliary clearance of inhaled zinc particles
and subsequent swallowing (WHO, 2001a; ATSDR, 2005).
Following longer-term exposure to lower doses (~0.5–2 mg kg-1 day-1) of zinc
compounds, the observed symptoms generally result from a decreased absorption of
copper from the diet, leading to early symptoms of copper deficiency. When ingested
zinc levels are very high, zinc is believed to inhibit copper absorption through
interaction with metallothionein at the brush border of the intestinal lumen. Both copper
and zinc appear to bind to the same metallothionein protein; however, copper has a
higher affinity for metallothionein than zinc and displaces zinc from metallothionein
protein. Copper complexed with metallothionein is retained in the mucosal cell,
relatively unavailable for transfer to plasma, and is excreted in the feces when the
mucosal cells are sloughed off. Thus, an excess of zinc can result in a decreased
availability of dietary copper, and the development of copper deficiency. This fact has
been used therapeutically in the treatment of Wilson’s Disease. Zinc supplementation is
used to substantially decrease the absorption of copper from the diet, which can
aggravate the disease. Copper is incorporated into metalloenzymes involved in
hemoglobin formation, carbohydrate metabolism, catecholamine biosynthesis, and
26

cross-linking of collagen, elastin, and hair keratin. The copper-dependent enzymes,
which include cytochrome C oxidase, superoxide dismutase, ferroxidases, monoamine
oxidase, and dopamine β-monooxygenase, function mainly to reduce molecular oxygen.
Excess zinc may alter the levels or activity of these enzymes before the more severe
symptoms of copper deficiency, which include anaemia and leucopenia, begin to
manifest. Numerous studies in humans receiving 40–50 mg zinc day-1 (0.68–0.83 mg
kg-1 day-1) have reported decreases in erythrocyte superoxide dismutase, mononuclear
white cell 5'-nucleotidase, and plasma 5'-nucleotidase activities (Hewitt, 1988; ATSDR,
2005).
High-dose zinc administration has also resulted in reductions in leukocyte
number and function. Some studies have also found decreases in high-density
lipoprotein (HDL) levels in humans exposed to increased levels of zinc; however, not
all studies have confirmed this observation. Long-term consumption of excess zinc may
also result in decreased iron stores, although the mechanism behind this effect is not
presently clear. In most cases, dermal exposure to zinc or zinc compounds does not
result in any noticeable toxic effects (Hughes at Samman, 2006).
Available studies have not presented evidence of reproductive or developmental
effects in humans following inhalation of zinc compounds. Effects on reproductive or
developmental end points have been noted in oral-exposure animal studies, but
generally only at very high doses (>200 mg kg-1 day-1). Available studies of zinc-
induced carcinogenic effects in humans following both oral or inhalation exposure have
not adequately demonstrated an increase in cancer incidence. The EPA currently
classifies zinc and compounds as carcinogenicity group D (not classifiable as to human
carcinogenicity) (WHO, 2001a; ATSDR, 2005).
27

1.4. Risk assessment of metals
Inorganic metals and metal compounds have unique characteristics that should
be considered when assessing their risks. Metals are neither created nor destroyed by
biological or chemical processes; they are transformed from one chemical form to
another. Native (zero valence) forms of most metals and some metal compounds are not
readily soluble, and as a result, toxicity tests based on soluble salts may overestimate
the bioavailability and toxicity of these substances. Some metals (e.g. copper, selenium,
and zinc) are nutritionally essential elements at low levels but toxic at higher levels, and
others (e.g. lead, arsenic, and mercury) have no known biological functions. Because
metals are naturally occurring, many organisms have evolved mechanisms to regulate
accumulations, especially accumulations of essential metals (Fairbrother et al., 2007).
The "soil–plant barrier" concept was introduced to communicate how metal
addition, soil chemistry, and plant chemistry affect risk to human from metals mixed in
soil (Chaney, 1980). Plants access metals through the pore water although mycorrhyzae,
protons, and phytosiderophores released by the root can significantly influence the
microenvironment and change uptake rates of metals. Furthermore, plants have both
active and passive mechanisms for taking up or excluding metals, depending on internal
concentrations and whether or not the metal is an essential micronutrient, or whether it
is mistaken for an essential micronutrient. The different routes of plant uptake is found
in Figure 3 (US EPA, 2003; Fairbrother et al., 2007).
28

Figure 3. Release, exposure, and uptake mechanisms of contaminants in plants
(US EPA, 2003)
The risk assessor should consider the default approach to estimating exposure of
plants to metal as measuring metal concentrations in bulk soil (top 0–12 cm). It is very
clear that strongly acidic soils increase plant uptake of zinc, cadmium, nickel, cobalt and
increase the potential for phytotoxicity from copper, zinc, and nickel. Alkaline soil pH
increases uptake of molibdene and selenium, while lead and chromium are not absorbed
to any significant extent at any pH (Kabata-Pendias and Pendias, 1985).
The general concepts of risk assessment might to be modified to make a correct
approach of metal risk assessment. Figure 4 illustrates this concept. In this concept the
"weakest link" is the exposure model. Two main parts of this model is the
bioaccumulation model and the dietery exposure model. The most important source for
direct human exposure is the "econosphere", which contains food and drinking water
(Baker et al., 2003). Trophic transfer can be an important route of exposure for metals,
although biomagnification of inorganic forms of metals in food webs is generally not a
concern in metals assessments.
29

Loadings to media
Distribution in diet
Distribution in media
Exposure Distribution in tissue
Risk
Transport model
Bioaccu-mulation
model
Exposure model
Dietery exposure
model
Figure 4. Generic conceptual model for metals risk assessment (Modified figure from Fairbrother et al., 2007)
Infants and children can have enhanced exposures to metals through the pathway
of surface dust because they crawl and play in close proximity to surface dust and they
often mouth their hands (e.g. finger sucking) and objects in their environment. This
causes an intake of surface dust that is generally greater than that which is normally
found in adults. Few studies of soil ingestion in adults have been conducted; however,
the estimates support the assumption that average daily soil ingestion rates of adults
who do not participate in activities in which intensive exposure to surface dust and soil
occur (e.g. occupational gardening, construction work) are lower than those of children
(Fairbrother et al., 2007).
The distribution of metals in human tissues determined by oral bioavailability.
This depends on soil and mineral characteristics and also toxicological profiles.
Historically, relative bioavailability estimates for metals in soil have been based on in
vivo studies in laboratory animals. In recent years the main goals are to establish in vitro
extraction tests, which are rapid and inexpensive methods (Ruby et al., 1999).
30
2. AIMS
The purpose of my study was to refine the human health risk assessment and
exposure assessment of metal contaminated sites.
In this approach the main objects were:
• to analyse the arsenic, cadmium, lead and zinc content of soil and
homegrown vegetables in the area of an abandoned lead-zinc mine,
• to model the plant uptake of metals with the most accumulating
vegetable species in polluted and unpolluted soil,
• to develop a more reasonable method for risk assessment,
• to determine the differences in soil pollution and human health risk
between the flooded and non-flooded vegetable gardens in the village
of Gyöngyösoroszi using site-specific and default exposure
parameters.
31

3. MATERIALS AND METHODS
3.1. Area description
The studied area is located in the South-Western part of Mátra Mountains,
North-Eastern Hungary along the left side of the Toka creek. The creek flows from
North to South through the village Gyöngyösoroszi (47.826°N, 19.894°E) and collects
the runoff of the abandoned metal site. The territory is the Southern part of the biggest
collapse caldera in the Western Mátra. The mountain mostly consists of amphibole
andesite, its pyroclastics and pyroxene andesite at the top together with 500-2000 m
thickness. The stratovolcanic andesite series is containing more than 1% Pb-Zn
concentration in the 0.5-1 m thick dikes (Nagy, 1986). In the Gyöngyösoroszi area the
most frequent ore minerals are galenite (PbS), sphalerite (ZnS), pyrite (cubic FeS2),
marcasite (rhombic FeS2) and chalcopyrite (CuFeS2) (Vető, 1988). The mining
activities were based on these minerals.
Mining began in the Middle Ages and was expanding rapidly throughout the 19th
century until 1929. After two decades of interruption, mining continued more
intensively and between 1954 and 1985 the total amount of 3920089 tons of ore were
mined and transported to the flotation plant near Gyöngyösoroszi (Nagy, 1986; Kovács
et al., 2006). To meet the water demand of the flotation technology an industrial water
reservoir was constructed in the valley of the Toka creek. The mining activity has
ceased, but the final closing of the mine and remediation of the site has not been carried
out yet. The sulphide minerals in the old drifts and headings have been oxidized and
sulfurous acid is formed by infiltration. The acidic mine drainage is continuously limed
and the lime-precipitate is settled and dumped in open reservoirs. Before the
establishment of the neutralization plant, the mine outflow entered directly into the
surface water system, where it was in situ neutralized, and this lime precipitate has been
part of the sediment of Toka creek and water reservoirs. In 1996 a remarkable
precipitation event (105 mm) occurred during one day, the water overflowed the dams
and caused a huge flood in the village. The toxic sediment was spread over the
surrounding vegetable gardens.
32

3.2. Field experiment
Sampling of soils and vegetables was carried out at 44 sampling sites from
flooded and non-flooded vegetable gardens in the village Gyöngyösoroszi. The flooded
gardens are near to the bank of Toka creek; the non-flooded gardens are 100-400 m
from the creek. Soil samples were collected also from the taling dump at 13 sampling
sites. The sampled locations are marked on Figure 5. At each sampling site duplicate
samples were collected by random sampling method according to MSZ 21470-1
(Hungarian Standard Institution, 1998), 1 kg soil samples were packed into
polyethylene bags.
Vegetable samples were taken from flooded and non-flooded vegetable gardens
in the village according to the type of harvest. Six vegetable species were selected for
this study; these were representative of species consumed in the studied area: tomato
(Lycopersicon lycopesicum), squash (Cucurbita pepo), bean (Phaseolus vulgaris), onion
(Allium cepa), carrot (Daucus carota ssp. sativus) and sorrel (Rumex rugosus). Good
quality vegetable samples were selected using a random sampling procedure, packed
into polyethylene bags and transported to the laboratory. The sampling amount of
vegetables were the following: 0.3-0.5 kg tomato, 1-2 kg squash, 0.2-0.3 kg bean, 0.4-
0.6 kg onion, 0.3-0.5 kg carrot and 0.1-0.2 kg sorrel.
33

Figure 5. Topographical map and sampling points in the studied area
34

3.3. Pot experiment
The pot experiment was planned on the basis of field experiment. Two soils
were used: one was collected from non-flooded vegetable garden in the village (UP).
This soil is a typical unpolluted soil with relevant background concentrations. The other
soil sample (P) was a mixture of reference soil (80%) and tailing material (20%). This
mixture modelled the flooding processes.
6-6 black plastic pots were filled with 1000 g air-dried soil (Figure 6). There
were three replications of each sample in a randomized block design. Vegetable seeds
were sowed into the pots: sorrel (Rumex acetosa) (100 seeds) and carrot (Daucus
carota) (100 seeds). These were the most accumulating vegetables in the field
experiment. The germination ability had defined in test before the experiment and the
sowing number of seeds calculated. The water holding capacity of the soils was
measured and the water supply was determined as 70% of the saturation. The
evaporated water was supplemented at every 2nd day. Nitrogen and phosphorus were
added as 3-3 ml 50 g l-1 (NH4)2HPO4 solution per pots on the 65th and 86th day. The
plant fresh weight and toxic metal content was measured after harvesting. The seedling
number was determined on the 6th, 8th, 10th, 13th, 15th, 17th, 20th day.
The experiment was carried out in climate chamber for 106 days with 400 W m-2
light and 24°C for 16 hours and darkness and 16°C for 8 hours.
Figure 6. Arrangement of the pots
35

3.4. Laboratory analyses
Soil samples were dried at 30°C until constant weight and sieved through 2-mm
nylon mesh according to MSZ 21470-2 (Hungarian Standard Institution, 1981).
The vegetable samples were washed with distilled water three times to eliminate
the air-borne pollutants and soil particles and then blotted dry with tissue paper. Only
the edible part of each vegetable was used for analytical purposes; the non-edible parts
were removed using a plastic knife. The cook-ready vegetables were weighed, dried at
30°C until constant weight, weighed again to determine water content and then ground
using a ceramic-coated grinder.
1 g of dried soil and vegetable samples were treated with 4 ml of aqua regia
(HNO3:HCl=1:3) in hermetic Teflon bombs and placed in a microwave digester
(Milestone 1200 MEGA) under a power-controlled program. Solutions were filtered and
made up to 25 ml with deionized water. The arsenic, cadmium, mercury, lead and zinc
contents were measured by inductively coupled-mass spectrometry (Agilent HP4500
Plus) according to method 6020 (US EPA, 1994). The limits of detection (LOD) for
soils and vegetables were the following: 0.005 mg kg-1 for Cd, Pb and Zn; 0.01 mg kg-1
for Hg; and 0.05 mg kg-1 for As. The accuracy of the methodology was checked by
determining the levels in duplicate samples as well as those of blanks. For quality
control standard reference materials (GBW07404 and LGC6138) were used. The
recovery rates ranged from 89 to 110%.
36

3.5. Questionnaire, statistical analyses and geochemical mapping
A standardized questionnaire (q.v. Appendix) was constructed to set the site-
specific parameters for risk assessment. The door-to-door survey method was operated
with open response and multiple choices. The age, gender, body weight, family
members and the average yield of the home-produced vegetables were asked. The
survey included 67 vegetable gardens in the village and 90 participants (43 male and 47
female).
Median concentrations and median absolute deviation were calculated and
compared to their Hungarian pollution limit value. In analyzing the differences among
the two territory types the Mann-Whitney test was used for the statistical analysis taking
p<0.05 as significant. The statistical parameters were prepared using Statistica 6.0
(StatSoft, Tulsa, OK, 2001).
Base map was created from the topographic map at the scale 1:10000 of the
Hungarian Cartographical Company. An area of 10 km2 was selected around
Gyöngyösoroszi, which United Hungarian Projection (EOV) coordinates with
geographical grid of parallels and meridians were the following: EOV X between
712000 and 714500, EOV Y between 275000 and 279000.
The sampling points were digitalized according to their GPS coordinates.
Separated geochemical maps were created for arsenic, cadmium, lead and zinc
concentrations using the grid based graphics program Surfer 8.0 (Golden Software,
Golden, CO, 2002). The data were weighted by interpolation with inverse distance to a
power method: the influence of one sampling site relative to other declines with
distance from the grid node (Mueller et al., 2004).
37

3.6. Risk assessment
The average daily dose was calculated in two selected exposure routes by default
and site-specific equations. The default equations and exposure factors were derived
from databases (US EPA, 1992; US EPA, 1997). The default equations were the
following:
(1) Ingestion of soil: ATBW
EDEFIRCADD SOILS
××××
=
(2) Ingestion of vegetables: ATBW
EDEFIRFBCFCADD VEGHPS
××××××
=
CS is concentration in soil (mg kg-1), BCF is bioconcentration factor (-), FHP is
the fraction of home-produced vegetables (-), IRSOIL is ingestion rate of soil (kg day-1),
IRVEG is ingestion rate of vegetables (kg day-1), EF is exposure frequency (days year-1),
ED is exposure duration (years), BW is body weight (kg), AT is average time (days).
The average daily dose of soil ingestion was calculated separately for adults and
children, because of differences in bodyweight and ingestion rate soil.
The site-specific equation of ingestion of vegetables was created from
quastionairre derived data. The equation of ingestion of soil was the same as the default:
(3) Ingestion of soil: ATBW
EDEFIRCADD SOILS
××××
=
(4) Ingestion of vegetables: ATBW
ED)n
YC(ADD
VEGVEG
×
××=∑
CS is concentration in soil (mg kg-1), CVEG is concentration in vegetable (mg kg-1
fresh weight), YVEG is the average yield of the selected vegetable in the garden (kg year-
1), n is the average family size (-), IRSOIL is ingestion rate of soil (kg day-1), EF is
exposure frequency (days year-1), ED is exposure duration (years), BW is body weight
(kg), AT is average time (days).
The average daily dose of soil ingestion was calculated separately for men,
women and children, because of differences in bodyweight and ingestion rate soil. The
average daily dose of vegetable ingestion for men and women was calculated
separately, because of differences in bodyweight. All of the parameters applied in the
calculations were site-specific and derived from a population survey, except the
38

parameter ingestion rate soil, which was 16.7 mg day-1 for children and 10 mg day-1 for
adults (Wcislo et al., 2002).
The non-carcinogenic risk was characterized using a hazard quotient (HQ),
which is the ratio of the average daily dose (ADD) to the reference dose (RfD). The
applied reference doses were the following: 0.0003 mg kg-1 day-1 for As; 0.001 mg kg-1
day-1 for Cd; 0.035 mg kg-1 day-1 for Pb; and 0.3 mg kg-1 day-1 for Zn. If HQ is bigger
than 1, then the ADD of particular metal exceeds the RfD, indicating that there is a
potential risk associated with that metal. The hazard index (HI) is the sum of hazard
quotient for each exposure route and metal (Paustenbach, 2002).
39

4. RESULTS
4.1. Arsenic and heavy metal content of soils
The results obtained for the median, median absolute deviation (MAD), minimum
and maximum for soil samples are presented in Table 1.
Table 1. Arsenic and heavy metal content of soil samples (mg kg-1)
Sample type Parameters As Cd Pb Zn Median 55.7 1.46 125.5 436Tailing dump MAD 29.3 0.40 49.5 114
Minimum 24.5 0.97 66.0 297 Maximum 365.0 9.08 658.0 1110
Median 46.6 1.31 85.2 366Flooded vegetable gardens MAD 9.9 0.50 37.8 98 Minimum 24.4 0.33 29.2 120 Maximum 142.0 13.60 694.0 2050
Median 31.4 0.43 27.8 142Non-flooded vegetable gardens MAD 3.0 0.12 6.4 28 Minimum 23.8 0.22 20.5 97 Maximum 37.4 0.70 40.1 225
Median 202.5 0.49 391.5 159Pot experiment polluted soil MAD 27.5 0.06 36.0 11
Minimum 132.0 0.28 305.0 142 Maximum 241.0 0.70 448.0 173
Median 34.5 0.27 30.8 124Pot experiment unpolluted soil MAD 3.2 0.06 5.7 13 Minimum 28.2 0.21 23.2 108 Maximum 40.2 0.43 44.3 145 Pollution limit value 15.0 1.00 100.0 200MAD: Median absolute deviation
The median concentrations were compared to the Hungarian pollution limit
value. The arsenic and metal content of flooded vegetable gardens exceeded these
thresholds, with the exception of lead, whereas the contents of non-flooded vegetable
gardens were, bar arsenic, under these thresholds. The flooded and non-flooded
vegetable gardens show highly significant differences (p<0.0005 for As, p<0.00005 for
Cd, Hg and Zn, and p<0.00001 for Pb), but the difference between the tailing dump and
flooded vegetable gardens was non significant. The arsenic content of soils in the pot
experiment also exceeded the Hungarian pollution limit value, but the cadmium and
40

zinc content were under these thresholds. The difference was significant (p<0.01 for Cd,
p<0.005 for Zn and p<0.001 for As). The differences between the non-flooded
vegetable gardens and unpolluted soil were non significant, but between the polluted
soil and flooded vegetable gardens or tailing dump was significant (p<0.005 for As and
Pb, and p<0.0005 for Cd and Zn).
The differences in maximum concentrations are highest in the case of cadmium
(19 times) and lead (17 times), and lowest in the case of arsenic (3.8 times). These could
confirm that the origin of the high Cd and Pb content of flooded vegetable gardens is
the floods of Toka creek.
41

Figure 7, Figure 8, Figure 9, and Figure 10 show the median arsenic and metal
contents of soil samples. The tailing dump and the polluted soil in the pot experiment
have the highest concentration values; the non-flooded vegetable gardens and the
unpolluted soil in the pot experiment have the lowests. Mixing the soil with tailing
material (polluted soil) principally increased the lead and arsenic content in the pot
experiment.
0
255075
100125150175200225250
As
Tailing dumpFlooded vegetable gardensNon-flooded vegetable gardensPot experiment polluted soilPot experiment unpolluted soil
Figure 7. Arsenic content of soil samples
0.000.250.500.751.001.251.501.752.00
Cd
Tailing dumpFlooded vegetable gardensNon-flooded vegetable gardensPot experiment polluted soilPot experiment unpolluted soil
Figure 8. Cadmium content of soil samples
42

050
100150200250300350400450
Pb
Tailing dumpFlooded vegetable gardensNon-flooded vegetable gardensPot experiment polluted soilPot experiment unpolluted soil
Figure 9. Lead content of soil samples
050
100150200250300350400450500550
Zn
Tailing dumpFlooded vegetable gardensNon-flooded vegetable gardensPot experiment polluted soilPot experiment unpolluted soil
Figure 10. Zinc content of soil samples
Arsenic, cadmium, lead and zinc distribution are shown on contour maps (Figure
11). The first step of color scale is the natural background of the area: 15 mg kg-1 for
arsenic, 0.1 mg kg-1 for cadmium, 20 mg kg-1 for lead and 70 mg kg-1 for zinc (Ódor et
al., 1998), the second step is the Hungarian pollution limit value. The tailing dump
show high concentration values and the contour lines draw plum configuration in the
direction of the village. The concentration maps reflect the flooding plain with higher
concentration values in the village.
43

Figure 11. Concentration maps
44

4.2. Arsenic and heavy metal content of plants
The results of vegetable analyses are shown on Table 2 and Table 3. The arsenic
content of vegetables was under the limit of detection in every cases in the field
experiment.
Table 2. Arsenic and heavy metal content of vegetable samples (mg kg-1)
Tomato Squash Bean NF F NF F NF F As <LOD <LOD <LOD <LOD <LOD <LODCd †0.008 †0.060 0.005 0.033 0.010 0.020Pb †0.083 †0.480 †0.079 †0.673 0.141 0.260Zn †3.16 †18.00 †1.41 †30.90 †7.70 †30.5 Onion Carrot Sorrel NF F NF F NF F As <LOD <LOD <LOD <LOD <LOD <LODCd 0.056 0.070 0.068 0.130 0.101 0.115Pb †0.130 †1.060 0.278 0.810 †0.295 †0.990Zn 17.20 42.20 11.80 27.60 29.30 60.50
†p<0.05 NF: non-flooded vegetable gardens F: flooded vegetable gardens LOD: limit of detection
Table 3. Arsenic and heavy metal content of vegetables in pot experiment (mg kg-1)
Carrot Sorrel UP P UP P As <LOD 1.214 <LOD <LODCd †0.063 †0.300 †0.164 †1.273Pb †0.149 †7.720 2.109 8.570Zn †16.59 †27.82 †43.18 †139.57
†p<0.05 UP: unpolluted soil P: polluted soil LOD: limit of detection
45

The measured heavy metal levels were higher in vegetables grown in flooded
vegetable gardens in every case, but it was significant (p<0.05) in the Cd content of
tomato, the Pb content of tomato, squash, onion and sorrel, and the Zn content of
tomato, bean and squash. We have not found any significant differences in the case of
carrot. The highest concentration of Cd was found in carrot, the highest concentration of
Zn found in sorrel, and the highest Pb content found in onion.
In the case of pot experiment the arsenic content was measurable in the carrot
grown in polluted soil. The heavy metal levels were higher in carrot and sorrel grown in
polluted soil, and the differences were significant, with the exception of lead content of
sorrel. The highest concentrations were found in sorrel grown in polluted soil.
The yield of vegetables was also measured in the pot experiment. The yield of
carrot was 12.148 grams in unpolluted soil, and 8.759 grams in polluted soil. The
quality of vegetables also differed (Figure 12 and Figure 13). The yield of sorrel was
hardly differed (10.539 grams in unpolluted soil and 10.642 grams in polluted soil).
The seedling capacity is significantly differed between the polluted and
unpolluted soils in case of sorrel. (8.7 vs 4 in case of sorrel and 26 vs. 24 in case of
carrot.)
46

Figure 12. Carrot grown in unpolluted soil
Figure 13. Carrot grown in polluted soil
47

4.3. Bioconcentration factors
The bioconcentration factor (BCF) was calculated from the ratio of the metal
concentration of the vegetable (fresh weight) and the metal concentration of the soil.
Figure 14 illustrates the BCFs of different species in flooded and non-flooded vegetable
gardens and Figure 15 illustrates the BCFs of the pot experiment.
The calculated BCFs were low in the field experiment (0.003-0.012 for lead,
0.012-0.235 for cadmium and 0.010-0.206 for zinc). The BCFs of pot experiment were
much higher (0.004-0.069.1 for lead, 0.232-2.59 for cadmium and 0.133-0.882 for zinc)
than the BCFs of field experiment. The BCF was higher than 1 only in one case, the
cadmium bioconcentration factor of sorrel in polluted soil.
The highest bioaccumulation capacity has the sorrel in both experiments. In the
field experiment higher BCFs were found in the non-flooded vegetable gardens, but in
the pot experiment the BCFs of polluted soils were higher. In our experiments cadmium
and zinc were the mobile elements, cadmium was more mobile than zinc in the pot
experiment. In the field experiment zinc was more mobile in less bioaccumulating
vegetables (tomato, squash and bean).
48

0.00
0.05
0.10
0.15
0.20
0.25
NF F NF F NF F NF F NF F NF F
tomato squash bean onion carrot sorrel
CdPbZn
Figure 14. Bioconcentration factors of vegetable gardens
NF: non-flooded vegetable gardens F: flooded vegetable gardens
0.00
0.50
1.00
1.50
2.00
2.50
UP P UP P
carrot sorrel
CdPbZn
Figure 15. Bioconcentration factors of pot experiment
UP: unpolluted soil P: polluted soil
49

4.4. Risk assessment
The default exposure parameters were demonstrated in Table 4. The yearly
consumption of home-produced vegetables is about 42 kg with default data, the
holidays amounted 2 weeks, and the average bodyweight is 70 kg. The bioconcentration
factors are set only for different metals and the type of vegetable is unregarded. Table 5
illustrates the site-specific exposure parameters, which were derived from the
questionnaire survey method. Holidays amounted to only 1 week per year, therefore the
exposure frequency was 358 days. Home gardening is a traditional family food
production system in the village of Gyöngyösoroszi. Home-produced vegetables are for
family consumption and not for commercial purposes, therefore in the calculation
formula the yield of vegetables was divided by the average family size in the village.
The yearly consumption of vegetables per capita was the following: 7.68 kg tomato,
6.21 kg squash, 2.74 kg bean, 2.44 kg onion, 2.15 kg carrot and 1.32 kg sorrel.
Table 4. Default exposure parameters
Parameter Value Origin Ingestion ratevegetable (kg day-1) 0.301 US EPA, 1997 Ingestion ratesoil adult (kg day-1) 0.00005 US EPA, 1997 Ingestion ratesoil children (kg day-1) 0.0001 US EPA, 1997 BCFAs 0.021 Bockting and van den Berg, 1992 BCFCd 0.37 Bockting and van den Berg, 1992 BCFPb 0.013 Bockting and van den Berg, 1992 BCFZn 0.22 Bockting and van den Berg, 1992 Fractionhome-produced vegetables 0.4 US EPA, 1997 Exposure frequency (days) 350 US EPA, 1997 Bodyweightadult (kg) 70 US EPA, 1997 Bodyweightchildren (kg) 15 US EPA, 1997
50

Table 5. Site-specific exposure parameters
Parameter Value Yieldtomato (kg year-1 garden-1) 21.56 Yieldsquash (kg year-1 garden-1) 17.43 Yieldbean (kg year-1 garden-1) 7.68 Yieldonion (kg year-1 garden-1) 6.85 Yieldcarrot (kg year-1 garden-1) 6.04 Yieldsorrel (kg year-1 garden-1) 3.70 Family size (garden-1) 2.8 Exposure frequency (days) 358 Bodyweightmen (kg) 80.07 Bodyweightwomen (kg) 73.66
51

The results of human health risk assessment with default values are shown in
Table 6 and Figure 16.
Table 6. Hazard indices of flooded and non-flooded vegetable gardens (default parameters)
Flooded vegetable gardens
Ingestion soil Ingestion vegetable
Hazard index
As 0.18239 0.53801 0.72040Cd 0.00154 0.07994 0.08148Pb 0.02858 0.05219 0.08077Zn 0.00143 0.04427 0.04570
Hazard index 0.21394 0.71441 0.92835
Non-flooded vegetable gardens
Ingestion soil Ingestion vegetable
Hazard index
As 0.12290 0.36252 0.48542Cd 0.00051 0.02624 0.02675Pb 0.00933 0.01703 0.02636Zn 0.00056 0.01718 0.01774
Hazard index 0.13330 0.42297 0.55627
0.00
0.15
0.30
0.45
0.60
Ingestionsoil
Ingestionvegetable
Ingestionsoil
Ingestionvegetable
Non-floodedvegetable gardens
Flooded vegetablegardens
AsCdPbZn
Figure 16. Distribution of hazard indices of flooded and non-flooded vegetable gardens (default parameters)
52

The summarized hazard index of flooded vegetable gardens is 0.92835 and of
non-flooded vegetable gardens is 0.55627, which is an indicated acceptable risk. The
largest contribution to hazard index was from arsenic both in the flooded and non-
flooded vegetable gardens. In all cases most hazard index was attributable to ingestion
of home-produced vegetables (77% in the case of flooded vegetable gardens and 76% in
the case of non-flooded vegetable gardens). The contribution to the hazard index from
soil ingestion was largest for children in flooded-vegetable gardens and 90% of the risk
is derived from arsenic.
The results of human health risk assessment with site-specific parameters are
shown in Table 7 and Figure 17. The summarized hazard index of flooded vegetable
gardens is 0.3275 and of non-flooded vegetable gardens is 0.0922, both of them are
indicated acceptable risk. The largest contribution to hazard index was from lead both in
the flooded and non-flooded vegetable gardens. In all cases most hazard index was
attributable to ingestion of home-produced vegetables (83% in the case of flooded
vegetable gardens and 72% in the case of non-flooded vegetable gardens). The
contribution to the hazard index from soil ingestion was largest for children in flooded-
vegetable gardens and 90% of the risk is derived from arsenic.
53

Table 7. Hazard indices of flooded and non-flooded vegetable gardens (site-specific parameters)
Flooded vegetable gardens
Ingestion soil Ingestion vegetable
Hazard index
As 0.05140 - 0.05140Cd 0.00020 0.04730 0.04750Pb 0.00534 0.14500 0.15034Zn 0.00025 0.07800 0.07825
Hazard index 0.05719 0.27030 0.32749
Non-flooded vegetable gardens
Ingestion soil Ingestion vegetable
Hazard index
As 0.02350 - 0.02350Cd 0.00011 0.01900 0.01911Pb 0.00165 0.02870 0.03035Zn 0.00011 0.01910 0.01921
Hazard index 0.02537 0.06680 0.09217
0.00
0.05
0.10
0.15
0.20
Ingestionsoil
Ingestionvegetable
Ingestionsoil
Ingestionvegetable
Non-floodedvegetable gardens
Flooded vegetablegardens
AsCdPbZn
Figure 17. Distribution of hazard indices of flooded and non-flooded vegetable gardens (site-specific parameters)
54

5. DISCUSSION
Metals are widely used, and their sources are numerous. Major sources are
smelters, mining activities, hazardous waste sites and even natural sources (Calderon et
al., 2003). Our studied area –the area of a former lead/zinc mine– is a typical metal
polluted site, where the main pollutants are arsenic, lead, cadmium and zinc. The metal
contamination in Gyöngyösoroszi area is well-documentated, but these are mainly
analysed the soil pollution (Horváth and Gruiz, 1996; Ódor et al., 1998; Fügedi, 2004;
Kovács et al., 2006) or the possibility of phytoremediation (Máthé-Gáspár and Anton,
2005; Simon, 2005). The health effect of pollution and risk assessment is rarely
investigated.
Arsenic, cadmium and lead contamination have been reported in smelter and
mining areas located in different coutries, among them Poland (Ullrich et al., 1999,
Weislo et al., 2002), Spain (Grimalt et al., 1999), China (Liu et al., 2005, Zheng et al.,
2007b), Korea (Lee et al., 2001, Jung, 2001, Kim et al., 2005), Slovakia (Rapant et al.,
2006) and Romania (Lacatusu, 1996). These studies are completed with risk
assessment.
In our study the measured concentrations are the "pseudo-total metal contents",
which accounts for the aqua regia digestion not completely destroying silicates (Manta
et al., 2002). This method is widely used in environmental geochemistry studies and
recommended by the Hungarian Standards Institution. High arsenic concentrations were
found in all samples, also found in lower layers (28 mg kg-1), and are thought to
represent the natural background (Ódor et al., 1998). Generally lead and zinc are
contained in the dikes of the Badenian while copper is dominantly in the Karpatian
coarsely crystalline stratovolcanic andesite series and arsenic occurs mainly in the dikes
of the small porphyritic andesite (kalitrachite or tuffs) series (Nagy, 1986). This can be
one interpretation of high arsenic concentration in the area. On the other hand, the most
frequented lead ore mineral is galenite, where lead can be substituted by silver, copper
and zinc, rarely arsenic as microscopical inclusions.
The statistical analyses emphasize the relevance of floods in the contamination
of vegetable gardens in the village and the origin of this contamination is the tailing
dump. The high median absolute deviation in the soil of tailing dump and flooded
55
vegetable gardens shows the inhomogeneous distribution of soil contamination. The
statistical analysis suggested that the mixing of unpolluted soil with tailing material
neither modelling the flooded vegetable gardens and nor the soil of the tailing dump.
The geochemical maps of the studied area tried to predict pollutant
concentrations at sites where measurements had not been taken (Morra et al., 2006). The
modeling methods have been greatly strengthened by the use of geographical
information system (GIS) and geostatistical techniques. These techniques have been
used to model local pollution patterns on the basis of monitored data (Nieuwenhuijsen
et al., 2006). In the studied area the highest values are found in the tailing dump, but the
patterns of elements are not similar, only the mobile elements like cadmium and zinc
have similar patterns. The created isoconcentration maps help to visualize the soil
pollution from the measured data. These predicted the most polluted area in the village
and may enhance exposure assessment in environmental epidemiology studies (Jarup,
2004).
Despite of the arsenic concentration being high in the soil, in the vegetables it
was under the limit of detection. In contrast with our results, other studies found
elevated levels of arsenic in vegetables and crops cultivated in metal-contaminated soils
(Queirolo et al., 2000; Lee and Chon, 2003; Rapant et al., 2006). The different
mineralogy form and the presence of bioleaching microbes could explain the various
phyto- and bioavailability of arsenic (Ruby et al., 1999; Mahimairaja et al., 2005).
In our study the most mobile metals were cadmium and zinc. Our results agree
with Ullrich et al., who found that the potential phytoavailability of Pb, Zn and Cd in
the topsoils between pH 5 and 7 declines in the order Cd, Zn and Pb (Ullrich et al.,
1999). The order of bioconcentration capacity of metals was Cd>Zn>>Pb and this
strongly agrees with the literature data (McBride, 2003; Cui et al., 2004; Liu et al.,
2005).
Sorrel was the most contaminated vegetable while the lowest concentration was
measured in bean. Other studies found spinach, which is very similar to sorrel, had the
highest bioconcentration capacity among vegetables (Mattina et al., 2003; Wang et al.,
2006) and bean had one of the lowest (Liu et al., 2005). Generally, the BCFs are lower
in flooded vegetable gardens, this is in agreement with BCF values decreasing as the
metal concentration in soil increasing (Alam et al., 2003; Wang et al., 2004). In case of
56

low accumulating vegetables (tomato, squash and bean) this effect was not
predominating. Results indicated different characters of species for element uptake.
Zheng et al. found similar BCF values for vegetables in China (Zheng et al., 2007a).
In the pot experiment the important pollutant elements were the same as in the
field experiment and the seeded vegetables were the most bioaccumulating vegetables:
carrot and sorrel. The rates of metal concentration were higher than the field experiment
in polluted soil and unpolluted soil, too. Cadmium content increased at a higher rate in
both species compared to zinc content. Increase of cadmium content of sorrel caused the
highest BCF. In contrast with the field experiment, the bioconcentration values of
polluted soil were higher, than the unpolluted soil. Other studies also tried to model the
contaminated soil by mixing the unpolluted soil with other materials (Dudka et al.,
1996). In our study this approach does not model the contamination process, the
flooding. The high accumulating capacity in pot experiment can generate by the pH
decreasing. The increased metal concentration in tailing material can decrease the pH of
soil and hence stimulate the accumulating capacity (Chunilall et al., 2006).
Two exposure pathways were selected due to the site-specific land uses and the
feature of metals: ingestion of soil and ingestion of home-produced vegetables. The
inhalation and dermal exposure routes were neglected in accordance with other studies
(Granero and Domingo, 2002; Hough et al., 2004; Nadal et al., 2004; Grasmück and
Scholz, 2005; Hellström et al., 2007).
The bodyweight of women was significantly higher than the average bodyweight
of Hungarian women (67.21 kg), but the bodyweight of men was nearly the same (80.84
kg) (Melles, 2004). Location-specific human data were also necessary to calculate
actual human exposure through ingestion of vegetables (Albering et al., 1999). The
yearly consumptions of vegetables are generally lower than Santos et al. found in Rio de
Janeiro (5.4 kg tomato, 4.1 kg onion and 3.7 kg carrot) (Santos et al., 2004) or that is
given in the US EPA Exposure Factor Handbook (12.57 kg tomato, 5.1 kg bean, 4.42 kg
carrot, 2.7 kg onion) (US EPA, 1997), because home gardening partly covers the
vegetable requirements of families. The daily consumption of home produced
vegetables was 173.3 g day-1, which is higher than found in Bangladesh (130 g day-1)
(Alam et al., 2003) or in China (105 g day-1) (Liu et al., 2005).
57

The distribution of risk due to different exposure routes is similar to that found
by Hough et al. in the United Kingdom (Hough et al., 2004). The elevated arsenic level
of soil indicates the importance of soil ingestion pathway, especially for children
(Rieuwerts et al., 2006). In order to reduce the uncertainty in estimating the risk
associated with incidental ingestion of soil, further testing is necessary because the in
vivo arsenic availability can vary widely (Juhasz et al., 2007). Our results, as do other
studies (Hellström et al., 2007; Huang et al., 2007), also emphasize that the
consumption of locally grown vegetables is an important exposure pathway in metal
contaminated sites. Despite the high concentration levels in soil, the summarized hazard
index was low in flooded vegetable gardens. Another study in Germany has similar
suggestion (Wilhelm et al., 2005).
The result of risk assessment with default data was higher than with site-specific
data. Our results approved the theory, that default risk assessment usually overestimate
the real hazard and the necessity, that the risk assessment methods should be improved
(Wentsel et al., 2002).
In our study the risk assessment was determined by special calculation with
ingestion of vegetables and site-specific exposure parameters. Of special note is that the
calculation using the concentration of vegetables could reproduce the real
phytoavailability of metals in contaminated sites. The usage of yield of homegrown
vegetables also refines the calculation because consumption of vegetables with higher
BCF was much lower than with lower BCF. The latest scientific data on
bioaccumulation do not currently support the use of bioconcentration factor (BCF) and
bioaccumulation factor (BAF) values when applied as generic threshold criteria for the
hazard potential of inorganic metals in human and ecological risk assessment.
Risk assessors should be aware that dietary pathways represent a major exposure
route for metals (Choudhury et al., 2001). Estimation of intakes of metals occurring in
food requires information on the levels of metals in food and the amount of food
consumed. Although large-scale surveys of the metal contents of foods and food
consumption patterns have been conducted, assessors should be aware that these
surveys have several limitations for applications to human health risk assessment.
Analysis is often conducted with "market basket" samples of packaged processed foods.
Food consumption surveys are generally limited to short-term consumption (e.g. 1–3
58

days) and do not capture intra-individual variability that would affect long-term
averages. Furthermore, dietary patterns may change over time (e.g. consumption of
ethnic foods in childhood may change later), and, thus, patterns discerned at any given
time may not accurately represent historical or future exposures. The correct estimation
of dietery parameters is the key step in exposure assessment. Hence site-specific
parameters might be applied instead of default parameters. On the other hand there are
data gaps in the exposure factors such as the estimates of home prudeced vegetables and
the consumption of homegrown vegetables (Moya and Phillips, 2002; Finster et al.,
2004).
Many studies on the toxicity of heavy metals have shown that health risks to
humans do not always correlate with the external exposure dose of metals. This is
because virtually all risk estimates ignore the bioavailability component in the
assessment process. The bioavailability is a critical point of exposure assessment
(Caussy, 2003). The future role of exposure assessment will perhaps be marginalized
because biomonitoring programs can directly measure the concentration of chemicals
that are present in biologic matrices (Paustenbach and Galbraith, 2006).
Epidemiology has a special role to play in risk assessment of environmental
exposures. This is because epidemiology is based on direct observations in humans.
Environmental epidemiology studies the effects of environmental exposures on health
and disease in the population (Brunekreef, 2008). In our studied area only one
epidemiological study was carried on in 1988 (Gombkötő, 1988). These results did not
found significant differences between Gyöngyösoroszi and Kisnána (another village in
Heves county without industrial pollution source). The mortality rate was 13.8 in
Gyöngyösoroszi and 17.4 in Kisnána per 1000 inhabitant. The mean blood lead level
among the whole population was the following: 174.8 μg l-1 in Gyöngyösoroszi and
174.0 μg l-1 in Kisnána. Difference was found between the blood lead level among
children. 95 μg l-1 in Gyöngyösoroszi and 46 μg l-1 in Kisnána.
The lifestyle-related factors (smoking and obesity) can modify the risk
assessment process and the effect of environmental agents (Irigaray et al., 2007). In the
studied area the 34.5% of men and 12.9% of women were smokers in 1988 and 35% of
men and 17% of women in 2003. Our questionarrie derived data and the previuos
59

studies (Gombkötő, 1988) in this area also found eleveted bodyweight (78.65 kg for
men and 69.19 kg for women) but compered the data the tendency is increasing.
The disturbances in the interpretations of results in the Gyöngyösoroszi area
suggest new biomarker investigations and epidemiological studies as next chellanges.
60

6. CONCLUSION
In conclusion, the results are supported the followings:
• The toxic metal contents in the Gyöngyösoroszi area exceed the
Hungarian limit value.
• The high arsenic content of the area is due to the natural background
and is not available by vegetables.
• There are significant differences between the flooded and non-flooded
vegetable gardens. Origin of the pollution is the tailing dump and the
flotation plant.
• The mixing of unpolluted soil with tailing material does not model the
floodings.
• The most mobile elements are cadmium and zinc.
• The most accumulating vegetable is sorrel.
• Using the new equation ATBW
ED)n
YC(ADD
VEGVEG
×
××=∑
can combine
the amount of homegrown vegetables and the bioavailabilty of metals.
• Using site-specific parameters instead of default exposure parameters
is more accurate in risk assessment process. The default processes
overestimate the real hazard.
• The consumption of homegrown vegetables does not pose
unacceptable risk to the population although the main exposure route
is consumption of vegetables.
61

7. SUMMARY
The environmental research carried out in the village of Gyöngyösoroszi has
documented increased concentrations of arsenic and heavy metals in the soil of
vegetable gardens. The differences between the metal contents of flooded and non-
flooded vegetable gardens were significant, which confirm that the floods of Toka creek
spread the contamination over the flood-plain of the village. The source of pollution is
the tailing dump and the flotation plant.
The metal contents of vegetables were low and the arsenic content was under the
detection limit in every case. The sorrel cultivated in flooded gardens has the highest
metal content. Significant differences were also found between the flooded and non-
flooded vegetable gardens. The vegetable concentration results further support the view
that soil metals are not always absorbed as well as soluble forms, therefore use of
default bioconcentration factors in assessing human health risk may overestimate the
hazard. In our study, all of the bioconcentration factors were under 0.25 and the mobile
elements were cadmium and zinc. Generally, the bioconcentration factors of non-
flooded vegetable gardens were higher; the sorrel was the most accumulating vegetable.
In the pot experiment the BCFs were higher, but the tendencies were the same.
The most accumulating vegetable was sorrel and the most mobile element was cadmium
and zinc. The arsenic contents were also immeasurable.
Site-specific exposure parameters and a newly created equation for ingestion of
vegetables were applied in risk assessment process. The site-specific exposure factors
were generated from the results of questionnaire survey in the village, while the
equation was based on the cultivation habits of homegrown vegetables.
The outcome of risk assessment has indicated acceptable risk in the village of
Gyöngyösoroszi, both in flooded and non-flooded vegetable gardens. The risk
assessment process with default exposure parameters overestimated the risk. In contrast
with previous study in the area, home gardening does not increase the risk for
inhabitants at present. The most relevant exposure route was ingestion of homegrown
vegetables. It is possible to further reduce the risk of human exposure to soil metal
contamination by selecting leafy vegetables such as sorrel in home gardening.
62

ÖSSZEFOGLALÁS
A toxikus fémek a természetben káros hatásokat és sokszor már
visszafordíthatatlan elváltozásokat okoznak veszélyeztetve ezzel az ott élő emberek
egészségét.
Munkám során a Gyöngyösoroszi ércbánya által okozott toxikus
fémszennyeződés egészségi kockázatát vizsgáltam a falu területén található
kiskertekben. A területen átfolyó Toka-patak által elöntött kiskertek fémtartalma
szignifikánsan különbözött a nem elöntött kiskertekétől, az előbbiek fémtartalma –az
ólom kivételével- meghaladta a szennyezettségi határértéket. A kiskertekben
termesztett zöldségek arzéntartalma minden esetben a kimutatási határ alatt volt. A
számolt biokoncentrációs faktor (BCF) értékek is alacsonyak voltak, a szabadföldi
vizsgálatban a leginkább akkumuláló zöldség a sóska volt, a legmobilisabb fémek a
kadmium és a cink.
A tenyészedényes kísérletben sóska és sárgarépa bioakkumulációját vizsgáltam
egy szennyezetlen és egy meddőanyaggal mesterségesen szennyezett talajon, a
szabadföldi kísérlethez hasonló eredmények születtek. A legmobilisabb fém ebben az
esetben is a kadmium és a cink volt, a legjobban akkumuláló növény a sóska. A
kísérletben számolt BCF értékek azonban sokkal magasabbak voltak a területről
származó mintákból számoltaknál.
Az egészségi kockázat számításánál alapértelmezett illetve helyspecifikus
paraméterekkel végeztem számítást. A helyspecifikus értékeket kérdőívek segítségével
határoztam meg, különös tekintettel a helyben termesztett zöldségek mennyiségére. A
kockázat számítását ennek megfelelően általam módosított képlet segítségével
végeztem. A kapott eredmények alapján a kiskertekben termesztett zöldségek
fogyasztása illetve a talajszemcsék szervezetbe kerülése nem jelent kockázatot a
területen élő populációra. A számítás alapján a legnagyobb veszélyt a talaj
ólomtartalma jelenti, a legkockázatosabb expozíciós út a helyben termesztett zöldségek
elfogyasztása.
A számítások összehasonlításakor egyértelművé vált, hogy az alapértelmezett
paraméterek használata túlértékeli a kockázatot a helyspecifikus paraméterekkel
szemben.
63

8. ACKNOWLEDGEMENTS
This study was carried out at the Department of Agricultural Chemical
Technology of Budapest University of Technology and Economics and the Department
of Labor and Environmental Health of Semmelweis University. I would like to express
my gratitude to all of the employees, who helped my studies.
I am grateful to Katalin Gruiz, M.Sc., Ph.D. for providing the opportunity for
me to deal with human health risk assessment during my academic years and Ph.D.
studies and for her valuable helps and supports. I am also grateful to Erzsébet Tátrai,
M.D., D.Sc. and Károly Cseh, M.D., D.Sc. who facilitate my work in Semmelweis
University.
I owe my cardial thanks to Gabriella Gáspár, M.Sc., Ph.D. for her valuable
advice, scientific and personal help during the pot experiment and publicational
processes. I thank the cooperation of Enikő Rózsa, M.Sc. during all of my works. I
would like to express my special thank to Rita Auerbach, M.Sc. and Ibolya Menczel,
M.Sc. for their valuable technical help. I also thank the unselfish help of Zsuzsanna
Kéki, M.Sc. and Mária Szeremi, M.Sc. for submitting the epidemiological data.
Besides the scientific help I appreciate the supporting of Ildikó Csizmazia, M.D.
and János Banai, M.D., Ph.D. during the last phase of my work.
I would like to thank the remarkable financial support of Pro Progressio
Foundation and NKFP 3/002/2001 Program of Ministry of Education.
This work is most sincerely dedicated to my family, my parents, my
grandmother, my sisters and last, but no at least my husband, because of their devotion,
motivation and patiance. Without their encouragement and loving support I would not
have accomplished my goals.
I am very thankful to my little son, who tolareted his mother "writings".
64

9. REFERENCES
1. Adriano, D.C., 1986. Trace elements in the terrestrial environment. Springer,
New York, NY.
2. Alam, M.G.M., Snow, E.T., Tanaka, A., 2003. Arsenic and heavy metal
contamination of vegetables grown in Samta village, Bangladesh. Sci. Total
Environ. 308, 83-96.
3. Albering, H.J., van Leusen, S.M., Moonen, E., Hoogewerf, J.A., Kleinjans,
J.C.S., 1999. Human health risk assessment: A case study involving heavy metal
soil contamination after the flooding of the River Meuse during the winter of
1993-1994. Environ. Health Perspect. 107, 37-43.
4. Alloway, B.J. (Ed.), 1995. Heavy metals in soils. Chapman and Hall, London.
5. ATSDR, 1999. Toxicological profile for cadmium. US Department of Health
and Human Services, Public Health Service, Agency for Toxic Substances and
Disaese Registry, Atlanta, GA.
6. ATSDR, 2005. Toxicological profile for zinc. US Department of Health and
Human Services, Public Health Service, Agency for Toxic Substances and
Disaese Registry, Atlanta, GA.
7. ATSDR, 2007a. Toxicological profile for arsenic. US Department of Health and
Human Services, Public Health Service, Agency for Toxic Substances and
Disaese Registry, Atlanta, GA.
8. ATSDR, 2007b. Toxicological profile for lead. US Department of Health and
Human Services, Public Health Service, Agency for Toxic Substances and
Disaese Registry, Atlanta, GA.
9. Baker, S., Herrchen, M., Hund-Rinke, K., Klein, W., Kördel, W., Peijnenburg,
W., Rensing, C., 2003. Underlying issues including approaches and information
needs in risk assessment. Ecotox. Environ. Safe. 56, 6-19.
10. Bernard, B.P., Becker, C.E., 1988. Environmental lead exposure and the kidney.
Clin. Toxicol. 26, 1-34.
11. Biswas, B.K., Dhar, R.K., Samanta, G., Mandal, B.K., Chakraborti, D., Faruk,
I., Islam, K.S., Chowdhury, M.M., Islam, A., Roy, S., 1998. Detailed study
65

report of Samta, one of the arsenic-affected villages of Jessore District,
Bangladesh. Curr. Sci. 74, 134–145.
12. Bockting, G.J.M., van den Berg, R., 1992. The accumulation of trace metals in
crops grown on contaminated soils. National Institute of Public Health and the
Environment, Bilthoven.
13. Bridges, J., 2003. Human health and environmental risk assessment: the need for
a more harmonised and integrated approach. Chemosphere 52, 1347-1351.
14. Brunekreef, B., 2008. Environmental epidemiology and risk assessment. Tox.
Lett. doi:10.1016/j.toxlet.2008.05.012.
15. Buchet, J.P., Lauwerys, R., Roels, H., 1990. Renal effects of cadmium body
burden of the general population. Lancet 336, 699-702.
16. Calderón, J., Ortiz-Pérez, D., Yánez, L., Diaz-barriga, F., 2003. Human
exposure to metals. Pathways of exposure, biomarkers of effect, and host
factors. Ecotox. Environ. Safe. 56, 93-103.
17. Caussy, D., 2003. Case studies of the impact of understanding bioavailability:
arsenic. Ecotox. Environ. Safe. 56, 164-173.
18. Chaney, R.L., 1980. Health risks associated with toxic metals in municipal
sludge. In: Bitton, G., Damron, B.L., Edds, G.T., Davidson, J.M. (Eds.), Sludge–
health risks of land application. Ann Arbor Science Publishers, Ann Arbor, MI.
19. Chen, C.J., Kuo, T.L., Wu, M.M., 1988. Arsenic and cancers. Lancet, 1, 414–
415.
20. Chen, S.L., Dzeng, S.R., Yang, M.H., Chiu, K.H., Shieh, G.M., Wai, C.M.,
1994. Arsenic species in groundwaters of the blackfoot disease area, Taiwan.
Environ Sci Technol. 28, 877−881.
21. Choudhury, H., Harvey, T., Thayer, W.C., Lockwood, T.F., Stiteler, W.M.,
Goodrum, P.E., Hassett, J.M., Diamond, G.L., 2001. Urinary cadmium
elimination as a biomarker of exposure for evaluating a cadmium dietary
exposure-biokinetics model. J. Toxicol. Environ. Health 63, 101–130.
22. Chunilall, V., Kindness, A., Jonnalagadda, S.B., 2006. Impact of coal mine
dump contaminated soils on elemental uptake by Spinacia oleracea (spinach). J.
Environ. Sci. Health B 41, 297-307.
66

23. Cirone, P.A., Duncan, P.B., 2000. Integrating human health and ecological
concerns in risk assessments. J. Hazard Mater. 78, 1-17.
24. Cui, Y.J., Zhu, Y.G., Zhai, R.H., Chen, D.Y., Huang, Y.Z., Qui, Y., Liang, J.Z.,
2004. Transfer of metals from soil to vegetables in an area near a smelter in
Nanning, China. Env. Int. 30, 785-791.
25. Cullen, N.M., Wolf, L.R., St Clair, D., 1995. Pediatric arsenic ingestion. Am. J.
Emerg. Med. 13, 432-435.
26. Davis, J.M., Svendsgaard, D.J., 1987. Lead and child development. Nature 329,
297-300.
27. DEFRA, 2002a. Contaminants in soil: Collation of toxicological data and intake
values for humans. Arsenic. Environment Agency, Bristol.
28. DEFRA, 2002b. Contaminants in soil: Collation of toxicological data and intake
values for humans. Cadmium. Environment Agency, Bristol.
29. DEFRA, 2002c. Contaminants in soil: Collation of toxicological data and intake
values for humans. Lead. Environment Agency, Bristol.
30. Dhar, R.K., Biswas, B.K., Samanta, G., Mandal, B.K., Chakraborti, D., Roy, S.,
Fafar, A., Islam, A., Ara, G., Kabir, S., Khan, A.W., Ahmed, S.A., Hadi, S.A.,
1997. Groundwater arsenic calamity in Bangladesh. Curr. Sci. 73, 48–59.
31. Dudka, S., Piotrowska, M., Terelak, H., 1996. Transfer of cadmium, lead, and
zinc from industrially contaminated ssoil to crop plants: a field study. Environ.
Poll. 94, 181-188.
32. Emmerson, B.T., 1970. "Ouch-Ouch" disease: the osteomalacia of cadmium
nephropathy. Ann. Int. Med. 73, 854-855.
33. Enterline, P.E., Day, R., Marsh, G.M., 1995. Cancers related to exposure to
arsenic at a copper smelter. Occup. Environ. Med. 52, 28-32.
34. Fairbrother, A., Randall, W., Sappington, K., Wood, W., 2007. Framework for
metals risk assessment. Ecotox. Environ. Saf. 68,145-227.
35. Finster, M.E., Gray, A.K., Binns, H.J., 2004. Lead levels of edibles grown in
contaminated residential soils: a field survey. Sci. Total Environ. 320, 245-257.
36. Friberg, L., Elinder, C.G., Kjellstrom, T., Nordberg, G.F. (Eds.), 1985.
Cadmium and health: A toxicological and epidemiological appraisal. CRC Press,
Boca Raton, FL.
67

37. Fügedi, U., 2004. Geochemical background and heavy metal pollution near
Gyöngyösoroszi (NE Hungary). Bull. Hung. Geol. Soc. 134, 291-301.
38. Gay, J.R., Korre, A., 2006. A spatially-evaluated methodology for assessimg
risk to a population from contaminated land. Environ. Poll. 142, 227-234.
39. Gerr, F., Letz, R., Ryan, P.B., Green, R.C., 2000. Neurological effects of
environmental exposure to arsenic in dust and soil among humans.
Neurotoxicology 21, 475-487.
40. Goering, P.L., 1993. Lead-protein interactions as a basis for lead toxicity.
Neurotoxicology 14, 45-60.
41. Gombkötő, Gy. (Ed.), 1988. Gyöngyösoroszi HAF üzem környezetvizsgálati
eredményei. Heves Megyei ÁNTSZ, Eger.
42. Goyer, R.A., 1993. Lead toxicity: Current concerns. Environ. Health Perspect.
100, 177-187.
43. Granero, S., Domingo, J.L., 2002. Levels of metals in soils of Alcalá de
Henares, Spain: Human health risk. Environ. Int. 28, 159-164.
44. Grasmück, D., Sholz, R.W., 2005. Risk perception of heavy metal soil
contamination by high-exposed and low-exposed inhabitants: The role of
knowledge and emotional concerns. Risk. Anal. 25, 611-622.
45. Grimalt, J.O., Ferrer, M., Macpherson, E., 1999. The mine tailing accident in
Aznacollar. Sci. Total Environ. 242, 3-11.
46. Hellström, L., Persson, B., Brudin, L., Petersson Grawé, K., Öborn, I., Järup, L.,
2007. Cadmium exposure pathways in a population living near a battery plant.
Sci. Total Environ. 373, 447-455.
47. Hertz-Picciotto, I., Croft, J., 1993. Review of the relation between blood lead
and blood pressure. Epidemiol. Rev. 15, 352-373.
48. Hewitt, P.J., 1988. Accumulation of metals in the tissues of occupationally
exposed workers. Environ. Geochem. Health 10, 113-116.
49. Holmqvist, I., 1951. Occupational arsenical dermatitis: A study among
employees at a copper ore smelting work including investigations of skin
reactions to contact with arsenic compounds. Acta Derm. Venerol. 31, 1-204.
50. Horváth, B., Gruiz, K., 1996. Impact of metalliferous ore mining activity on the
environment in Gyongyosoroszi, Hungary. Sci. Total Environ. 184, 215-227.
68

51. Hough, R.L., Breward, N., Young, S.D., Crout, N.M., Tye, A.M., Moir, A.M.,
Thornton, I., 2004. Assessing potential risk of heavy metal exposure from
consumption of home-produced vegetables by urban populations. Environ.
Health Perspect. 112, 215-221.
52. Huang, S.S., Liao, Q.L., Hua, M., Wu, X.M., Bi, K.S., Yan, C.Y., Chen, B.,
Zhang, X.Y., 2007. Survey of heavy metal pollution and assessment of
agricultural soil in Yangzhong district, Jiangsu Province, China. Chemosphere
67, 2148-2155.
53. Hughes, S., Samman, S., 2006. The effect of zinc supplementation in humans on
plasma lipids, antioxidant status and thrombogenesis. J. Am. Coll. Nutr. 25, 285-
291.
54. Hungarian Standard Institution, 1981. MSZ 21470-2. Environmental protection.
Preparation of soil sample. Determination of electrical conduction, humidity and
pH. Hungarian Standard Institution, Budapest.
55. Hungarian Standard Institution, 1998. MSZ 21470-1. Environmental protection.
Testing of soils. Sampling. Hungarian Standard Institution, Budapest.
56. Institute of Medicine, 2001. Dietary reference intakes for vitamin A, vitamin K,
arsenic, boron, silicon, vanadium, and zinc. National Academy Press,
Washington, DC.
57. Irigaray, P., Newby, J.A., Clapp, R., Hardell, L., Howard, V., Montagnier, L.,
Epstein, S., Belpomme, D., 2007. Lifestyle-related factors and environmental
agents causing cancer: An overview. Biomed. Pharmacother. 61, 640-658.
58. Jarup, L., Berglund, M., Elinder, C.G., Nordberg, G., Vahter, M., 1998. Health
effects of cadmium exposure – a review of the literature and a risk estimate.
Scand. J. Work. Environ. Health 24, 1-51.
59. Jarup, L., 2004. Health and environment information systems for exposure and
disease mapping, and risk assessment. Environ. Health Perspect. 112, 995-997.
60. JECFA, 1993. Evaluation of certain food additives and contaminants: 41st report
of the Joint FAO/WHO expert committee on food additives. World Health
Organization, Geneva.
61. Jensen, A., Bro-Rasmussen, R., 1992. Environmental cadmium in Europe. Rev.
Environ. Contam. Toxicol. 125, 101-181.
69

62. Juhasz, A.L., Smith, E., Weber, J., Rees, M., Rofe, A., Kuchel, T., Sansom, L.,
Naidu, R., 2007. Comparison of in vivo and in vitro methodologies for the
assessment of arsenic bioavailability in contaminated soils. Chemosphere 69,
961-966.
63. Jung, M.C., 2001. Heavy metal contamination of soils and waters in and around
the Imcheon Au-Ag mine, Korea. Appl. Geochem. 16, 1369-1375.
64. Kabata-Pendias, A., Pendias, H., 1984. Trace elements in soils and plants. CRC
Press, Boca Raton, FL.
65. Kakkar, P., Jaffery, F.N., 2005. Biological markers for metal toxictiy. Environ.
Toxicol. Phar. 19, 335-349.
66. Kim, J., Kim, K., Ahn, J.S., Ko, I., Lee, C., 2005. Investigation and risk
assessment modeling of As and heavy metals contamination around five
abandoned metal mines in Korea. Environ. Geochem. Hlth. 27, 193-203.
67. Kopp, S.J., Glonek, T., Perry, H.M., Erlanger, M., Perry, E.F., 1982.
Cardiovascular actions of cadmium at environmental exposure levels. Science
217, 837-839.
68. Kovács, E., Dubbin, W.E., Tamás, J., 2006. Influence of hydrology on heavy
metal speciation and mobility in a Pb-Zn mine tailing. Environ. Pollut. 141, 310-
320.
69. Krishnamurti, G.S.R., McArthur, D.F.E., Wang, M.K., Kozak, L.M., Huang,
P.M., 2005. Biogeochemistry of soil cadmium and the impact on terrestrial food
chain contamination In: Biogeochemistry of Trace Elements in the Rhizosphere,
Elsevier, Amsterdam.
70. Kwong, W.T., Friello, P., Semba, R.D., 2004. Interactions between iron
deficiency and lead poisoning: Epidemiology and pathogenesis. Sci. Total
Environ. 330, 21-37.
71. Lacatusu, R., Rauta, C., Carstea, S., Ghelase, I., 1996. Soil-plant-man
relationship in heavy metal polluted areas in Romania. Appl. Geochem. 11, 105-
107.
72. LeCoultre, T.D., 2001. A meta-analysis and risk assessment of heavy metal
uptake in common garden vegetables, MSc Thesis, East Tennessee State
University, Johnson City, TN.
70

73. Leduc, D., Francquen, P., Jacobovitz, D., Vandeweyer, R., Lauwerys, R., De
Vuyst, P., 1993. Association of cadmium exposure with rapidly progressive
emphysema in a smoker. Thorax 48, 570-571.
74. Lee, C.G., Chon, H.T., Jung, M.C., 2001. Heavy metal contamination in the
vicinity of the Daduk Au-Ag-Pb-Zn mine in Korea. Appl. Geochem. 16, 1377-
1386.
75. Lee, J.S., Chon, H.T., 2003. Exposure assessment of heavy metals on abandoned
metal mine areas by ingestion of soil, crop plant and groundwater. J. Phys. IV.
107, 757-760.
76. Lee, J., Chon, H., Kim, K., 2005. Human risk assessment of As, Cd, Cu and Zn
in the abandoned metal mine site. Environ. Geochem. Hlth. 27, 185-191.
77. Lester, R.R., Green, L.C., Linkov I., 2007. Site.specific applications on
Probabilistic Health Risk Assessment: Review of the literature since 2000. Risk
Anal. 27, 635-658.
78. Lindahl, M., Leanderson, P., Tagesson, C., 1998. Novel aspect on metal fume
fever: zinc stimulates oxygen radical formation in human neutrophils. Hum.
Exp. Toxicol. 17, 105-110.
79. Little, R.E., Kay,. G.N., Cavender, J.B., 1990. Torsade de pointes and T-U wave
alternans associated with arsenic poisoning. PACE 13, 164-170.
80. Liu, H., Probst, A., Liao, B., 2005. Metal contamination of soils and crops
affected by the Chenzhou lead/zinc mine spill (Hunan, China). Sci. Total
Environ. 339, 153-166.
81. Mahimairaja, S., Bolan, N.S., Adriano, D.C., Robinson, B., 2005. Arsenic
contamination and its risk management in complex environmental settings. Adv.
Agron. 86, 1-82.
82. Malo, J.L., Malo, J., Cartier, A., Dolovichm, J., 1990. Acute lung reaction due to
zinc inhalation. Eur. Respir. J. 3, 111-114.
83. Mandal, B.K., Chowdhury, T.R., Samanta, G., Basu, G.K., Chowdhury, P.P.,
Chanda, C.R., Lodh, D., Karan, N.K., Dhar, R.K., Tamili, D.K., Das, D., Saha,
K.C., Chakraborti, D., 1996. Arsenic in groundwater in seven districts of West
Bengal, India – The biggest arsenic calamity in the world. Curr. Sci. 70, 976–
986.
71

84. Manta, D.S., Angelone, M., Bellanca, A., Neri, R., Sprovieri, M., 2002. Heavy
metals in urban soils: a case study from the city of Palermo (Sicily), Italy. Sci.
Total Environ. 300, 229-243.
85. Máthé-Gáspár, G., Anton, A., 2005. Phytoremediation study: Factors
influencing heavy metal uptake of plants. Acta Biol. Szeg. 49, 69-70.
86. Mattina, M.I., Lannucci-Berger, W., Musante, C., White, J.C., 2003. Concurrent
plant uptake of heavy metals and persistent organic pollutants from soil. Env.
Poll. 124, 375-378.
87. McBride, M.B., 2003. Toxic metals in sewage sludge-amended soils: has
promotion of beneficial use discounted risks? Adv. Environ. Res. 8, 5-19.
88. Melles, M. (Ed.), 2004. National Health Interview Survey 2003. Johan Béla
National Center for Epidemiology, Budapest.
89. Milton, A.H., Rahman, M., 2002. Respiratory effects and arsenic contaminated
well water in Bangladesh. Int. J. Environ. Health Res. 12, 175-179.
90. Moore, M.M., Harrington-Brock, K., Doerr, C.L., 1994. Genotoxicity of arsenic
and its methylated metabolites. Environ. Geochem. Health 16, 191-198.
91. Morra, P., Bagli, S., Spadoni, G., 2006. The analysis of human health risk with a
detailed procedure operating in a GIS environment. Environ. Int. 32, 444-454.
92. Moya, J., Phillips, L., 2002. Overview of the use of the U.S. EPA exposure
factors handbook. Int. J. Hyg. Environ. Health 205, 155-159.
93. Mueller, T.G., Pusuluri, N.B., Mathias, K.K., Cornelius, P.L., Barnhisel, R.I.,
Shearer, S.A., 2004. Map quality for ordinary kriging and inverse distance
weighted interpolation. Soil Sci. Soc. Am. J. 68, 2042-2047.
94. Mumford, J.L., Wu, K., Xia, Y., Kwok, R., Yang, Z., Foster, J., Sanders, W.E.,
2007. Chronic arsenic exposure and cardiac repolarization abnormalities with
QT interval prolongation in a population-based study. Environ. Health Perspect.
115, 690-694.
95. Nadal, M., Schuhmacher, M., Domingo, J.L., 2004. Metal pollution of soils and
vegetation in an area with petrochemical industry. Sci. Total Environ. 321, 59-
69.
96. Nagy, G., 1986. A középső és a nyugat-Mátra ércelőkutatása. Magyar Állami
Földtani Intézet, Budapest.
72

97. National Research Council, 1983. Risk assessment in the Federal Government:
Managing the Process. National Academy Press, Washington, DC.
98. Nieuwenhuijsen, M., Paustenbach, D., Duarte-Davidson, R., 2006. New
developments in exposure assessment: The impact on the practice of health risk
assessment and epidemiological studies. Environ. Int. 32, 996-1009.
99. Ódor, L., Wanty, R.B., Horváth, I., Fügedi, U., 1998. Mobilization and
attenuation of metals downstream from a base-metal mining site in the Mátra
Mountains, northeastern Hungary. J. Geochem. Explor. 65, 47–60.
100. Paustenbach, D.J. (Ed.), 2002. Human and ecological risk assessment: Theory
and practice. John Wiley and Sons, New York, NY.
101. Paustenbach, D., Galbraith, D., 2006. Biomonitoring and biomarkers: Exposure
assessment will never be the same. Environ. Health Perspect. 114, 1143-1149.
102. Queirolo, F., Stegen, S., Restovic, M., Paz, M., Ostapczuk, P., Schwuger, M.J.,
Muñoz, L., 2000. Total arsenic, lead and cadmium levels in vegetables
cultivated at the Andean villages of northern Chile. Sci. Total Environ. 255, 75-
84.
103. Rapant, E., Dietzová, Z., Cicmonová, S., 2006. Environmental and health risk
assessment in abandoned mining area, Zlata Idka, Slovakia. Environ. Geol. 51,
387-397.
104. Rieuwerts, J.S., Searle, P., Buck, R., 2006. Bioaccessible arsenic in the home
environment in southwest England. Sci. Total Environ. 371, 89-98.
105. Ruby, M.V., Schoff, R., Brattin, W., Goldade, M., Post, G., Harnois, M., Mosby,
D.E., Casteel, S.W., Berti, W., Carpenter, M., Edwards, D., Cragin, D., Chappel,
W., 1999. Advances in evaluating the oral bioavailability of inorganics in soil
for use in human health risk assessment. Environ. Sci. Technol. 33, 3697-3705.
106. Sakai, T., 2000. Biomarkers of lead exposure. Ind. Health 38, 127-142.
107. Santos, E.E., Lauria, D.C., Port oda Silveira, C.L., 2004. Assessment of daily
intake of trace elements due to the consumption of foodstuffs by adult
inhabitants of Rio de Janeiro city. Sci. Total Environ. 327, 69-79.
108. Schwartz, J., 1994. Low-level lead exposure and children's IQ: A meta-analysis
and search for a threshold. Environ. Res. 65, 42-55.
73

109. Shipman, D.L., 1986. Cadmium food poisoning in a Missouri school. J. Environ.
Health 49, 89.
110. Simon, L., 2005. Stabilization of metals in acidic mine spoil with amendments
and red fescue (Festuca rubra L.) growth. Environ. Geochem. Hlth. 27, 289-
300.
111. Sorahan, T., Lancashire, R.J., 1997. Lung cancer mortality in a cohort of
workers employed at a cadmium recovery plant in the united states: an analysis
with detailed job histories. Occup. Environ. Med. 54, 194-201.
112. Staessen, J., Lauwerys, R., 1993. Health effects of environmental exposure to
cadmium in a population study. J. Hum. Hypertens. 7, 195-199.
113. Staessen, J.A., Roels, H.A., Emelianov, D., Kuznetsova, T., Thijs, L.,
Vangronsveld, J., Fagard, R., 1999. Environmental exposure to cadmium,
forearm bone density, and risk of fractures: prospective population study. Lancet
353, 1140-1144.
114. Ullrich, S.M., Ramsey, M.H., Helios-Rybicka, E., 1999. Total and exchangeable
concentrations of heavy metals in soils near Bytom, an area of Pb/Zn mining and
smelting in Upper Silesia, Poland. Appl. Geochem. 14, 187-197.
115. US EPA, 1992. Guideline for exposure assessment. Environmental Protection
Agency, Office of Research and Development, Washington DC.
116. US EPA, 1994. Method 6020. Inductively Coupled Plasma – Mass
Spectrometry. Environmental Protection Agency, Office of Solid Waste and
Emergency Response, Washington DC.
117. US EPA, 1997. Exposure Factors Handbook. Environmental Protection Agency,
Office of Research and Development, Washington DC.
118. US EPA, 2003. Multimedia, Multipathway, and Multireceptor Risk Assessment
(3MRA) Modeling System. Environmental Protection Agency, Office of
Research and Development, Washington DC.
119. US EPA, 2006. Integrated Risk Information System (IRIS). Available from:
www.epa.gov/iris.
120. Vető, É., 1988. Conditions of Pb-Zn ore formation in the Carpathian Neogene
volcanic arc: evidence from Gyöngyösoroszi mine, N-Hungary. In: Proceedings
74

of the seventh quadrennial IAGOD symposium. Schweitzerbart’sche
Verlagsbuchandlung, Stuttgart.
121. Voet, D., Voet J.G., Pratt, C.W., 1999. Fundamentals of Biochemistry. John
Wiley and Sons, New York, NY.
122. Waalkes, M.P., Goering, P.L., 1990. Metallothionein and other cadmium-
binding proteins: Recent developments. Chem. Res. Toxicol. 3, 28l-288.
123. Wang, G., Su, M., Chen, Y., Kin, F., Luo, D., Gao, S., 2006. Transfer
characteristics of cadmium and lead from soil to the edible parts of six vegetable
species in southeastern China. Environ. Poll. 144, 127-135.
124. Wang, X., Shan, X., Zhang, S., Wen, B., 2004. A model for evaluation of the
phytoavailability of trace elements to vegetables under the field conditions.
Chemosphere 55, 811-822.
125. Wcislo, E., Ioven, D., Kucharski, R., Szdzuj, J., 2002. Human health risk
assessment case study: an abandoned metal smelter site in Poland. Chemosphere
47, 507-515.
126. Wentsel, R.S., Blaney, B., Kowalski, L., Bennet, D.A., Grevatt, P., Frey, S.,
2002. Future directions for EPA Superfund research. Int. J. Hyg. Environ.
Health 205, 161-163.
127. Wilhelm, M., Wittsiepe, J., Schrey, P., Hilbig, A., Kersting, M., 2005.
Consumption of homegrown products does not increase diatery intake of
arsenic, cadmium, lead, and mercury by young children living in an
industrialized area of Germany. Sci. Total Environ. 343, 61-70.
128. WHO, 1989. Environmental Health Criteria 85. Lead. Environmental Aspects,
WHO, Geneva.
129. WHO, 1992a. Environmental Health Criteria 134. Cadmium, WHO, Geneva.
130. WHO, 1992b. Environmental Health Criteria 135. Cadmium. Environmental
Aspects, WHO, Geneva.
131. WHO, 1995. Environmental Health Criteria 165. Inorganic Lead, WHO,
Geneva.
132. WHO, 1999. Environmental Health Criteria 210. Principles for the Assessment
of Risks to Human Health from Exposure to Chemicals. WHO, Geneva.
75

133. WHO, 2000. Environmental Health Criteria 214. Human Exposure Assessment.
WHO, Geneva.
134. WHO, 2001a. Environmental Health Criteria 221. Zinc, WHO, Geneva.
135. WHO, 2001b. Environmental Health Criteria 224. Arsenic and Arsenic
Compounds, WHO, Geneva.
136. Zheng, N., Wang, Q., Zheng, D., 2007a. Health risk of Hg, Pb, Cd, Zn, and Cu
to the inhabitants around Huludao Zinc Plant in China via consumption of
vegetables. Sci. Total Environ. 383, 81-89.
137. Zheng, N., Wang, Q., Zhang, X., Zheng, D., Zhang, Z., Zhang, S., 2007b.
Population health risks due to dietary intake of heavy metals in the industrial
area of Huludao city, China. Sci. Total Environ. 387, 96-104.
76

10. APPENDIX
Azonosító:……………………… Kitöltés ideje:…………………...
KÉRDŐÍV Nem: férfi nő
Életkor: .….... év
Testsúly: ……. kg
Dohányzás: igen nem ha igen, mennyit? …………
Alkohol: naponta alkalmanként nem
Foglalkozása: irodai dolgozó háztartásbeli ipari dolgozó nyugdíjas mezőgazdasági munkás rokkant nyugdíjas tanuló munkanélküli egyéb:…………………….
Kisegítő iskolába jár(t)-e? igen nem
Legmagasabb iskolai végzettsége: 4 általános gimnázium 6 általános szakiskola 8 általános főiskola, egyetem
77

Dolgozott-e a bányában vagy az ércelőkészítőben? bánya ércelőkészítő nem ha igen, hány évet? ………év
Mióta él a faluban? ……………… éve
Mennyi időt tartózkodik a faluban? egész nap dolgozni máshova jár
Járt-e rendszeresen a meddőhányóhoz vagy a meddő kupacokhoz? igen nem ha igen, hányszor? ………….
Lakótelek szomszédos a Toka-patakkal? igen nem ha nem, a pataktól kb. hány méterre van? ………. m
Van-e egyéb földje, ahol mezőgazdasági tevékenységet folytat? igen nem ha igen, hol?…………………
1996-ban az áradáskor a patak elárasztotta a földet? igen nem ha igen, melyiket?…………………
Fúrt vagy ásott kút van-e a telken? igen nem ha igen, hol?…………………
ha igen, használja-e ivásra, főzésre öntözésre tisztálkodásra
Hányan élnek a családban? felnőtt: 1. .……év gyerek: 1. ……. felnőtt: 2. .……év gyerek: 2. …….
felnőtt: 3. .……év gyerek: 3. ……. felnőtt: 4. .……év gyerek: 4. ……. felnőtt: 5. .……év gyerek: 5. …….
Termesztett növények:
Mennyit termeszt belőle évente a ház körül? egyéb termőföldön? paradicsom ………… kg ………… kg paprika ………… kg ………… kg sóska, spenót ………… kg ………… kg káposzta, kelkáposzta ………… kg ………… kg sárgarépa, petrezselyem ………… kg ………… kg bab, borsó ………… kg ………… kg hagyma ………… kg ………… kg szőlő ………… kg ………… kg málna ………… kg ………… kg egyéb: ……………………. ………… kg ………… kg egyéb: ……………………. ………… kg ………… kg egyéb: ……………………. ………… kg ………… kg
A termesztett növényeket ki fogyasztja? családban felnőtt családban gyerek értékesíti , ha igen, hanyad részét? …………
Milyen szabadidős tevékenységet folytat? ásványgyűjtés horgászat úszás a közeli tavakban vadászat motorozás bogyógyűjtés
78

Milyen orvoshoz jár? körzeti (házi) hova?…………….… üzemi hova?…………….… szakrendelő (SZTK) hova?…………….… kórház hova?…………….…
Rendszeresen jelenleg jár-e gyógykezelésre? igen nem ha igen, hova és miért? …………………
Feküdt-e már kórházban? (gyermekszülés kivételével) igen nem ha igen, miért és mikor?…………………..
………………………………….. …………………………………..
Az alábbi megbetegedésekben szenved-e Ön illetve családtagja? Ha tudja, kérjük írja le a pontos megbetegedést!
Ön Mióta? családtagja magasvérnyomás ……... cukorbetegség ……… csont és ízületi problémák ……… vesebetegségek ……… májbetegségek ……… tüdőbetegségek ……… vérképző szervi megbetegedések ……… idegrendszeri problémák ……… daganatos megbetegedések ……… ha igen, milyen ………………
Pontos megbetegedések, diagnózisok: ……………………………………………………………………………………………………………………………………………………………………………………………………………………………………………………………………………………………………………………………………………………………………………………………………………………………………………………………………………………………………………………………………………………………………………………………………………………………………………………………………………………………………………………………………………………………………………………………………………………………………………………………………………………………………………………………………………………………………………………………………………………………………………………………………………………………………………………………………………………………………………………………………………………………………………………………………………....
79

11. PUBLICATIONS
1. Sipter, E., Rózsa, E., Gruiz, K., Tátrai, E., Morvai, V., 2008. Site-specific
risk asseessment in contaminated vegetable gardens. Chemosphere 71, 1301-
1307.
IF: 2.442
2. Sipter, E., Auerbach, R., Gruiz, K., Máthé-Gáspár, G., 2008. Change of
bioaccumulation of toxic metals in vegetable. Commun. Soil Sci. Plan.
Accepted article.
IF: 0.302
3. Máthé-Gáspár, G., Sipter, E., Szili-Kovács, T., Takács, T., Máthé, P., Anton,
A., 2008. Environmental impact of soil pollution with toxic element from the
lead and zinc mine at Gyöngyösoroszi (Hungary).Commun. Soil Sci. Plan.
Accepted article.
IF: 0.302
4. Máthé, P., Máthé-Gáspár, G., Szili-Kovács, T., Sipter, E., Anton, A., 2007.
Changes in the parts of the rhizosphere phosphorus cycle influencing by
heavy metal contamination. Cereal Res. Commun. 35, 761-764.
IF: 1.037
80