HUMAN DEVELOPMENT REPORTBIRBHUM …wbplan.gov.in/htm/HumanDev/docs/DHDR_Birbhum/CHP-4.pdf4 75 HUMAN...
30
4 75 BIRBHUM HUMAN DEVELOPMENT REPORT Chapter IV : Economic opportunities and security of livelihood 4.1 Structure of district income Per capita district income in Birbhum has been lower than that of West Bengal for long. This is what one would expect given the limited range of modern sector activities in the district in comparison with several other districts and of course with Kolkata. But what is of particular interest is that how it has been growing vis-à-vis the state as a whole in the recent period. Figure 4.1 shows that between 1997-98 and 2003-04 per capita income in the state has grown faster than that of the district, and as a result the gap between the two has widened in the recent years. While the compound growth rate in per capita income in the district is 4.3 per cent per year, it is 5.4 per cent per year for West Bengal as a whole in the reference period mentioned above. Source: Statistical Abstract, GoWB; P stands for ‘Provisional’ As mentioned earlier, Birbhum is predominantly an agricultural district. Table 4.1 shows that the share of primary production in net district domestic product is 38.51 per cent in 2003-04 (provisional), which is much higher than the corresponding figure for West Bengal. Although this share has been declining in both Birbhum and West Bengal, it is not matched by a corresponding increase
Transcript of HUMAN DEVELOPMENT REPORTBIRBHUM …wbplan.gov.in/htm/HumanDev/docs/DHDR_Birbhum/CHP-4.pdf4 75 HUMAN...

4
75
BIRBHUMHUMAN DEVELOPMENT REPORT
Chapter IV : Economic opportunities and security of livelihood
4.1 Structure of district income
Per capita district income in Birbhum has been lower than that of West Bengal for long. This
is what one would expect given the limited range of modern sector activities in the district in comparison
with several other districts and of course with Kolkata. But what is of particular interest is that how
it has been growing vis-à-vis the state as a whole in the recent period. Figure 4.1 shows that between
1997-98 and 2003-04 per capita income in the state has grown faster than that of the district, and
as a result the gap between the two has widened in the recent years. While the compound growth
rate in per capita income in the district is 4.3 per cent per year, it is 5.4 per cent per year for West
Bengal as a whole in the reference period mentioned above.
Source: Statistical Abstract, GoWB; P stands for ‘Provisional’
As mentioned earlier, Birbhum is predominantly an agricultural district. Table 4.1 shows that
the share of primary production in net district domestic product is 38.51 per cent in 2003-04
(provisional), which is much higher than the corresponding figure for West Bengal. Although this share
has been declining in both Birbhum and West Bengal, it is not matched by a corresponding increase

4
76
BIRBHUM HUMAN DEVELOPMENT REPORT
in the share of the secondary sector. It is the tertiary sector that has been growing fast all over West
Bengal so that its share in total district or state income has been steadily increasing. In the case of
Birbhum, roughly one-half of the district income can currently be attributed to the tertiary sector.
Table 4.1 Sectoral shares (%) in Net District Domestic Product of Birbhum and Net StateDomestic Product of West Bengal at constant prices
Birbhum WBYear Primary Secondary Tertiary Primary Secondary Tertiary1999-00 45.08 10.86 44.06 29.75 21.29 48.962000-01 40.87 12.07 47.06 28.73 20.51 50.762001-02 43.75 11.51 44.74 29.62 20.00 50.382002-03 40.41 11.11 48.48 26.44 19.65 53.912003-04(P) 38.51 10.93 50.56 25.61 19.03 55.36
Source: Statistical Abstract 2005, GoWB
Given the low share of the secondary sector in district income, which means the production
base for manufacturing is rather thin, it is more difficult for Birbhum to make a steady expansion
of the secondary sector. This is for the economic logic of positive externality that feeds into the process
of industrialization. The fact that there are very few industries in Birbhum feeds into the perceived
notion that there must be district-specific factors less favourable to investment. This might have made
it more difficult to attract investors to the district.

4
77
BIRBHUMHUMAN DEVELOPMENT REPORT
4.2 Structure of employment
According to Census 2001, the share of workers in total population was 37.4 per cent in Birbhum,
which was marginally higher than the state average of 36.8 per cent. Between the two census years
(viz.1991 and 2001) the district had experienced 4 percentage point increase in work participation
rate (from 33.2 per cent to 37.4 per cent). Like in other districts, in Birbhum too the work participation
rate is higher for males compared to females. While the share of male workers in total male population
was 54 per cent, that of female workers was only 20 per cent in 2001. However, the female work
participation rate increased from 13 per cent in 1991 to 20 per cent in 2001 (Table 4.2)1 . The overall
increase in work participation is also reflected in the falling dependency ratio (expressed as a ratio
of non-working population to working population) between the two latest census years. In Birbhum
the dependency ratio came down from 2 in 1991 to 1.7 in 2001.
Table 4.2 Work participation rates in Birbhum and West Bengal
Percentage of 1991 2001
workers in total Person Male Female Person Male Female
population
Birbhum Main + Marginal 33.2 52.2 12.8 37.4 54.3 19.7
Main 30.4 51.6 8.1 27.6 46.1 8.1
West Bengal Main + Marginal 32.2 51.4 11.3 36.8 54.0 18.3
Main 30.2 50.7 8.0 28.7 47.0 9.1
Source: Census 1991, 2001.
However, it is important to note that in Birbhum, increasing overall work participation has
been associated with an increasing share of marginal workers in total work force. By census definition
marginal workers are those who do not work for major part of the year, which could either be due
to lack of opportunity or other reasons. Between the last two censuses the decadal growth in the
number of main workers in the district was 7 per cent, whereas in the same period the number of
marginal workers grew by an astonishing 326 per cent. As a result the share of marginal workers
in total work force in the district increased from 8.2 per cent in 1991 to 26.3 per cent in 2001.
1 A detailed analysis of women’s work participation in Birbhum is presented in Chapter VII.

4
78
BIRBHUM HUMAN DEVELOPMENT REPORT
The number of workers engaged in agriculture (which includes both ‘cultivators’ and ‘agricultural
workers’ – two census categories) as a percentage of total workers has decreased from 72 per cent
in 1991 to 60 per cent in 2001. This corresponds to the overall common perception that more people
are now engaged in non-agricultural activities, such as fishing2 , retail sales, vegetable vending, selling
milk, and so on. As all these activities are at the lower end of the spectrum of marketable skills,
it remains doubtful if these activities generate enough return for their family’s sustenance.
Table 4.3 Percentages of different categories of workers to total workers in Birbhum
Categories of workers 1991 2001Person Male Female Person Male Female
Cultivators 34.1 37.7 18.4 23.1 27.5 10.4Agricultural workers 38.3 34.0 57.1 36.9 33.5 47.1Household industry workers 4.1 3.0 8.8 6.5 3.2 16.0Other workers 23.5 25.3 15.7 33.5 35.8 26.5
Source: Census 2001
Although a falling agricultural workforce is an expected and desirable change as an economy
progresses, it has not been an unmixed good in our context. The share of agricultural labour in total
workers engaged in agriculture increased over the Census decade (53 per cent in 1991 to 62 per
cent in 2001). As a matter of fact, between 1991 and 2001, the absolute number of cultivators in
Birbhum came down from 289155 to 260955 indicating a 10 per cent decennial fall, while during
the same period, the number of agricultural labourers increased from 324701 to 416949 indicating
a decennial growth rate of 28 per cent (Figure 4.3). In other words, while the overall dependency
on agriculture has been coming down, an increasing number of landless in rural areas join wage work
in agriculture as a major activity.
If overall the percentage of working population engaged in agriculture is coming down, then
it must be the case that people are joining non-farm activities in increasing number. Census classifies
non-farm employment into two categories: ‘household industry workers’ and ‘other workers’. In Birbhum
the share of non-agricultural employment has increased from 28 per cent in 1991 to 40 per cent in
2001. What is remarkable is that even in rural Birbhum the share of non-agricultural employment
2 Fishing is included in the broader definition of ‘agriculture’, but here we refer to agriculture proper that excludes fishing.

4
79
BIRBHUMHUMAN DEVELOPMENT REPORT
increased from 23 per cent in 1991 to 35 per cent 2001. In 2001, 19 per cent of non-agricultural
employment belonged to the household industry category and the rest belonged to ‘other workers’.
The share of household industry in non-agricultural employment does not seem to have changed over
time.
Figure 4.3 Number of workers in different categories
in Birbhum (in thousand)
We now look at inter-block variation in work participation. According to Census 2001, all blocks
in Birbhum have more than 30 per cent of their population in the work force. However, there are
five blocks (Rampurhat-I, Rajnagar, Suri-I, Suri-II and Bolpur-Sriniketan) in which the work
participation rate is more than 40 per cent (Table 4.4). Out of these five blocks, in two blocks Rajnagar
and Suri-II higher work participation is due to higher share of marginal workers. Except Mayureswar-
II and Nanoor, all the blocks show a decline in the percentage of main workers in total population
between 1991 and 2001, and the overall increase in work participation in rural areas is entirely due
to significant increase in marginal workers in all the blocks. In all the municipalities except Dubrajpur
the percentage of main workers increased between 1991 and 2001. In the urban areas in general the
percentage of marginal workers in total workers is much lower compared to the rural areas. Higher
work participation might be either due to expanding employment opportunities that acted as the ‘pull

4
80
BIRBHUM HUMAN DEVELOPMENT REPORT
factor’ or due to economic hardship that compelled people to accept any kind of job, or some
combination of both.
Table 4.4 Percentage of workers (Main+Marginal) in total population and of cultivators andagricultural workers in total workers across blocks of Birbhum, 2001
Blocks/ Percentage Percentage of Percentage of Percentage ofMunicipalities of workers marginal cultivators in agricultural
in total workers in total total workers labourers inpopulation workers total workers
Murarai - I 32.7 24.2 14.7 35.1
Murarai-II 32.4 19.9 20.1 38.5
Nalhati-I 35.2 25.1 21.7 38.0
Nalhati-II 33.3 24.5 23.5 40.6
Rampurhat-I 44.3 28.7 25.9 38.4
Rampurhat-II 35.0 24.8 22.0 39.4
Mayureswar-I 38.4 30.3 28.7 44.0
Mayureswar-II 38.1 18.2 34.1 39.2
Md. Bazar 37.6 27.8 20.7 40.6
Rajnagar 45.8 39.4 22.8 34.0
Suri-I 42.8 28.8 15.4 28.0
Suri-II 49.4 45.9 27.7 40.3
Sainthia 38.4 30.3 26.7 46.8
Labhpur 35.4 24.7 33.1 38.8
Nanoor 36.9 19.6 30.1 40.1
Bolpur-Sriniketan 43.7 28.8 21.0 43.9
Illambazar 36.5 29.3 27.2 44.2
Dubrajpur 39.8 29.7 27.6 40.2
Khoyrasole 35.1 35.4 26.5 34.3
Rampurhat (M) 29.9 7.7 - -
Sainthia (M) 33.1 8.2 - -
Suri (M) 32.4 7.2 - -
Dubrajpur (M) 33.7 18.4 - -
Bolpur (M) 33.8 9.4 - -
Source: Census 2001

4
81
BIRBHUMHUMAN DEVELOPMENT REPORT
Figure 4.4 Percentage of workers in total population across blocks of Birbhum, 2001

4
82
BIRBHUM HUMAN DEVELOPMENT REPORT
Figure 4.5 Percentage of agricultural labourers in total workers across blocks of Birbhum, 2001

4
83
BIRBHUMHUMAN DEVELOPMENT REPORT
Although a fall in agriculture-based workforce is considered as a positive change from
development point of view, not all blocks of Birbhum have experienced such positive changes to a
significant level. For example, there are still 6 blocks (Mayureswar-I and Mayureswar-II, Sainthia,
Labhpur, Nanoor and, Illambazar) where the percentage of workers dependant on agriculture is 70
per cent or more. It is also observed that in those blocks where a high percentage of people are
engaged in agriculture, it is mostly due to higher share of agricultural labourers and not for higher
shares of cultivators. There are seven blocks where the percentage of agricultural labourers is 40 or
more (Table 4.4). These blocks are Nalhati-II, Mayureswar-I, Md Bazar, Suri-II, Sainthia, Nanoor,
Bolpur-Sriniketan, Illambazar and Dubrajpur. High dependence of workers on agriculture implies that
they are subject to seasonal variations in income. It is obvious that in those blocks where the percentage
of marginal workers or agricultural labourers is higher, the households’ incomes are subject to seasonal
fluctuations that make them vulnerable. Therefore, NREGS need to be strengthened in those blocks.
We shall come back to this point later.
We now look at the incidence of rural poverty and its connection with the composition of
employment across blocks. The BPL household survey carried out in 2005 provides information on
total number of families and families below the poverty line at a highly disaggregated level (viz. the
Sansad level). Despite the controversies surrounding the BPL survey and reliability of the data, the
figures can highlight certain important aspects of the spatial distribution of the poor people if we
assume that the alleged upward bias is more-or-less evenly distributed across blocks. The percentage
of BPL families across blocks is presented in Table 4.5. The table shows that the percentage of BPL
households is the lowest in Rajangar (25.3 per cent) and highest in Murarai II (78 per cent). There
are only three blocks where the percentage of BPL households is less than 30 per cent (Rajnagar,
Suri I and Labhpur). There are five blocks where percentage of BPL households is more than 50
per cent. These blocks are Suri-II, Rampurhat-I, Rampurhat-II, Nalhati-II and Murarai-II.

4
84
BIRBHUM HUMAN DEVELOPMENT REPORT
Table 4.5 Number and percentage of BPL households, 2005
Block Number of total Number of BPL Percentage ofhouseholds households BPL households
Murarai-II 42079 32812 78.0
Nalhati-II 25180 14165 56.3
Rampurhat-II 37954 20389 53.7
Rampurhat-I 39665 21393 53.9
Suri-II 21502 10881 50.6
Murarai-I 33854 16995 50.2
Nalhati-I 44356 19002 42.8
Mayureswar-II 28220 11461 40.6
Mayureswar-I 26449 10526 39.8
Bolpur-Sriniketan 41308 15965 38.6
Khoyrasole 28274 10424 36.9
Illambazar 37912 13514 35.6
Dubrajpur 38749 13764 35.5
Md. Bazar 32398 11444 35.3
Nanoor 48251 16746 34.7
Sainthia 46677 14876 31.9
Labhpur 45293 12798 28.3
Suri-I 20462 5775 28.2
Rajnagar 15343 3879 25.3
Birbhum 653926 276809 42.3
Although there is no indication that the share of BPL households is more in blocks with higher
share of agricultural labourer, there is a clear pattern that the share of BPL households is more in
blocks with disadvantaged population in general and Muslim population in particular. To examine this
correlation graphically, we have plotted the percentage of BPL households across blocks against the
percentage of disadvantaged population, viz. SCs, STs and Muslims (Figure 4.6).

4
85
BIRBHUMHUMAN DEVELOPMENT REPORT
Figure 4.6 Correlation between percentages of BPL households (2005) and
disadvantaged population (2001) at block level in Birbhum
It seems that the percentage of BPL households is closely associated with the percentage of
disadvantaged population in general and the percentage of Muslim population in particular (Figure
4.7). While the percentage of BPL households shows a correlation coefficient value of 0.54 with
percentage of disadvantaged population, with the percentage of Muslim population it shows a much
stronger association (0.73). This indicates that, even though there is much scepticism about identification
procedure of BPL households, by and large the data conform to our expectation that the socially
disadvantaged groups be identified as BPL so that the benefits of targeted poverty alleviation schemes
and programmes reach them.

4
86
BIRBHUM HUMAN DEVELOPMENT REPORT
Figure 4.7 Correlation between percentages of BPL households (2005) and Muslim
population (2001) at block level in Birbhum
4.3 National Rural Employment Guarantee Scheme (NREGS) in Birbhum
One of the major causes of rural poverty is believed to be lack of employment opportunities
or regular employment opportunities. However, it has been found in many contexts that the incidence
of poverty is higher in the households with predominantly non-working population (children, elderly,
ill and disabled) rather than the working population. The National Rural Employment Guarantee Scheme
(which later became an Act) has been introduced with the objective to enhance the livelihood security
in rural areas by providing 100 days of guaranteed wage employment per household in a financial
year. One can expect that the demand for NREGS work will be more in places with higher share
of disadvantaged population or agricultural labourer. We have already established that the incidence
of poverty is higher among the disadvantaged population, who are also generally over-represented in
the class of agricultural labourers.

4
87
BIRBHUMHUMAN DEVELOPMENT REPORT
According to the latest NREGS statistics available on the official website (www.nrega.nic.in), the number
of households provided employment under NREGS is slightly more than 3.85 lakhs in Birbhum district.
This is 10.4 per cent of the number of households provided such employment in West Bengal, and
looks rather good if we consider the fact that Birbhum has only 4.8 per cent of West Bengal’s total
rural population.
Table 4.6: Average number of person-days created per household and utilisation of NREGS funds
across blocks of Birbhum (2006-07)
Block Person-days per household % Utilization of NREGS fundsMin Max average Min Max average
Suri I 10 32 27 54 87 78Suri II 18 43 27 78 99 86Md Bazar 6 48 25 74 100 95Saithia 12 35 20 68 93 82Rajnagar 20 38 28 83 97 92Dubrajpur 10 23 14 70 98 88Khoyrashole 13 66 30 72 92 84Bolpur-Sriniketan 18 57 33 94 100 97Illambazar 11 28 17 82 100 93Labpur 15 54 24 53 100 84Nanoor 9 38 19 92 80 87Rampurhat I 7 35 14 74 100 90Rampurhat II 6 27 12 73 100 87Mayureswar I 11 16 14 87 97 93Mayureswar II 11 32 20 72 100 89Murarai I 9 18 11 70 100 90Murarai II 6 27 13 79 100 91Nalhati I 9 25 17 71 100 89Nalhati II 8 11 10 62 100 85
Note: Min (or max) shows the minimum (or maximum) value of person days/utilisation ofavailable NREGS funds for the GPs under the block.
Source: Calculated from data provided by NREGS Cell, Birbhum district
According to the latest available figures NREGS fund utilisation in Birbhum is 68 per cent
which is much higher than the state average of 39 per cent.3 It is observed from the data that not
3 According to data provided by District NREGS Cell, the fund utilisation rates for the year 2005-06, 2006-07 and 2007-08(till October) are 43 per cent, 77 per cent and 78 per cent respectively, which are rather good.

4
88
BIRBHUM HUMAN DEVELOPMENT REPORT
all households which had applied for the job card finally demanded work against their job cards. For
example, during the financial year 2006-07, only 85 per cent of the households holding job card finally
demanded employment. In Birbhum there is no difference between the number of households which
demanded work and were provided with work, though such difference exists for rural West Bengal
as a whole.
However, in terms of the average man-days created per household the district’s performance
does not look so good. Table 4.6 shows block-wise figures on average person-days created per household
and percentage utilisation of NREGS funds. The same table also shows minimum and maximum average
person-days per household and utilisation of funds at the GP level under each block. There is a
considerable variation across blocks in terms of average person-days per household. Out of 19 blocks
in Birbhum, only 6 blocks could provide 25 or more days of work on an average. Performance of
NREGS in terms of person-days per household is extremely poor in 7 blocks of Birbhum with average
person-days less than 15. The blocks which performed better also showed considerable intra-block
differences.
Most of the blocks perform well in terms of utilisation of NREGS funds, even though inter-
block differences are observed. On the one hand there are blocks like Bolpur-Sriniketan which had
spent nearly 97 per cent of the available funds, on the other hand blocks like Suri-I could spend
only 78 per cent of the available funds during the financial year 2006-07. Out of 19 blocks, 6 blocks
could spend more than 90 per cent of the available funds under NREGA. There is an apparent puzzle
here. The performance of NREGS in Birbhum looks good if one looks at the percentage of funds
utilised, but on the contrary, if one looks at the average person-days created per household the picture
turns out to be rather dismal. It requires further scrutiny. Is there any positive relationship between
utilisation of available NREGS funds and average person-days created at the block level? In other
words, did those blocks which finished most of the available funds under NREGS create higher average
person-days? We explore this relationship graphically at the block level (see Figure 4.8).
4
89
BIRBHUMHUMAN DEVELOPMENT REPORT
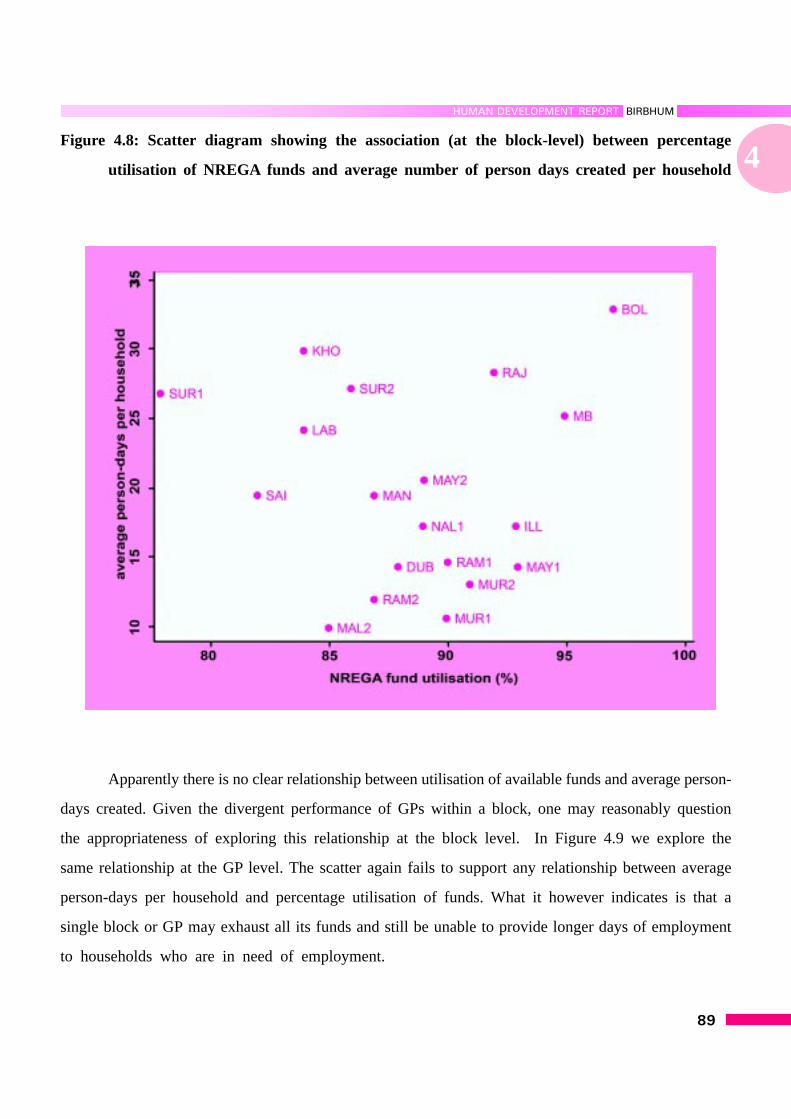
Figure 4.8: Scatter diagram showing the association (at the block-level) between percentage
utilisation of NREGA funds and average number of person days created per household
Apparently there is no clear relationship between utilisation of available funds and average person-
days created. Given the divergent performance of GPs within a block, one may reasonably question
the appropriateness of exploring this relationship at the block level. In Figure 4.9 we explore the
same relationship at the GP level. The scatter again fails to support any relationship between average
person-days per household and percentage utilisation of funds. What it however indicates is that a
single block or GP may exhaust all its funds and still be unable to provide longer days of employment
to households who are in need of employment.

4
90
BIRBHUM HUMAN DEVELOPMENT REPORT
Figure 4.9: Scatter diagram showing the association (at the GP-level) between percentage utilisationof NREGA funds and average number of person days created per household
The main reason for low average person-days at the block/GP level, according to some, is
that GPs are not able to develop adequate number of schemes to absorb the labour who demand
work under NREGS. Since NREGS is supposed to be a demand-driven programme (demand for funds
should come from the Gram Panchayat), it is apparent that the GPs can hardly develop enough number
of schemes to provide employment to all who demand employment.
What could be the possible reasons for the low average person-days per household? There
is no way to know how many people needed work but did not get it. Since in the official records
there is no difference between the total number of days demanded and the number of days of employment
provided, one has no other option but to conclude that the demand for work is low. If people have
the opportunity to work at higher wage rates or have more certain work at the same or even little
4
91
BIRBHUMHUMAN DEVELOPMENT REPORT
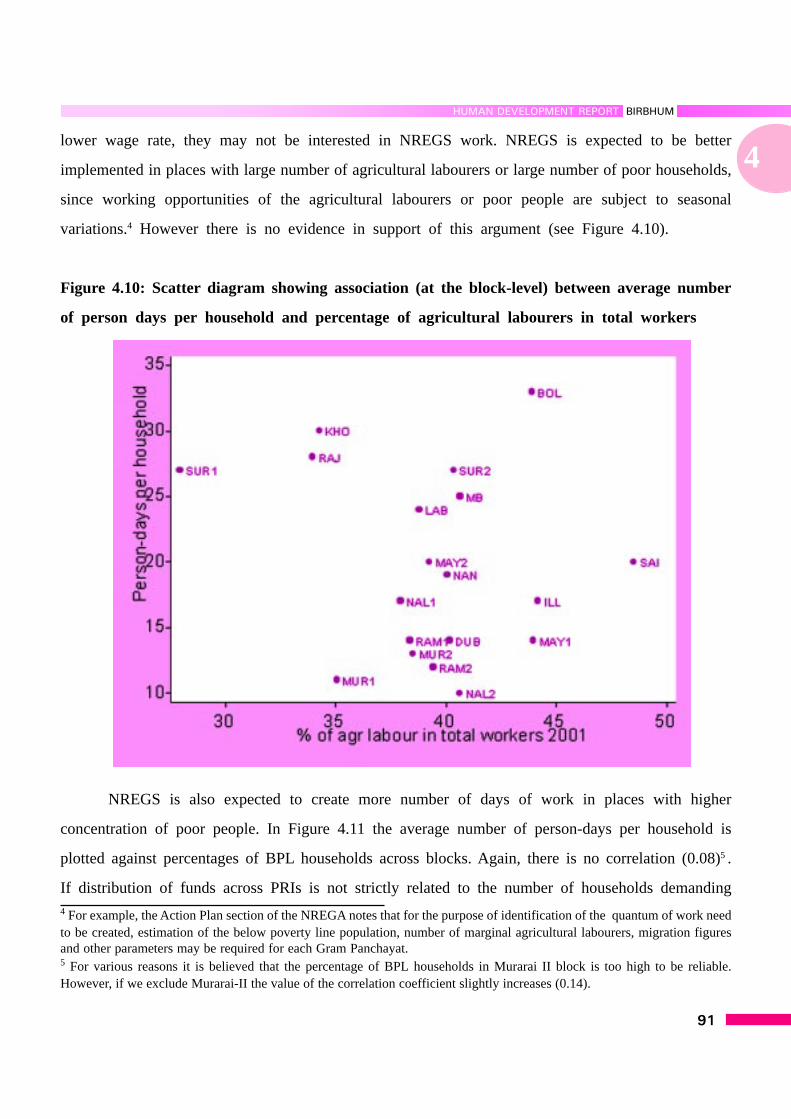
lower wage rate, they may not be interested in NREGS work. NREGS is expected to be better
implemented in places with large number of agricultural labourers or large number of poor households,
since working opportunities of the agricultural labourers or poor people are subject to seasonal
variations.4 However there is no evidence in support of this argument (see Figure 4.10).
Figure 4.10: Scatter diagram showing association (at the block-level) between average number
of person days per household and percentage of agricultural labourers in total workers
NREGS is also expected to create more number of days of work in places with higher
concentration of poor people. In Figure 4.11 the average number of person-days per household is
plotted against percentages of BPL households across blocks. Again, there is no correlation (0.08)5 .
If distribution of funds across PRIs is not strictly related to the number of households demanding4 For example, the Action Plan section of the NREGA notes that for the purpose of identification of the quantum of work needto be created, estimation of the below poverty line population, number of marginal agricultural labourers, migration figuresand other parameters may be required for each Gram Panchayat.5 For various reasons it is believed that the percentage of BPL households in Murarai II block is too high to be reliable.However, if we exclude Murarai-II the value of the correlation coefficient slightly increases (0.14).

4
92
BIRBHUM HUMAN DEVELOPMENT REPORT
employment under NREGA, areas with higher demand for work due to poverty are likely to end
up with fewer days of work. Furthermore, poor people in poverty stricken areas may not be able
to take advantage of NREGS because of the lack of physical capacity to work.
Figure 4.11: Scatter diagram showing the association (at the block-level) between
percentage of BPL households and average number of person days per household.
To get some idea about the levels of living of the agricultural workers we look at the annual average wage
rate of male agricultural field labourers in the district (Figure 4.12).

4
93
BIRBHUMHUMAN DEVELOPMENT REPORT
Limited opportunities in the non-farm sector seem to have worked against them, as the wage rate
in the district has been lower than the average wage in West Bengal. However, it can be noted that
the gap between the wage rate prevailing in Birbhum and the average wage for all districts has been
narrowing, albeit slowly.
4.4 Opportunities in industries
Birbhum is one of the most backward districts in terms of industrial development. During the
period between 1991 and 2005, 1220 new industrial projects were set up in West Bengal with a total
investment of Rs 29101.8 crore. Only 1.23 percent of these projects came to Birbhum, the investment
share being a meager 0.18 percent. In 2006, among the 173 new projects only one with an investment
of Rs 5.86 crore was proposed in Birbhum.
According to the latest information available from the District Industries Centre, Birbhum, there
is only one large scale industry in the district, four medium scale industries and approximately 4748
registered small-scale units. About 5000 people are engaged in the only large industry, viz. Bakreshwar
Thermal Power Project, either as direct employees or as contract workers. Although this project is
expected to generate successive rounds of economic activities in the downstream and upstream areas,
they are yet to develop to a significant extent. Among the medium scale industries, the National Sugar
Mill at Ahmedpur, which has been taken up by the Government of West Bengal, is unfortunately in
a very bad shape. Although it can provide work for about 600 persons, it can run for only one or
two months in a year because of shortage of raw material and other problems. A mini steel plant
established at Suri in 1984 provides work for about 300 persons through direct and indirect employment.
The small-scale units are in the areas of rice-husking, oil-pressing, stone crushing, China clay
washing, wheat grinding, wooden and steel furniture, printing, mould plastic wares, automobile servicing,
readymade garments, cold storage, bakery, electrical transformer, and so on. The mineral processing
units are mostly in Nalhati-Rampurhat-Md. Bazar area, as certain minerals like China clay, granite
stone and fire clay are available in this area. There are about 400 stone crushing units of which only
100 are registered SSI units.

4
94
BIRBHUM HUMAN DEVELOPMENT REPORT
Table 4.7: The number of small scale industries in different areas
Sl Type of industry Number Nature of activityno of units (product, or activity towards production)
1 Food products 1102 Rice mill, oil mill, chira, chanachur, noodles etc
2 Tobacco products 41 Bidi
3 Cotton textile 47
4 Woolen and silk textile 35
5 Hosiery and garments 93
6 Wooden products 468
7 Paper products & printing 99 Handmade paper, corrugated cotton box, printingpress
8 Leather products 40
9 Plastic products 12 Plastic toys, polythene bag, container etc.
10 Chemical products 42 Laundry soap, washing soap, phenyl, detergent,tooth powder, tooth powder
11 Coke and coal products 100 Soft coke, coal and coal briquette
12 Mineral products 191 Stone crushing, china clay powder etc
13 Metal products 920 Agricultural implements, gate grill, machinery parts,engineering job works
14 Cold storage and warehouse 15 Preservation of potatoes
15 Repairing and servicing 571 Cycle, motor cycle, car repairing; TV, tape recorder,radio repairing
16 Studio and Xerox 17
17 DTP/Fax/Internet etc 8
18 Cement products 1 PCC pole
19 Handicraft products 946 Kantha stitch, sola pith, cane, bamboo, baticprinting, pottery, bell metal, woodcraft etc
Total 4748
4.5 Expansion of economic opportunities
It is important to recognize the complementarity between expanding economic opportunities
and the social conditions that facilitate the use of those opportunities (e.g. elementary education and

4
95
BIRBHUMHUMAN DEVELOPMENT REPORT
good health). There is evidence that the returns to educational expansion tend to increase with the
expansion of market opportunities, and that can be a strong incentive for parents to educate their
children. The options that a person has depend greatly on relations with others and on what the state
and other institutions do. Opportunities are shaped by the interaction of social circumstances and public
policy. The opportunities offered by expanding modern economic activities that require certain types
of skills may be difficult to use when a person is handicapped by illiteracy or ill-health. On the other
hand, a person with some education and good health may still be unable to use his or her abilities
because of limited economic opportunities.
Graduation into the non-farm sector by the lower economic strata in rural areas generally follows
a familiar trajectory in which an initial move towards diversification plays a crucial role. Some of
the erstwhile landless households got access to land through patta or barga. Agricultural labor or
vegetable selling combined with cultivation on patta or barga land however small reduces their propensity
to shock, which leads to higher saving and investment in human capital accumulation, which in turn
facilitates entry into non-farm activities – either through salaried job or through non-farm self-
employment or small business through loan access and better marketing skills.
We have discussed the predominantly agricultural nature of the economy of Birbhum district,
and the nature of agriculture is also predominantly rice based. To a limited extent wheat and other
foodgrains are also cultivated. In both rice and wheat, productivity in Birbhum far exceeds the average
for West Bengal. Yet, there is an urgent need for encouraging producers towards more diversified
products, as the return from rice cultivation has been declining. One main reason for continuing rice
production is the farmer’s perception about the risk involved in venturing into new kinds of production.
The risk perception may have real basis as the marketing channels and other infrastructural facilities
that could support such diversification are poorly developed. For example, development of horticulture
requires proper storage facilities without which it would not be possible to arrest the steep fall in
the post-harvest prices. Without a cushioning mechanism to protect the poor farmers from widely
fluctuating prices, horticulture, especially fruits and vegetable cultivation, will remain unattractive to
farmers, even though it is observed to have grown moderately in recent period.. It has been envisaged

4
96
BIRBHUM HUMAN DEVELOPMENT REPORT
by district level functionaries that with the development of religious-cultural tourism circuit that they
have planned there will be steady demand for flower within the district and therefore expansion of
flower production can be sustained in future. In what follows we discuss in somewhat detail two
areas that are likely to have some impact in future on expansion of economic opportunities among
the people. They are horticulture and tourism development.
Development plan under National Horticulture Mission
Along with other states and union territories,6 National Horticulture Mission (NHM) is being
implemented in West Bengal to promote comprehensive growth of the horticulture sector covering
fruits, vegetables, roots & tuber crops, mushroom, spices, flowers, aromatic plants, cashew and cocoa.
This is a centrally sponsored scheme in which the central government is providing 100 per cent assistance
to West Bengal during the 10th Plan. During the 11th Plan period, central government is providing
85 per cent and the state government will have to provide the remaining 15 per cent.
The main objectives of the Mission are the following: (1) To provide holistic growth of the
horticulture sector through area based regionally differentiated strategies which include research,
technology promotion, extension, post harvest management, processing and marketing, in consonance
with comparative advantage of each State/Region and its diverse agro-climatic features. (2) To enhance
horticulture production, improved nutritional security and income supports to farm household. (3) To
establish convergence and synergy among multiple on-going and planned programmes for horticulture
development. (4) To promote, develop and disseminate technologies, through a seamless blend of
traditional wisdom and modern scientific knowledge. (5) To create opportunities for employment
generation for skilled and unskilled persons, specially unemployed youth.
As a response to the objectives set by the National Horticulture Mission, Government of West
Bengal has created the West Bengal State Horticulture Development Society for implementation of
the Mission programmes at the state and district levels. In Birbhum, the District Mission Committee
6 Except the North Eastern States, Himachal Pradesh, Jammu & Kashmir and Uttaranchal.

4
97
BIRBHUMHUMAN DEVELOPMENT REPORT
(DMC) has been formed. The DMC is chaired by Zilla Parishad Sabhadhipati. Apart from different
district-level officials, the committee has got representation from Rathindra Krishi Vigyan Kendra (Visva
Bharati University) and Regional Research Station (Sekhampur Campus, BCKV). A series of
programmes have been designed to be implemented in Birbhum under National Horticulture Mission,
which can be classified under the following headings:
A. Production of Planting Materials (Model Nursery):
The production and distribution of good quality seeds and planting materials is an important
component of the mission. Birbhum district has a network of nurseries for producing planting material.
Therefore to meet the requirement of planting material for bringing additional areas under improved
varieties of horticultural crops, assistance would be provided for setting up new nurseries under the
Public and Private sectors (Table 4.8).
Table 4.8: Nursery schemes for Birbhum, allotment and target
Name of schemeTotal allotment
Physical (no) Financial (Rs. lakh)Target
Model nursery for 2,00,000 planting materialspublic sector (4 ha) 1 9 will be produced for a period
of approximately 9 months.
Model nursery for 2,00,000 planting materials willprivate sector (4 ha) 1 9 be produced for a period of
approximately 9 months.
Model nursery for 5,00,000 planting materials willprivate sector (1 ha) 10 12 be produced for a period of
approximately 9 months.
B. Expansion of area under fruits:
Table 4.9 summarizes requirement of fruit, present level of production, shortfall in Birbhum
district and how much new area has to be brought for fruit production.
4
98
BIRBHUM HUMAN DEVELOPMENT REPORT
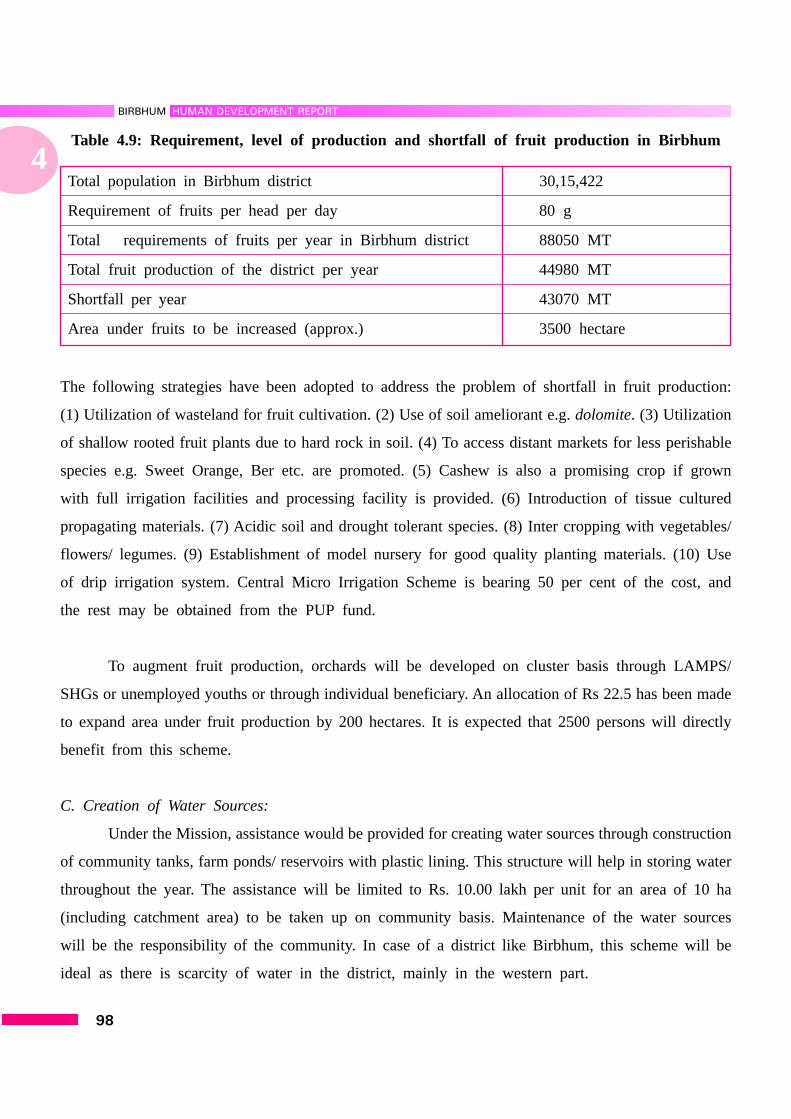
Table 4.9: Requirement, level of production and shortfall of fruit production in Birbhum
Total population in Birbhum district 30,15,422
Requirement of fruits per head per day 80 g
Total requirements of fruits per year in Birbhum district 88050 MT
Total fruit production of the district per year 44980 MT
Shortfall per year 43070 MT
Area under fruits to be increased (approx.) 3500 hectare
The following strategies have been adopted to address the problem of shortfall in fruit production:
(1) Utilization of wasteland for fruit cultivation. (2) Use of soil ameliorant e.g. dolomite. (3) Utilization
of shallow rooted fruit plants due to hard rock in soil. (4) To access distant markets for less perishable
species e.g. Sweet Orange, Ber etc. are promoted. (5) Cashew is also a promising crop if grown
with full irrigation facilities and processing facility is provided. (6) Introduction of tissue cultured
propagating materials. (7) Acidic soil and drought tolerant species. (8) Inter cropping with vegetables/
flowers/ legumes. (9) Establishment of model nursery for good quality planting materials. (10) Use
of drip irrigation system. Central Micro Irrigation Scheme is bearing 50 per cent of the cost, and
the rest may be obtained from the PUP fund.
To augment fruit production, orchards will be developed on cluster basis through LAMPS/
SHGs or unemployed youths or through individual beneficiary. An allocation of Rs 22.5 has been made
to expand area under fruit production by 200 hectares. It is expected that 2500 persons will directly
benefit from this scheme.
C. Creation of Water Sources:
Under the Mission, assistance would be provided for creating water sources through construction
of community tanks, farm ponds/ reservoirs with plastic lining. This structure will help in storing water
throughout the year. The assistance will be limited to Rs. 10.00 lakh per unit for an area of 10 ha
(including catchment area) to be taken up on community basis. Maintenance of the water sources
will be the responsibility of the community. In case of a district like Birbhum, this scheme will be
ideal as there is scarcity of water in the district, mainly in the western part.

4
99
BIRBHUMHUMAN DEVELOPMENT REPORT
D. Post Harvest Management:
Post harvest management includes packaging, grading, transportation, curing and ripening and
storage. These facilities are essential for increasing the marketability of the horticultural produce, adding
value to the produce, increasing profitability and reducing losses. It is proposed to create a network
of infrastructure facilities horticulture storages, transportation, marketing, packaging and grading and
export. The existing schemes of the National Horticulture Board (NHB), Directorate of Marketing
and Inspection (DMI) and National Cooperative Development Corporation (NCDC) will be made use
of to the maximum possible extent. In this context, specific programmes which would be taken up
under the NHM would include establishment of pack houses, ripening chambers, cold storage units,
Controlled Atmosphere (CA) storage, supply of refrigerated vans and mobile processing units besides
supports for marketing intelligence. All these projects will be entrepreneur driven through commercial
ventures for which the Central Government assistance will be credit linked back-ended subsidy for
25 per cent of the total project cost.
Table 4.10: Schemes for post harvest management of fruits in Birbhum
Total allotment
Name of scheme Physical (number) Financial (Rs. lakh)
Multipurpose Cold Storage 3 150
Refrigerated Vans/ Container 3 18
Mobile Pre-cooling/ Processing Units 3 18
Functional Infrastructure for collection /
Grading/ Storing Centers 12 72
Pack House 10 6
E. Creation of Market Infrastructure:
The main objectives of providing assistance under this component are: (1) to induce investments
from private and cooperative sectors in the development of marketing infrastructure for horticulture
commodities; (2) strengthen existing horticulture markets including wholesaler, rural haats; (3) focus
on promotion of grading, standardization and quality certification of horticulture produce at farm/market
level to enable farmers to realize better price; and (4) create general awareness among farmers,

4
100
BIRBHUM HUMAN DEVELOPMENT REPORT
consumers, entrepreneurs and market functionaries on market related agricultural practices including
contract farming.
Table 4.11: Schemes for marketing of fruits in Birbhum
Total allotment
Name of scheme Physical (number) Financial (Rs. lakh)
Rural Mandi 6 22.5
Creation of infrastructurefor rural mandi 6 22.5
Tourism
Birbhum has a rich heritage of cultural traditions. Apart from Shantiniketan, several Shakti Peeths
scattered throughout the district attract a good number of tourists. If these tourist destinations and
several other lesser known places could be developed with a comprehensive outlook they could bring
in large numbers of visitors to the area and contribute significantly to the livelihood of the local people.
With this possibility in mind the Zilla Parishad with the help of India Tourism Development Corporation
and a private consultancy agency has recently developed a detailed tourism development plan.
Even with very modest facilities Birbhum now attracts a good number of visitors to various
places of interest, with Shantiniketan, Bakreshwar and Tarapeeth being the principal attractions.
Shantiniketan remains one of the most important destinations in this part of the state with over 1.2
million visitors each year. Temples such as Tarapeeth receive over 1.4 million visitors annually7 . However,
most of the tourism traffic in the area is from within West Bengal, and despite its great potential
the district has not been able to attract the numbers that could exploit the potential effectively.
Several archaeological discoveries dating back to the Stone Age have been made in several
places in the district. Associated with both Mahavira and Gautam Buddha, the area was once part
of the Mauryan Empire, and later, also a part of the empires of the Guptas, Shashanka and
Harshavardhan. After the end of Harshavardhan’s empire, the region came under the rule of the Pala
7 Birbhum district official website (Birbhum.nic.in)

4
101
BIRBHUMHUMAN DEVELOPMENT REPORT
and Sena dynasties, until the advent of the Muslim rulers in the thirteenth century. Ruins of this period
have recently been found in the Nanoor area of the district.
The region has seen periods of influence of all the major Indian religions, including Buddhism,
Jainism, Hinduism and Islam, with their respective impact on the culture of the area. Mythological
traditions linking Sati’s dismembered body parts to different places have given rise to what are now
known as Shakti Peeths with temples honouring the goddess Sati. In Birbhum they are located in
Bakreshwar, Tarapeeth, Kankalitala, Labpur, Fulberia and Nalhati.
The region is famous for its tradition of poetry, and several poets dating back to centuries
have been inspired by the local setting. Birbhum is the land of poets of Vaishnav and Shakta Padavali
fame, such as, Jayadev and Chandidas . The folk culture of Birbhum is typified by the rich contribution
of Bauls, their songs and a religiously liberal philosophy and lifestyle with links to the Sahajiya movement
of 16th Century A.D. Chandidas and many other poets were part of the Sahajiya movement. Rabindranath
Tagore was inspired by their philosophy and patronised them actively. Birbhum has been home to
famous kabiyals, kirtaniyas and other folk performing art groups and is also famous for a number
of fairs including the popular Pous Mela at Shantiniketan and a lively fair at Kenduli with the participation
of bauls in large numbers.
The numerous temples and the association with the Shakti Peeths set the spiritual undertone
of tourism activity in the district. The temple and hot spring complex at Bakreshwar is a famous
and unique attraction, steeped in tradition and religiosity. The Vishwa Bharati University at Shantiniketan
and the ashram complex at Sriniketan, built by Rabindranath Tagore, form an important location for
the confluence of local traditions and modern ideas in art, culture society. Yet, despite its immense
potential, the district is almost nonexistent on the country’s tourist map.
To translate the potential into practice, the framers of West Bengal Tourism Policy 1996 generally
suggested “The only way out is to devise a comprehensive & competitive package of measures, incentives
& concessions for attracting adequate investment from private sector, domestic or foreign, for tourism

4
102
BIRBHUM HUMAN DEVELOPMENT REPORT
projects in West Bengal.” Religious, pilgrimage and cultural tourism can be identified as thrust areas
for tourism development in Birbhum. A Toursim Circuit forming a triangle joining Bolpur, Bakreshwar
and Nalhati has been proposed to be developed.
Birbhum attracts millions of people to its various tourist spots each year. However, at present,
these locations lack basic tourist amenities like public transport, public conveniences, drinking water
facility, pathways, parking for private and public vehicles, sit-outs, shelters, illumination etc. While
most of these spots are day-tourist attractions and accommodation is needed only at a few places
like Bolpur and Tarapeeth where sufficient accommodation already exists. Additional hotels and budget
accommodation near the other spots on the circuit should be encouraged through private sector
participation, by the State Government. Parts of the district such as Bolpur and Tarapeeth already
have numerous facilities for tourists such as hotels, dharmshalas and eateries, of various categories.
While numerous attractions with immense tourism potential exist, poor marketing, promotion
and lack of awareness amongst tourists is a major detractor. Most of the tourist centres are situated
in the middle of human habitation, and are surrounded by dense development, making access difficult.
This also limits the area available for construction of amenities, additional structures, parking etc. Poor
quality of hygiene and limited awareness of hygienic practices amongst the local citizens and visitors
is a detractor for tourists from outside the region. Maintenance is not adequate and limited funds
are available. Since all these tourist spots are situated at a considerable distance from one another
in terms of travel time, a lot of time is lost moving from one to the other.
Proper marketing and promotion to popularise the district can help convert it into a successful
tourism circuit. Dissemination of information about the various destinations in the circuit and their
attraction to potential tourists is extremely important to increase awareness about the district (at present
most people outside the region have heard only of Shantiniketan, and limited details are available in
tourist literature, internet etc.). Improvement of transportation within the district to ease local and
regional movement of tourists can be beneficial for a satisfactory tourism experience. Improvement
of conditions for visitors at the various sites, addition of amenities and simplification of access with

4
103
BIRBHUMHUMAN DEVELOPMENT REPORT
clean pathways etc., well maintained public toilet facilities and hygienic food at stalls within the
complexes will make the area more attractive.
Figure 4.13 Proposed tourism circuit for Birbhum

4
104
BIRBHUM HUMAN DEVELOPMENT REPORT
Appendix
Main workers: Main workers, according to Census definition, are those who had worked for the major
part of the year preceding the date of enumeration i.e., those who were engaged in any economically
productive activity for 183 days (or six months) or more during the year.
Marginal workers: Marginal workers are those who worked any time at all in the year preceding the
enumeration but did not work for a major part of the year, i.e., those who worked for less than
183 days (or six months).
Table 4A1: Population Features of Farmers in the Blocks of Birbhum for the year 2004-05
Name of Bargadars Patta Small Marginal farmers Agricultural
Block holders farmers labourers (2001)
Murarai-I 1987 6382 5602 8500 17710
Murarai-II 2926 6627 7360 10580 22166
Nalhati-I 6475 6075 6829 12682 27839
Nalhati-II 1998 4125 3010 4215 14573
Rampurhat-I 4304 7804 3000 9000 27079
Rampurhat-II 2361 4181 7000 7000 21908
Mayureswar-I 3267 7990 9986 11695 23599
Mayureswar-II 2901 7255 4400 7945 16912
Md.Bazar 4069 15274 4005 4675 21311
Sainthia 7982 7825 6475 6500 31594
Dubrajpur 14931 10653 3894 8410 25419
Rajnagar 7080 5807 3275 6850 10838
Suri-I 4572 6271 2480 6950 11551
Suri-II 3502 3897 4858 5758 15348
Khoyrasol 13304 7657 404 14330 16252
Bolpur-Sriniketan 8584 17806 6500 10000 34187
Labhpur 8107 8613 1817 5765 24282
Nanoor 9255 9776 3550 8360 28639
Illambazar 7975 8315 4865 5750 23423
Birbhum 115580 152333 89310 154965 414630
Notes:(1) Marginal farmer possesses agricultural land measuring up to 1 hectare. (2) Small farmer possesses agricultural
land measuring more than 1 hectare & up to 2 hectares.
Sources: (1) Census of India, 2001; (2) B.L. & L.R.O. Birbhum; (3) B.D.O.s