Human Capital Depreciation and Efficiency in Surgical Care Jason Hockenberry, PhD* and Lorens...
24
Human Capital Depreciation and Efficiency in Surgical Care Jason Hockenberry, PhD* and Lorens Helmchen, PhD * The authors have benefitted from collaboration and conversations with Peter Cram, MD, MBA and Saket Girotra, MD.
-
Upload
colleen-may -
Category
Documents
-
view
217 -
download
3
Transcript of Human Capital Depreciation and Efficiency in Surgical Care Jason Hockenberry, PhD* and Lorens...

Human Capital Depreciation and Efficiency in Surgical Care
Jason Hockenberry, PhD* and Lorens Helmchen, PhD
* The authors have benefitted from collaboration and conversations with Peter Cram, MD, MBA and Saket Girotra, MD.

Acknowledgements
This research was supported by grant number 1 R03 HS019743-01 (PI:Hockenberry) from the Agency for Healthcare Research and Quality. The content is solely the responsibility of the presenter and does not necessarily represent the official views of the Agency for Healthcare Research and Quality.
The data used in this presentation are from PHC4. This analysis was not prepared by PHC4. It was performed by the authors listed above. PHC4, its agents and staff bear no responsibility or liability for the results of the analysis, which are solely the opinion of the authors.
The authors have no conflicts of interest to declare.
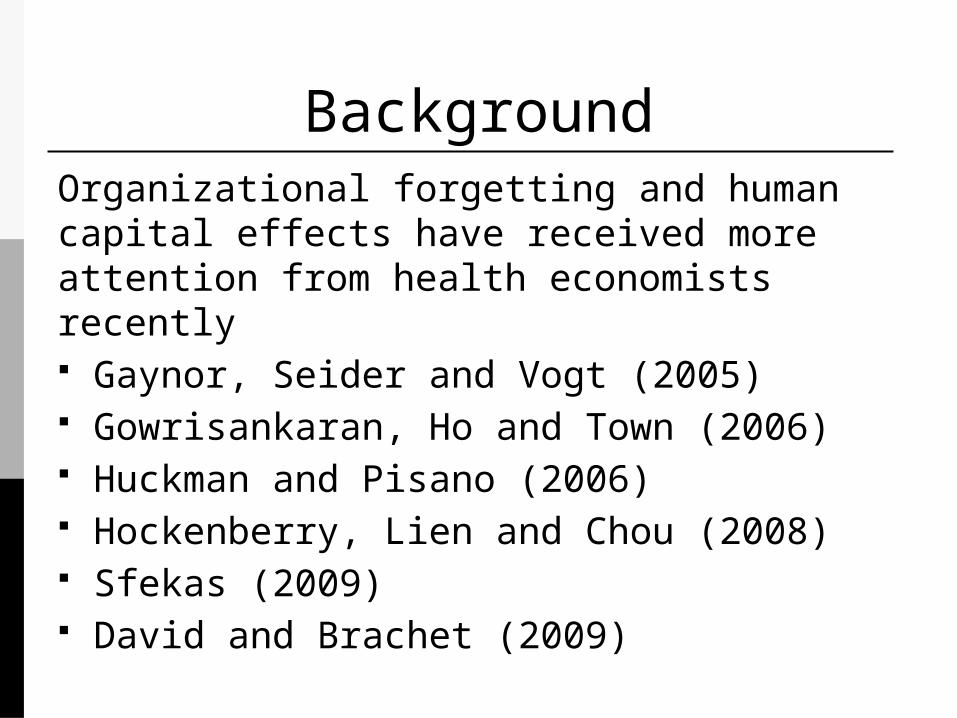
BackgroundOrganizational forgetting and human capital effects have received more attention from health economists recently Gaynor, Seider and Vogt (2005) Gowrisankaran, Ho and Town (2006) Huckman and Pisano (2006) Hockenberry, Lien and Chou (2008) Sfekas (2009) David and Brachet (2009)

The TheoryHuman Capital is accumulated through experience and education, interacts with endowments and is aggregated within organizations
Human Capital accumulation leads to increases in productivity
Breaks in production can lead to the depreciation of this capital (so-called forgetting) and reductions in productivity

Model of surgical outcomes
What do surgeons produce? Surgeries, or something else?

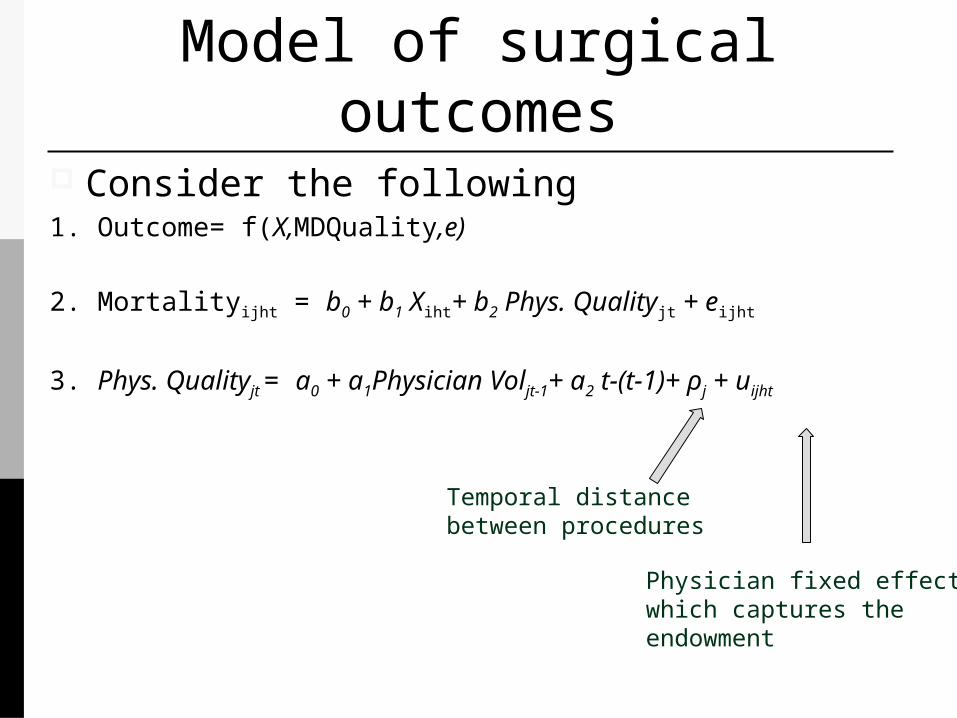
Model of surgical outcomes Consider the following
1. Outcome= f(X,MDQuality,e)

Model of surgical outcomes Consider the following
1. Outcome= f(X,MDQuality,e)
2. Mortalityijht = b0 + b1 Xiht+ b2 Phys. Qualityjt + eijht

Model of surgical outcomes Consider the following
1. Outcome= f(X,MDQuality,e)
2. Mortalityijht = b0 + b1 Xiht+ b2 Phys. Qualityjt + eijht
3. Phys. Qualityjt = a0 + a1Physician Voljt-1+ a2 t-(t-1)+ ρj + uijht
Model of surgical outcomes Consider the following1. Outcome= f(X,MDQuality,e)
2. Mortalityijht = b0 + b1 Xiht+ b2 Phys. Qualityjt + eijht
3. Phys. Qualityjt = a0 + a1Physician Voljt-1+ a2 t-(t-1)+ ρj + uijht
Temporal distancebetween procedures
Physician fixed effectwhich captures theendowment

Model of surgical outcomes Consider the following
2. Mortalityijht = b0 + b1 Xiht+ b2 Phys. Qualityjt + eijht
3. Phys. Qualityjt = a0 + a1Physician Voljt-1+ a2 t-(t-1)+ ρj + uijht
SO by substitution we get
4. Mortalityijht = d0 + d1 Xiht + d2MDVoljt-1+ d3 t-(t-1)+ ρj +vijht

Model of surgical outcomes Consider the following1. Outcome= f(X,MDQuality,e)
2. Mortalityijht = b0 + b1 Xiht+ b2 Phys. Qualityjt + eijht
3. Phys. Qualityjt = a0 + a1Physician Voljt-1+ a2 t-(t-1)+ ρj + uijht
by substitution we get
4. Mortalityijht = d0 + d1 Xiht + d2MDVoljt-1+ d3 t-(t-1)+ ρj +vijht
And there are, of course, always arguments about whether we have the salient parts of this included in these models.

Procedure of InterestExamining a procedure used to treat Coronary Artery Disease (CAD):
Percutaneous Coronary Interventions (PCI): Actual procedure usually involves a single
physician.
Often performed in emergent situations with little time for planning

Data Source: Pennsylvania Health Care Cost
Containment Council (PHC4)
All inpatient admission claims within PA for the years 2006Q3-2010Q2
These data were augmented with variables calculating time (in number of days) between procedures where the physician was listed as the operator.

General Estimation Strategy
m = mortality (< 1 day, in-hospital)
D = measure of temporal distance of last surgery of surgeon j
V = vector containing volume of both surgeon j and hospital kS = physician j’s characteristicsH = hospital k’s characteristicsX = patient i’s characteristics
𝑚𝑖𝑗𝑘𝑡=𝛽0+𝛽1𝐷 𝑗𝑡+𝛽2𝑉 𝑗𝑘𝑡+𝛽3𝑆 𝑗𝑡+𝛽4𝐻𝑘𝑡+𝛽5𝑋 𝑖𝑡+𝑣 𝑖𝑗𝑘𝑡

Temporal Distance Measures
A continuous covariate for temporal distance is not very informative.
We define temporal distance indicators 0-2 days (ref)3-7 days8-14 days15+ days
We examine both the days since any OR and the days since the specific procedure
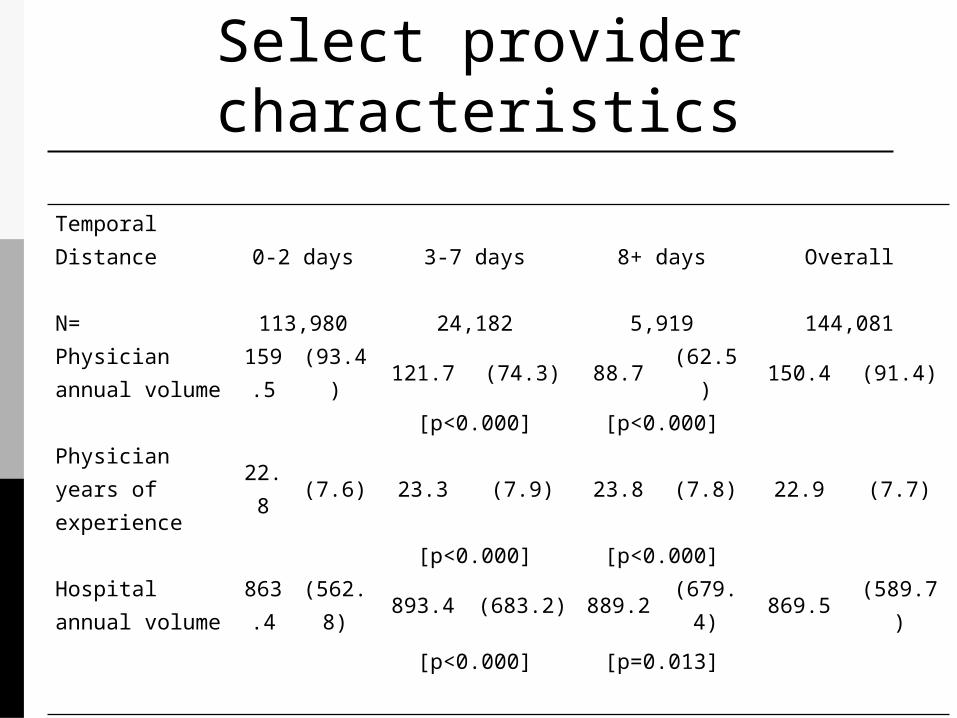
Select provider characteristics
Temporal Distance 0-2 days 3-7 days 8+ days Overall
N= 113,980 24,182 5,919 144,081
Physician annual volume
159.5 (93.4) 121.7 (74.3) 88.7 (62.5) 150.4 (91.4)
[p<0.000] [p<0.000]
Physician years of experience
22.8 (7.6) 23.3 (7.9) 23.8 (7.8) 22.9 (7.7)
[p<0.000] [p<0.000]
Hospital annual volume
863.4 (562.8) 893.4 (683.2) 889.2 (679.4) 869.5 (589.7)
[p<0.000] [p=0.013]

Select provider characteristics
Peri-procedural Mortality In-hospital Mortality
Temporal distance
0-2 3-7 8 +
0-2 3-7 8 +
Full sample
mean (%)
0.31
0.54
0.54
1.00
1.11
1.20
p-value
0.000
0.002
0.074
0.077Procedures performed by high volume physicians1 only
mean (%)
0.32
0.56
0.63
1.01
1.11
1.35
p-value
0.000
0.003 0.122
0.038

Outcomes of PCI patientsOutcome: Perioperative
Mortality In-Hospital
Mortality
3-7 days since last inpatient procedure
0.00308*** (0.0004) 0.00283*** (0.0007)
8 + days since last inpatient procedure
0.00275*** (0.0008) 0.00328** (0.0014)
Increase of 25 PCIs in surgeon 12 month volume
-0.0000741 (0.0003) -0.000256 (0.0005)
Increase of 25 PCIs in hospital 12 month volume
0.0000223 (0.0001) 0.0000397 (0.0001)
N 144081 144081
Standard errors clustered at the physician level in parentheses* p < 0.10, ** p < 0.05, *** p < 0.01

Outcomes of PCI Patients Treated by High Volume
PhysiciansOutcome: Perioperative
Mortality In-Hospital
Mortality
3-7 days since last inpatient procedure
0.00318*** (0.0006) 0.00300*** (0.0009)
8 + days since last inpatient procedure
0.00521*** (0.0013) 0.00605*** (0.0023)
Increase of 25 PCIs in surgeon 12 month volume
-0.0000521 (0.0003) -0.000274 (0.0006)
Increase of 25 PCIs in hospital 12 month volume
0.00000293 (0.0001) 0.0000259 (0.0001)
N 95634 95634
Standard errors clustered at the physician level in parentheses* p < 0.10, ** p < 0.05, *** p < 0.01

Does Surgeon Human Capital Depreciate?
Survival after surgery appears to be negatively associated with temporal distance to an extent.
The question is the ‘root’ of this effect. Cognitive processes? Manual dexterity? Team coordination/mindfulness?
Resource Use We are also thinking about what temporal distance does to resource use
• Increased temporal distance could increase resource use because of labor-capital tradeoffs
• On the other hand it could reduce resource because more anomalies go unnoticed and therefore untreated, reducing resource use
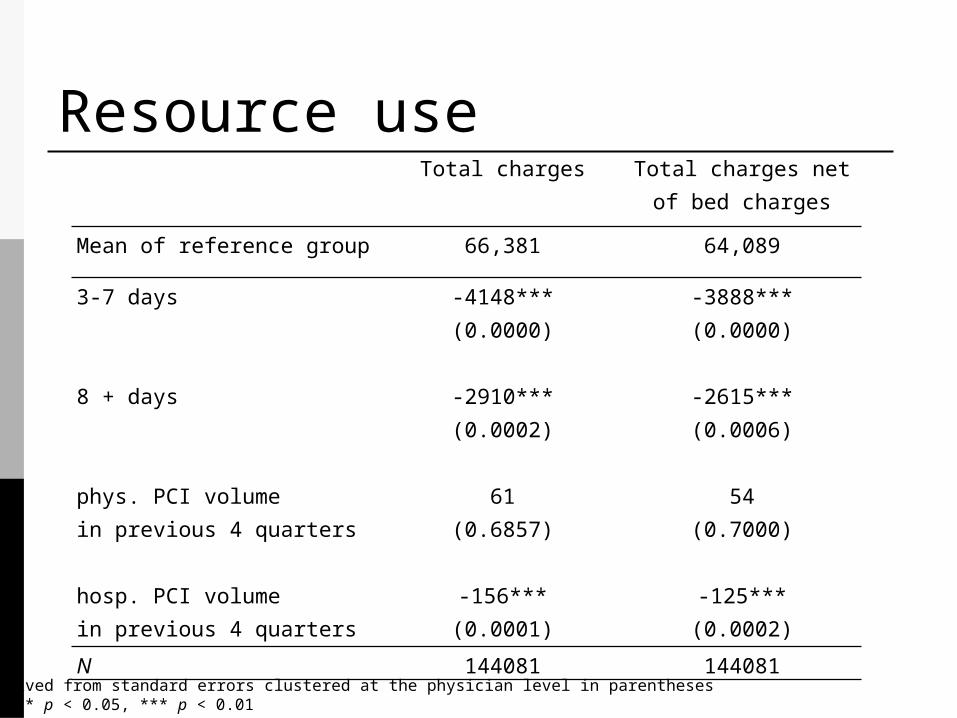
Resource use Total charges Total charges net of bed
charges
Mean of reference group 66,381 64,089
3-7 days -4148*** -3888*** (0.0000) (0.0000) 8 + days -2910*** -2615*** (0.0002) (0.0006) phys. PCI volume 61 54in previous 4 quarters (0.6857) (0.7000) hosp. PCI volume -156*** -125***in previous 4 quarters (0.0001) (0.0002)
N 144081 144081
P-values derived from standard errors clustered at the physician level in parentheses* p < 0.10, ** p < 0.05, *** p < 0.01

Simulation-Back of the envelopeAbout 94 lives would have been preserved over 4 years in PA if all PCI patients were treated by those with higher levels of human capital (i.e. those operating w/ a 0-2 day temporal distance).
Extending these lives would have led to $117.5 M in total charges in treating PCI patients (about a 1.22% increase), or a cost of life extended of about $1.24M

Limitations and extensions
We have access to dates but not time of day of procedures.
We do not know the reason for these breaks from the OR
Further work is needed to ascertain the nature of this effect