South Africa: Labor Market Dynamics and Inequality; by Rahul ...

Ecological Economics 101 (2014) 90–102
Contents lists available at ScienceDirect
Ecological Economics
j ourna l homepage: www.e lsev ie r .com/ locate /eco lecon
Methodological and Ideological Options
Human and nature dynamics (HANDY): Modeling inequality and use ofresources in the collapse or sustainability of societies
Safa Motesharrei a,⁎, Jorge Rivas b, Eugenia Kalnay c
a School of Public Policy and Department of Mathematics, University of Maryland; and National Socio-Environmental Synthesis Center (SESYNC)b Department of Political Science, University of Minnesota; and Institute of Global Environment and Society (IGES)c Department of Atmospheric and Oceanic Science and Institute of Physical Science and Technology, University of Maryland
⁎ Corresponding author.E-mail addresses: [email protected] (S. Motesharrei), jorg
(J. Rivas), [email protected] (E. Kalnay).
http://dx.doi.org/10.1016/j.ecolecon.2014.02.0140921-8009 © 2014 The Authors. Published by Elsevier B.V
a b s t r a c t
a r t i c l e i n f oArticle history:Received 1 October 2012Received in revised form 11 February 2014Accepted 18 February 2014Available online 2 April 2014
Keywords:Human–nature dynamicsSocietal collapseCarrying capacityOvershoot vs. sustainabilityEconomic inequalityEcological strain
There are widespread concerns that current trends in resource-use are unsustainable, but possibilities ofovershoot/collapse remain controversial. Collapses have occurred frequently in history, often followed by centu-ries of economic, intellectual, and population decline. Many different natural and social phenomena have beeninvoked to explain specific collapses, but a general explanation remains elusive.In this paper, we build a human population dynamics model by adding accumulated wealth and economic in-equality to a predator–prey model of humans and nature. The model structure, and simulated scenarios thatoffer significant implications, are explained. Four equations describe the evolution of Elites, Commoners, Nature,andWealth. The model shows Economic Stratification or Ecological Strain can independently lead to collapse, inagreement with the historical record.Themeasure “Carrying Capacity” is developed and its estimation is shown to be a practicalmeans for early detec-tion of a collapse. Mechanisms leading to two types of collapses are discussed. The new dynamics of this modelcan also reproduce the irreversible collapses found inhistory. Collapse can be avoided, and population can reach asteady state atmaximum carrying capacity if the rate of depletion of nature is reduced to a sustainable level and ifresources are distributed equitably.
© 2014 The Authors. Published by Elsevier B.V. Open access under CC BY license.
1. Introduction
There are widespread concerns that current trends in populationand resource-use are unsustainable, but the possibilities of an overshootand collapse remain unclear and controversial. How real is the possi-bility of a societal collapse? Can complex, advanced civilizations reallycollapse? It is common to portray human history as a relentless and in-evitable trend toward greater levels of social complexity, political orga-nization, and economic specialization, with the development of morecomplex and capable technologies supporting ever-growing popula-tion, all sustained by the mobilization of ever-increasing quantities ofmaterial, energy, and information. Yet this is not inevitable. In fact,cases where this seemingly near-universal, long-term trend has beenseverely disrupted by a precipitous collapse – often lasting centuries –have been quite common. A brief review of some examples of collapsessuggests that the process of rise-and-collapse is actually a recurrentcycle found throughout history, making it important to establish a
. Open access under CC BY license.
general explanation of this process (Chase-Dunn and Hall, 1997; Gold-stein, 1988; Meadows et al., 1972; Modelski, 1987; Tainter, 1988;Turchin and Nefedov, 2009; Yoffee and Cowgill, 1988).
The Roman Empire's dramatic collapse (followed bymany centuriesof population decline, economic deterioration, intellectual regression,and the disappearance of literacy) is well known, but it was not thefirst rise-and-collapse cycle in Europe. Prior to the rise of ClassicalGreco-Roman civilization, both the Minoan and Mycenaean Civiliza-tions had each risen, reached very advanced levels of civilization, andthen collapsed virtually completely (Morris, 2006; Redman, 1999).The history of Mesopotamia – the very cradle of civilization, agriculture,complex society, and urban life–presents a series of rise-and-declines in-cluding the Sumerians, the Akkadian, Assyrian, Babylonian, Achaemenid,Seleucid, Parthian, Sassanid, Umayyad, and Abbasid Empires (Redmanet al., 2004; Yoffee, 1979). In neighboring Egypt, this cycle also appearedrepeatedly. In both Anatolia and in the Indus Valley, the very large andlong-lasting Hittite and Harrapan civilizations both collapsed socompletely that their very existencewas unknown until modern arche-ology rediscovered them. Similar cycles of rise and collapse occurred re-peatedly in India, most notably with the Mauryan and the GuptaEmpires (Edwards et al., 1971, 1973; Jansen et al., 1991; Kenoyer,1998; Thapar, 2004). Southeast Asia similarly experienced “multiple

91S. Motesharrei et al. / Ecological Economics 101 (2014) 90–102
and overlapping histories of collapse and regeneration” over 15 centu-ries, culminating in the Khmer Empire based in Angkor, which itselfwas depopulated and swallowed by the forest during the 15th Century(Stark, 2006). Chinese history is, verymuch like Egypt's, full of repeatedcycles of rises and collapses, with each of the Zhou, Han, Tang, and SongEmpires followedby a very serious collapse of political authority and so-cioeconomic progress (Chu and Lee, 1994; Lee, 1931; Needham andWang, 1956).
Collapses are not restricted to the “OldWorld”. The collapse of MayaCivilization is well known and evokes widespread fascination, both be-cause of the advanced nature ofMayan society and because of the depthof the collapse (Demerest et al., 2004; Webster, 2002). As Diamond(2005) puts it, it is difficult to ignore “the disappearance of between90 and 99% of the Maya population after A.D. 800…and the disappear-ance of kings, Long Count calendars, and other complex political andcultural institutions.” In the nearby central highlands of Mexico, anumber of powerful states also rose to high levels of power and prosper-ity and then rapidly collapsed, Teotihuacan (the sixth largest city in theworld in the 7th C) and Monte Alban being just the largest of these toexperience dramatic collapse, with their populations declining toabout 20–25% of their peak within just a few generations (Tainter,1988).
We know of many other collapses including Mississippian Culturessuch as Cahokia, South West US cultures such as the Pueblo andHohokam, Andean civilizations such as Tiwanaku, Sub-Saharan civiliza-tions such as Great Zimbabwe, and many collapses across the PacificIslands, such as Easter Island. It is also likely other collapses have alsooccurred in societies that were not at a sufficient level of complexityto produce written records or archeological evidence. Indeed, a recentstudy (Shennan et al., 2013) of the Neolithic period in Europe hasshown that “in contrast to the steady population growth usually as-sumed, the introduction of agriculture into Europe was followed by aboom-and-bust pattern in the density of regional populations”. Further-more “most regions show more than one boom–bust pattern”, and inmost regions, population declines “of the order of the 30–60%” can befound. The authors also argue that, rather than climate change ordiseases, the timing and evidence point to endogenous causes forthese collapses in 19 out of 23 cases studied, suggesting the possibil-ity of “rapid population growth driven by farming to unsustainablelevels”. Moreover, through wavelet analysis of the archeological data,S. Downey [personal communication] has shown that the averagelength of such boom-and-bust cycles is about 300–500 years.
In summary, despite the common impression that societal collapse israre, or even largely fictional, “the picture that emerges is of a processrecurrent in history, and global in its distribution” (Tainter, 1988). Seealso Yoffee and Cowgill (1988), Goldstein (1988), Ibn Khaldun (1958),Kondratieff (1984), and Parsons (1991). As Turchin and Nefedov(2009) contend, there is a great deal of support for “the hypothesisthat secular cycles — demographic–social–political oscillations of avery long period (centuries long) are the rule, rather than an exceptionin the large agrarian states and empires.”
This brings up the question of whether modern civilization is simi-larly susceptible. It may seem reasonable to believe that modern civili-zation, armed with its greater technological capacity, scientificknowledge, and energy resources, will be able to survive and endurewhatever crises historical societies succumbed to. But the brief over-view of collapses demonstrates not only the ubiquity of the phenome-non, but also the extent to which advanced, complex, and powerfulsocieties are susceptible to collapse. The fall of the Roman Empire, andthe equally (if not more) advanced Han, Mauryan, and Gupta Empires,as well as so many advanced Mesopotamian Empires, are all testimonyto the fact that advanced, sophisticated, complex, and creative civiliza-tions can be both fragile and impermanent.
A large number of explanations have been proposed for each specificcase of collapse, including one or more of the following: volcanoes,earthquakes, droughts, floods, changes in the courses of rivers, soil
degradation (erosion, exhaustion, salinization, etc.), deforestation, cli-mate change, tribalmigrations, foreign invasions, changes in technology(such as the introduction of ironworking), changes in the methods orweapons of warfare (such as the introduction of horse cavalry, armoredinfantry, or long swords), changes in trade patterns, depletion of partic-ular mineral resources (e.g., silver mines), cultural decline and socialdecadence, popular uprisings, and civil wars. However, these explana-tions are specific to each particular case of collapse rather than general.Moreover, even for the specific case where the explanation applies, thesociety in question usually had already experienced the phenomenonidentified as the cause without collapsing. For example, the Minoan so-ciety had repeatedly experienced earthquakes that destroyed palaces,and they simply rebuilt them more splendidly than before. Indeed,many societies experience droughts, floods, volcanoes, soil erosion,and deforestation with no major social disruption (Tainter, 1988).
The same applies to migrations, invasions, and civil wars. TheRoman, Han, Assyrian, and Mauryan Empires were, for centuries, com-pletely militarily hegemonic, successfully defeating the neighboring“barbarian” peoples who eventually did overrun them. So externalmilitary pressure alone hardly constitutes an explanation for theircollapses. With both natural disasters and external threats, identifyinga specific cause compels one to ask, “yes, but why did this particularinstance of this factor produce the collapse?” Other processes must beinvolved, and, in fact, the political, economic, ecological, and technolog-ical conditions under which civilizations have collapsed have variedwidely. Individual collapses may have involved an array of specific fac-tors, with particular triggers, but a general explanation remains elusive.Individual explanations may seem appropriate in their particular case,but the very universal nature of the phenomenon implies a mechanismthat is not specific to a particular time period of human history, nor aparticular culture, technology, or natural disaster (Tainter, 1988;Turchin, 2003; Yoffee and Cowgill, 1988).
In this paperwe attempt tomodel collapsemathematically in amoregeneralway.We propose a simplemodel, not intended to describe actu-al individual cases, but rather to provide a general framework thatallows carrying out “thought experiments” for the phenomenon ofcollapse and to test changes that would avoid it. This model (calledHANDY, for Human and Nature DYnamics) advances beyond existingbiological dynamic population models by simultaneously modelingtwo separate important features which seem to appear across somany societies that have collapsed: (1) the stretching of resources dueto the strain placed on the ecological carrying capacity (Abel, 1980;Catton, 1980; Kammen, 1994; Ladurie, 1987; Ponting, 1991; Postan,1966; Redman, 1999; Redman et al., 2004; Wood, 1998; Wright,2004), and (2) the economic stratification of society into Elites andMasses (or “Commoners”) (Brenner, 1985; Parsons, 1991; Turchin,2005, 2006; Turchin and Nefedov, 2009; Diamond, 2005; Goldstone,1991; Ibn Khaldun, 1958). Inmany of these historical cases, we have di-rect evidence of Ecological Strain and Economic Stratification playing acentral role in the character or in the process of the collapse (Culbert,1973; Diamond, 2005; Goldstone, 1991; Lentz, 2000; Mitchell, 1990).For these empirical reasons, and the theoretical ones explained inSection 3, our model incorporates both of these two features. Althoughsimilar to the Brander and Taylor (1998)model (hereafter referred to as“BT”) in that HANDY is based on the classical predator–prey model, theinclusion of two societal classes introduces a much richer set of dynam-ical solutions, including cycles of societal and ecological collapse, aswellas the possibility of smoothly reaching equilibrium (the ecological car-rying capacity). We use Carrying Capacity in its biological definition:the population level that the resources of a particular environmentcan sustain over the long term (Catton, 1980; Cohen, 1995; Daly andFarley, 2003). In this paper, we call these environment resources“Nature”.
The paper is organized as follows: Section 2 gives a brief review ofthe predator–preymodel; Section 3 includes themathematical descrip-tion of HANDY; Section 4 covers a theoretical analysis of the model
92 S. Motesharrei et al. / Ecological Economics 101 (2014) 90–102
equilibrium and possible solutions; Section 5 presents examples of sce-narios within three distinct types of societies; Section 6 gives an overalldiscussion of the scenarios from Section 5; and Section 7 offers a shortsummary of the paper and a discussion of future work.
2. Predator–Prey Model
The predator–prey model, the original inspiration behind HANDY,was derived independently by two mathematicians, Alfred Lotka andVitto Volterra, in the early 20th century (Lotka, 1925; Volterra, 1926).Thismodel describes the dynamics of competition between two species,say, wolves and rabbits. The governing system of equations is
x ¼ ayð Þx−bxy ¼ cy− dxð Þy :
�ð1Þ
In the above system, x represents the predator (wolf) population; yrepresents the prey (rabbit) population; a determines the predator'sbirth rate, i.e., the faster growth of wolf population due to availabilityof rabbits; b is the predator's death rate; c is the prey's birth rate; d de-termines the predation rate, i.e., the rate at which rabbits are hunted bywolves.
Rather than reaching a stable equilibrium, the predator and preypopulations show periodic, out-of-phase variations about the equilibri-um values
xe ¼ c=dye ¼ b=a
:
�ð2Þ
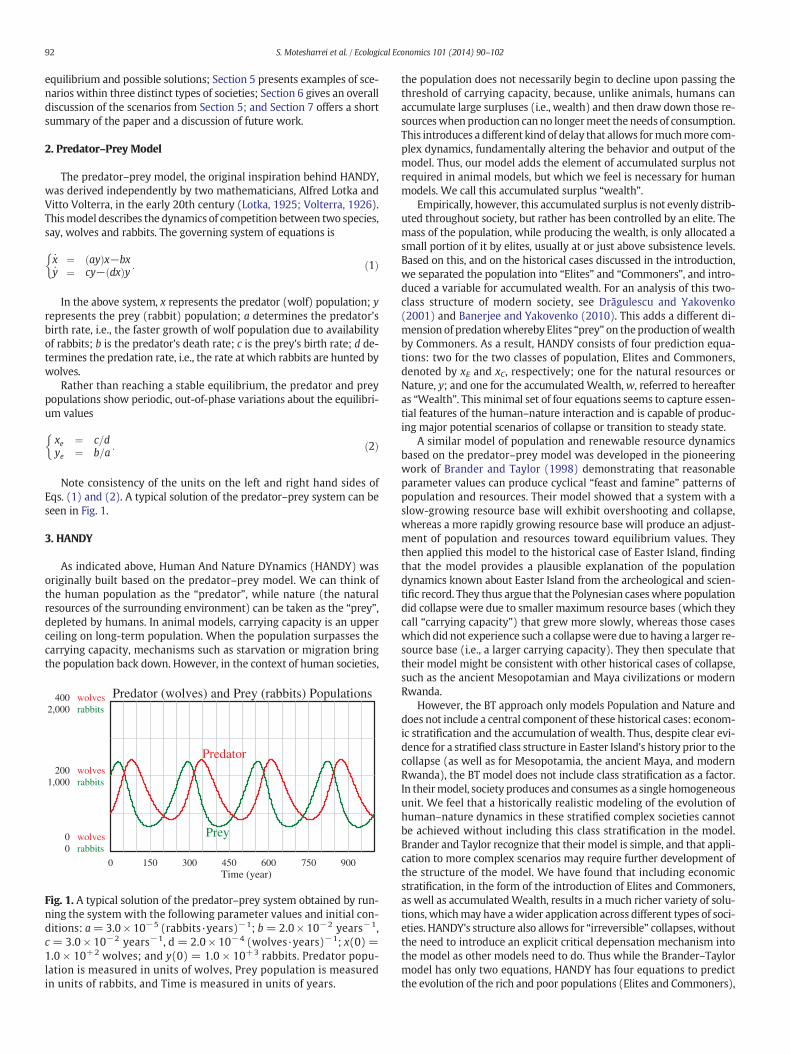
Note consistency of the units on the left and right hand sides ofEqs. (1) and (2). A typical solution of the predator–prey system can beseen in Fig. 1.
3. HANDY
As indicated above, Human And Nature DYnamics (HANDY) wasoriginally built based on the predator–prey model. We can think ofthe human population as the “predator”, while nature (the naturalresources of the surrounding environment) can be taken as the “prey”,depleted by humans. In animal models, carrying capacity is an upperceiling on long-term population. When the population surpasses thecarrying capacity, mechanisms such as starvation or migration bringthe population back down. However, in the context of human societies,
Predator (wolves) and Prey (rabbits) Populations400 wolves2,000 rabbits
200 wolves1,000 rabbits
0 wolves0 rabbits
Time (year)
Predator
Prey
Fig. 1. A typical solution of the predator–prey system obtained by run-ning the system with the following parameter values and initial con-ditions: a=3.0 × 10⁻⁵ (rabbits·years)−1; b= 2.0 × 10⁻² years−1,c = 3.0 × 10⁻² years−1, d = 2.0 × 10⁻⁴ (wolves·years)−1; x(0) =1.0 × 10+2 wolves; and y(0) = 1.0 × 10+3 rabbits. Predator popu-lation is measured in units of wolves, Prey population is measuredin units of rabbits, and Time is measured in units of years.
the population does not necessarily begin to decline upon passing thethreshold of carrying capacity, because, unlike animals, humans canaccumulate large surpluses (i.e., wealth) and then draw down those re-sourceswhen production can no longermeet the needs of consumption.This introduces a different kind of delay that allows formuchmore com-plex dynamics, fundamentally altering the behavior and output of themodel. Thus, our model adds the element of accumulated surplus notrequired in animal models, but which we feel is necessary for humanmodels. We call this accumulated surplus “wealth”.
Empirically, however, this accumulated surplus is not evenly distrib-uted throughout society, but rather has been controlled by an elite. Themass of the population, while producing the wealth, is only allocated asmall portion of it by elites, usually at or just above subsistence levels.Based on this, and on the historical cases discussed in the introduction,we separated the population into “Elites” and “Commoners”, and intro-duced a variable for accumulated wealth. For an analysis of this two-class structure of modern society, see Drăgulescu and Yakovenko(2001) and Banerjee and Yakovenko (2010). This adds a different di-mension of predationwhereby Elites “prey” on theproduction ofwealthby Commoners. As a result, HANDY consists of four prediction equa-tions: two for the two classes of population, Elites and Commoners,denoted by xE and xC, respectively; one for the natural resources orNature, y; and one for the accumulatedWealth,w, referred to hereafteras “Wealth”. This minimal set of four equations seems to capture essen-tial features of the human–nature interaction and is capable of produc-ing major potential scenarios of collapse or transition to steady state.
A similar model of population and renewable resource dynamicsbased on the predator–prey model was developed in the pioneeringwork of Brander and Taylor (1998) demonstrating that reasonableparameter values can produce cyclical “feast and famine” patterns ofpopulation and resources. Their model showed that a system with aslow-growing resource base will exhibit overshooting and collapse,whereas a more rapidly growing resource base will produce an adjust-ment of population and resources toward equilibrium values. Theythen applied this model to the historical case of Easter Island, findingthat the model provides a plausible explanation of the populationdynamics known about Easter Island from the archeological and scien-tific record. They thus argue that the Polynesian caseswhere populationdid collapse were due to smaller maximum resource bases (which theycall “carrying capacity”) that grew more slowly, whereas those caseswhich did not experience such a collapsewere due to having a larger re-source base (i.e., a larger carrying capacity). They then speculate thattheir model might be consistent with other historical cases of collapse,such as the ancient Mesopotamian and Maya civilizations or modernRwanda.
However, the BT approach only models Population and Nature anddoes not include a central component of these historical cases: econom-ic stratification and the accumulation of wealth. Thus, despite clear evi-dence for a stratified class structure in Easter Island's history prior to thecollapse (as well as for Mesopotamia, the ancient Maya, and modernRwanda), the BT model does not include class stratification as a factor.In theirmodel, society produces and consumes as a single homogeneousunit. We feel that a historically realistic modeling of the evolution ofhuman–nature dynamics in these stratified complex societies cannotbe achieved without including this class stratification in the model.Brander and Taylor recognize that their model is simple, and that appli-cation to more complex scenarios may require further development ofthe structure of the model. We have found that including economicstratification, in the form of the introduction of Elites and Commoners,as well as accumulatedWealth, results in a much richer variety of solu-tions, whichmay have awider application across different types of soci-eties. HANDY's structure also allows for “irreversible” collapses, withoutthe need to introduce an explicit critical depensation mechanism intothe model as other models need to do. Thus while the Brander–Taylormodel has only two equations, HANDY has four equations to predictthe evolution of the rich and poor populations (Elites and Commoners),

93S. Motesharrei et al. / Ecological Economics 101 (2014) 90–102
Nature, and accumulated Wealth (we examine other differences inSection 6.4 of the paper) The HANDY equations are given by:
xC ¼ βCxC−αCxCxE ¼ βExE−αExEy¼ γy λ−yð Þ−δxCyw¼ δxCy−CC−CE:
8>><>>:
ð3Þ
It is to be noted thatαC,αE, CC, and CE are all functions ofw, xC, and xE.See Eqs. (4) and (6) and Fig. 2a and b.
3.1. Model Description
The total population is divided between the two variables, xC and xE,representing the population of commoners and of elites. The populationgrows through a birth rate β and decreases through a death rate α. β isassumed to be constant for both Elites and Commoners but α dependson Wealth as explained below.
In reality, natural resources exist in three forms: nonrenewablestocks (fossil fuels, mineral deposits, etc.), regenerating stocks (forests,soils, animal herds, wild fish stocks, game animals, aquifers, etc.), andrenewable flows (wind, solar radiation, precipitation, rivers, etc.). Fu-ture generations of the model will disaggregate these forms. We haveadopted a single formulation intended to represent an amalgamationof the three forms, allowing for a clear understanding of the role thatnatural resources play in collapse or sustainability of human societies.
Thus, the equation for Nature includes a regeneration term,γy(λ − y), and a depletion term, −δxCy. The regeneration term hasbeen written in the form of a logistic equation, with a regeneration fac-tor, γ, exponential regrowth for low values of y, and saturation when yapproaches λ, Nature's capacity — maximum size of Nature in absenceof depletion. As a result, the maximum rate of regeneration takesplace when y = λ / 2. Production is understood according to the stan-dard Ecological Economics formulations as involving both inputs from,and outputs to, Nature (i.e., depletion of natural sources and pollutionof natural sinks) (Daly, 1996; Daly and Farley, 2003). This first genera-tion of HANDYmodels the depletion side of the equation as if it includesthe reduction in Nature due to pollution.
The depletion term includes a rate of depletion per worker, δ, andis proportional to both Nature and the number of workers. However,the economic activity of Elites is modeled to represent executive,management, and supervisory functions, but not engagement in the di-rect extraction of resources, which is done by Commoners. Thus, onlyCommoners produce.
a) Consumption rates in HANDY
Fig. 2. Per capita Consumption rates and Death rates for Elites and Commonmoners start experiencing famine when w
wth≤1, while Elites do not experi
Wealth.
It is frequently claimed that technological change can reduce resourcedepletion and therefore increase carrying capacity. However, the effectsof technological change on resource use are not unidirectional. Techno-logical change can raise the efficiency of resource use, but it also tends toraise both per capita resource consumption and the scale of resource ex-traction, so that, absent policy effects, the increases in consumptionoften compensate for the increased efficiency of resource use. Theseare associated with the phenomena referred to as the Jevons Paradox,and the “Rebound Effect” (Greening et al., 2000; Polimeni et al., 2008;Ruth, 2009). For example, an increase in vehicle fuel efficiency tendsto enable increased per capita vehicle miles driven, heavier cars, andhigher average speeds, which then negate the gains from the increasedfuel-efficiency. In addition, technological advances can enable greaterresource extraction and throughput, which then appears as increasesin the productivity of other factors of production. As Daly points out,much of the increase in productivity in both agriculture and industryin the last two centuries has actually come from increased (ratherthan decreased) resource throughput (Daly, 1991). A decline in theprice of a resource is usually thought to reflect an increase in the abun-dance of that resource, but in fact, it often reflects that the resource issimply being extracted more rapidly. Rather than extend carrying ca-pacity, this reduces it. Over the long-term, per capita resource-use hastended to rise over time despite dramatic technological advances in re-source efficiency. Thus, the sign and magnitude of the effect of techno-logical change on resource use varies and the overall effect is difficultto predict. Therefore, in this generation of HANDY, we assume that theeffects of these trends cancel each other out. The model will be devel-oped further to allow the rates of these technology-induced trends tobe adjusted in either direction.
Finally, there is an equation for accumulatedWealth,which increaseswith production, δxCy, and decreases with the consumption of the Elitesand the Commoners, CC and CE, respectively. The consumption of theCommoners (as long as there is enough wealth to pay them) is sxC, asubsistence salary per capita, s, multiplied by the working population.The Elites pay themselves a salary κ times larger, so that the consump-tion of the Elites is κsxE. However, when the wealth becomes too smallto pay for this consumption, i.e., when w b wth, the payment is reducedand eventually stopped, and famine takes place, with amuchhigher rateof death. κ is meant to represent here the factors that determine the di-vision of the output of the total production of society between elites andmasses, such as the balance of class power between elites and masses,and the capacity of each group to organize and pursue their economicinterests.We recognize the inherent limitations, in this initial generationof our model, of holding that balance (κ) constant in each scenario, butwe expect to develop κ further in later generations of HANDY so that itcan be endogenously determined by other factors in the model.
b) Death rates in HANDY
ers as a function of Wealth. Famine starts when Csx ≤1. Therefore, Com-
ence famine until wwth
≤ 1κ . This delay is due to Elites' unequal access to

94 S. Motesharrei et al. / Ecological Economics 101 (2014) 90–102
CC and CE, the consumption rates for the Commoner and the Elite re-spectively, are given by the following equations:
CC ¼ min 1;wwth
� �sxC
CE ¼ min 1;wwth
� �κsxE
:
8>><>>:
ð4Þ
Wealth threshold, wth, is a threshold value for wealth below whichfamine starts. It depends on the “minimum required consumption percapita”, ρ:
wth ¼ ρxC þ κρxE: ð5Þ
Even when Commoners start experiencing famine, i.e., when w ≤wth, the Elites continue consuming unequally as indicated by the factorκ in the second term on the right hand side of Eq. (5). A graphical repre-sentation of the consumption rates are given in Fig. 2a.
The death rates for the Commoner and the Elite, αC and αE, are func-tions of consumption rates:
αC ¼ αm þmax 0;1− CC
sxC
� �αM−αmð Þ
αE ¼ αm þmax 0;1− CE
sxE
� �αM−αmð Þ
:
8>><>>:
ð6Þ
The death rates vary between a normal (healthy) value, αm, ob-served when there is enough food for subsistence, and a maximum(famine) value, αM that prevails when the accumulated wealth hasbeen used up and the population starves. There are a variety of mecha-nisms which can reduce population when it exceeds carrying capacity,including everything from emigration, increased disease susceptibility,and outright starvation to breakdowns in social order and increased so-cial violence, such as banditry, riots, rebellions, revolutions, and wars.These mechanisms are described in detail in Turchin (2003) but thenet effect of all of them is a reduction in population, and that is whatthe dynamics of ourmodel is meant to represent whenwe say “popula-tion decline” or “famine”. Note also that an increase in the death rates(α) is equivalent to an equal decrease in the birth rates (β). The deathrates αC and αE can be expressed in terms of w
wth, a graphical representa-
tion of which is given Fig. 2b.
3.2. A Note on Units and Dimensions
There are three dimensions for quantities in HANDY:
1. Population (either Commoner or Elite), in units of people.2. Nature/Wealth, in units of “eco-Dollars”.3. Time, in units of years.
The structure of the model requires Nature and Wealth to be mea-sured with the same units, therefore we created the unit eco-dollar.Other parameters and functions in the model carry units that are com-patible with the abovementioned dimensions following Eq. (3). For ex-ample, Carrying Capacity, χ, and the Maximum Carrying Capacity, χM,defined in Section 4.1, are both expressed in units of people.
4. Equilibrium Values and Carrying Capacity
We can use the model to find a sustainable equilibrium and maxi-mum carrying capacity in different types of societies. In order for popu-lation to reach an equilibrium, we must have αm ≤ βE ≤ βC ≤ αM. Wedefine a dimensionless parameter, η:
η ¼ αM−βC
αM−αm: ð7Þ
Since we assume αm ≤ βC ≤ αM, η will always be bounded by 0 ≤η ≤ 1.
4.1. Equilibrium when xE = 0 (No Elites): Egalitarian Society
Assuming xE ≡ 0, we can find the equilibrium values of the system(subscript “e” denotes the equilibrium values):
xC;e ¼ γδ
λ−ηsδ
� �
ye ¼ ηsδ
we ¼ ηρxC;e
:
8>><>>:
ð8Þ
We defineχ, the Carrying Capacity for the population, to be equal toxC,e in Eq. (8), i.e., the equilibrium value of the population in the absenceof Elites:
χ ¼ γδ
λ−ηsδ
� �: ð9Þ
Carrying Capacity can be maximized if Nature's regeneration rate ismaximal, i.e., if ye ¼ λ
2. This requires δ to be set equal to a value δ* thatcan result in a steady statewith themaximum (sustainable) Population,which in this paper we call the “optimal” value of δ. From the secondequation in Eq. (8), it can be seen that δ* is given by:
δ� ¼2ηsλ
: ð10Þ
The Maximum Carrying Capacity, χM, is thus given by:
χM ¼ γδ�
λ2¼ γ
ηsλ2
� �2: ð11Þ
4.2. Equilibrium when xE ≥ 0 and κ=1 (No Inequality): Equitable Society
If we set κ ≡ 1 and βE ≡ βC ≡ β, we can reach an equilibrium state forwhich xE ≥ 0. This case models an equitable society of “Workers” and“Non-Workers”. We need a dimensionless free parameter φ that setsthe initial ratio of the Non-Workers to Workers:
φ ¼ xE 0ð ÞxC 0ð Þ : ð12Þ
The equilibrium values of the system can then be expressed asfollows:
xC;e ¼ γδ
λ−ηsδ
1þ φð Þ� �
xE;e ¼ φxC;eye ¼ η
sδ
1þ φð Þwe ¼ ηρ 1þ φð ÞxC;e
:
8>>>><>>>>:
ð13Þ
The total population xe= xC,e+ xE,e can still bemaximized by choos-ing δ appropriately:
δ�� ¼2ηsλ
1þ φð Þ: ð14Þ
This δ** is larger than the optimal depletion factor given by Eq. (10).The difference arises becauseWorkers have to produce more than theyneed just for themselves in order to support Non-Workers. For thischoice of δ, total population is given by:
xe;M ¼ 1þ φð Þ γδ��
λ2¼ γ
ηsλ2
� �2: ð15Þ

Table 1Description of parameters and state variables used in HANDY. κ, δ, and xE are varied tostudy various scenarios in three different types of societies. xE = 0 defines an Egalitariansociety with no Elites. κ = 1 defines an Equitable society with Workers and Non-Workers, represented by xC and xE in this case, respectively. xE≥ 0 and κ N 1 define an un-equal societywith Elites and Commoners (xE and xC). As a reference, all other variables andfunctions in HANDY are also listed above. Subscript e denotes equilibrium value every-where in this paper.
Parameter symbol Parameter name Typical value(s)
αm Normal (minimum) death rate 1.0 × 10⁻²
αM Famine (maximum) death rate 7.0 × 10⁻²
βC Commoner birth rate 3.0 × 10⁻²
βE Elite birth rate 3.0 × 10⁻²
s Subsistence salary per capita 5.0 × 10⁻⁴
ρ Threshold wealth per capita 5.0 × 10⁻³
γ Regeneration rate of nature 1.0 × 10⁻²
λ Nature carrying capacity 1.0 × 10+2
κ Inequality factor 1, 10, 100δ Depletion (production) factor None
Variable symbol Variable name Typical initial value(s)
xC Commoner population 1.0 × 10+2
xE Elite population 0, 1, 25y Nature λw Accumulated wealth 0
(a). List of parameters in HANDY. κ and δ take different values for different scenarios.(b). List of state variables in HANDY. xE(0) takes different values for different scenarios.
Table 2As a reference, all other variables and functions in HANDY are listed in this table. Subscripte denotes equilibrium value everywhere in this paper.
Variablesymbol
Variable name Defining equation
wth Threshold wealth Eq. (5)ω Normalized wealth w / wth
CC Commoner consumption Eq. (4) (Fig. 2a)CE Elite consumption Eq. (4) (Fig. 2a)αC Commoner death rate Eq. (6) (Fig. 2b)αE Elite death rate Eq. (6) (Fig. 2b)η η Eq. (7)χ Carrying Capacity (CC) Eq. (9)δ* Egalitarian optimal δ Eq. (10)χM Maximum Carrying Capacity (Max CC) Eq. (11)φ Ratio of non-workers to workers (Equitable) Eq. (12)δ** Equitable optimal δ Eq. (14)ψ Elite to commoner equilibrium ratio (Unequal) xE,e / xC,eδ*** Unequal optimal δ Eq. (18)
95S. Motesharrei et al. / Ecological Economics 101 (2014) 90–102
As can be seen from Eq. (15), maximum total population in equilib-rium is independent ofφ and conforms to themaximumcarrying capac-ity given above by Eq. (11).
4.3. Equilibrium when xE ≥ 0 and κ N 1: Unequal Society
It is possible to attain equilibrium in anunequal society if we can sat-isfy the following condition:
αM−βE
κ αM−αmð Þ ¼αM−βC
αM−αm¼ η: ð16Þ
(The general condition αm ≤ βE ≤ βC ≤ αM must hold in all cases foran equilibrium to be feasible.)
The equilibrium values in this general case can be expressed asfollows:
xC;e ¼γδ
λ−ηsδ
1þ κψð Þ� �
xE;e ¼ ψxC;eye ¼ η
sδ
1þ κψð Þwe ¼ ηρ 1þ κψð ÞxC;e
:
8>>>>><>>>>>:
ð17Þ
The free parameter, ψ, is the equilibrium ratio xE,e/xC,e, apparent fromthe second equation in Eq. (17). As opposed to φ, ψ cannot be easily re-lated to the initial conditions; rather, it can be determined from the re-sult of a simulation.
Again, the total population xe = xC,e + xE,e can be maximized bychoosing δ appropriately:
δ��� ¼2ηsλ
1þ κψð Þ: ð18Þ
This required depletion rate δ*** can be even larger than the optimalδ given by Eq. (14) depending upon the values of κ and ψ. In thepresence of inequality, themaximum total population is no longer inde-pendent of κ and ψ and is smaller than the maximum carrying capacitygiven by Eqs. (11) and (15):
xe;M ¼ 1þ ψð Þ γδ���
λ2¼ γ
ηsλ2
� �2 1þ ψ1þ κψ
� �: ð19Þ
5. Scenarios
We discuss three sets of scenarios:
1. Egalitarian society (No-Elites): Scenarios in which xE = 0.2. Equitable society (with Workers and Non-Workers): Scenarios in
which xE ≥ 0 but κ ≡ 1.3. Unequal society (with Elites and Commoners): Scenarios in which
xE ≥ 0 and κ N 1.
For all of these scenarios, we start themodel with the typical param-eter values and initial conditions given in Table 1, unless otherwise stat-ed. As indicated above, the values of κ and xE(0) determine the type ofthe society. Within each type of society, we obtain different scenariosby varying the depletion factor, δ.
In this section, we will show that HANDY is capable of modelingthree distinct types of societies by changing κ and xE(0). A sustainableequilibrium can be found for each society by controlling δ. An appropri-ate choice of δ can make this equilibrium optimal, i.e., with maximumtotal population. Increasing δ above its optimal value makes the ap-proach toward equilibrium oscillatory. Such an equilibrium is subopti-mal, and the Carrying Capacity is below its maximum value, χM. It isalso possible to reach a suboptimal equilibrium (a less than maximum,but sustainable population) by making δ lower than its optimal value.
However, in the latter case, the approach toward equilibrium wouldbe a soft landing rather than oscillatory. When δ is increased evenfurther, the society goes into cycles of prosperity and collapse. Increas-ing δ beyond a certain point will result in an irreversible Type-N (full)collapse, examples of which are presented in Sections 5.1.4, 5.2.4,and 5.3.2. We give a full categorization of collapses in the next twoparagraphs.
Running themodel in different scenarios produces two kinds of col-lapses, either due to scarcity of labor (following an inequality-inducedfamine) or due to scarcity of Nature (depletion of natural resources).We categorize the former case as a Type-L (Disappearance of Labor)Collapse and the latter as a Type-N collapse (Exhaustion of Nature). Ina Type-L collapse, growth of the Elite Population strains availability ofresources for the Commoners. This causes decline of the CommonerPopulation (whichdoes the labor), and consequently, decline ofWealth.Finally, Elite Population plummets since its source of subsistence,i.e., Wealth, has vanished. See Fig. 6a for an example of a Type-L col-lapse. This could represent a historical case such as the disappearanceof the Mayan civilization in the Yucatan. Note that this type of collapsecan only happen in an unequal society, because themajor cause behindit is inequality.

a) Soft landing to the optimal equilibrium when Elite
population (marked in red) equals zero. Final population
reaches the carrying capacity, which is at its maximum
value, , in this scenario.
Egalitarian Society: Soft Landing to Optimal Equilibrium114
0.50.5
2
000
Time (Year)
NatureWealth
Commoners
CarryingCapacity
Egalitarian Society: Oscillatory Approach to Equilibrium
Time (Year)
20
10
21
10.5
000
Nature
Wealth
CommonersCarryingCapacity
b) Oscillatory approach to equilibrium when Elite popu-
lation (marked in red) equals zero. Final population co-
nverges to the carrying capacity, which is lower than its
maximum value, , in this scenario.
Egalitarian Society: Cycles of Prosperity and Reversible,Type-N Collapses
20
10
Time (Year)
21
10.5
000
Nature
WealthCommoners
CarryingCapacity
c) Cycles of prosperity, overshoot, (reversible Type-N)
collapse, and revival when Elite population (marked in
red) equals zero.
Egalitarian Society: Irreversible, Type-N (Full) Collapse
Time (Year)
20
10
21
10.5
000
Nature Wealth
Commoners
Carrying Capacity
d) Irreversible Type-N collapse (full collapse) when Elite
population (marked in red) equals zero. All the state va-
riables collapse to zero in this scenario due to over-
depletion.
Fig. 3. Experiment results for the Egalitarian society.
96 S. Motesharrei et al. / Ecological Economics 101 (2014) 90–102
A Type-N collapse, on the other hand, starts with an exhaustionof Nature, followed by a decline of Wealth that in turn, causes a fallof the Commoners and then the Elites. Depending on the depletionrate, Type-N collapses can be “reversible” or “irreversible”. After areversible collapse, regrowth of nature can trigger another cycle ofprosperity, examples of which can be seen in Figs. 3c and 4c. Thiscould represent historical cases such as the Greek and Romancollapses.
When depletion is pushed beyond a certain limit, Nature fullycollapses and the whole system completely collapses after that.This is why we call an irreversible Type-N collapse a “full” collapse.Examples of such collapses can be seen in Figs. 3d, 4d, and 6b. Thiscould represent a historical case such as the exhaustion of Natureon Easter Island. Type-N collapses can arise because of excessive de-pletion only (Figs. 3d and 4d), or both excessive depletion and in-equality (Fig. 6b).
It is important to understand the inter-relation of the depletion fac-tor, δ, and the Carrying Capacity, χ. The further δ is taken away from itsoptimal value, the further χmoves down from its maximum value, χM.An equilibrium can be reached if and only if χ is not too far away fromχM, which means δ cannot be too far away from its optimal value,given by Eqs. (10), (14), and (18) in the three types of societies underconsideration. Note that in all of the scenario outputs presented below(for the three types of societies under consideration), Carrying Capacity(χ) and theMaximum Carrying Capacity (χM) are calculated from theirdefining Eqs. (9) and (11), respectively.
Important note about the units of the vertical axis of all the subse-quent graphs: Populations, xC and xE, and the Carrying Capacity, χ, are
all normalized to the Maximum Carrying Capacity, χM. Nature andWealth are both shown in units of Nature's capacity, λ. The top scaleof the vertical axis of the graph pertains to Population(s) and CarryingCapacity; the middle scale pertains to Nature, which (normally) staysbounded by 1λ; and the bottom scale is for Wealth.
Note: All the simulations below use the Euler integration methodwith a time-step of 1 year and single precision.
5.1. Egalitarian Society (No-Elites): xE = 0
In the four following scenarios, κ does not play any role since weset xE ≡ 0. We start the depletion rate from δ = δ∗, the optimal equi-librium value that maximizes the Carrying Capacity, and increase itslowly to get additional scenarios. The horizontal red line in thegraphs for the four scenarios of this section represents the zero pop-ulation of Elites.
5.1.1. Egalitarian Society: Soft Landing to EquilibriumFor the scenario in Fig. 3a, δ= δ∗ =6.67 × 10⁻⁶. Therefore, the car-
rying capacity, χ, is at its maximum level, χM. Notice that Nature alsosettles to ye = λ / 2, which is the value that results in the maximum re-generation rate. This maximal regeneration can in turn support a max-imum sustainable depletion and population.
If we set δ b δ*, we still see a soft landing to the carrying capacity, χ.However, χ would be at a lower level than χM because a lower-than-optimal δ does not correspond to themaximum regeneration of nature,which is a necessity if we want to have the maximum sustainable

97S. Motesharrei et al. / Ecological Economics 101 (2014) 90–102
population. The advantage of a lower-than-optimal δ is a higher equilib-rium level (compared to λ / 2) for Nature.
Choosing a depletion rate, δ, that is too small to produce enough tofeed the population would result in a collapse, and thus make any equi-librium impossible even though Nature stays at its maximum capacity.Of course, this would not occur in the real world as the urge for survivalguarantees humans extract their basic needs from nature.
5.1.2. Egalitarian Society: Oscillatory Approach to EquilibriumFor the scenario in Fig. 3b, δ is increased to δ=2.5δ∗ =1.67 × 10⁻⁵.
As can be seen from Fig. 3b, the carrying capacity, χ, is lower than itsmaximumvalue,χM. Population initially overshoots the carrying capac-ity, then oscillates, and eventually converges to it since the amount ofovershoot is not too large, just about the order of χ. Note that at thetime the (total) population overshoots the Carrying Capacity, theWealth also reaches a maximum and starts to decline.
5.1.3. Egalitarian Society: Cycles of Prosperity, Overshoot, Collapse, andRevival
For the scenario in Fig. 3c, δ is increased to δ=4δ∗=2.67 × 10⁻⁵. Ascan be seen, Population, Nature and Wealth all collapse to a very smallvalue. However, after depletion becomes small due to very low numberof workers, Nature gets a chance to grow back close to its capacity, λ.The regrowth of Nature kicks off another cycle of prosperity whichends with another collapse. Simulation results show that these cycles,ending in Type-N collapses (i.e., those that start due to scarcity ofNature), repeat themselves indefinitely. Therefore, such cycles repre-sent “reversible” Type-N collapses. This reversibility is possible as longas δ stays within a “safe” neighborhood of δ*.
Time (Year)
114
0.50.5
2
000
Equitable Society: Soft Landing to Optimal Equilibrium
Workers
Non-Workers
NatureWealth
CarryingCapacity
a) Equilibrium in the presence of both Workers and Non-
Workers can be attained with slow growth and equitable
salaries.
Time (Year)
Equitable Society: Cycles of Prosperity and Reversible,
Type-N Collapses
20
10
11
0.50.5
000
Workers
Non-Workers
Nature
Wealth
CarryingCapacity
c) Cycles of prosperity, overshoot, (reversible Type-N)
collapse, and revival in the presence of Workers and Non-
Workers.
Fig. 4. Experiment results fo
5.1.4. Egalitarian Society: Irreversible Type-N Collapse (Full Collapse)For the scenario in Fig. 3d, δ is increased further to δ = 5.5δ∗ =
3.67E − 5. The overshoot is so large that it forces Population, Natureand Wealth into a full collapse, after which there is no recovery. Thisis a generic type of collapse that can happen for any type of societydue to over-depletion. See Sections 5.2.4 and 5.3.2 for examples of irre-versible Type-N collapses in equitable and unequal societies, respective-ly. We include further discussion of these two types of collapses inSection 6.
We observe that the accumulated Wealth delays a decline of thepopulation even after Nature has declined well below its capacity, λ.Therefore, population keeps growing and depleting Nature until Natureis fully exhausted. At that instance, i.e., when y=0,Wealth cannot growany further; indeed, it starts plummeting, causing a sharp fall of thepopulation level, and eventually its full, irreversible collapse.
5.2. Equitable Society (with Workers and Non-Workers): κ = 1
We take the parameter values and the initial conditions to be thesame as in Table 1, except that this time we set xE(0) = 25 (φ = 0.25)and κ = 1. We start with the optimal depletion per capita δ = δ**,which will sustain the maximum population (see Eq. (14)), and willgradually increase it in order to get the additional scenarios in this sub-section. Notice that in these cases, xC describes theWorking Population,while xE describes the Non-Working Population. Everybody consumesat the same level, sincewe set κ=1, i.e., we assume there is no inequal-ity in consumption level for Workers and Non-Workers.
5.2.1. Equitable Society: Soft Landing to Optimal EquilibriumFor the scenario in Fig. 4a, δ = δ∗∗ = 8.33 × 10⁻⁶. Notice that this
is larger than the optimal value in the absence of Non-Workers δ∗ =
Time (Year)
20
10
11
0.50.5
000
Equitable Society: Oscillatory Approach to Equilibrium
Workers
Non-Workers
Nature
Wealth
CarryingCapacity
b) Oscillatory approach to equilibrium in the presence
of both Workers and Non-Workers is possible when the
overshoot is not too large.
Time (Year)
Equitable Society: Irreversible, Type-N (Full) Collapse
20
10
11
0.50.5
000
Workers
Non-Workers
Nature
Wealth
Carrying Capacity
d) Irreversible Type-N collapse (full collapse) happens
after a period of very fast growth.
r the Equitable society.

Equitable Society: Preventing a Full Collapse
Time (Year)
114
0.50.5
2
000
Workers
Non-Workers
Nature
Wealth
Carrying Capacity
Fig. 5. The full collapse that happened in the previous scenario, Fig. 4d,can be prevented by reducing the average depletion per capita. Thiscan be achieved by either increasing the ratio of the Non-Working toWorking population (high δ, high φ) or decreasing the average work-load perworker, i.e., decreasing total work hours perweek (low δ, lowφ).
98 S. Motesharrei et al. / Ecological Economics 101 (2014) 90–102
6.67 × 10⁻⁶ even though all the other parameters are identical to thosein Section 5.1.1. This difference arises because xE ≠ 0, which in turnforces the Workers to produce extra in order to support the Non-Workers. Now, χ b χM because δ = δ∗∗ ≠ δ∗. However, by setting δ =δ**, the optimal value of δ in the presence of Non-Workers, the total pop-ulation, xC + xE still reaches the maximum Carrying Capacity, χM, thesame as in Section 5.1. See Eq. (15) and Section 4.2 for a mathematicaldescription.
Unequal Society: Type-L Collapse (Scarcity of Labor)
Time (Year)
614
0.52
000
3
Nature
Wealth (Equivalent)
Elites
Commoners
CarryingCapacity
a) Population collapse following an apparentequilibrium due to a small initial Elite popula-tion when 100. This scenario also showsa different route to a collapse, in which, al-though Nature eventually recovers, populationdoes not.
Unequal Society: Soft Landing to Optimal Equilibrium
Time (Year)
114
0.50.5
2
000
NatureWealth
(Equivalent) Elites
Commoners
Carrying Capacity
c) With moderate in equality , it is pos-sible to attain an optimal equilibrium by con-trolling the birth rates.
Fig. 6. Experiment results f
Similar comments as in Section 5.1.1 apply here when we choose alower-than-optimal δ.
5.2.2. Equitable Society: Oscillatory Approach to EquilibriumFor the scenario in Fig. 4b, δ=2.64δ∗∗=2.20 × 10⁻⁵. The total pop-
ulation is equal to the actual Carrying Capacity (smaller than the maxi-mum Carrying Capacity).
5.2.3. Equitable Society: Cycles of Prosperity, Overshoot, Collapse,and Revival
For the scenario in Fig. 4c, δ = 3.46δ∗∗ = 3.00 × 10⁻⁵. The result isanalogous to Fig. 3c which corresponds to Section 5.1.3. As before, thetime at which the total population overshoots the actual Carrying Ca-pacity is indicated by the fact that Wealth starts to decrease. Aftereach cycle of prosperity, there is a partial, reversible Type-N collapse.
5.2.4. Equitable Society: Full CollapseFor the scenario in Fig. 4d, δ = 5δ∗∗ = 4.33 × 10⁻⁵. Once again, we
can see how an irreversible Type-N (full) collapse of Population, Nature,andWealth can occur due to over-depletion of natural resources as a re-sult of high depletion per capita.
5.2.5. Equitable Society: Preventing a Full Collapse by Decreasing AverageDepletion per Capita
The case in Fig. 5 is similar to the previous case (see Section 5.2.4 andFig. 4d), except that we raised the ratio of Non-Workers to Workers, φ,from 0.25 to 6. This corresponds to changing xE(0) from 25 to 600,
Unequal Society: Irreversible, Type-N (Full) Collapse
Time (Year)
40
20
21
10.5
000
Nature
Wealth
(Equivalent)
Elites
Commoners
CarryingCapacity
b) A fast full collapse due to both over-depletion and inequality
Unequal Society: Oscillatory Approach to Equilibrium
Time (Year)
Nature
Wealth
(Equivalent)
Elites
CommonersCarrying Capacity
d) With , it is still possible to oscillateand converge to an equilibrium
or the Unequal society.

99S. Motesharrei et al. / Ecological Economics 101 (2014) 90–102
while keeping xC(0) = 100. By increasing the ratio of non-workers toworkers, a sustainable equilibrium can be reached due to lower averagedepletion per capita — an equivalent δ if everyone contributed equallyto labor. This could also be interpreted as modeling a reduction in the av-erage workload per worker.
5.3. Unequal Society (with Elites and Commoners): xE ≥ 0 and κ N 1
In our examples of an unequal society, the Elites (per capita) con-sume κ b 10 to 100 times more than the Commoners. Their population,plotted in red, ismultiplied by κ to represent their equivalent impact be-cause of their higher consumption. That is whywe use the label “Equiv-alent Elites” on the graphs in this Section 5.3.
In the first two cases, we discuss two distinct, but generic typesof collapse in an unequal society. In these two scenarios, κ = 100.Then we will show possibility of reaching an equilibrium by reduc-ing κ to 10 and adjusting the birth rates βE and βC independently. Thesetwo κ=10 scenarios show that in order to reach a sustainable equilibri-um in an unequal society, it is necessary to have policies that limit in-equality and ensure birth rates remain below critical levels.
5.3.1. Unequal Society: Type-L Collapse (Labor Disappears, NatureRecovers)
This scenario, presented in Fig. 6a, is precisely the same as the equi-librium without Elites case presented in Section 5.1.1 (Fig. 3a) exceptthat here we set xE(0) = 1.0 × 10⁻³. This is indeed a very small initialseed of Elites. The two scenarios look pretty much the same up untilabout t = 500 years after the starting time of the simulation. The Elitepopulation starts growing significantly only after t= 500, hence deplet-ing the Wealth and causing the system to collapse. Under this scenario,the system collapses due to worker scarcity even though natural re-sources are still abundant, but because the depletion rate is optimal, ittakes more than 400 years after the Wealth reaches a maximum for thesociety to collapse. In this example, Commoners die out first and Elitesdisappear later. This scenario shows that in a society that is otherwise sus-tainable, the highly unequal consumption of elites will still cause acollapse.
This scenario is an example of a Type-L collapse in which both Popu-lation andWealth collapse butNature recovers (to itsmaximumcapacity,λ, in the absence of depletion). Scarcity of workers is the initial cause of aType-L collapse, as opposed to scarcity of Nature for a Type-N collapse.
5.3.2. Unequal Society: Irreversible Type-N Collapse (Full Collapse)The typical scenario in Fig. 6b for a full collapse is the result of run-
ning the model with the parameter values and initial conditions givenby Table 1. Examples of irreversible Type-N (full) collapses in the egali-tarian and equitable societies are presented in Section 5.1.4 (Fig. 3d) andSection 5.2.4 (Fig. 4d).
We set a small initial seed of xE(0) = 0.20, κ = 100, and a largedepletion δ=1.0 × 10⁻⁴, so that both the depletion δ=15δ* and the in-equality coefficient κ= 100 are very large. This combination results in afull collapse of the system with no recovery. The Wealth starts decliningas soon as the Commoner's population goes beyond its carrying capacity,and then the full collapse takes only about 250 additional years. The de-clining Wealth causes the fall of the Commoner's population (workers)with a time lag. The fast reduction in the number of workers combinedwith scarcity of natural resources causes theWealth to decline even fasterthan before. As a result, the Elites –who could initially survive the faminedue to their unequal access to consumable goods (κ=100) – eventuallyalso die of hunger. Note that because both depletion and inequality arelarge, the collapse takes place faster and at a much lower level of pop-ulation than in the previous case (see Section 5.3.1, Fig. 5.3.1) with adepletion rate of δ = δ*.
5.3.3. Unequal Society: Soft Landing to Optimal EquilibriumThe following parameter values and initial values can produce the
current scenario (the rest are exactly the same as in Table 1):
βC ¼ 6:5� 10−2 βE ¼ 2:0� 10−2
xC 0ð Þ ¼ 1:0� 10þ4 xE 0ð Þ ¼ 3:0� 10þ3
κ ¼ 10 δ ¼ 6:35� 10−6:
8><>: ð20Þ
The value for δ used in this scenario is δ*** given by Eq. (18). It mustbe remembered that ψ = 0.65 is not a parameter that we can choose.However, it can be read from the result of the simulation since it is theequilibrium ratio of the Elite to Commoner population. See the secondequation in Eq. (17). On the other hand, η ¼ 1
12 is determined by thedeath and birth rates as well as the inequality coefficient. These param-eters are chosen in order to satisfy Eq. (16), the necessary condition forattaining an equilibrium in an unequal society.
The same comments as in Section 5.1.1 hold here if we choose alower-than-optimal δ.
5.3.4. Unequal Society: Oscillatory Approach to EquilibriumThe parameter values and initial conditions in the scenario present-
ed in Fig. 6d are exactly the same as the previous scenario, presented inFig. 6c, except for δ. It is increased to 1.3 × 10⁻⁵, almost 2δ***. This resultsin a much lower Carrying Capacity compared to 5.3.3, as can be seenfrom a comparison of Fig. 6c and d. Therefore, the total final populationin the present scenario ismuch less than the total final population in theprevious scenario, 5.3.3 (Fig. 6c) (Table 2).
6. Discussion of Results
We conducted a series of experiments with the HANDYmodel, con-sideringfirst an egalitarian societywithout Elites (xE=0), next an equi-table society (κ=1)whereNon-Workers andWorkers are equally paid,and finally an unequal society whose Elites consume κ times morethan the Commoners. The model was also used to find a sustainableequilibrium value and the maximum carrying capacity within each ofthese three types of societies.
6.1. Unequal Society
The scenarios most closely reflecting the reality of our world todayare found in the third group of experiments (see the scenarios for an un-equal society in Section 5.3), where we introduced economic stratifica-tion. Under such conditions, we find that collapse is difficult to avoid,which helps to explain why economic stratification is one of the ele-ments recurrently found in past collapsed societies. Importantly, inthe first of these unequal society scenarios, 5.3.1, the solutionappears to be on a sustainable path for quite a long time, but even usingan optimal depletion rate (δ*) and starting with a very small numberof Elites, the Elites eventually consume too much, resulting in a famineamong Commoners that eventually causes the collapse of society. It isimportant to note that this Type-L collapse is due to an inequality-induced famine that causes a loss of workers, rather than a collapse ofNature. Despite appearing initially to be the same as the sustainableoptimal solution obtained in the absence of Elites, economic stratificationchanges the final result: Elites' consumption keeps growing until the soci-ety collapses. The Mayan collapse – in which population never recoveredeven though nature did recover – is an example of a Type-L collapse,whereas the collapses in the Easter Island and the Fertile Crescent –where nature was depleted – are examples of a Type-N collapse.
In scenario 5.3.2, with a larger depletion rate, the decline of theCommoners occurs faster, while the Elites are still thriving, but eventu-ally the Commoners collapse completely, followed by the Elites. It is im-portant to note that in both of these scenarios, the Elites – due to theirwealth – do not suffer the detrimental effects of the environmental

1 Wewish to acknowledge and thank reviewer No. 1 for highlighting these very impor-tant points to us.
100 S. Motesharrei et al. / Ecological Economics 101 (2014) 90–102
collapse until much later than the Commoners. This buffer of wealth al-lows Elites to continue “business as usual” despite the impending catas-trophe. It is likely that this is an important mechanism that would helpexplain howhistorical collapseswere allowed to occur by eliteswho ap-pear to be oblivious to the catastrophic trajectory (most clearly appar-ent in the Roman and Mayan cases). This buffer effect is furtherreinforced by the long, apparently sustainable trajectory prior to the be-ginning of the collapse. While somemembers of society might raise thealarm that the system is moving towards an impending collapse andtherefore advocate structural changes to society in order to avoid it,Elites and their supporters, who opposed making these changes, couldpoint to the long sustainable trajectory “so far” in support of doingnothing.
The final two scenarios in this set of experiments, 5.3.3 and 5.3.4, aredesigned to indicate the kinds of policies needed to avoid this cata-strophic outcome. They show that, in the context of economic stratifica-tion, inequalitymust be greatly reduced and population growthmust bemaintained below critical levels in order to avoid a societal collapse(Daly, 2008).
6.2. Egalitarian Society
In order to further understand what conditions are needed to avoidcollapse, our first set of experiments model a society without economicstratification and start with parameter values that make it possible toreach a maximum carrying capacity (scenario 5.1.1). The resultsshow that in the absence of Elites, if the depletion per capita is kept atthe optimal level of δ*, the population grows smoothly and asymptotesthe level of the maximum carrying capacity. This produces a soft-landing to equilibriumat themaximumsustainable population and pro-duction levels.
Increasing the depletion factor slightly (scenario 5.1.2) causes thesystem to oscillate, but still reach a sustainable equilibrium, although,importantly, at a lower carrying capacity. Population overshoots its car-rying capacity, but since the overshoot is not by toomuch – of the orderof the carrying capacity – the population experiences smaller collapsesthat can cause it to oscillate and eventually converge to a sustainableequilibrium. Thus, while social disruption and deaths would occur, atotal collapse is avoided.
A further increase in the depletion factor (scenario 5.1.3) makes thesystem experience oscillatory periods of growth, very large overshootsand devastating collapses that almostwipe out society, but the eventualrecovery of Nature allows for the cycle to be repeated.
Increasing the depletion factor even further (scenario 5.1.4) resultsin a complete collapse of the system. This shows that depletion alone,if large enough, can result in a collapse — even in the absence of eco-nomic stratification.
6.3. Equitable Society (with Workers and Non-Workers)
As the second set of experiments (presented in Section 5.2) show,HANDY allows us to model a diverse range of societal arrangements.In this set of experiments, choosing xE ≥ 0 and κ = 1 has allowed usto model a situation that can be described as having Workers andNon-Workerswith the same level of consumption, i.e., with no econom-ic stratification. The Non-Workers in these scenarios could represent arange of societal roles from students, retirees, and disabled people, to in-tellectuals, managers, and other non-productive sectors. In this case, theWorkers have to deplete enough of Nature to support both the Non-Workers and themselves.
The first scenario, 5.2.1, shows that even with a population of Non-Workers, the total population can still reach a sustainable equilibriumwithout a collapse. In scenario 5.2.2, we find that increasing the deple-tion factor induces a series of overshoots and small collapseswhere pop-ulation eventually converges to a lower sustainable equilibrium. Like inan egalitarian society, scenario 5.2.3 shows us that increasing the
depletion parameter further results in cycles of large overshooting,major collapses, and then eventual recovery of Nature. Scenario 5.2.4shows us that increasing depletion per capita further can produce an ir-reversible Type-N collapse.
Finally, scenario 5.2.5, which is a replication of the scenario in5.2.4 with a much higher ratio of Non-Workers to Workers, showsthat a collapse in an equitable society could be avoided by reducingthe average depletion per capita. We note that this scenario could alsorepresent a situation where, rather than having paid Non-Workers,the workload per capita is reduced, with the whole population working“fewer days aweek”. Such a “work-sharing”policy has been successfullyimplemented in Germany over the past few years for reducing unem-ployment (Baker and Hasset, 2012; Hasset, 2009). Moreover, Knightet al. (2013) show, through a panel analysis of data for 29 high-income OECD countries from 1970 to 2010, that reducing work hourscan contribute to sustainability by reducing ecological strain. This con-clusion agrees with our comparison of the two scenarios, 5.2.5 and5.2.4, presented above.
6.4. HANDY and Brander–Taylor Model
As previously mentioned, a similar use of the predator–prey ap-proach was applied in the pioneering work of Brander and Taylor(1998) (BT) to study the historical rise and fall of the Easter Island pop-ulation. In comparison to their model, with just two equations forPopulation and Nature, the introduction of Elites and Commoners,and accumulated Wealth, results in a greater variety and broader spec-trum of potential solutions. Moreover, the collapse scenario presentedin BT is somewhat different from the ones presented above. As a matterof fact, the collapse scenario presented in Fig. 3 of Brander and Taylor(1998) seems to bemore of an oscillatory approach to equilibrium, sim-ilar to the one shown in our Fig. 3b, and not a collapse in the sense thatwe define in this paper. Furthermore, the carrying capacity, in the sensewe define in this paper, is also different fromwhat BT (1998) call carry-ing capacity. Indeed, their carrying capacity (K) is our Nature's capacity,λ, which is the maximum size Nature can reach, whereas Carrying Ca-pacity in HANDY is the population level that can be supported by agiven level of natural resources. Furthermore, BT's carrying capacity isa constant, whereas Carrying Capacity in HANDY adjusts according tothe level of depletion of Nature.
While sharing certain similarities with the Brander and Taylormodel, our more complex model structure and the use of different as-sumptions, allows our model to apply to multiple types of societieswith varying socioeconomic structures. Thus, unlike works that tendto study further implications of the two-dimensional model of BT(Anderies, 2000), the model we have developed introduces a morecomplex set of possible feedbacks and nonlinear dynamics, and a great-er spectrum of potential outcomes. This allows HANDY to model a dif-ferent and wider set of thought experiments.
An important feature of HANDY that distinguishes it from predator–prey, BT, and other similar models (Anderies, 1998; Dalton et al., 2005;Erickson and Gowdy, 2000; Reuveny and Decker, 2000) is its native ca-pability for producing irreversible collapses due to the structure for ac-cumulation of wealth. Our approach also differs from models likeD'Alessandro (2007) that can produce irreversible collapses but onlythrough explicit introduction of a critical depensation mechanism intothemodel. The dynamics produced by HANDY offer the possibility of ir-reversible collapses without having to introduce such an additionalmechanism into the model. See Section 5.1.4 for an explanation of irre-versible collapses in HANDY.1

101S. Motesharrei et al. / Ecological Economics 101 (2014) 90–102
7. Summary
Collapses of even advanced civilizations have occurred many timesin the past five thousand years, and they were frequently followed bycenturies of population and cultural decline and economic regression.Althoughmany different causes have been offered to explain individualcollapses, it is still necessary to develop a more general explanation. Inthis paper we attempt to build a simple mathematical model to explorethe essential dynamics of interaction between population and naturalresources. It allows for the two features that seem to appear across soci-eties that have collapsed: the stretching of resources due to strainplaced on the ecological carrying capacity, and the division of societyinto Elites (rich) and Commoners (poor).
The HumanAndNature DYnamical model (HANDY)was inspired bythe predator and prey model, with the human population acting as thepredator and nature being the prey. When small, Nature grows expo-nentially with a regeneration coefficient γ, but it saturates at a maxi-mum value λ. As a result, the maximum regeneration of nature takesplace at λ / 2, not at the saturation level λ. The Commoners producewealth at a per capita depletion rate δ, and the depletion is also propor-tional to the amount of nature available. This production is saved as ac-cumulated wealth, which is used by the Elites to pay the Commoners asubsistence salary, s, and pay themselves κs, where κ is the inequalitycoefficient. The populations of Elites and Commoners grow with abirth rate β and die with a death rate α which remains at a healthylow level when there is enough accumulated food (wealth). However,when the population increases and the wealth declines, the death rateincreases up to a famine level, leading to population decline.
We show how the carrying capacity – the population that can be in-definitely supported by a given environment (Catton, 1980) – can bedefined within HANDY, as the population whose total consumption isat a level that equals what nature can regenerate. Since the regrowthof Nature is maximum when y = λ / 2, we can find the optimal levelof depletion (production) per capita, δ* in an egalitarian society wherexE ≡ 0, δ∗∗(≥δ∗) in an equitable society where κ ≡ 1, and δ*** in an un-equal society where xE ≥ 0 and κ N 1.
In sum, the results of our experiments, discussed in Section 6, indi-cate that either one of the two features apparent in historical societalcollapses – over-exploitation of natural resources and strong economicstratification – can independently result in a complete collapse. Giveneconomic stratification, collapse is very difficult to avoid and requiresmajor policy changes, includingmajor reductions in inequality and pop-ulation growth rates. Even in the absence of economic stratification, col-lapse can still occur if depletion per capita is too high. However, collapsecan be avoided and population can reach equilibrium if the per capitarate of depletion of nature is reduced to a sustainable level, and if re-sources are distributed in a reasonably equitable fashion.
In the upcoming generations of HANDY, we plan to develop severalextensions including: (1) disaggregation of Nature into nonrenewablestocks, regenerating stocks, and renewable flows, as well as the intro-duction of an investment mechanism in accessibility of natural re-sources, in order to study the effects of investment in technology onresource choice and production efficiency; (2) making inequality (κ)endogenous to the model structure; (3) introduction of “policies” thatcan modify parameters such as depletion, the coefficient of inequality,and the birth rate; and, (4) introduction of multiple coupled regions torepresent countries with different policies, trade of carrying capacity,and resource wars.
Those interested in obtaining themodel code can contact the authors.
Acknowledgments
We are grateful to Profs. Matthias Ruth, Victor Yakovenko, HermanDaly, Takemasa Miyoshi, Jim Carton, Fernando Miralles-Wilhelm, andNing Zeng, and Drs. Robert Cahalan and Steve Penny for many usefuldiscussions. Study of the “Equitable Society” scenarios (i.e., with
Workers and Non-Workers), the scenario presented in Section 5.2.5,in particular, was suggested by V. Yakovenko. We would also like tothank anonymous reviewer No. 1 for having highlighted to us the im-portance of the capability of HANDY to naturally produce irreversiblecollapses, which is not found in earlier models. We would especiallylike to thank the editors of this journal for alerting us to the modeland work done by Brander and Taylor, of which we were unaware,and allowing us to revise our article to account for this new information.This workwas partially funded through NASA/GSFC grant NNX12AD03A.
Based on the media reports on a pre-publication version of this paper,NASA issued the official statement contained in Release 14-082:
http://www.nasa.gov/press/2014/march/nasa-statement-on-sustainability-study/
March 20th, 2014RELEASE 14-082NASA Statement on Sustainability Study
The following is a statement from NASA regarding erroneous mediareports crediting the agency with an academic paper on populationand societal impacts.
"A soon-to-be published research paper 'Human andNature Dynam-ics (HANDY): Modeling Inequality and Use of Resources in the Col-lapse or Sustainability of Societies' by University of Marylandresearchers Safa Motesharrei and Eugenia Kalnay, and University ofMinnesota’s Jorge Rivas was not solicited, directed or reviewed byNASA. It is an independent study by the university researchers utiliz-ing research tools developed for a separate NASA activity."
"As is the case with all independent research, the views and conclu-sions in the paper are those of the authors alone. NASA does not en-dorse the paper or its conclusions."
References
Abel, Wilhelm, 1980. Agricultural Fluctuations in Europe: From the Thirteenth to theTwentieth Centuries. Methuen.
Anderies, John M., 1998. Culture and human agro-ecosystem dynamics: the Tsembaga ofNew Guinea. J. Theor. Biol. 920 (4), 515–530.
Anderies, John M., 2000. On modeling human behavior and institutions in simple ecolog-ical economic systems. Ecol. Econ. 35 (3), 393–412 (December).
Baker, Dean, Hasset, Kevin, 2012. The human disaster of unemployment. http://www.nytimes.com/2012/05/13/opinion/sunday/the-human-disaster-of-unemployment.html?pagewanted=all (May).
Banerjee, Anand, Yakovenko, Victor M., 2010. Universal patterns of inequality. NewJ. Phys. 12 (7) (July).
Brander, JamesA., Taylor,M. Scott, 1998. The simple economics of Easter Island: a Ricardo–Malthus model of renewable resource use. Am. Econ. Rev. 88 (1), 119–138.
Brenner, Robert, 1985. Agrarian class structure and economic development inpre-industrialEurope. In: Aston, Trevor H., Philpin, C.H.E. (Eds.), The Brenner Debate: Agrarian ClassStructure and Economic Development in Pre-Industrial Europe. Cambridge UniversityPress, pp. 10–63.
Catton, William R., 1980. Overshoot: The Ecological Basis of Revolutionary Change.University of Illinois Press.
Chase-Dunn, Christopher, Hall, Thomas, 1997. Rise and Demise: Comparing World-Systems. Westview Press.
Cohen, Joel E., 1995. HowMany People Can the Earth Support? W. WNorton & Company.Culbert, Patrick (Ed.), 1973. The Classic Maya Collapse. University of New Mexico Press.Chu, C.Y. Cyrus, Lee, Ronald D., 1994. Famine, revolt, and the dynastic cycle: population
dynamics in historic China. J. Popul. Econ. 70 (4), 351–378 (November).D'Alessandro, Simone, 2007. Non-linear dynamics of population and natural resources:
the emergence of different patterns of development. Ecol. Econ. 620 (3), 473–481.Dalton, Thomas R., Morris Coats, R., Asrabadi, Badiollah R., 2005. Renewable resources,
property-rights regimes and endogenous growth. Ecol. Econ. 520 (1), 31–41.Daly, Herman E., 1991. Steady-State Economics: With New Essays. Island Press.Daly, Herman E., 1996. Beyond Growth: The Economics of Sustainable Development.
Beacon Press.Daly, Herman E., 2008. A Steady-State Economy. April http://www.sd-commission.org.
uk/data/files/publications/Herman_Daly_thinkpiece.pdf (URL).

102 S. Motesharrei et al. / Ecological Economics 101 (2014) 90–102
Demerest, Arthur, Rice, Prudence, Rice, Don (Eds.), 2004. The Terminal Classic in theMayaLowlands. University Press of Colorado.
Diamond, Jared M., 2005. Collapse: How Societies Choose to Fail or Succeed. Viking Press.Drăgulescu, Adrian A., Yakovenko, Victor M., 2001. Exponential and power-law probabil-
ity distributions of wealth and income in the United Kingdom and the United States.Physica A 213–221.
Edwards, Iorwerth Eiddon Stephen, Gadd, Cyril John, Hammond, Nicholas GeoffreyLempriere (Eds.), 1971. The Cambridge Ancient History. Part 2: Early History of theMiddle East, vol. I. Cambridge University Press.
Edwards, Iorwerth Eiddon Stephen, Gadd, Cyril John, Hammond, Nicholas GeoffreyLempriere, Sollberger, Edmond (Eds.), 1973. The Cambridge Ancient History. Part 1:The Middle East and the Aegean Region, vol. II. Cambridge University Press.
Erickson, Jon D., Gowdy, John M., 2000. Resource use, institutions, and sustainability: atale of two Pacific Island cultures. Land Econ. 345–354.
Goldstein, Joshua, 1988. Long Cycles: Prosperity andWar in theModern Age. Yale Univer-sity Press.
Goldstone, JackA., 1991. Revolution and Rebellion in the Early Modern World. Universityof California Press.
Greening, Lorna A., Greene, David L., Difiglio, Carmen, 2000. Energy efficiency and con-sumption — the rebound effect — a survey. Energy Policy 280 (67), 389–401.
Hasset, Kevin, 2009. U.S. should try Germany's unemploymentmedicine. URL http://www.bloomberg.com/apps/news?pid=newsarchivesid=ax3kyE3bILD (November).
Daly, Herman E., Farley, Joshua, 2003. Ecological Economics: Principles And Applications.Island Press.
Jansen, Michael, Mulloy, Maire, Urban, Günter (Eds.), 1991. Forgotten Cities on the Indus:Early Civilization in Pakistan from the 8th to the 2nd Millennium BC. Verlag Philippvon Zabern.
Kammen, Daniel M., 1994. Preindustrial human environmental impacts: are there lessonsfor global change science and policy? Chemosphere 290 (5) (September).
Kenoyer, Jonathan, 1998. Ancient Cities of the Indus Valley Civilization. Oxford UniversityPress.
Khaldun, Ibn, 1958. The Muqaddimah: An Introduction to History. Translated from theArabic (ca 1390) by Franz Rosenthal. Pantheon Books.
Knight, Kyle W., Rosa, Eugene A., Schor, Juliet B., 2013. Could working less reduce pres-sures on the environment? A cross-national panel analysis of OECD countries,1970–2007. Glob. Environ. Chang. 23 (4), 691–700.
Kondratieff, Nikolai Dmitrievich, 1984. The Long Wave Cycle. Richardson & Snyder.Ladurie, Emmanuel Le Roy, 1987. The French Peasantry. University of California Press
1450–1660.Lee, J.S., 1931. The periodic recurrence of internecine wars in China. China J. 140 (3),
111–163 (March–April).Lentz, David (Ed.), 2000. Imperfect Balance: Landscape Transformation in the
Precolumbian Americas. Columbia University Press.Lotka, Alfred J., 1925. Elements of Physical Biology. Williams and Wilkins.Meadows, Donella H., Meadows, Dennis L., Randers, Jørgen, Behrens III, WilliamW., 1972.
The Limits to Growth. Universe Books.Mitchell, Richard E., 1990. Patricians and Plebeians: The Origin of the Roman State. Cornell
University Press.Modelski, George, 1987. Exploring Long Cycles. L. Rienner Publishers.Morris, Ian, 2006. The collapse and regeneration of complex society in Greece,
1500–500 BC. In: Schwartz, Glenn M., Nichols, John J. (Eds.), After Collapse: The Re-generation of Complex Societies. University of Arizona Press.
Needham, Joseph, Wang, Ling, 1956. Science and Civilisation in China: Introductory Ori-entations. Cambridge University Press.
Parsons, Jack, 1991. Population control and politics. Popul. Environ. 120 (4), 355–377(June).
Polimeni, John M., Mayumi, Kozo, Giampietro, Mario, Alcott, Blake, 2008. The JevonsParadox and the Myth of Resource Efficiency Improvements. Earthscan.
Ponting, Clive, 1991. A Green History of the World: The Environment and the Collapse ofGreat Civilizations. Penguin Books.
Postan, Michael M., 1966. Medieval agrarian society in its prime: 7. England. In: Postan,Michael M. (Ed.), The Cambridge Economic History of Europe. The Agrarian Life ofthe Middle Ages, vol. 1. Cambridge University Press, pp. 221–246.
Redman, Charles L. (Ed.), 1999. Human Impact on Ancient Environments. University ofArizona Press.
Redman, Charles L., James, Steven, Fish, Paul, Daniel Rogers, J. (Eds.), 2004. The Archaeol-ogy of Global Change: The Impact of Humans on Their Environment. SmithsonianBooks.
Reuveny, Rafael, Decker, Christopher S., 2000. Easter Island: historical anecdote or warn-ing for the future? Ecol. Econ. 350 (2), 271–287.
Ruth,Matthias, 2009. The nature of the beast and the beast in nature: broadening the per-spective of technology. Bull. Sci. Technol. Soc. 290 (5), 374–382.
Shennan, Stephen, Downey, Sean S., Timpson, Adrian, Edinborough, Kevan, Colledge, Sue,Kerig, Tim, Manning, Katie, Thomas, Mark G., 2013. Regional population collapsefollowed initial agriculture booms in mid-Holocene Europe. Nat. Commun. (4).http://dx.doi.org/10.1038/ncomms3486.
Stark, Miriam T., 2006. From Funan to Angkor: collapse and regeneration in ancientCambodia. In: Schwartz, Glenn M., Nichols, John J. (Eds.), After Collapse: The Regen-eration of Complex Societies. University of Arizona Press.
Tainter, Joseph A., 1988. The Collapse of Complex Societies. Cambridge University Press.Thapar, Romila, 2004. Early India: From the Origins to AD 1300. University of California
Press.Turchin, Peter, 2003. Historical Dynamics: Why States Rise and Fall. Princeton University
Press.Turchin, Peter, 2005. Dynamical feedbacks between population growth and sociopolitical
instability in agrarian states. Struct. Dyn. 10 (1).Turchin, Peter, 2006.War and Peace andWar: The Life Cycles of Imperial Nations. Pi Press.Turchin, Peter, Nefedov, Sergey A., 2009. Secular Cycles. Princeton University Press.Volterra, Vito, 1926. Variazioni e fluttuazioni del numero dÕindividui in specie animali
conviventi. Mem. Accad. Lincei Roma 2:0, 31–113.Webster, David, 2002. The Fall of the Ancient Maya. Thames and Hudson.Wood, James W., 1998. A theory of preindustrial population dynamics demography,
economy, and well-being in Malthusian systems. Curr. Anthropol. 390 (1), 99–135(February).
Wright, Ronald, 2004. A Short History of Progress. House of Anansi Press.Yoffee, Norman, 1979. The decline and rise of Mesopotamian civilization: an ethno-
archaeological perspective on the evolution of social complexity. Am. Antiq. 440(1), 5–35 (January).
Yoffee, Norman, Cowgill, George L., 1988. The Collapse of Ancient States and Civilizations.University of Arizona Press.