HUDM4122 Probability and Statistical Inference • Find P(z
80
HUDM4122 Probability and Statistical Inference March 30, 2015
Transcript of HUDM4122 Probability and Statistical Inference • Find P(z
HUDM4122Probability and Statistical Inference
March 30, 2015

HW6
• This was a difficult one

P1
• Find P(z<= 1.64) for a normal distribution
• Correct answer 0.9495
• Common incorrect answer: 0.0505
• Remember, the cumulative probability distribution inyour table is from the left side to that Z value– Take the value for <– Take 1-value for >

P1• Find P(z<= 1.64) for a normal distribution
• Correct answer 0.9495
• Common incorrect answer: 0.0505
• Remember, the cumulative probability distribution in your table isfrom the left side to that Z value– Take the value for <– Take 1-value for >
• This difficulty persisted throughout the assignment, causing errorson P4, P5, and later…

ExerciseUse your table to determine
• P(Z< 1)• P(Z> 1)• P(Z> 1.52)• P(Z< -1.03)• P(Z< -0.55)• P(Z> -2.02)

P3
• Find P(0<=z<=1.00)
• Correct answer: 0.8413-0.5 = 0.3413– P(0<Z)=0.5– P(Z<1)=0.8413
• Common wrong answer: 1– I see the logic here, but keep in mind that Z
represents the normal distribution

P6Which of the following is this study?(multiple of these may apply)100 graduate students at Teachers College are randomly assigned toHUDM4122 using either ASSISTments homework or traditional paper homework.The students all take the same pre-test and post-test, and learning gainsare compared between students who used ASSISTments and traditional homework.
Correct answer: Experiment, Controlled Experiment

Why are these incorrect?Which of the following is this study?(multiple of these may apply)100 graduate students at Teachers College are randomly assigned toHUDM4122 using either ASSISTments homework or traditional paper homework.The students all take the same pre-test and post-test, and learning gainsare compared between students who used ASSISTments and traditional homework.
Correct answer: Experiment, Controlled Experiment
Incorrect answers: Quota Sampling, Observational Study, Quasi-Experiment

This one depends on what the originalresearch goal was
Which of the following is this study?(multiple of these may apply)100 graduate students at Teachers College are randomly assigned toHUDM4122 using either ASSISTments homework or traditional paper homework.The students all take the same pre-test and post-test, and learning gainsare compared between students who used ASSISTments and traditional homework.
Correct answer: Experiment, Controlled Experiment
Incorrect answers: Quota Sampling, Observational Study, Quasi-Experiment
Possibly correct answers: Convenience Sampling

P7Which of the following is this study?(multiple of these may apply)100 graduate students at Teachers College individually choose to take Baker's sectionof HUDM4122 or another section of HUDM4122.Students in Baker's section use ASSISTments homework;the other section uses traditional paper homework.The students all take the same pre-test and post-test, and learning gainsare compared between students who used ASSISTments and traditional homework.
Correct answer: Quasi-experiment
Sorta correct answers: Observational study (usually used to refer to cases where itisn’t possible to refer to it as quasi-experiment)

Why is this answer incorrect?Which of the following is this study?(multiple of these may apply)100 graduate students at Teachers College individually choose to take Baker's sectionof HUDM4122 or another section of HUDM4122.Students in Baker's section use ASSISTments homework;the other section uses traditional paper homework.The students all take the same pre-test and post-test, and learning gainsare compared between students who used ASSISTments and traditional homework.
Correct answer: Quasi-experiment
Sorta correct answers: Observational study (usually used to refer to cases where itisn’t possible to refer to it as quasi-experiment)
Incorrect answers: Experiment

P9• According to the latest data,
a study of 81 athletes using a new exerciseregimenfound that the athletes became able to runbetween 0 and 8 more miles.
• The average runner becomes able to run 3 moremiles.The standard deviation is 1 mile.
• What is the probability that the sample average isunder 2.5 miles?(give two digits after the decimal point)

Only 9% of you got this right, so let’sgo over it together
• According to the latest data,a study of 81 athletes using a new exerciseregimenfound that the athletes became able to runbetween 0 and 8 more miles.
• The average runner becomes able to run 3 moremiles.The standard deviation is 1 mile.
• What is the probability that the sample average isunder 2.5 miles?(give two digits after the decimal point)

Z = ( )• According to the latest data,
a study of 81 athletes using a new exerciseregimenfound that the athletes became able to runbetween 0 and 8 more miles.
• The average runner becomes able to run 3 moremiles.The standard deviation is 1 mile.
• What is the probability that the sample average isunder 2.5 miles?(give two digits after the decimal point)

Z = ( )But note, it’s the SD of the sample average
• According to the latest data,a study of 81 athletes using a new exerciseregimenfound that the athletes became able to runbetween 0 and 8 more miles.
• The average runner becomes able to run 3 moremiles.The standard deviation is 1 mile.
• What is the probability that the sample average isunder 2.5 miles?(give two digits after the decimal point)

Z = ( )But note, it’s the SD of the sample average
which is the SE• According to the latest data,
a study of 81 athletes using a new exerciseregimenfound that the athletes became able to runbetween 0 and 8 more miles.
• The average runner becomes able to run 3 moremiles.The standard deviation is 1 mile.
• What is the probability that the sample average isunder 2.5 miles?(give two digits after the decimal point)

SE = = = = 0.11• According to the latest data,
a study of 81 athletes using a new exerciseregimenfound that the athletes became able to runbetween 0 and 8 more miles.
• The average runner becomes able to run 3 moremiles.The standard deviation is 1 mile.
• What is the probability that the sample average isunder 2.5 miles?(give two digits after the decimal point)

Z = ( . ). = .. = -4.5• According to the latest data,
a study of 81 athletes using a new exerciseregimenfound that the athletes became able to runbetween 0 and 8 more miles.
• The average runner becomes able to run 3 moremiles.The standard deviation is 1 mile.
• What is the probability that the sample average isunder 2.5 miles?(give two digits after the decimal point)

P(Z < -4.5) = 0.000003• According to the latest data,
a study of 81 athletes using a new exerciseregimenfound that the athletes became able to runbetween 0 and 8 more miles.
• The average runner becomes able to run 3 moremiles.The standard deviation is 1 mile.
• What is the probability that the sample average isunder 2.5 miles?(give two digits after the decimal point)
Questions?

P12
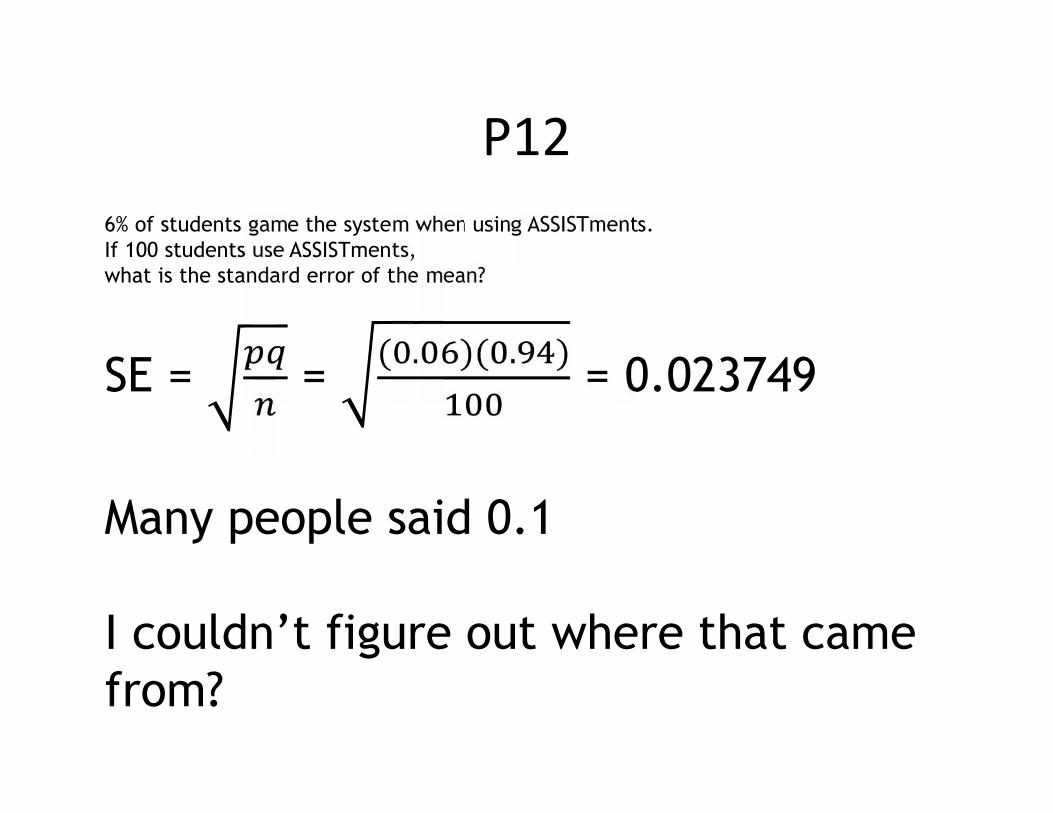
6% of students game the system when using ASSISTments.If 100 students use ASSISTments,what is the standard error of the mean?
SE = = ( . )( . ) = 0.023
P126% of students game the system when using ASSISTments.If 100 students use ASSISTments,what is the standard error of the mean?
SE = = ( . )( . ) = 0.023749
Many people said 0.1
I couldn’t figure out where that camefrom?

P13
6% of students game the system when using ASSISTments.If a school has over 10% gaming the system, a giant sirengoes off in Ryan's apartment at 3am.
(His daughter put it there).
If 100 students use ASSISTments in a school,what is the probability that the sample average isover 10%?(give two digits after the decimal point)

We know SE = 0.023749
6% of students game the system when using ASSISTments.If a school has over 10% gaming the system, a giant sirengoes off in Ryan's apartment at 3am.
(His daughter put it there).
If 100 students use ASSISTments in a school,what is the probability that the sample average isover 10%?(give two digits after the decimal point)

Z = ( . . ). = 1.686% of students game the system when using ASSISTments.If a school has over 10% gaming the system, a giant sirengoes off in Ryan's apartment at 3am.
(His daughter put it there).
If 100 students use ASSISTments in a school,what is the probability that the sample average isover 10%?(give two digits after the decimal point)

P(Z>1.68) = 1 – P(Z<1.68)
6% of students game the system when using ASSISTments.If a school has over 10% gaming the system, a giant sirengoes off in Ryan's apartment at 3am.
(His daughter put it there).
If 100 students use ASSISTments in a school,what is the probability that the sample average isover 10%?(give two digits after the decimal point)
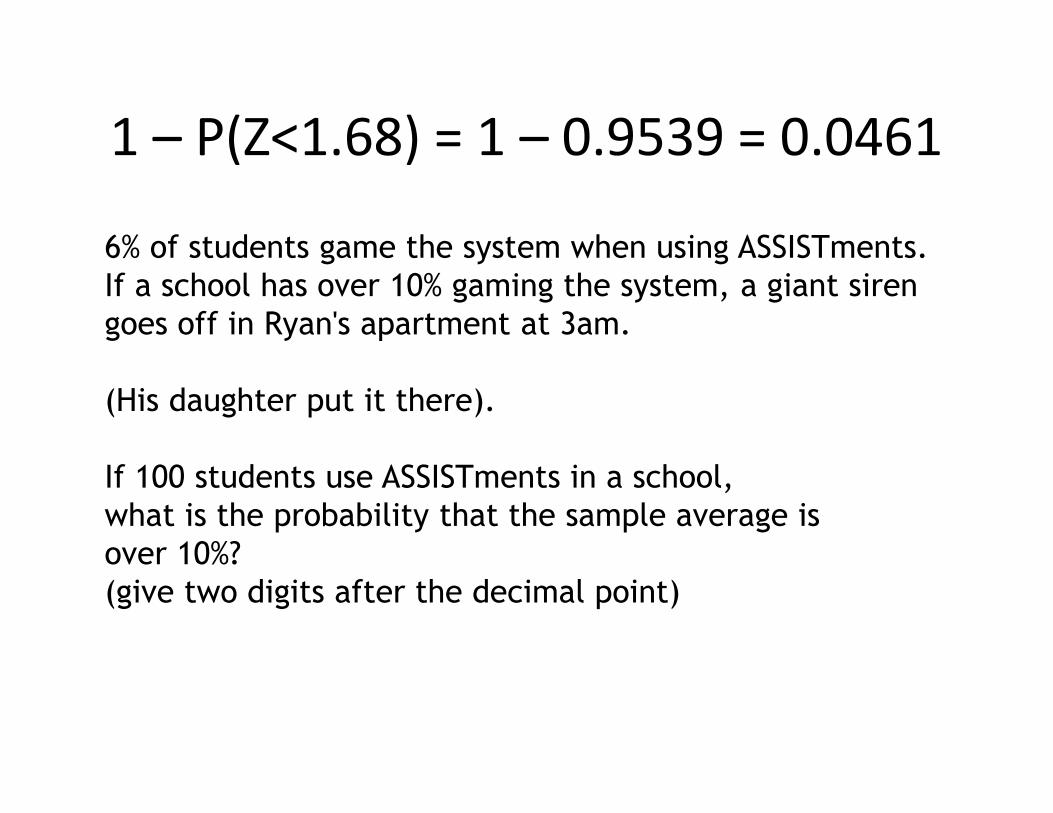
1 – P(Z<1.68) = 1 – 0.9539 = 0.0461
6% of students game the system when using ASSISTments.If a school has over 10% gaming the system, a giant sirengoes off in Ryan's apartment at 3am.
(His daughter put it there).
If 100 students use ASSISTments in a school,what is the probability that the sample average isover 10%?(give two digits after the decimal point)

Questions? Comments?

Any more questions
• About the sampling distribution of the mean?• Or standard error?
Today
• Chapter 8.1-8.5 in Mendenhall, Beaver, &Beaver
• Statistical Inference and Confidence Intervals
Statistical Inference
• I don’t much like the definition of this in MBB
• In particular, because it uses the termparameter in a way that I think is confusing
• So I will instead go with Wikipedia

Statistical Inference(Wikipedia)
• Statistical inference is the process of deducingproperties of an underlying distribution by analysis ofdata
• Inferential statistical analysis infers properties about apopulation: this includes testing hypotheses andderiving estimates.
• The population is assumed to be larger than theobserved data set; in other words, the observed data isassumed to be sampled from a larger population

And…
• The sample should not be biased
• It should be selected, as much as possible,randomly (or in a stratified fashion) from yourpopulation of interest

So, in other words…
• There is something you want to know about apopulation’s statistical properties
• You take a sample
So, in other words…
• You use that sample to validly answer aquestion about
• Estimation: The value of some aspect of thepopulation, such as its mean or standarddeviation
• Hypothesis testing: A hypothesis you haveabout the population

For any statistical problem
• You need to measure the goodness of youranswer
• E.g. how accurate, precise, reliable,trustworthy, general, etc. is your answer

We’ve already been doing this
• But in the remaining weeks we will formalizethis process, and study how to answer furtherquestions

MBB say
• That a statistical procedure provides anumerical measure of an inference’s goodness

But I disagree a bit
• A measure of goodness is a good thing• But several measures of goodness is an even
better thing

Several measures of goodness
• There is active debate right now in thebroader scientific community, for example,about– Whether and when p values are appropriate– Which effect size measures should be used as
complements to p values in which situations• R (correlation) is a popular option, for example
– And indeed, where statistical significance testingshould be used, and where other methods such ascross-validation are preferred

This class is not about these debates…
• But I will try to bring them in, where relevant

Questions? Comments?

Types of estimation
• Point estimation – a single number iscalculated to estimate a statistic
• Interval estimation – two numbers arecalculated to give an upper and lower boundon a statistic, with a certain confidence

Showing an interval graphically
• People often draw graphs with “standard errorbars”
• For example, let’s say that• = 5• SE = 1
• You can draw this as

= 5, SE = 1

Intervals
• By convention, when people show intervalsgraphically, they typically use 1 SE bars
• When people represents intervals numerically,they typically give 95% Confidence Intervals
• These are, of course, magic numbers– There’s nothing inherently wrong with 0.75 SE
bars, or 99% Confidence Intervals
Example
• Point estimation – I believe that the averageheight of the class is 5’5”
• Interval estimation – I believe that there is95% confidence that the average height of theclass is between 5’2” and 5’8”

Example
• Point estimation – The standard deviation forheight is 3”
• Interval estimation – There is 95% confidencethat the standard deviation for height isbetween 1.2” and 4.8”

Computing a 95% Confidence Interval
• Assuming a normal distribution, and asufficiently large sample
• 95% of the data will fall between-1.96 SE and +1.96 SE
• (from 0.025 to 0.0975 on the cumulativenormal distribution)
For example
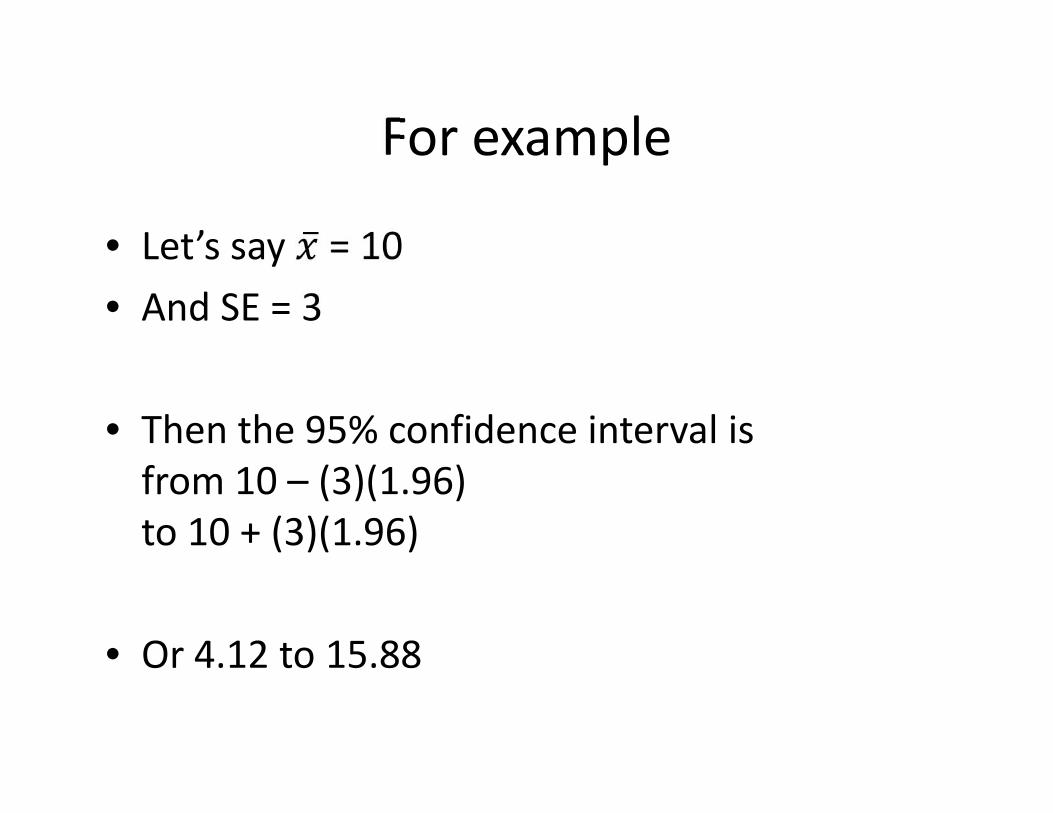
• Let’s say = 10• And SE = 3
• Then the 95% confidence interval isfrom 10 – (3)(1.96)to 10 + (3)(1.96)
• Or 4.12 to 15.88
You try it
• Let’s say = 5• And SE = 1
• What’s the 95% confidence interval?

You try it
• Let’s say = 5• And SE = 1
• What’s the 95% confidence interval?– [5-1.96, 5+1.96]– [3.04, 6.96]
Connecting this to earlier skills –you try it
• A TC professor is studying the grades on anexam taken by 49 students
• The students get an average (sampled) gradeof 80
• The students get a standard deviation of 7• What is the 95% confidence interval for the
average grade?

SE =
• A TC professor is studying the grades on anexam taken by 49 students
• The students get an average (sampled) gradeof 80
• The students get a standard deviation of 7• What is the 95% confidence interval for the
average grade?
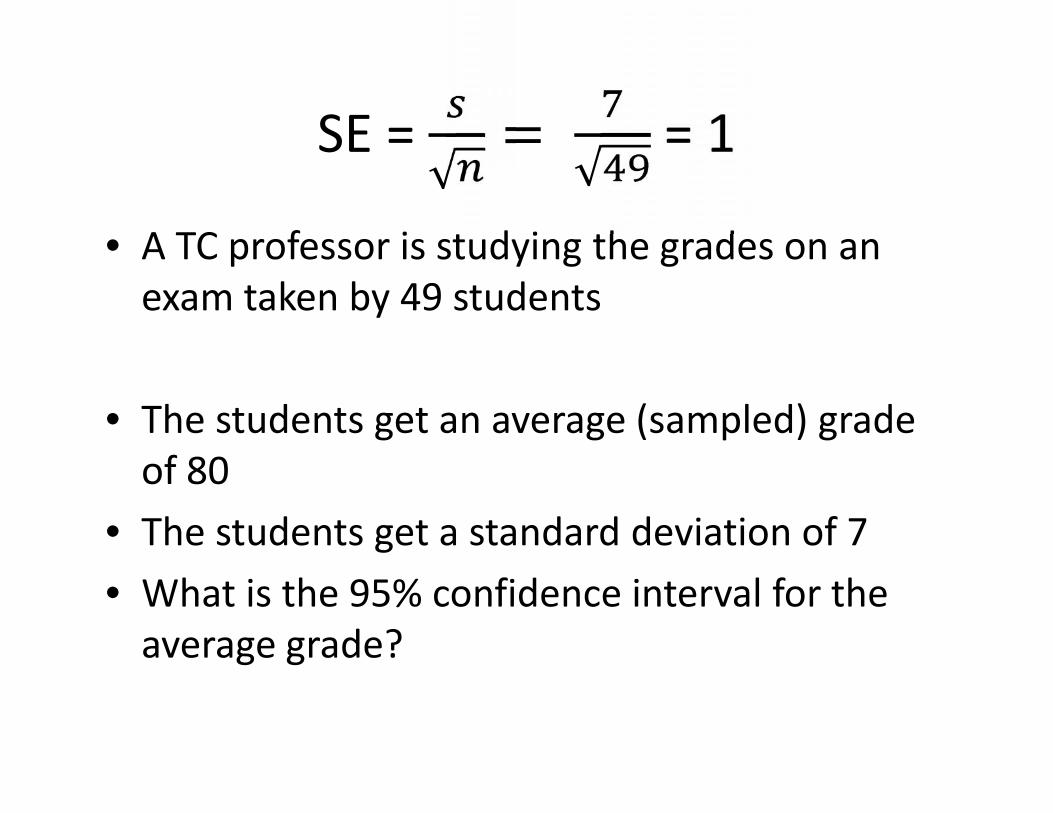
SE = = = 1
• A TC professor is studying the grades on anexam taken by 49 students
• The students get an average (sampled) gradeof 80
• The students get a standard deviation of 7• What is the 95% confidence interval for the
average grade?

-1.96SE = -1.96(1); +1.96SE = +1.96(1)
• A TC professor is studying the grades on anexam taken by 49 students
• The students get an average (sampled) gradeof 80
• The students get a standard deviation of 7• What is the 95% confidence interval for the
average grade?

95% CI = [80-1.96, 80+1.96]
• A TC professor is studying the grades on anexam taken by 49 students
• The students get an average (sampled) gradeof 80
• The students get a standard deviation of 7• What is the 95% confidence interval for the
average grade?

95% CI = [78.04, 81.96]
• A TC professor is studying the grades on anexam taken by 49 students
• The students get an average (sampled) gradeof 80
• The students get a standard deviation of 7• What is the 95% confidence interval for the
average grade?

Connecting this to earlier skills –Example
• A TC professor wants to know whatpercentage of students in NYC PS 24601 liketheir school
• The professor surveys 16 students, and findsthat 75% like their schools
• What is the 95% Confidence Interval?

SE =
• A TC professor wants to know whatpercentage of students in NYC PS 24601 liketheir school
• The professor surveys 16 students, and findsthat 75% like their schools
• What is the 95% Confidence Interval?

SE = ( . )( . )• A TC professor wants to know what
percentage of students in NYC PS 24601 liketheir school
• The professor surveys 16 students, and findsthat 75% like their schools
• What is the 95% Confidence Interval?

SE = .• A TC professor wants to know what
percentage of students in NYC PS 24601 liketheir school
• The professor surveys 16 students, and findsthat 75% like their schools
• What is the 95% Confidence Interval?
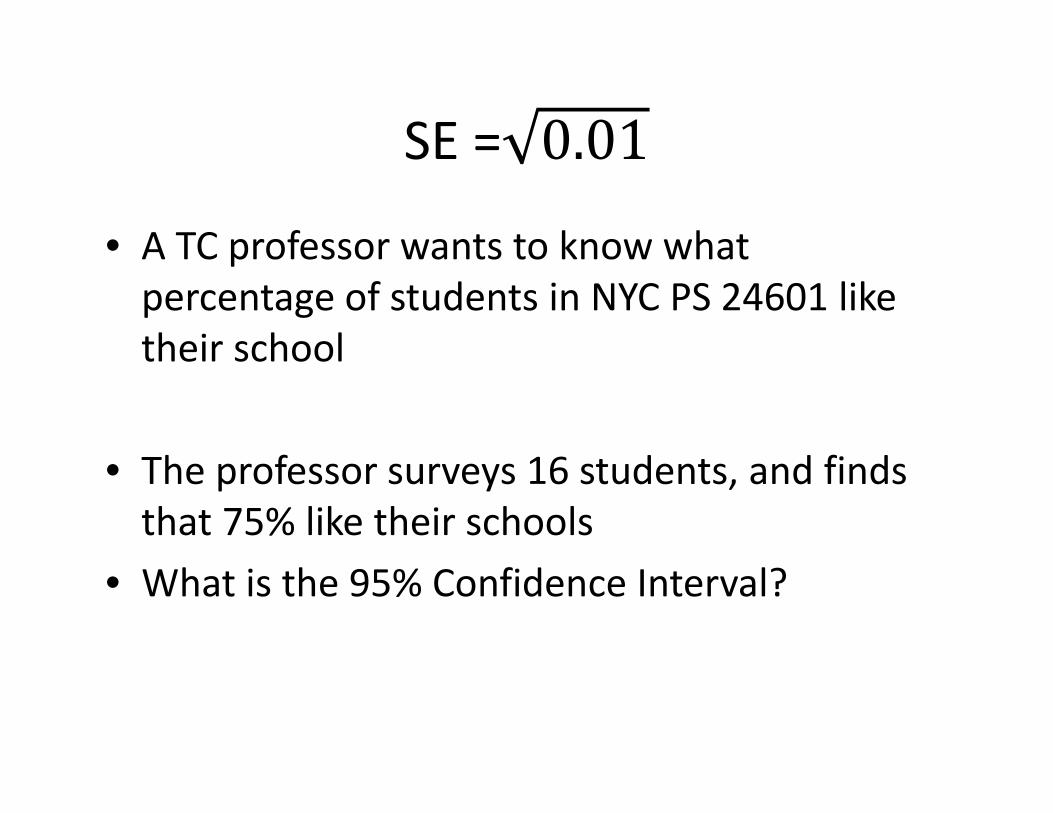
SE = 0.01• A TC professor wants to know what
percentage of students in NYC PS 24601 liketheir school
• The professor surveys 16 students, and findsthat 75% like their schools
• What is the 95% Confidence Interval?

SE = 0.1
• A TC professor wants to know whatpercentage of students in NYC PS 24601 liketheir school
• The professor surveys 16 students, and findsthat 75% like their schools
• What is the 95% Confidence Interval?

95% CI = [ -1.96*0.1, +1.96*0.1]
• A TC professor wants to know whatpercentage of students in NYC PS 24601 liketheir school
• The professor surveys 16 students, and findsthat 75% like their schools
• What is the 95% Confidence Interval?

95% CI = [ -.196, +.196]
• A TC professor wants to know whatpercentage of students in NYC PS 24601 liketheir school
• The professor surveys 16 students, and findsthat 75% like their schools
• What is the 95% Confidence Interval?

95% CI = [.75-.196, .75+.196]=[.554,.946]
• A TC professor wants to know whatpercentage of students in NYC PS 24601 liketheir school
• The professor surveys 16 students, and findsthat 75% like their schools
• What is the 95% Confidence Interval?

95% CI = [.75-.196, .75+.196]=[.554,.946]
• In other words, 50% is not in the 95%confidence interval for this proportion; it islikely to be greater than 50%

Connecting this to earlier skills –You Try It
• You want to know whether ZYXKeyboard.comhelps kids learn
• According to one researcher, who studied 100children, 60% of children learn
• What is the 95% Confidence Interval for theproportion of students that learn?

SE =
• You want to know whether ZYXKeyboard.comhelps kids learn
• According to one researcher, who studied 100children, 60% of children learn
• What is the 95% Confidence Interval for theproportion of students that learn?

SE = ( . )( . )• You want to know whether ZYXKeyboard.com
helps kids learn
• According to one researcher, who studied 100children, 60% of children learn
• What is the 95% Confidence Interval for theproportion of students that learn?

SE = . = 0.05
• You want to know whether ZYXKeyboard.comhelps kids learn
• According to one researcher, who studied 100children, 60% of children learn
• What is the 95% Confidence Interval for theproportion of students that learn?

95% CI = [.6-(1.96)(.05),.6+(1.96)(.05)]=[.504,.696]
• You want to know whether ZYXKeyboard.comhelps kids learn
• According to one researcher, who studied 100children, 60% of children learn
• What is the 95% Confidence Interval for theproportion of students that learn?

95% CI = [.6-.05, .6+.05]=[.55,.65]
• In other words, 50% is not in the 95%confidence interval for this proportion; thetrue value is likely to be greater than 50%
Maximum margin of error
• For any given sample size, the maximummargin of error is reached when p = q = 0.5
• When a polling agency says “margin of error”,they mean 95% CI for maximum margin oferror

Example from the book
• Gallup, Harris, and Roper polls use sample sizeof 1000
• So, the margin of error is
• 1.96 ( . )( . ) = 0.031 or approximately 3%
Questions? Comments?

Final questions or commentsfor the day?

Upcoming Classes
• 4/1 Estimating Differences
• 4/6 Z tests– HW7 due
• 4/8 No class