Hubble Space Telescope Battery Capacity Trend …...HUBBLE SPACE TELESCOPE PROJECT Hubble Space...
60
HUBBLE SPACE TELESCOPE PROJECT Hubble Space Telescope Battery Capacity Trend Studies Roger Hollandsworth Jon Armantrout Lockheed Martin Missile Space Operations Sunnyvale, CA Gopalakrishna M. Rao NASAlGoddard Space Flight Center Greenbelt, MD 2003 NASA Aerorpacr Banery Workshop Battery cell wear out mechanisms and signatures are examined and compared to orbital data from the six on-orbit Hubble Space Telescope (HST) batteries, and the Flight Spare Battery (FSB) Test Bed at Marshall Space Flight Center (MSFC), which is instrumented with individual cell voltage monitoring. Capacity trend data is presented which suggests HST battery replacement is required in 2005-2007 or sooner. https://ntrs.nasa.gov/search.jsp?R=20040040114 2020-05-25T01:35:17+00:00Z
Transcript of Hubble Space Telescope Battery Capacity Trend …...HUBBLE SPACE TELESCOPE PROJECT Hubble Space...
HUBBLE SPACE TELESCOPE PROJECT
Hubble Space Telescope
Battery Capacity Trend Studies
Roger Hollandsworth Jon Armantrout
Lockheed Martin Missile Space Operations Sunnyvale, CA
Gopalakrishna M. Rao NASAlGoddard Space Flight Center
Greenbelt, MD
2003 NASA Aerorpacr Banery Workshop
Battery cell wear out mechanisms and signatures are examined and compared to orbital data from the six on-orbit Hubble Space Telescope (HST) batteries, and the Flight Spare Battery (FSB) Test Bed at Marshall Space Flight Center (MSFC), which is instrumented with individual cell voltage monitoring. Capacity trend data is presented which suggests HST battery replacement is required in 2005-2007 or sooner.
https://ntrs.nasa.gov/search.jsp?R=20040040114 2020-05-25T01:35:17+00:00Z
HUBBLE SPACE TELESCOPE PROJECT
HST Nickel Hydrogen (NiH,) Cell 8nt.r Design Description
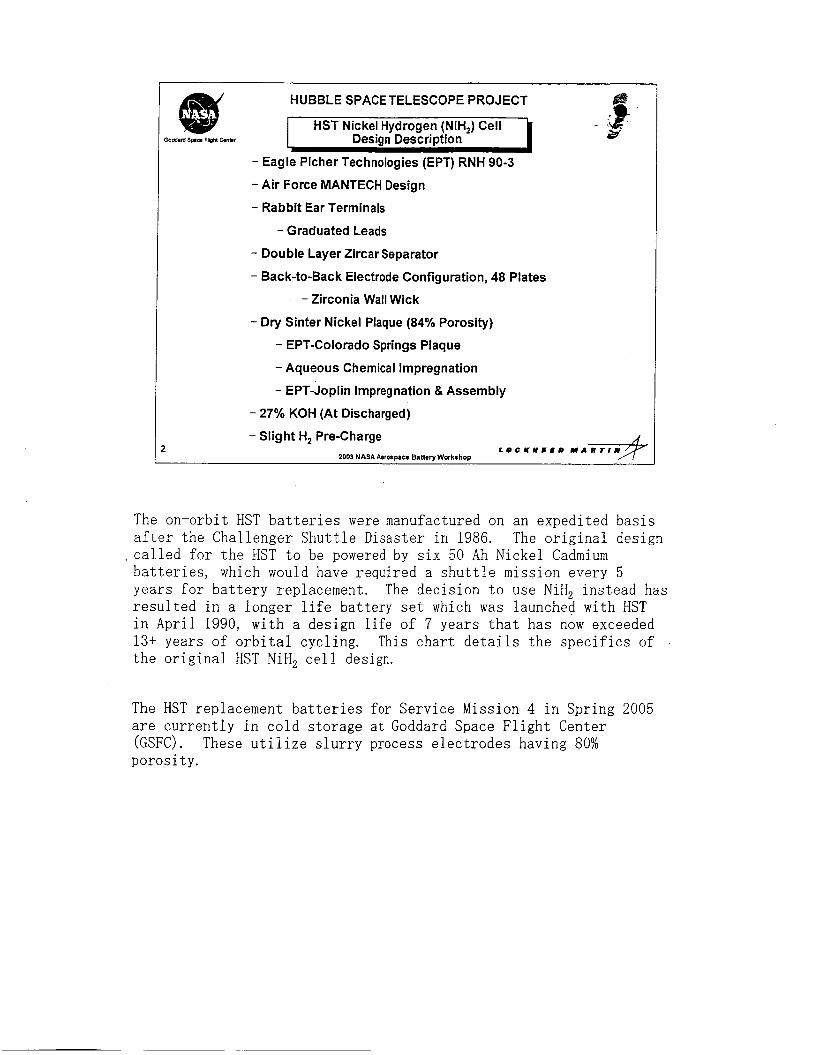
- Eagle Picher Technologies (EPT) RNH 90-3
- Air Force MANTECH Design
- Rabbit Ear Terminals
- Graduated Leads
- Double Layer Zircar Separator
- Back-to-Back Electrode Configuration, 48 Plates
- Zirconia Wall Wick
- Dry Sinter Nickel Plaque (84% Porosity)
- EPT-Colorado Springs Plaque
- Aqueous Chemical Impregnation
- EPT-Joplin Impregnation & Assembly
- 27% KOH (At Discharged)
- Slight H, Pre-Charge 2003 NASAAerospace B.liery Workshop
The on-orbit HST batteries were manufactured on an expedited basis after the Challenger Shuttle Disaster in 1986.
batteries, which would have required a shuttle mission every 5 years for battery replacement. resulted in a longer life battery set which was launched with HST in April 1990, with a design life of 7 years that has now exceeded 13+ years of orbital cycling. This chart details the specifics of the original HST NiH, cell design.
The original design ,called for the HST to be powered by six 50 Ah Nickel Cadmium
The decision to use NiH, instead has
The HST replacement batteries for Service Mission 4 in Spring 2005 are currently in cold storage at Goddard Space Flight Center (GSFC). porosity.
These utilize slurry process electrodes having 80%
3
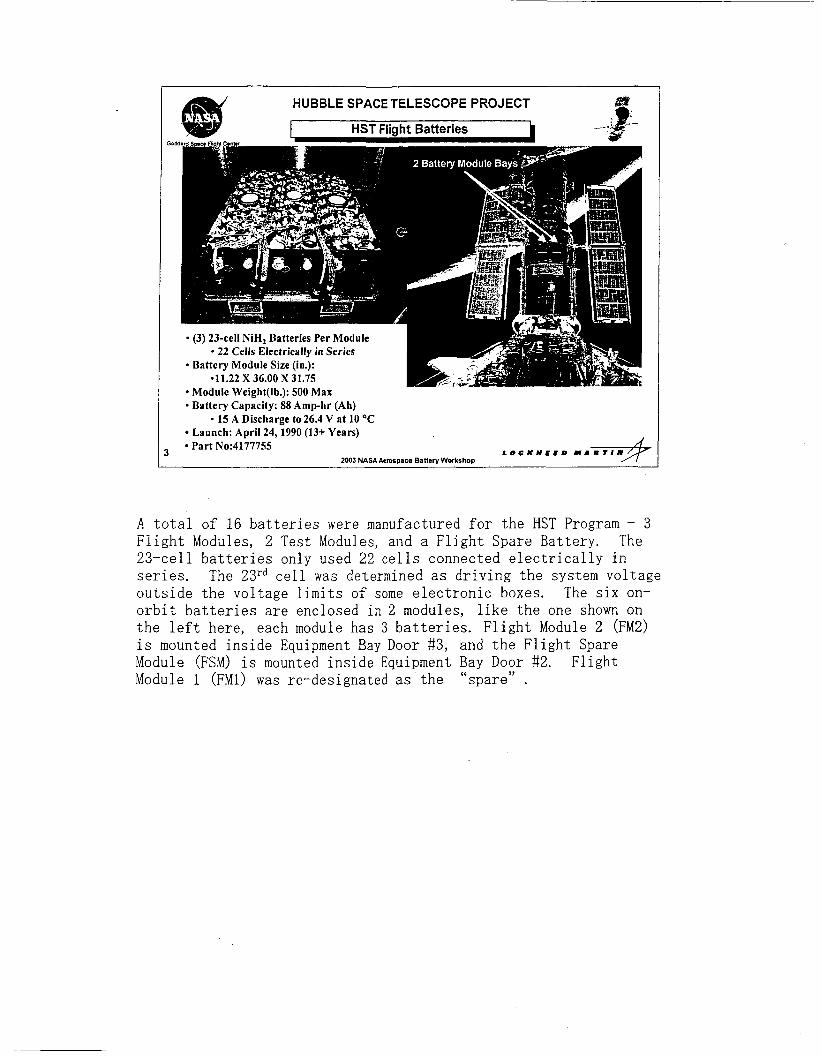
- Battery Capacity: 88 Amp-hr (Ah)
Launch: April 24,1990 (13+ Years) Part No:4177755
15 A Discharge to 26.4 V at 10 ‘C
ZOO3 NASA Aer~ssace BaIteN Workrhos / I
A total of 16 batteries were manufactured for the HST Program - 3 Flight Modules, 2 Test h!odules, and a Flight Spare Battery. The 23-cell batteries only used 22 cells connected electrically in series. outside the voltage limits of some electronic boxes. The six on- orbit batteries are enclosed in 2 modules, like the one shown on the left here, each module has 3 batteries. Flight Module 2 (FM2) is mounted inside Equipment Bay Door #3, and the Flight Spare Module (FSM) is mounted inside Equipment Bay Door #2. Flight Module 1 (FM1) was re-designated as the “spare” .
The 23rd cell was determined as driving the system voltage
HUBBLE SPACE TELESCOPE PROJECT
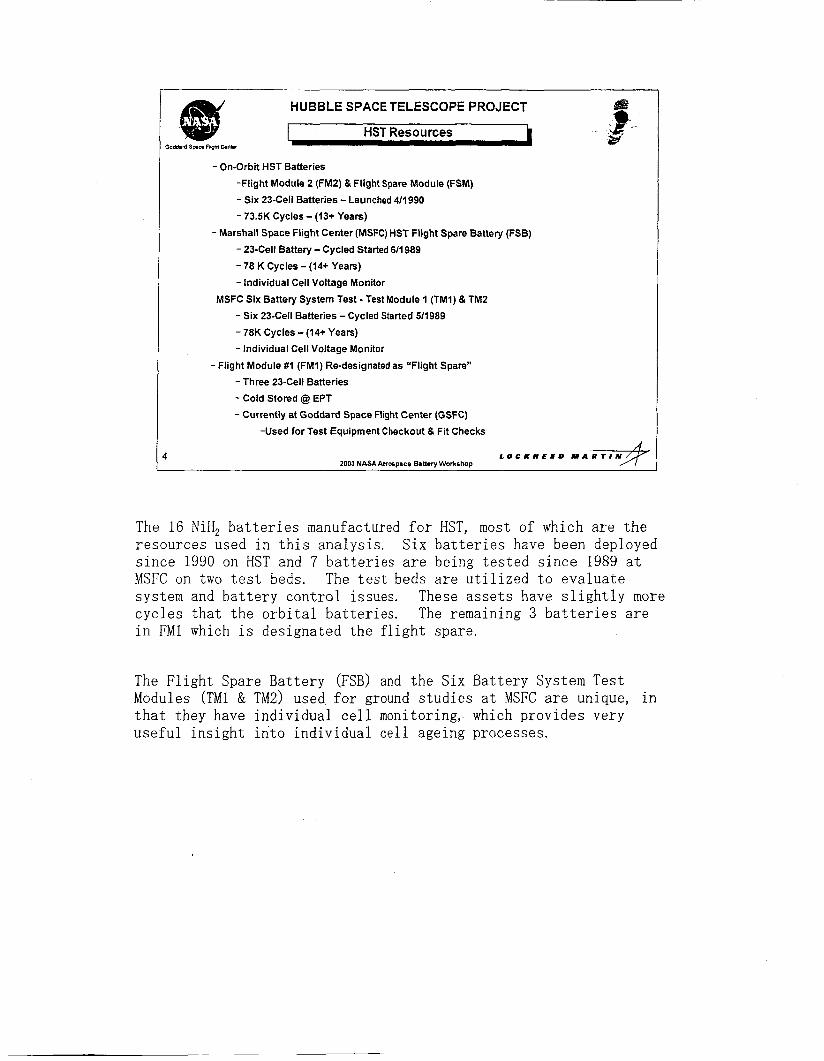
1 HST Resources 1 - On-Orbit HST Batteries
-Flight Module 2 (FM2) 8 Flight Spare Module (FSM)
- Six 23-Cell Batteries - Launched 4/1990
- 73.5K Cycles - (13+ Years)
- 23-Cell Battery - Cycled Started 6/1989
- 78 K Cycles - (14+ Years)
- Individual Cell Voltage Monitor
- Six 23-Cell Batteries -Cycled Started 511989
- 78K Cycles - (14+ Years)
- Individual Cell Voltage Monitor
- Three 23-Cell Batteries
- Cold Stored @ EPT
- Currently at Goddard Space Flight Center (GSFC)
- Marshall Space Flight Center (MSFC) HST Flight Spare Battery (FSB)
-MSFC Six Battery System Test - Test Module 1 (TMI) & TM2
-Flight Module #I (FMI) Re-designated as “Flight Spare”
-Used for Test Equipment Checkout & Fit Checks
2003 NASA Aeror~ace Eanerv Workshoo
The 16 NiH, batteries manufactured for I-IST, most of which are the resources used in this analysis. since 1990 on HST and 7 batteries are being tested since 1989 at MSFC on two test beds. The test beds are utilized to evaluate system and battery control issues. cycles that the orbital batteries. The remaining 3 batteries are in FM1 which is designated the flight spare.
Six batteries have been deployed
These assets have slightly more
The Flight Spare Battery (FSB) and the Six Battery System Test Modules (TM1 & TM2) used for ground studies at MSFC are unique, in that they have individual cell monitoring, which provides very useful insight into individual cell ageing processes.
HUBBLE SPACE TELESCOPE PROJECT
1 Cell Battery Ageing Signatures c - Voltage Plateau Degradation And Capacity Fade
- Impedance Growth
- Cell Drop Out
- Second Plateau Formation And Cell Reversal
2003 NASA A e r a p c e Eanery Workshop
During this paper we will show several cell ageing signatures which occur in NiH, batteries with Low Earth Orbital (LEO) cycling.
HUBBLE SPACE TELESCOPE PROJECT
I Discharae Voltaae and CaDacitv Fade b
0 10 20 30 40 50 60 70 80 90 Batteiy Ah Out
2003 NASA Acrosoace hnerv Worksho~
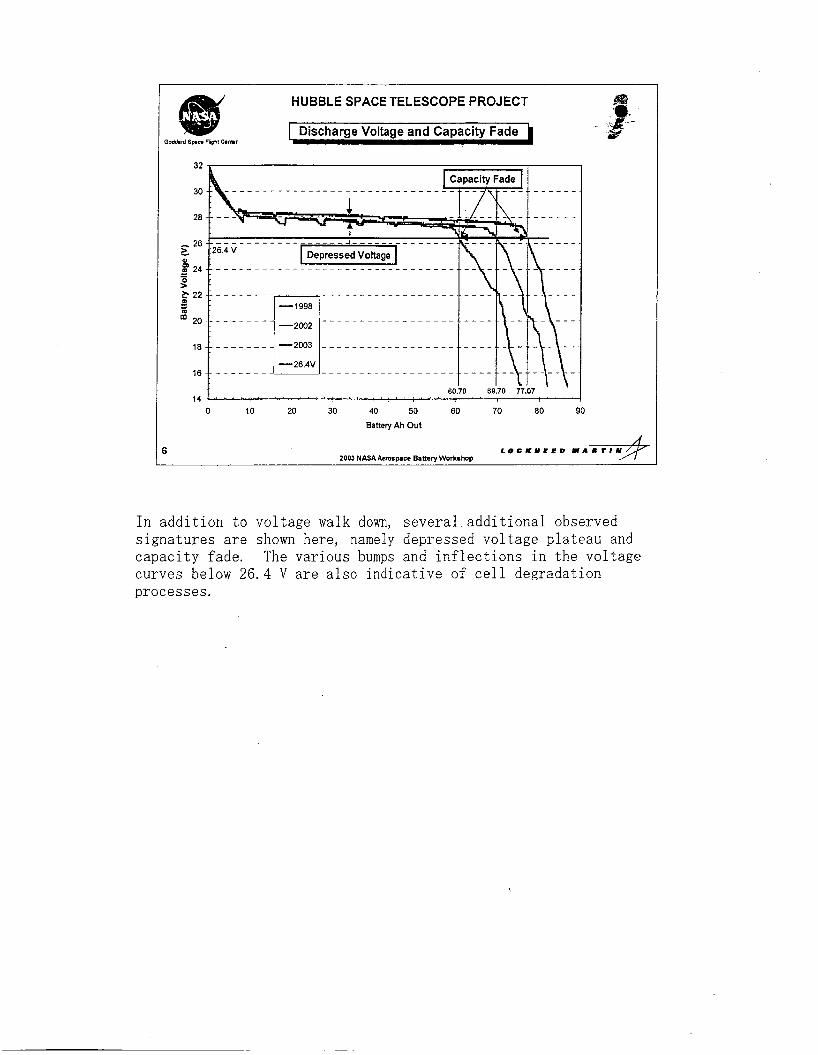
In addition to voltage walk down, several additional observed signatures are shown here, namely depressed voltage plateau and capacity fade. The various bumps and inflections in the voltage curves below 26.4 V are also indicative of cell degradation processes.
HUBBLE SPACE TELESCOPE PROJECT
10,000 11.000 12,000 13.000 14.000 15,000 16,000 17,000 18,000 19,000 20.000 Cycles
f
2003 NASA Aerospace Banery Workshop
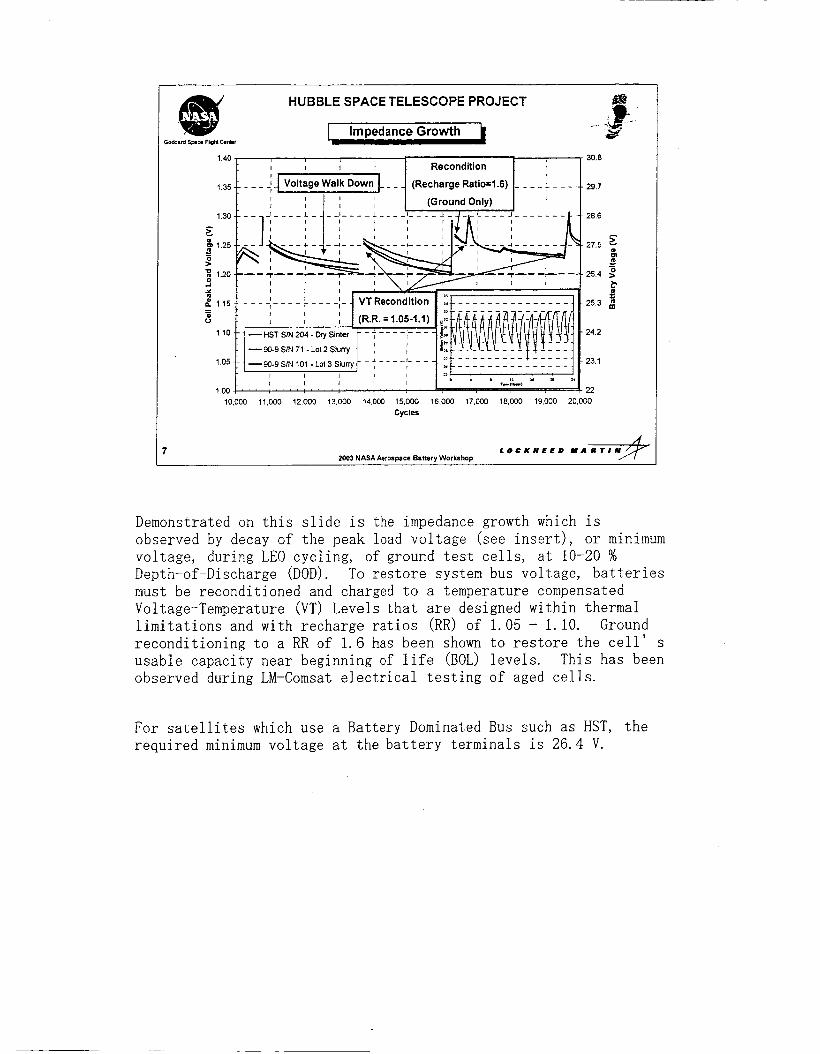
Demonstrated on this slide is the impedance growth which is observed by decay of the peak load voltage (see insert), or minimum voltage, during LEO cycling, of ground test cells, at 10-20 % Depth-of-Discharge (DOD). To restore system bus voltage, batteries must be reconditioned and charged to a temperature compensated Voltage-Temperature (VT) Levels that are designed within thermal limitations and with recharge ratios (RR) of 1.05 - 1. 10. Ground reconditioning to a RR of 1.6 has been shown to restore the cell’ s usable capacity near beginning of life (BOL) levels. This has been observed during LM-Comsat electrical testing of aged cells.
For satellites which use a Battery Dominated Bus such as HST, the required minimum voltage at the battery terminals is 26.4 V.
HUBBLE SPACE TELESCOPE PROJECT
Oo43.d Spm FMM C m u
0 10 20 M 40 5 o w 70 ea 1w 110
Capacity (Ah)
2nd Plateau - 3 Cells Drop Out
2003 NASAAerosoace Bancrv Workrhon 8
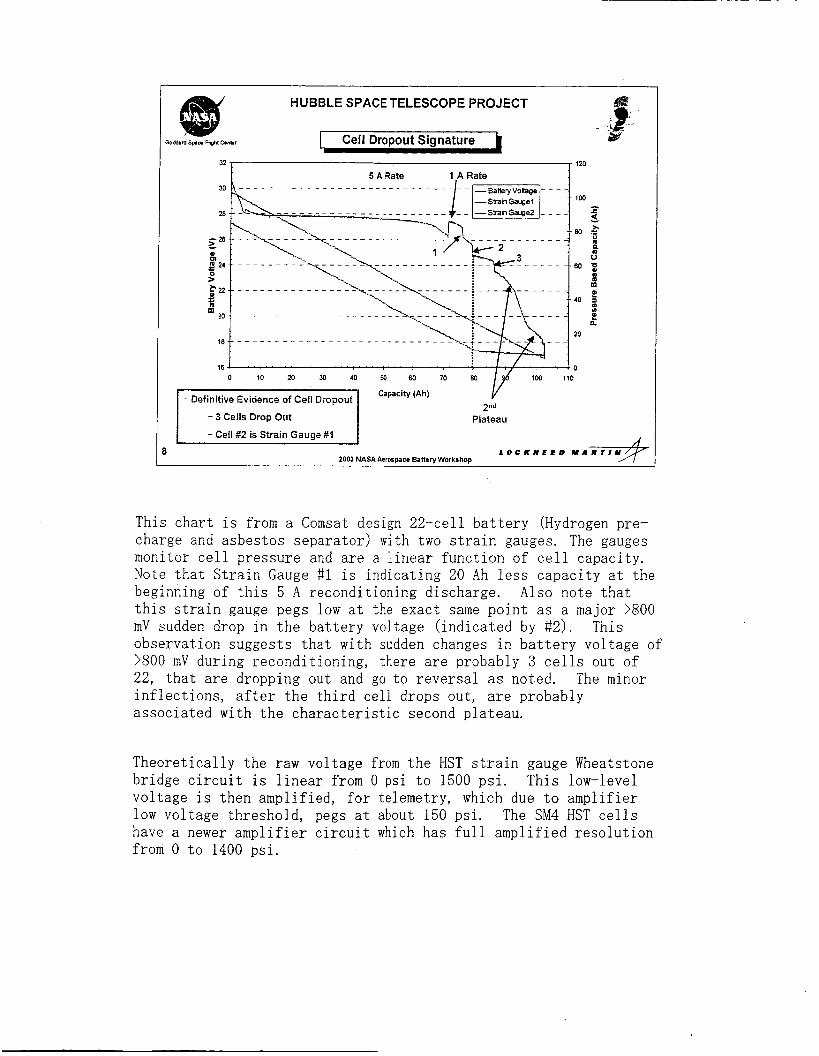
This chart is from a Comsat design 22-cell battery (Hydrogen pre- charge and asbestos separator) with two strain gauges. The gauges monitor cell pressure and are a linear function of cell capacity. Note that Strain Gauge $1 is indicating 20 Ah less capacity at the beginning of this 5 A reconditioning discharge. this strain gauge pegs low at t h e exact same point as a major >800 mV sudden drop in the battery voltage (indicated by #2). observation suggests that with sudden changes in battery voltage of >800 mV during reconditioning, there are probably 3 cells out of 22, that are dropping out and go to reversal as noted. inflections, after the third cell drops out, are probably associated with the characteristic second plateau.
Also note that
This
The minor
Theoretically the raw voltage from the HST strain gauge Wheatstone bridge circuit is linear from 0 psi to 1500 psi. This low-level voltage is then amplified, for telemetry, which due to amplifier low voltage threshold, pegs at about 150 psi. The SM4 HST cells have a newer amplifier circuit which has full amplified resolution from 0 to 1400 psi.
~ _ _ _ _ ~ ~~
HUBBLE SPACE TELESCOPE PROJECT
Cell Dropout and Reversal i Signature
-
0 10 20 30 40 50 60 70 80 90 100 Capacity (Ah)
2003 NASA AtrorDace Batterv Workshov
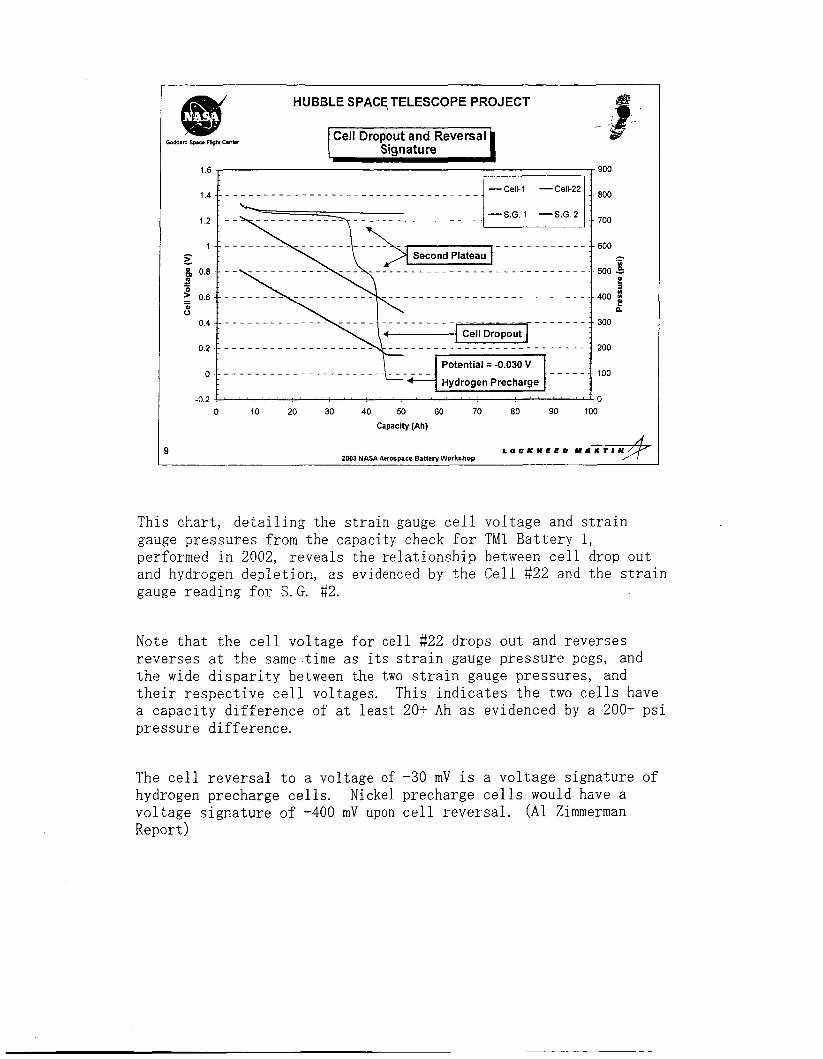
This chart, detailing the strain gauge cell voltage and strain gauge pressures from the capacity check for TMl Battery 1, performed in 2002, reveals the relationship between cell drop out and hydrogen depletion, as evidenced by the Cell 822 and the strain gauge reading for S.G. #2.
Note that the cell voltage for cell #22 drops out and reverses reverses at the same.time as its strain gauge pressure pegs, and the wide disparity between the two strain gauge pressures, and their respective cell voltages. a capacity difference of at least 20+ Ah as evidenced by a 200+ psi pressure difference.
This indicates the two cells have
The cell reversal to a voltage of -30 mV is a voltage signature of hydrogen precharge cells. voltage signature of -400 mV upon cell reversal. Report)
Nickel precharge cells would have a (A1 Zimmerman

HUBBLE SPACE TELESCOPE PROJECT
1 2nd Plateau and Cell Reversal Signatures -
I
Battery 1 April 1997
2003 NASAAerocpsce Banery Workshop 10
Shown here, by the heavy blue line, is the battery discharge curve during a reconditioning cycle of Th41 Battery1 (1997). Comparing the battery trace with traces from the individual cells in this battery, additional signatures are shown f o r second plateau formation, and cell reversal (cell drop out).

HUBBLE SPACE TELESCOPE PROJECT
.-
Flight Spare Battery
Ageing Signatures
2003 NASA Aerospace Banery Workshop I1
HUBBLE SPACE TELESCOPE PROJECT
FSB - August. 1998 - 9 Years
- - 2w \l
Flight Span Ballmy plug. 1998
1.6 1200
0 10 20 30 40 50 60 70 BO 90 100
Capacity(Ah)
2003 NASA Aerospace Battery Workshop 12
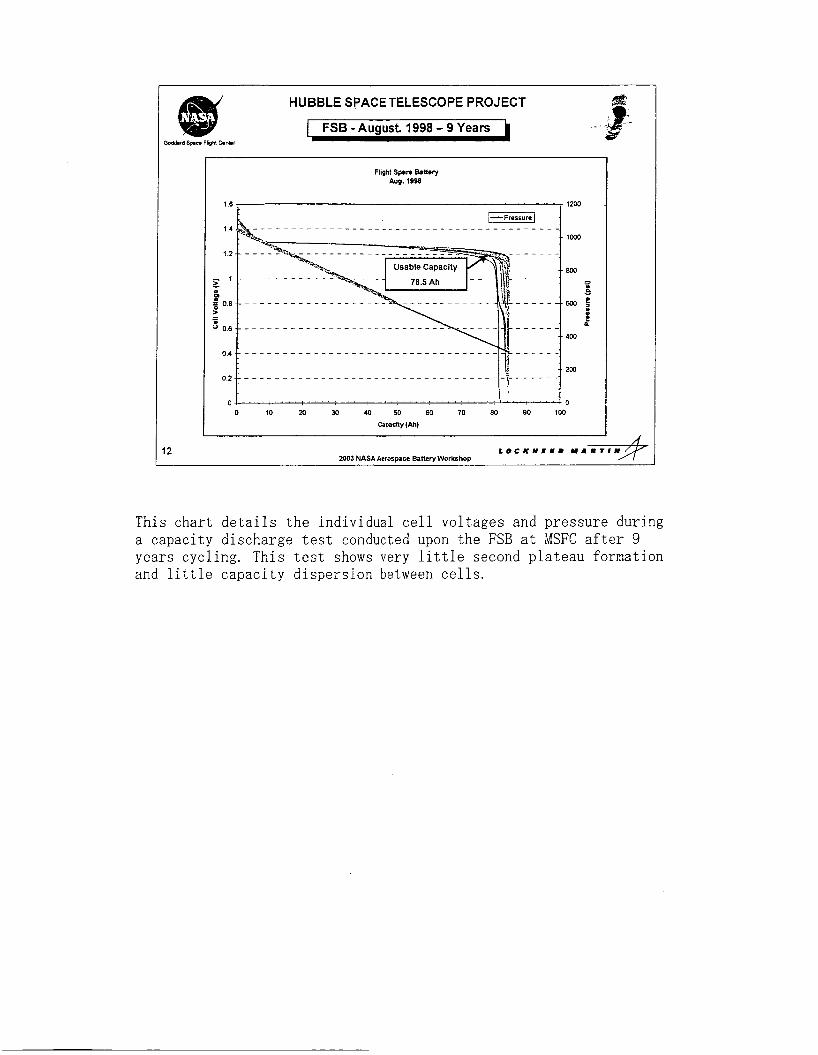
This chart details the individual cell voltages and pressure during a capacity discharge test conducted upon the FSB at MSFC after 9 years cycling. This test shows very little second plateau formation and little capacity dispersion between cells.
HUBBLE SPACE TELESCOPE PROJECT
[ FSB -August 2000 - 11 Years
13
1.6
1.4
1.2
- 1.0 5. 0
e 0.8 2 0.6
0.4
0.2
0.0
Flight Span Battery 8-31-00
4 0 0 10 20 30 40 50 60 70 80 90 100
Gpacity (Ah)
2003 NASA Aerospace Battery Workshop
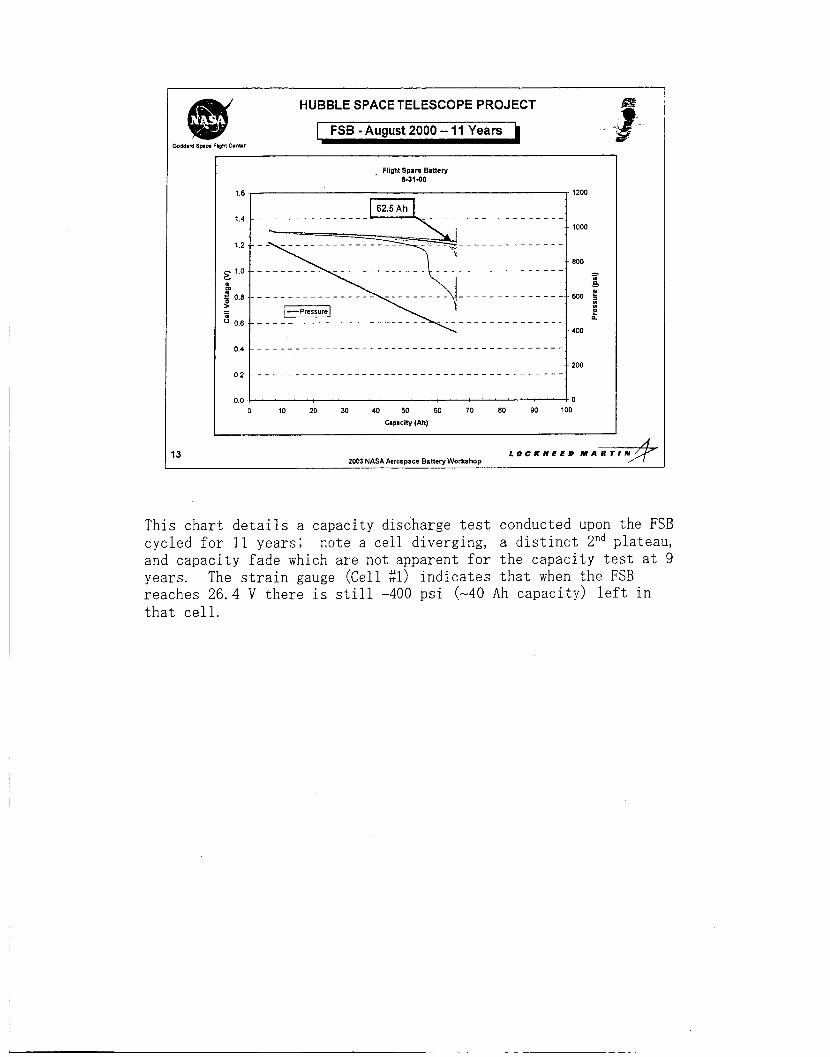
This chart details a capacity discharge test conducted upon the FSB cycled for 11 years; note a cell diverging, a distinct Znd plateau, and capacity fade which are not apparent for the capacity test at 9 years. The strain gauge (Cell 81) indicates that when the FSB reaches 26.4 V there is still -400 psi (-40 Ah capacity) left in that cell.
HUBBLE SPACE TELESCOPE PROJECT
1 FSB - December 2001 - 12 Years __L
14 2003 NASA Aerorplce Battery Workshop
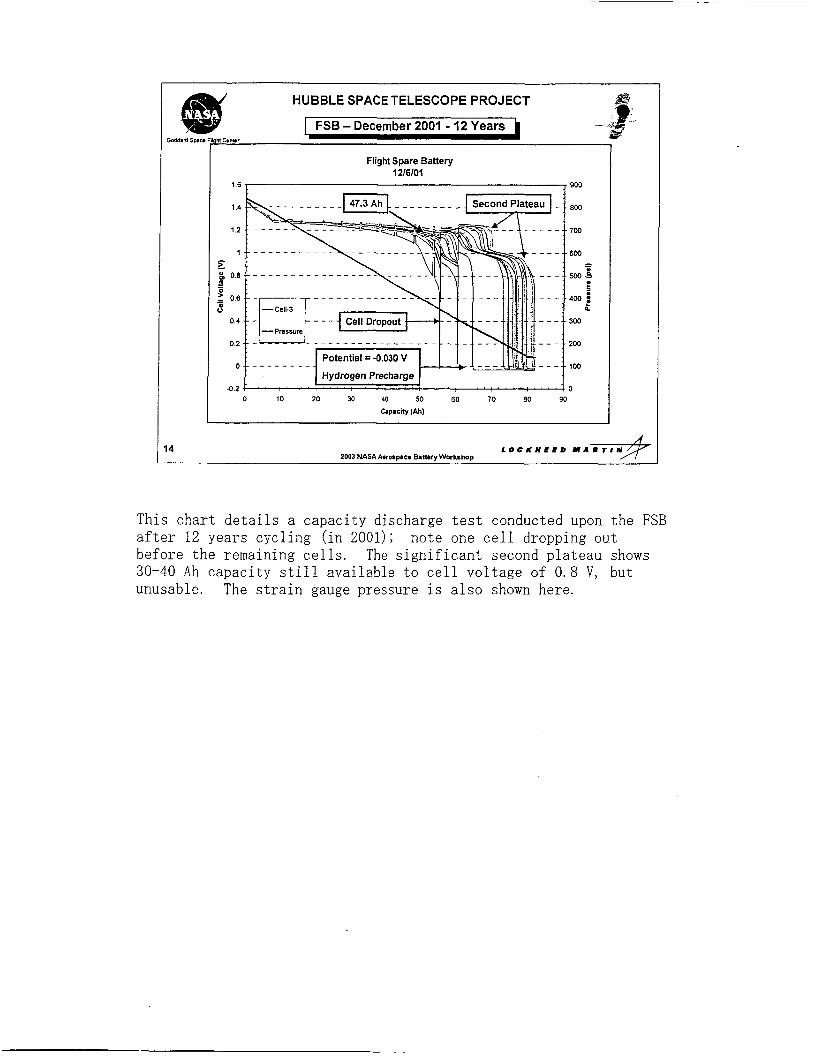
This chart details a capacity discharge test conducted upon the FSB after 12 years cycling (in 2001); before the remaining cells. 30-40 Ah capacity still available to cell voltage of 0.8 V, but unusable.
note one cell dropping out The significant second plateau shows
The strain gauge pressure is also shown here.
HUBBLE SPACE TELESCOPE PROJECT - -
[Cell Wear Out Signatures - FSB -
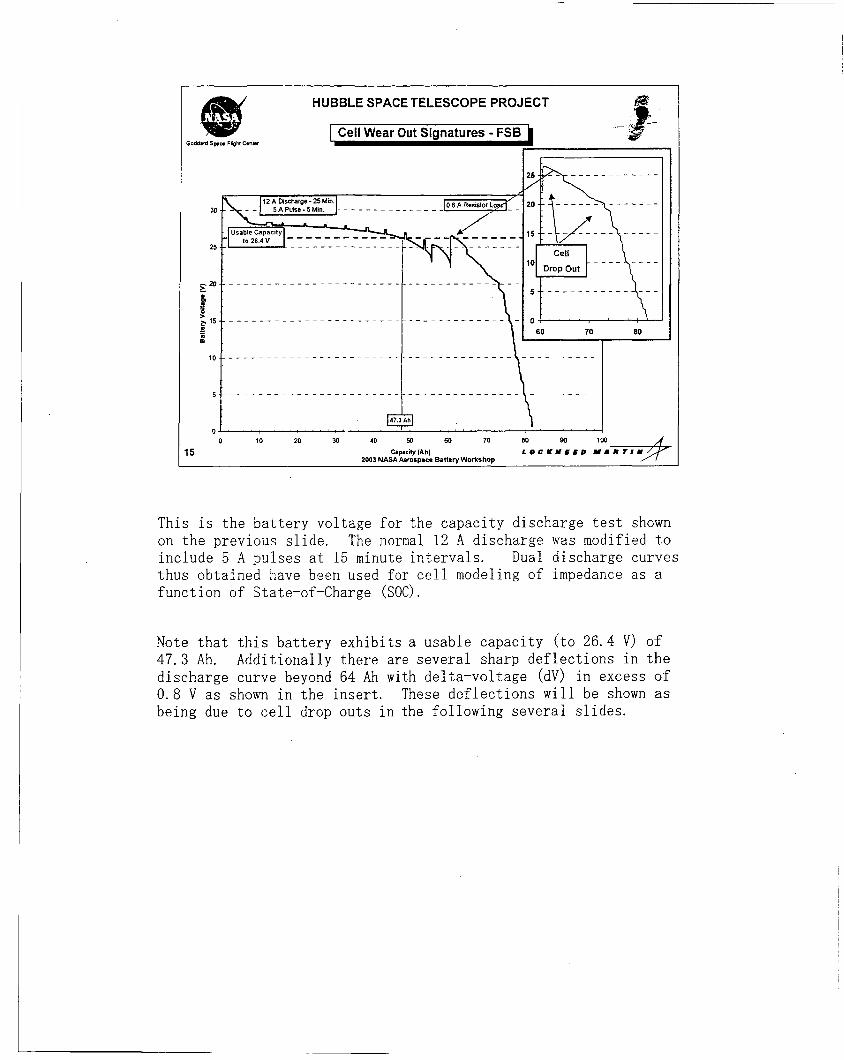
This is the battery voltage for the capacity discharge test shown on the previous slide. The normal 12 A discharge was modified to include 5 A pulses at 15 minute intervals. thus obtained have been used for cell modeling of impedance as a function of State-of-Charge ( S O C ) .
Dual discharge curves
Note that this battery exhibits a usable capacity (to 26.4 V) of 47.3 Ah. Additionally there are several sharp deflections in the discharge curve beyond 64 Ah with delta-voltage (dV) in excess of 0.8 V as shown in the insert. These deflections will be shown as being due to cell drop outs in the following several slides.
HUBBLE SPACE TELESCOPE PROJECT
.- I Cell Wear Out Signatures - FSB
t I I
1 Hydrogen Precharge 1 , - 4 4 " " ' " ' I ' ' : ' ' ' 1 - 0 2
0 10 20 30 40 50 60 70 EO 90 100 Capacity (Ah)
2003 NASA Aarospace BaItery Workshop 16
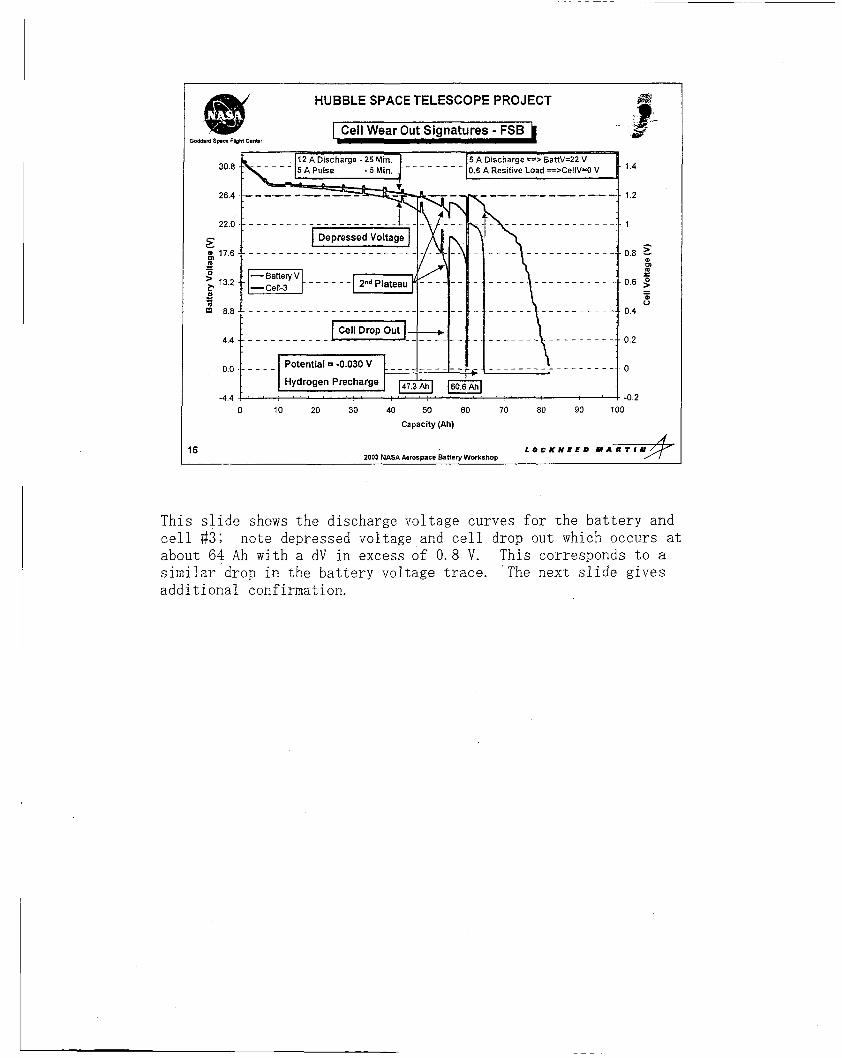
This slide shows the discharge voltage curves for the battery and cell #3; about 64 Ah with a dV in excess of 0.8 V. This corresponds to a similar drop in the battery voltage trace. 'The next slide gives additional confirmation.
note depressed voltage and cell drop out which occurs at
HUBBLE SPACE TELESCOPE PROJECT
Cell Wear Out Signatures - FSB
30.8
26.4
22.0 - 5
- a & 17.6
13.2 0
0 m 8.8
4.4
0.0
-4.4 " 1 - 0 2 0 10 20 30 40 50 60 70 80 90 100
Capacity (Ah)
2003 NASA Aerospace Battery Workshop 7
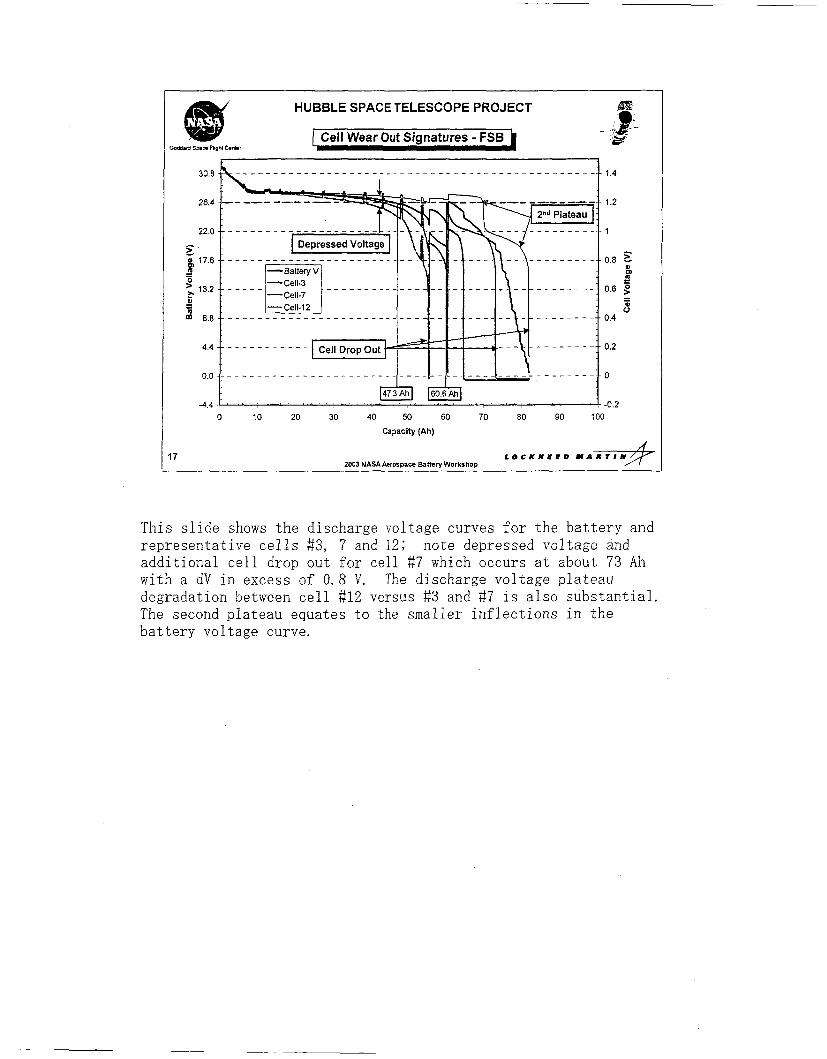
This slide shows the discharge voltage curves for the battery and representative cells $3, 7 and 12; note depressed voltage and additional cell drop out for cell #7 which occurs at about 73 Ah with a dV in excess of 0.8 V. The discharge voltage plateau degradation between cell 812 versus #3 and #7 is also substantial. The second plateau equates to the smaller inflections in the battery voltage curve.
HUBBLE SPACE TELESCOPE PROJECT
- L FSB - October 2001 - 11 Years
900 3add.d S p C . FhpM C.nW
1 6
.- 600
. 0.2 .- - - - - - - - - - - - . - . -. . . - - . - - - - - - . - - - - - - - . - - - - - ,oo
" r O 0 7 " ' ' ~ " ' : " " '
20 30 40 50 60 70 80 90 0 10
Capacity (Ah)
2003 NASA Aerospace Battery Workshop 18
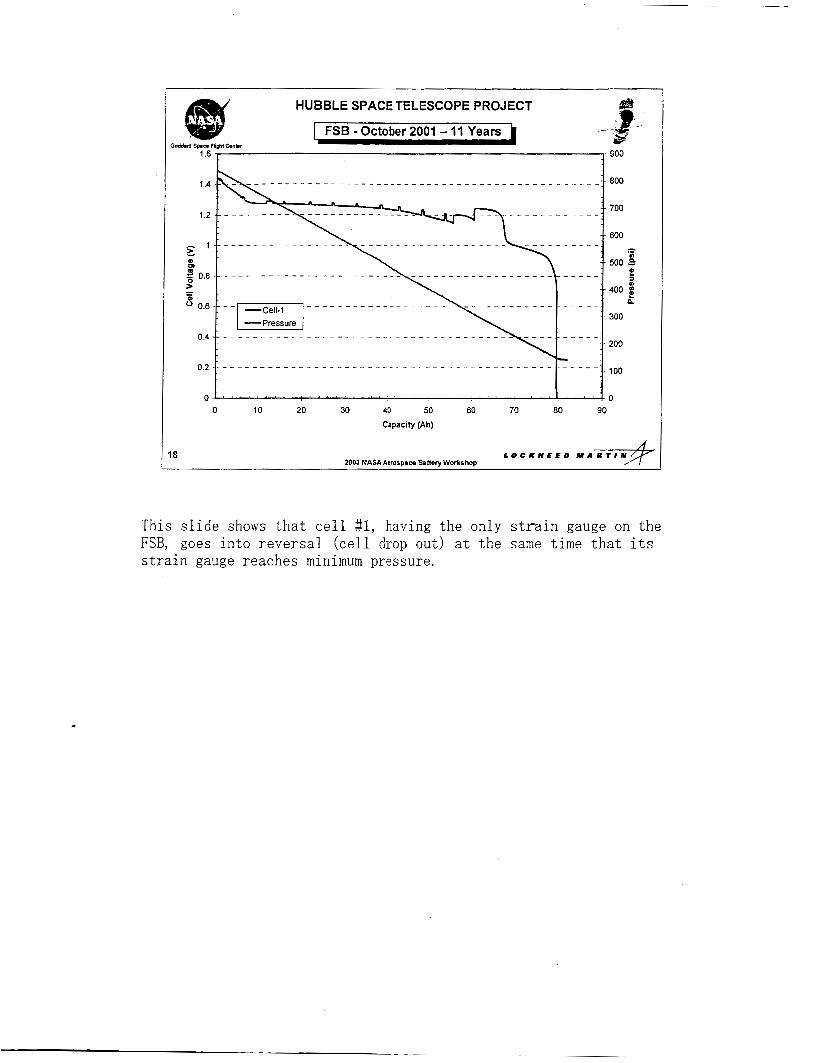
This slide shows that cell #1, having the only strain gauge on the FSB, goes into reversal (cell drop out) at the same time that its strain gauge reaches minimum pressure.
HUBBLE SPACE TELESCOPE PROJECT
I Cell Wear Out signatures - FSB b -
- L 40
60 65 70 75 80 85
Capacity (Ah)
19 2003 NASA Aerospace Banery Workshop
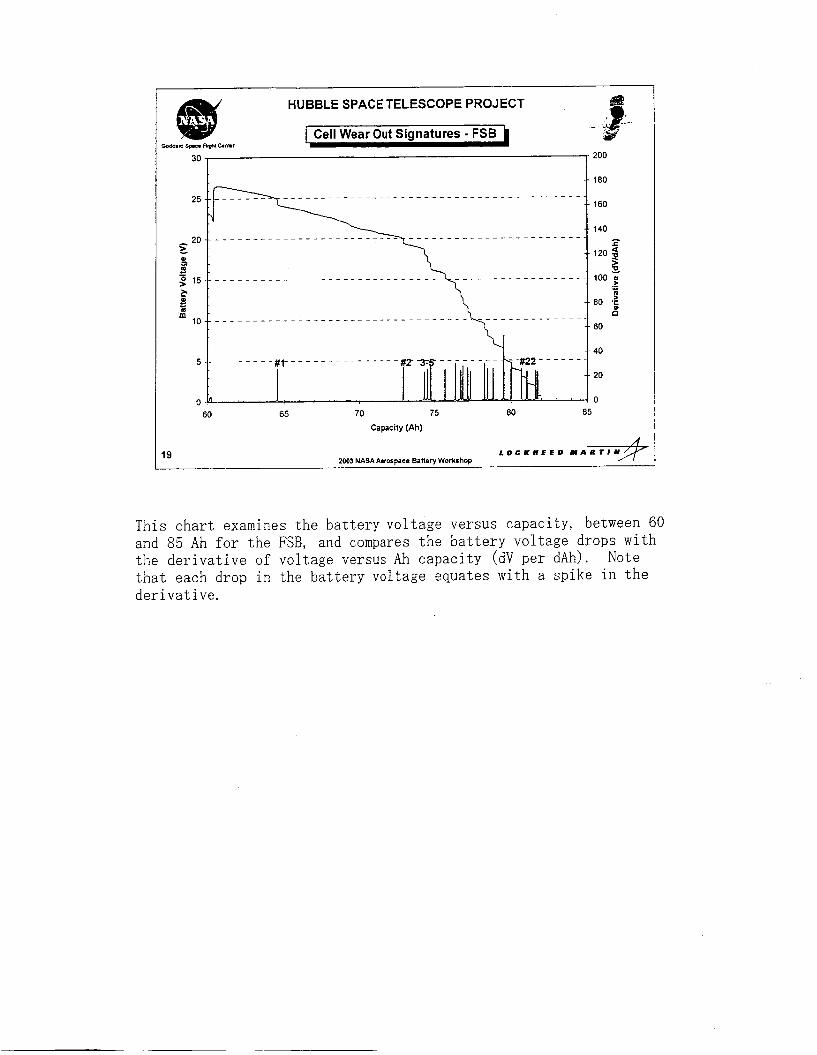
This chart examines the battery voltage versus capacity, between 60 and 85 Ah for the FSB, and compares the battery voltage drops with the derivative of voltage versus Ah capacity (dV per dAh). Note that each drop in the battery voltage equates with a spike in the derivative.
HUBBLE SPACE TELESCOPE PROJECT
5Odd.d smc. b* Cmur
- E 0 0.012 .c
0)
C Q 0.010
c5
.- In 0.008
0.006
-
0.004
0.002
0.000
- 0 440
0 396
0.352
0308 - E 8
0264 g E
0.220 3 2
0.176 $ 5
0132 ' 0 088
0 044
0 000 0 10 20 30 40 50 60 70 80 90 100
Capacity Removed (Ah)
ZOO3 NASA Aerospace Battery Workshop !O
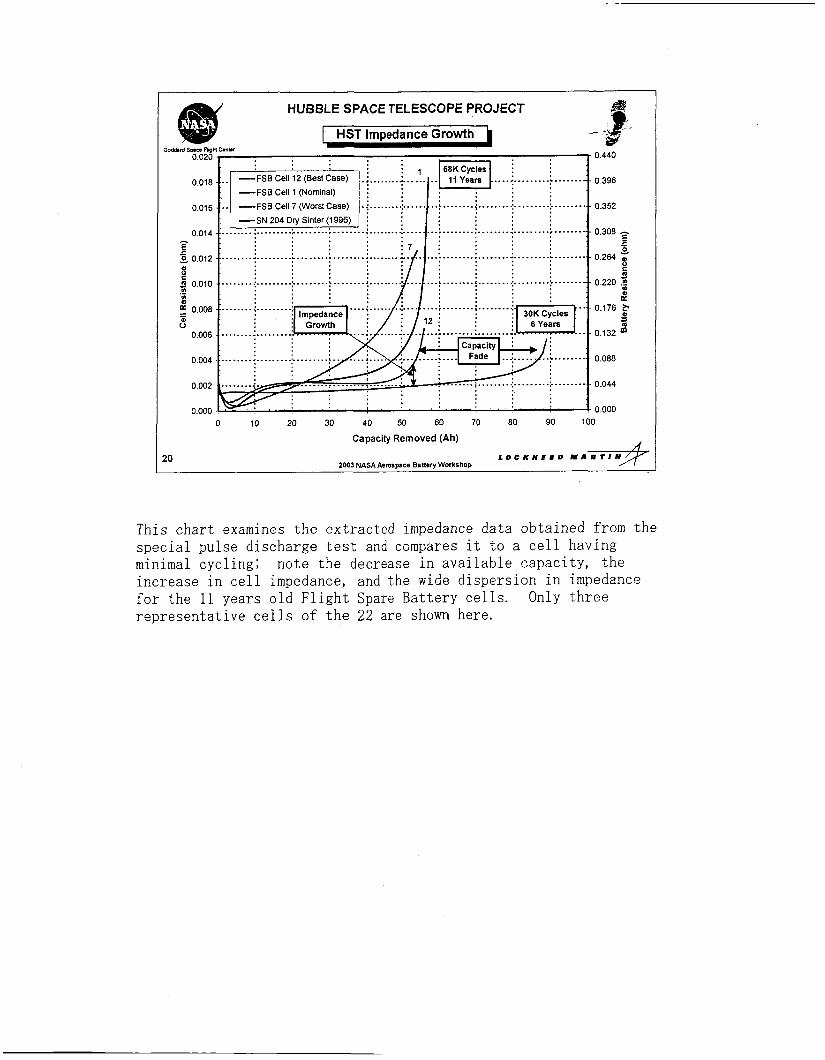
This chart examines the extracted impedance data obtained from the special pulse discharge test and compares it to a cell having minimal cycling; note the decrease in available capacity, the increase in cell impedance, and the wide dispersion in impedance for the 11 years old Flight Spare Battery cells. representative cells of the 22 are shown here.
Only three
HUBBLE SPACE TELESCOPE PROJECT
I HST FSB Cell Usable Capacity 100
90
80
2 70
216 226 231 233 253 260 283 289 292 293 294 295 296 298 299 300 301 302 303 304 305 306 307
Cell SIN
2001 NASAAerospace Battery Workshop 21
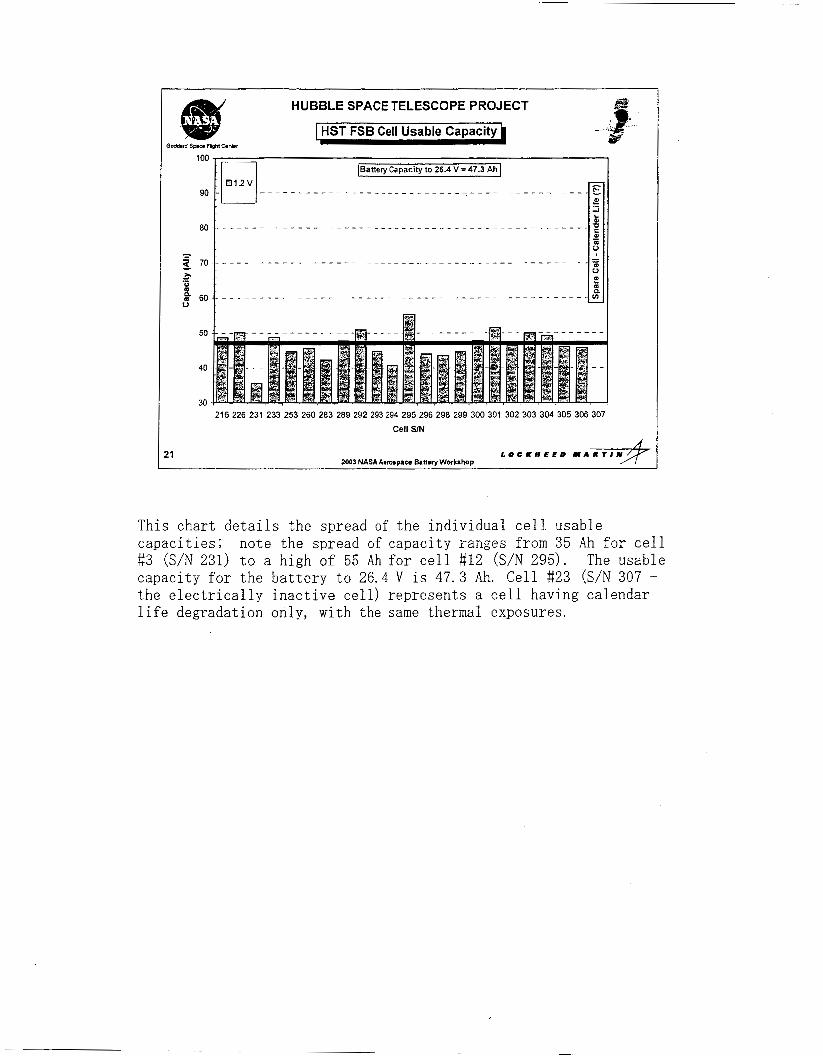
This chart details the spread of the individual cell usable capacities; 83 (S/N 231) t o a high of 55 Ah for cell 812 (S/N 295). capacity for the battery to 26.4 V is 47.3 Ah. Cell #23 (S/N 307 - the electrically inactive cell) represents a cell having calendar life degradation only, with t h e same thermal exposures.
note the spread of capacity ranges from 35 Ah for cell The usable

HUBBLE SPACE TELESCOPE PROJECT
HST FSB Cell 2nd Plateau Capacity
100 [Battery Capacity to 26.4 V = 47.3 Ah I
216 226 231 233 253 260 283 289 292 293 294 295 296 298 299 300 301 302 303 304 305 306 307
Cell SIN
2003 NASA Parorpact Battery Workshop 22
This chart details the spread of the individual cell capacities to cei.1 voltages of 1.0 V and to 1.2 V; fade to 1.0 V tracks that of 1.2 V with very similar second plateau capacities between cells.
note the spread of capacity
HUBBLE SPACE TELESCOPE PROJECT
HST FSB Cell Total Capacity
216 226 231 233 253 260 283 289 292 293 294 295 296 298 299 300 301 302 303 304 305 306 307 Cell SIN
2003 NASAAerorprce Battery Workshop 23
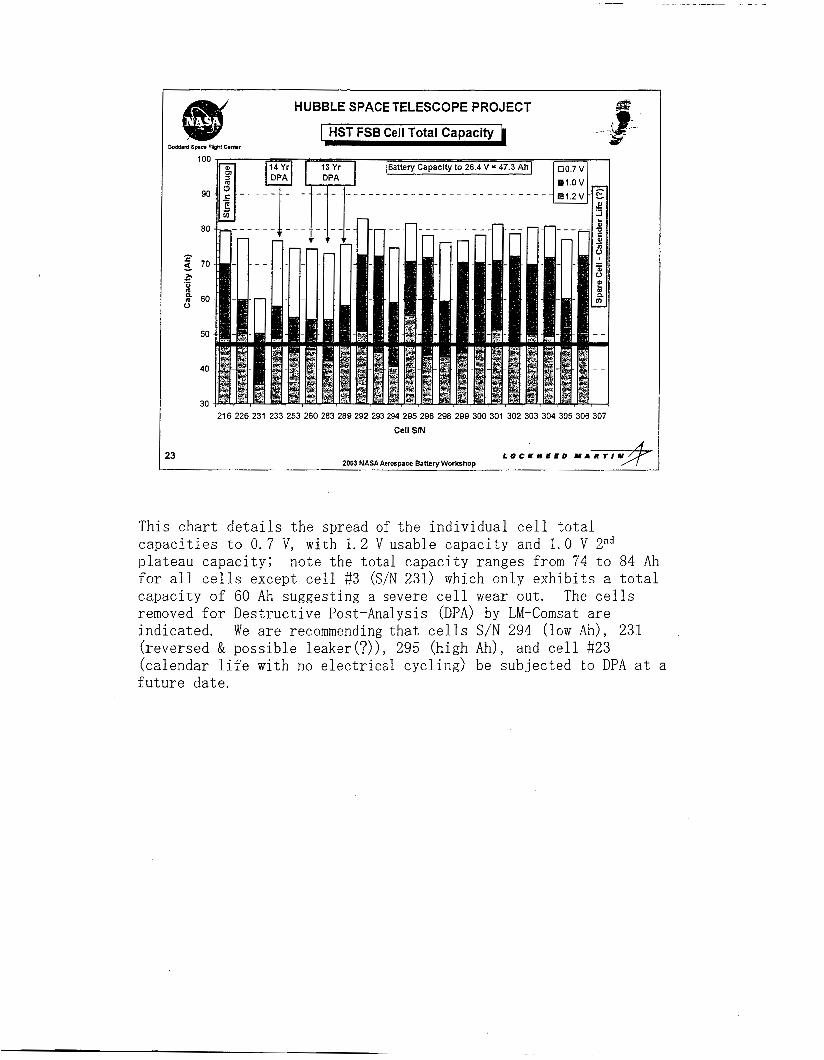
This chart details the spread of the individual cell total capacities to 0.7 V, with 1.2 V usable capacity and 1.0 V Znd plateau capacity; note the total capacity ranges from 74 to 84 Ah for all cells except cell #3 (S/N 231) which only exhibits a total capacity of 60 Ah suggesting a severe cell wear out. removed for Destructive Post-Analysis (DPA) by LM-Comsat are indicated. We are recommending that cells S/N 294 (low Ah), 231 (reversed & possible leaker(?)), 295 (high ,4h), and cell #23 (calendar life with no electrical cycling) be subjected to DPA at a future date.
The cells
HUBBLE SPACE TELESCOPE PROJECT
I HST Six Battery System Test Bed
Aaeina Sianatures
2003 NASAAerospace Battery Workshop !4
Like the FSB, the 6-Battery System Test Bed (the six batteries of the TM1 and TI2 modules) have individual cell monitoring which provides very useful insight into individual cell ageing signatures.
HUBBLE SPACE TELESCOPE PROJECT
HST Six Battery System Test Bed CelllBattery Ageing Signatures
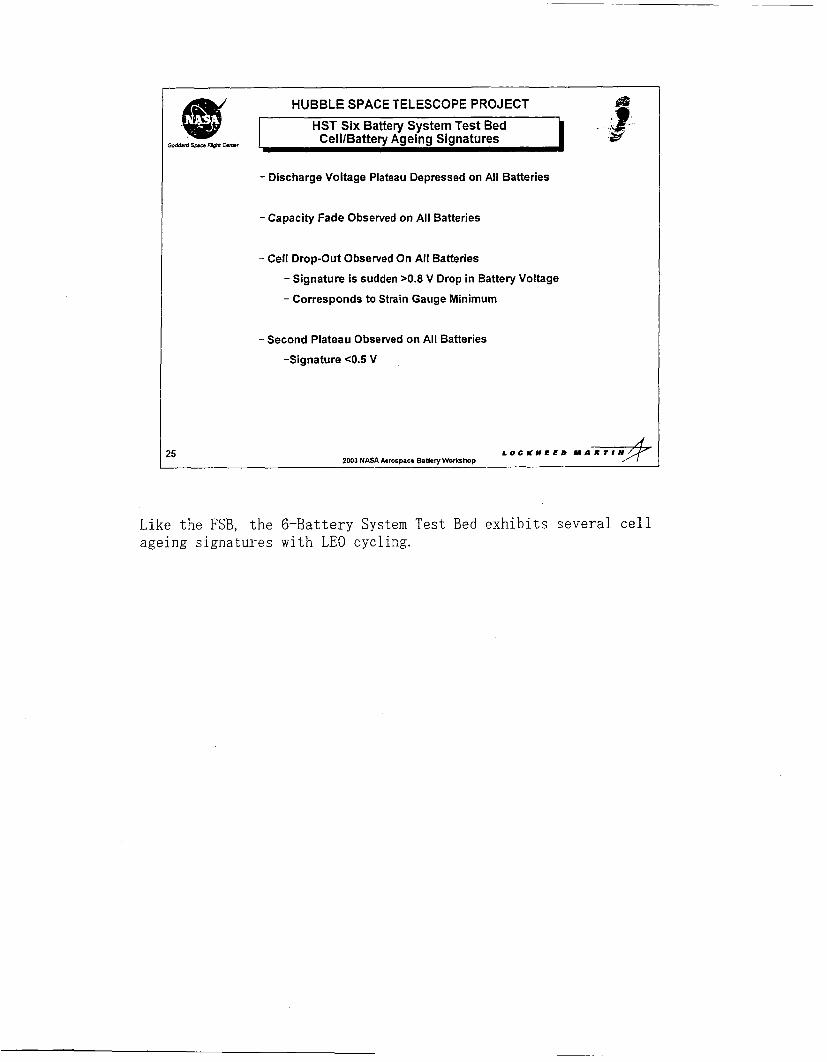
- Discharge Voltage Plateau Depressed on All Batteries
- Capacity Fade Observed on All Batteries
- Cell Drop-Out Observed On All Batteries
- Signature is sudden >0.8 V Drop in Battery Voltage
- Corresponds to Strain Gauge Minimum
- Second Plateau Observed on All Batteries
-Signature < O S V
!5 2003 NASA Aeror118ce Battery Workshoo
Like the FSB, the 6-Battery System Test Bed exhibits several cell ageing signatures with LEO cycling.
HUBBLE SPACE TELESCOPE PROJECT
HST Six Battery System Test TMI - Battery 1 (April 1997)
1.6
1.4
- 35.2
30.8
0.4
0.2
1.2
1
0 -- -
_ _ _ _ _ _ _ _ _ _ _ _ _ _ _ _ _ _ _ _ - - - - - - - - - - - - - -
- - - _ _ - Potential = -0.030 V El-- Hydrogen Precharge _ _ _ _ _ - _ _ _ - - - - -
I ’ - 4 4
0 10 20 30 40 50 60 70 80 90 100 I Capacity (Ah)
26 2003 NASAAerorpace Battery Workshop
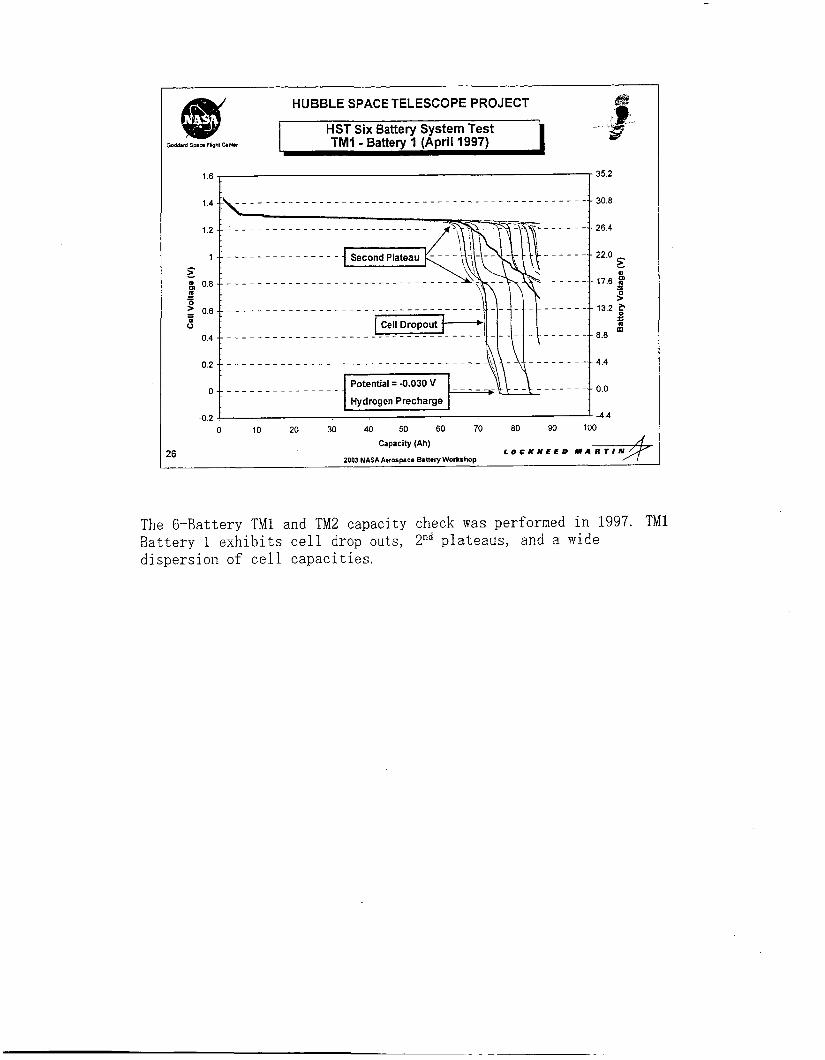
The 6-Battery TM1 and TM2 capacity check was performed in 1997. TMl Battery 1 exhibits cell drop outs, 2”d plateaus, and a wide dispersion of cell capacities.
E- - - .
- 0 . 2 t " ' ; ' " " " " ' 1-44 0 10 20 30 40 50 60 70 80 90 100
Capacity (Ah)
2003 NASA Aerospace Banery Workshop 27
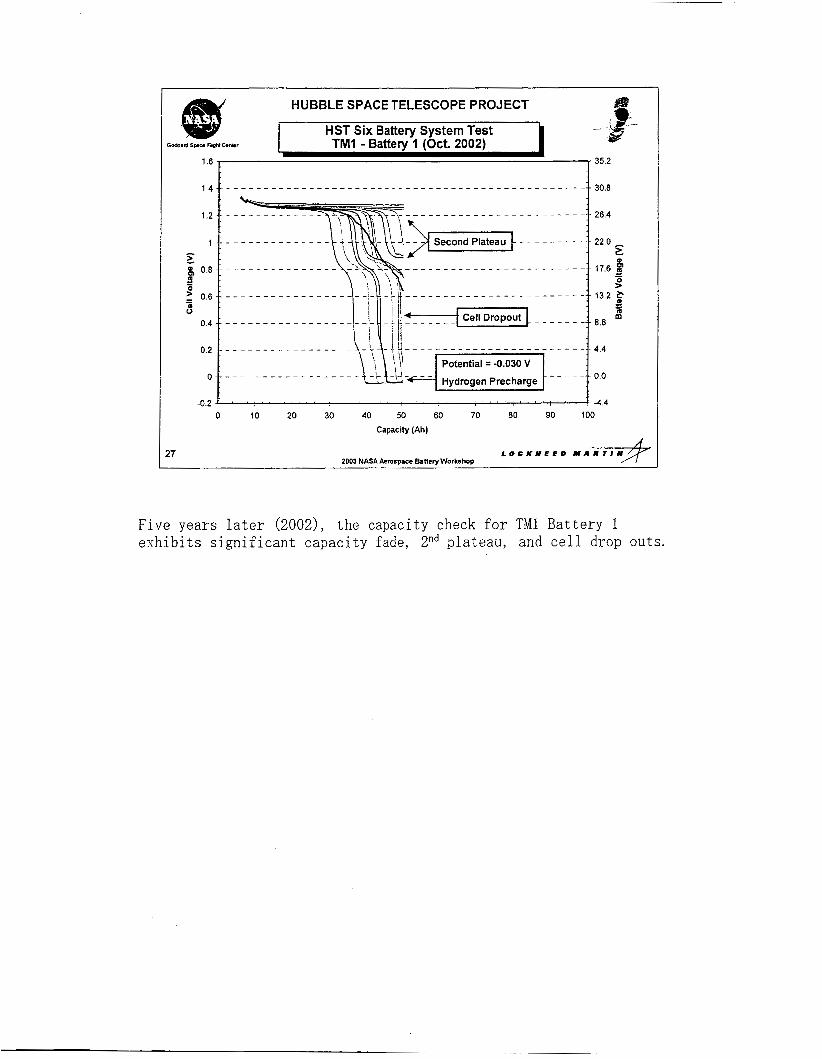
Five years later (2002), the capacity check for TM1 Battery 1 exhibits significant capacity fade, 2"d plateau, and cell drop outs.
HUBBLE SPACE TELESCOPE PROJECT ' :S=V
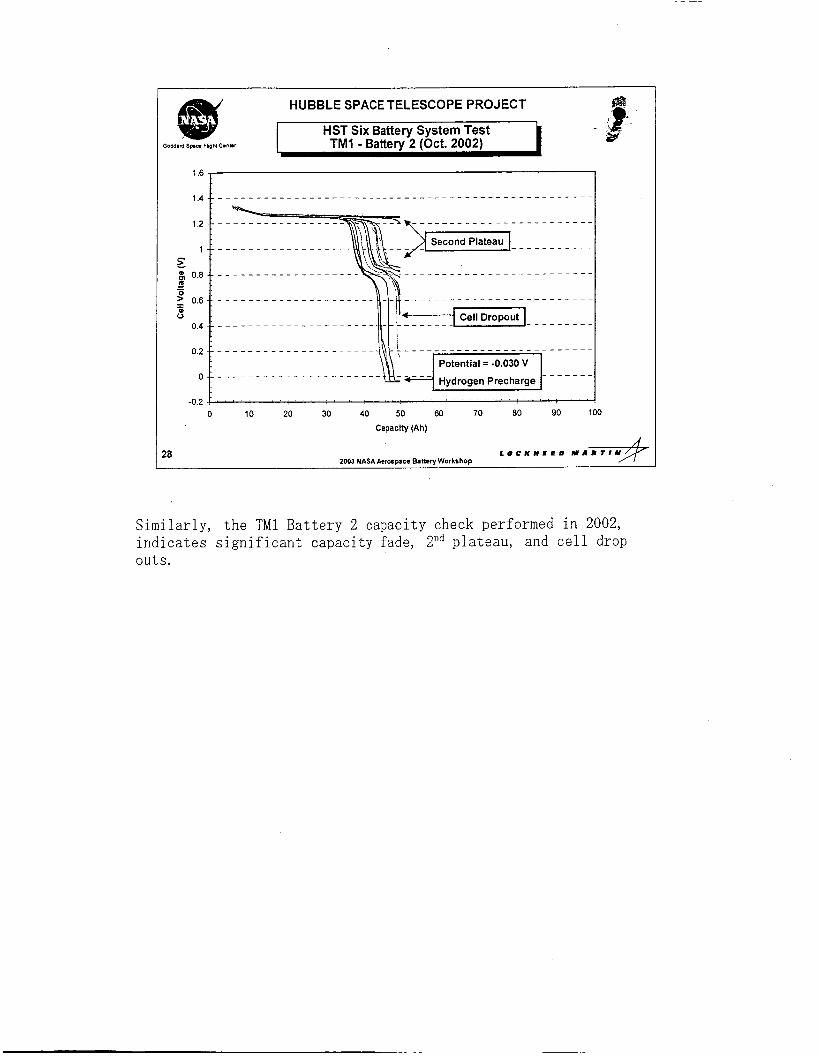
I HST Six Battery System Test TMI - Battery 2 (Oct. 2002)
w j0dd.d S p w F!qM C.nYr
Similarly, the TM1 Battery 2 capacity check performed in 2002, indicates significant capacity fade, Znd plateau, and cell drop outs.
I - 3- HUBBLE SPACE TELESCOPE PROJECT
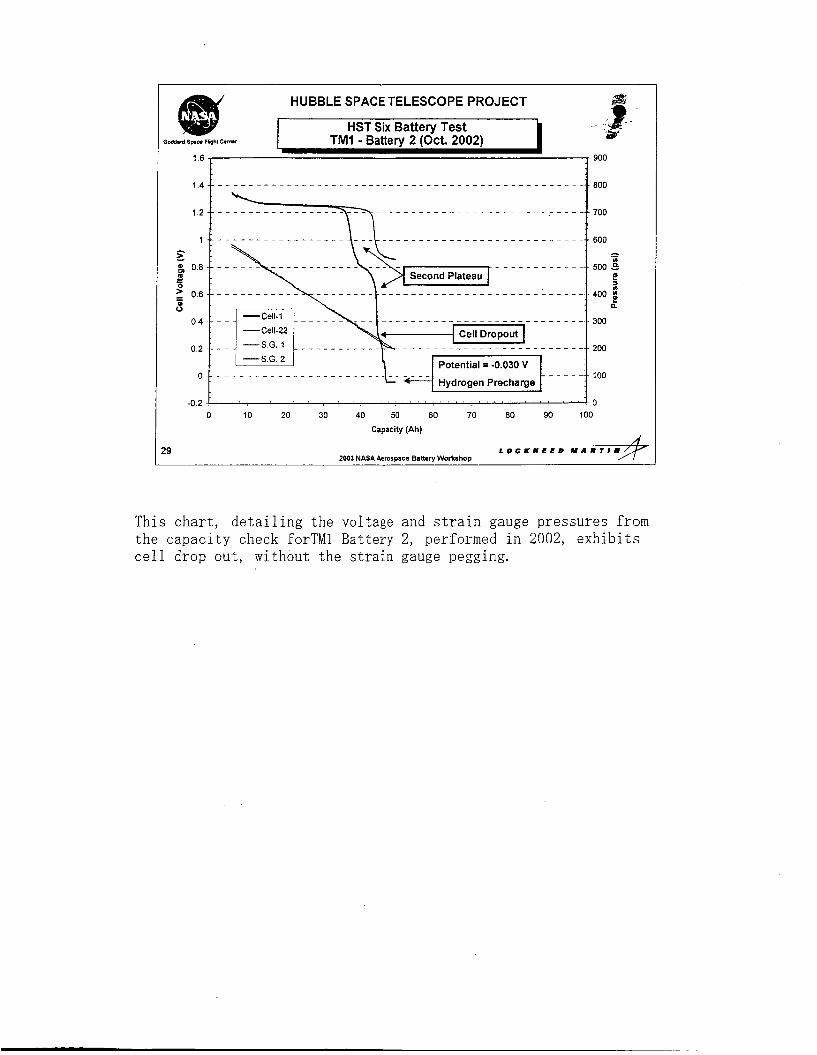
HST Six Battery Test TMI - Battery 2 (Oct. 2002) a-
Goddmd S p - FYM C.n*r
1 6 1 900 I L 1
1800
1 - - - - - L g 0.8 -- - -
6
e - - r" 0.6 -: - - -
0.4 - - -
0.2 -- - -
o . - - -
- 600 =
- 500 p!
- 400 n
- 300
- 200
- 100
" l o 10 20 30 40 50 60 70 80 90 100
Capacity (Ah)
2003 NASA Aerosmce Balterv Workshoo
This c h a r t , d e t a i l i n g t h e voltage and s t r a i n gauge p r e s s u r e s from t h e c a p a c i t y check forTMl Battery 2, performed i n 2002, e x h i b i t s c e l l d rop o u t , wi thout t h e s t r a i n gauge pegging.
1 .E
1.4
1.2
1 - L g) 0.8 3 f 0.6
0.4
- - 0"
0.2
0
-0.2
HUBBLE SPACE TELESCOPE PROJECT
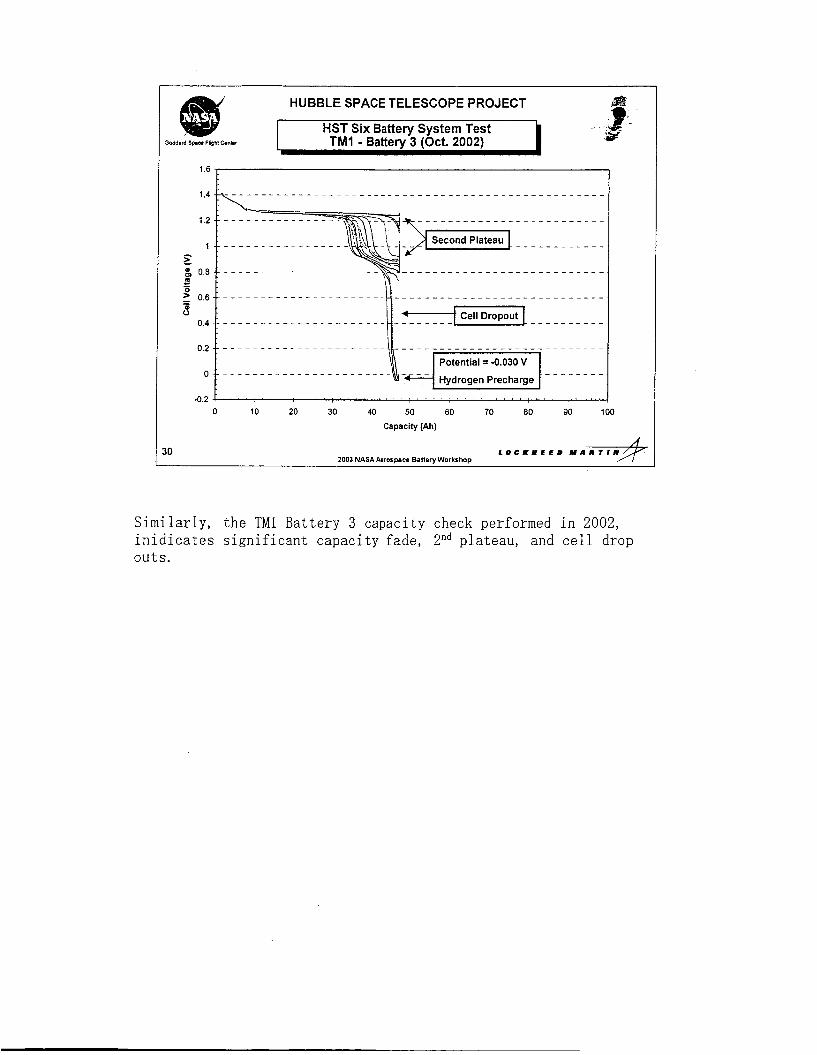
HST Six Battery System Test TMI - Batterv 3 (Oct. 2002)
_ _ _ _ _ _ _ _ _ _ Cell Dropout
_ _ _ _ _ _ _ _ _ _ _ _ _ _ _ _ _ _ _ _ - - _ - - - - - Potential = -0.030 V
Hydrogen Precharge _ - - - _ - - _
. .
0 10 20 30 40 50 60 70 80 90 100 Capacity (Ah)
80 2003 NASA Aerospace Battery Workshop
Similarly, the TMl Battery 3 capacity check performed in 2002, inidicates significant capacity fade, 2nd plateau, and cell drop outs.
HUBBLE SPACE TELESCOPE PROJECT
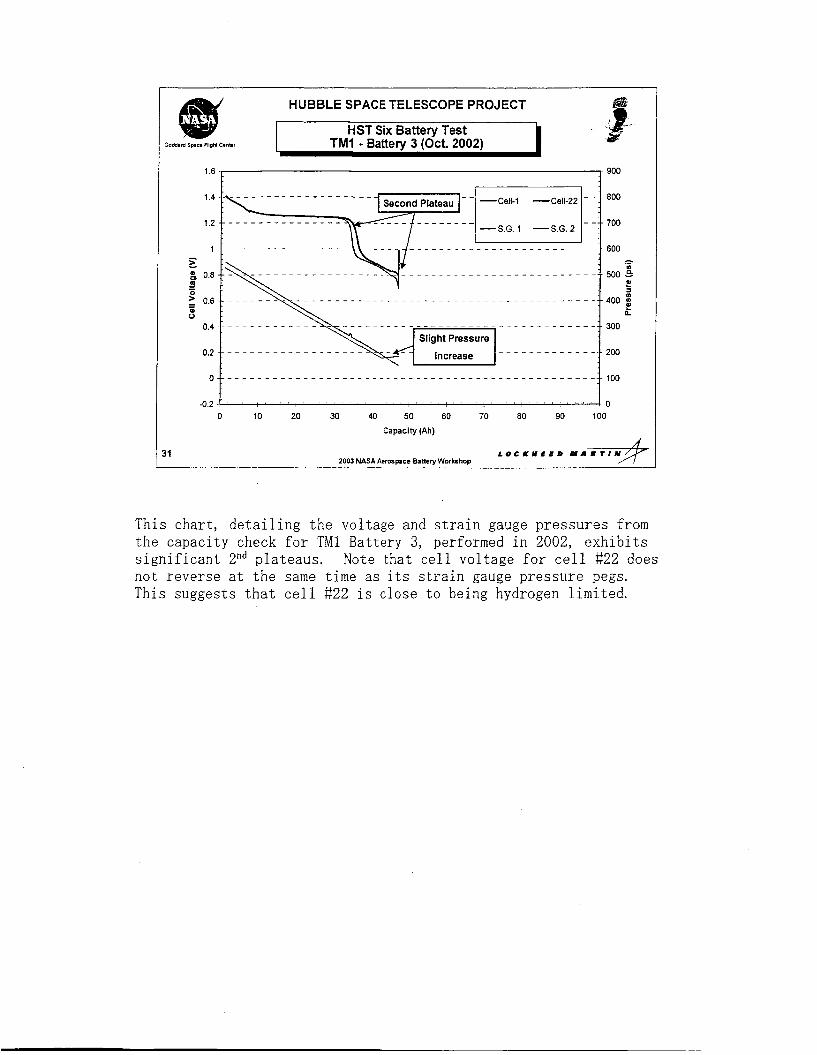
TM1 - Battery 3 (Oct. 2002) HST Six Battery Test -
'I
1.4
1.2
1 - L g 0.8
s
rn 0 - - p 0.6
0.4
-
0.2
I. .I
This chart, detailing the voltage a,nd strain gauge pressures from the capacity check for TM1 Battery 3, performed in 2002, exhibits significant 2nd plateaus. Note that cell voltage for cell #22 does not reverse at the same time as its strain gauge pressure pegs. This suggests that cell 822 is close to being hydrogen limited.
HUBBLE SPACE TELESCOPE PROJECT
HST Six Battery System Test TM2 - Batterv 4 IOct. 2002)
I 32
1 . 2 . - -
1 -- -
L & 0.8 -- - 111
0 > 0.6 .I - -
_ - - 3 :
0.4 -- -
0.2 -; -
0 .- -
i - 0 2 J ' ' I
0 10 20 30 40 50 60 70 60 90 100
Capacity (Ah)
2003 NASA Aerosoace Batten, Workrhon
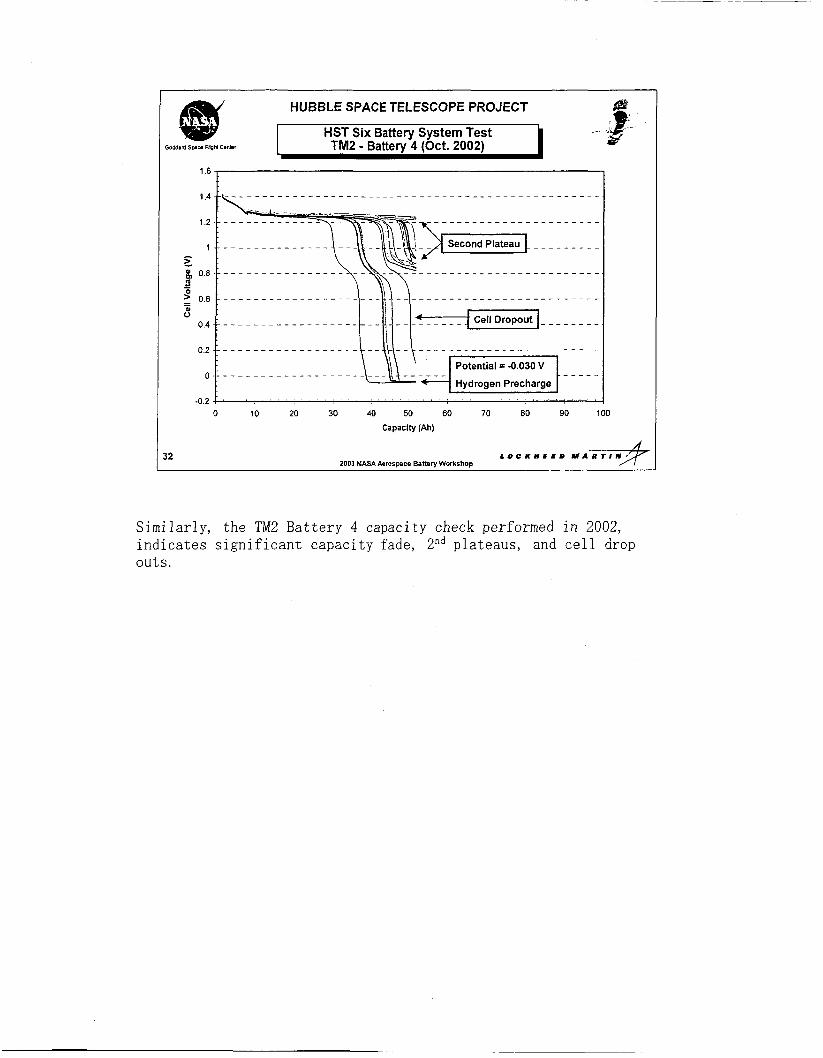
Similarly, the TM2 Battery 4 capacity check performed in 2002, indicates significant capacity fade, Znd plateaus, and cell drop outs.
HUBBLE SPACE TELESCOPE PROJECT
TM2 - Battery 4 (Oct. 2002) 1 6 , , 900
HST Six Battery Test - G o M m Sp- FigM C.*r
t , 1
1
0.4
0.2
Hvdroaen Precharae < " - -02 1
0 10 20 30 40 50 60 70 80 90 100
Capacity (Ah)
ZOO3 NASA Aerospace Battery Workshop 33
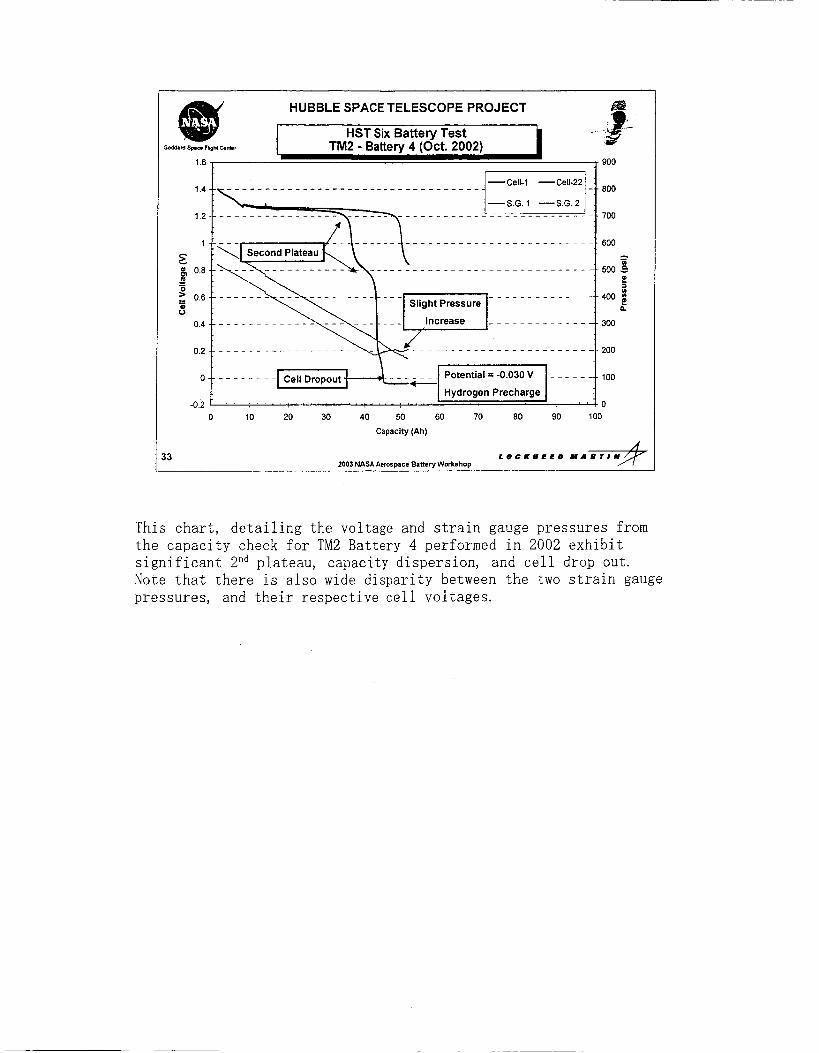
This chart, detailing the voltage and strain gauge pressures from the capacity check for TM2 Battery 4 performed in 2002 exhibit significant Znd plateau, capacity dispersion, and cell drop out. Note that there is also wide disparity between the two strain gauge pressures, and their respective cell voltages.
HUBBLE SPACE TELESCOPE PROJECT mi HST Six Battery System Test TM2 - Battery 5 (Oct. 2002)
w Goe8a.d S p a FbgMC.nmr I
4 2003 NASA Aerospace Battery Workshop
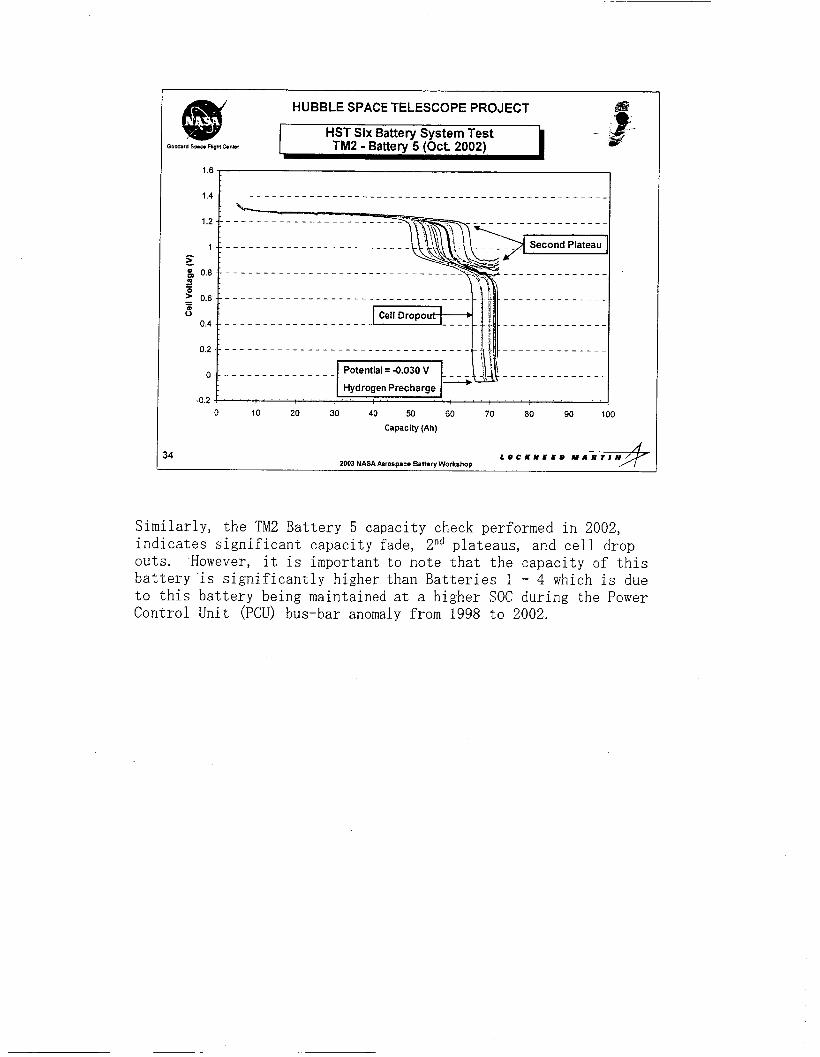
Similarly, the TM2 Battery 5 capacity check performed in 2002, indicates significant capacity fade, Znd plateaus, and cell drop outs. However, it is important to note that the capacity of this battery 'is significantly higher than Batteries 1 - 4 which is due to this battery being maintained at a higher SOC during the Power Control Unit (PCU) bus-bar anomaly from 1998 to 2002.

HUBBLE SPACE TELESCOPE PROJECT
- p- * 900
1.2 - -
1 - -
j: H O B -: - - - 0
2 0.6 -- - - J
0.4 -- -
0.2 -- -
- 700
600 =
500 CZ r
400 g p'
300
w
200
5 2003 NASA Aerospace Battery Workshop
This chart, detailing the voltage and strain gauge pressures from the capacity check forTM2 significant 2nd plateaus, capacity dispersion, and cell drop out; note the higher pressure levels observed with these cells as a result of the higher SOC.
Battery 5 performed in 2002 exhibits
HUBBLE SPACE TELESCOPE PROJECT
HST Six Battery System Test TM2 - Battery 6 (Oct. 2002) I Goddad S p s . FhpM Cmmr
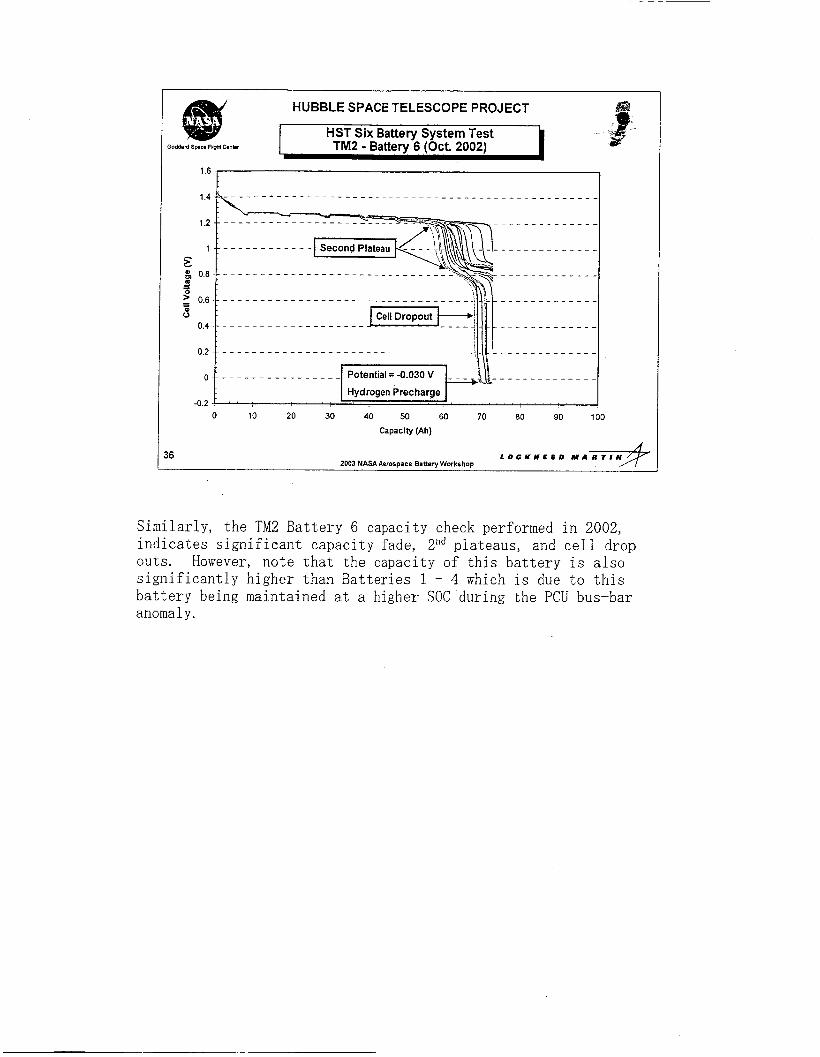
S i m i l a r l y , t h e TM2 B a t t e r y 6 capac i ty check performed i n 2002, i n d i c a t e s s i g n i f i c a n t c a p a c i t y fade, 2nd p l a t e a u s , and c e l l drop ou t s . However, n o t e t h a t t h e capac i ty of t h i s b a t t e r y i s a l s o s i g n i f i c a n t l y h i g h e r t h a n B a t t e r i e s 1 - 4 which i s due t o t h i s b a t t e r y being maintained a t a higher SOC during t h e PCU bus-bar anoma 1 y.
0 10 20 30 40 50 60 70 80 90 100
Capacity (Ah)
16 L O C K H E E D M A R T I N 2003 NASAAerospace Battery Workshop
HUBBLE SPACE TELESCOPE PROJECT
900
Capacity (Ah)
;7 L O C K ~ E E D Y A R T I Y / A
2003 NASA AerosDace Banerv WorkshoD
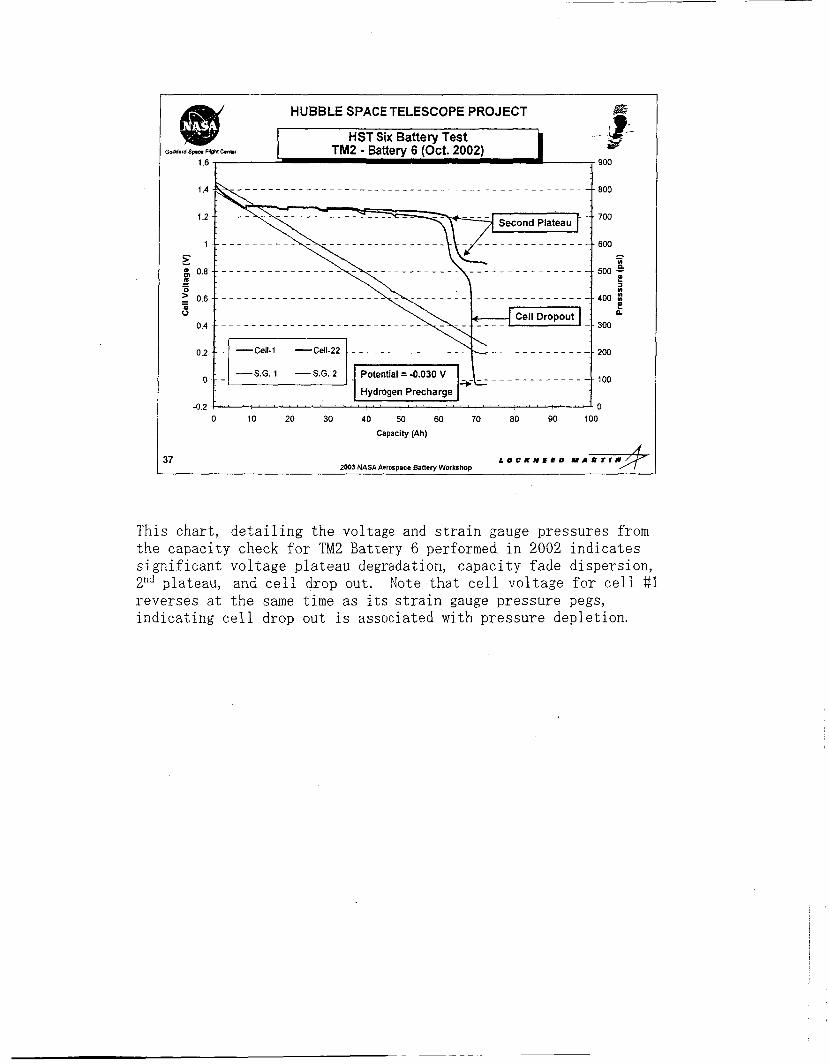
This chart, detailing the voltage and strain gauge pressures from the capacity check for TM2 Battery 6 performed in 2002 indicates significant voltage plateau degradation, capacity fade dispersion, Znd plateau, and cell drop out. reverses at the same time as its strain gauge pressure pegs, indicating cell drop out is associated with pressure depletion.
Note that cell voltage for cell #1
HUBBLE SPACE TELESCOPE PROJECT -
I HST Flight Batteries
Ageing Signatures
2003 NASAAerospace Banery Workshop 38
HUBBLE SPACE TELESCOPE PROJECT
HST Flight Batteries Ageing Signatures
-
-Voltage Curves From Orbital Capacity Checks Exhibit
-Voltage Plateau Degradation on All Batteries
- Capacity Fade on All Batteries
- Impedance Growth on All Batteries
- Cell Drop Out on All Batteries
-Signature is sudden >0.8 V Drop in Battery Voltage
- Second Plateau Formation on All Batteries -Second Plateau Signature e0.5 V
Capacity Check using 5.1 ohm Resistor across the Battery to 15 V
3 2003 NASA Aerospace Battery Workshop
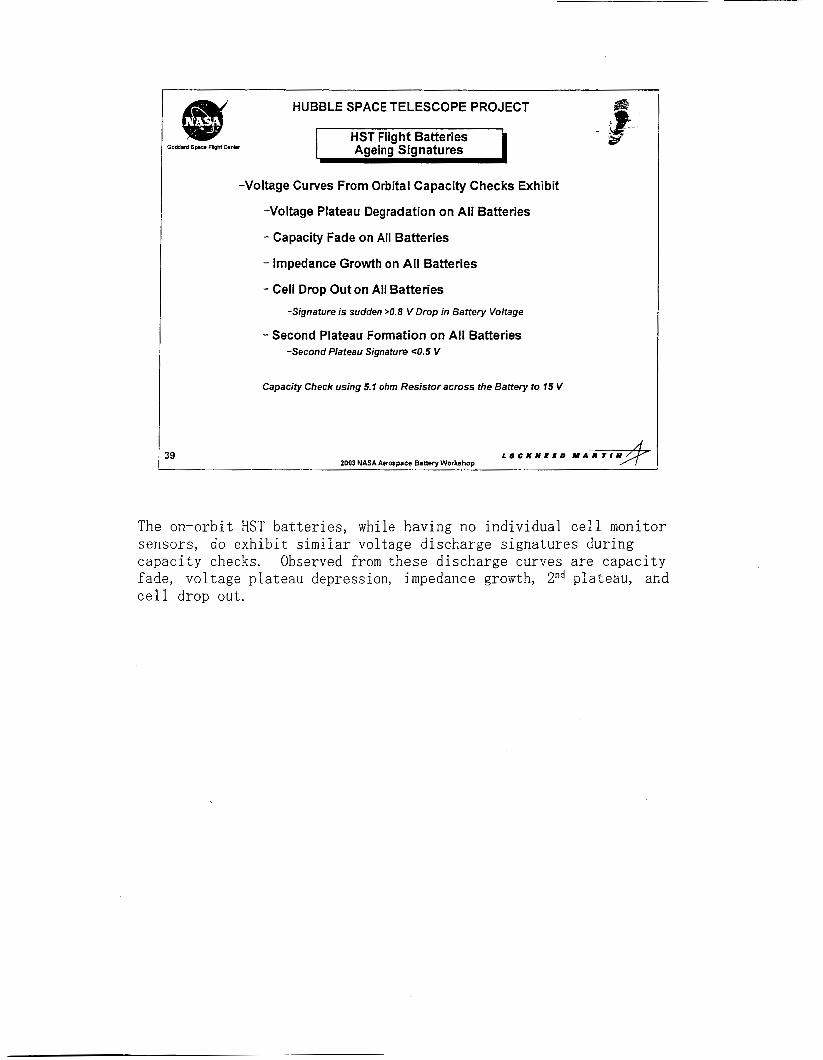
The on-orbit HST batteries, while having no individual cell monitor sensors, do exhibit similar voltage discharge signatures during capacity checks. Observed from these discharge curves are capacity fade, voltage plateau depression, impedance growth, Znd plateau, and cell drop out.

HUBBLE SPACE TELESCOPE PROJECT
0 10 20 30 40 50 60 70 80 90 Banety Ah Out
!O 2003 NASA Aerospace Battery Workshop
Battery 1 has a depressed voltage plateau (voltage degradation), capacity fade, at least one cell drop out, and several cells displaying second plateau formation.
HUBBLE SPACE TELESCOPE PROJECT
32 , i 1100
400
300 - - - - - - - - - _ _ _ _ - _ - _ _ _ _ _ _ _
’ r 200 90
- 1998 Pressure
60.70
0 10 20 30 40 50 60 70 80
16 _ _ _ _ _
14 ’
BatteryAh Out
I1 2003 NASA Aerospace Banery Workshop
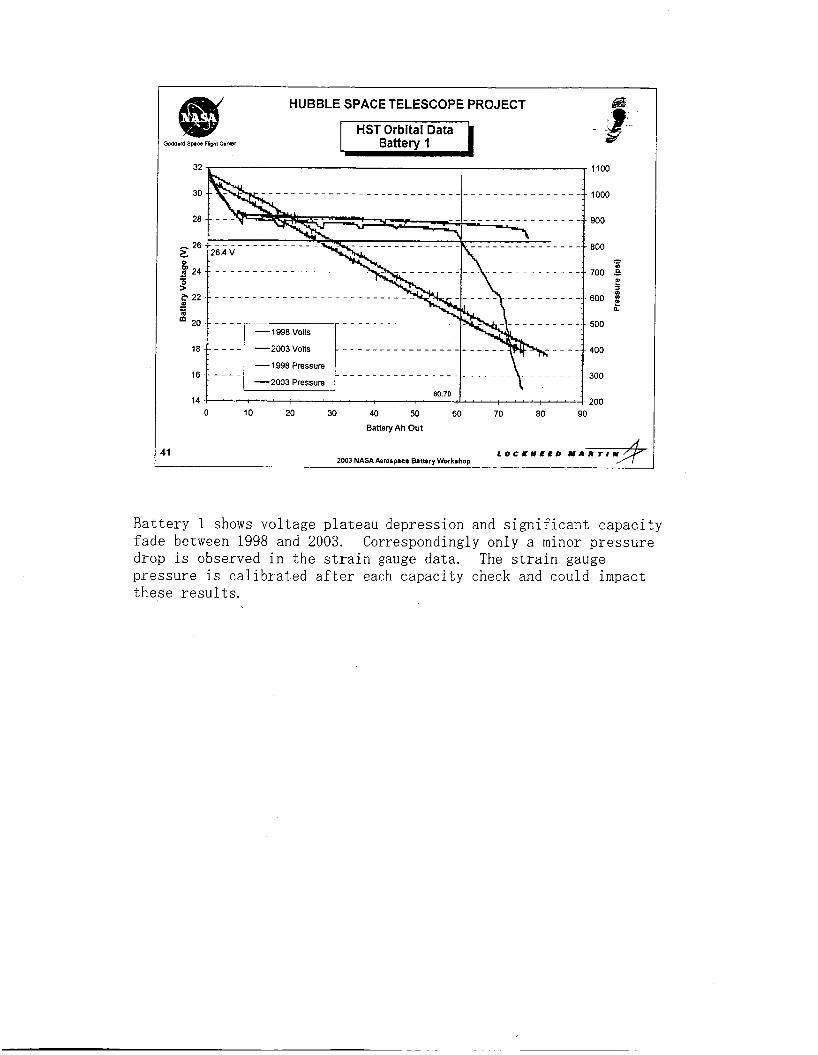
Battery 1 shows voltage plateau depression and significant capacity fade between 1998 and 2003. drop is observed in the strain gauge data. pressure is calibrated after each capacity check and could impact these results.
Correspondingly only a minor pressure The strain gauge
HUBBLE SPACE TELESCOPE PROJECT
12
c
Number of Cycler IOK 20K 30K 40K 50K 60K 70K 80K 90K IOOK llOK 120K
100
95
90
85
80
7s
70
2 65
4 60
55
50
45
40
s
0 24 48 72 96 120 144 168 192 116 240 264
l i m e Since L u n c h (MonthrIDate) 411990 1992 1994 1996 1998 zwo 2002 2004 2006 2008 2010 2012
I'= Fit Coefficient (1.0 = Best)
2003 NASA Aerospace BatIery Workshop
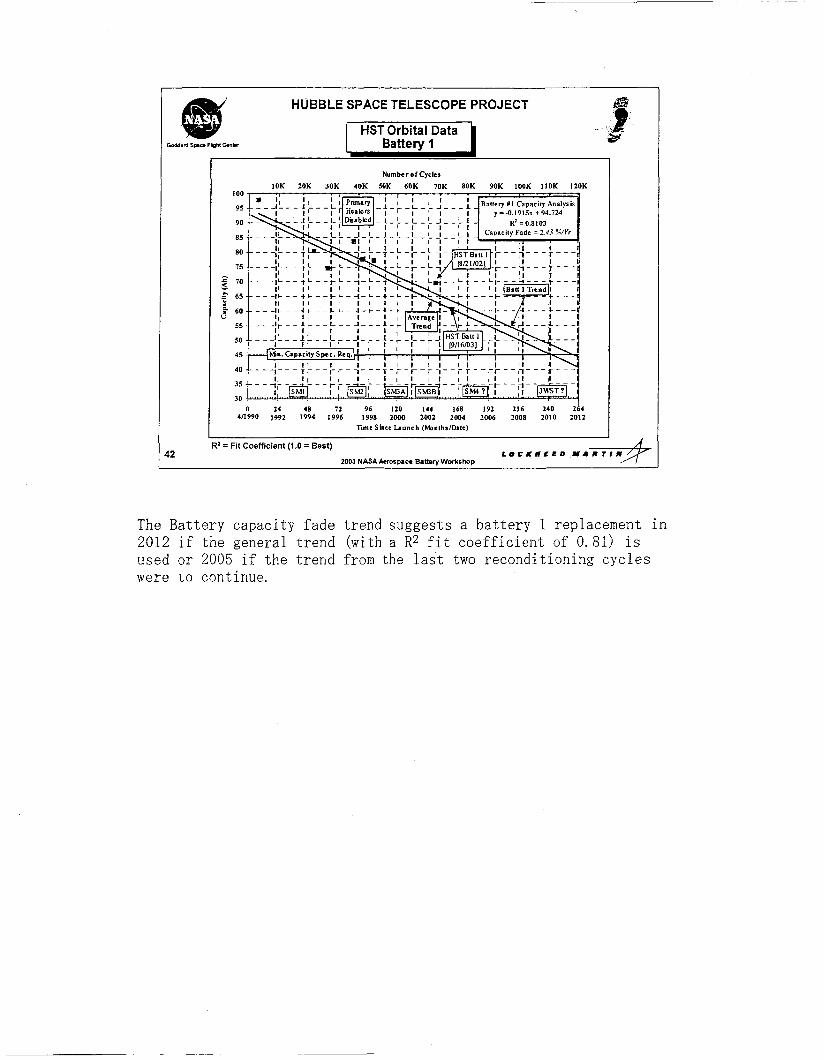
The Battery capacity fade trend suggests a battery 1 replacement in 2012 if the general trend (with a R2 fit coefficient of 0.81) is used or 2005 if the trend from the last two reconditioning cycles were to continue.
HUBBLE SPACE TELESCOPE PROJECT
HST Orbital Data i Battery 2
ZOO3 NASA Aerospace Banery Workshop 43
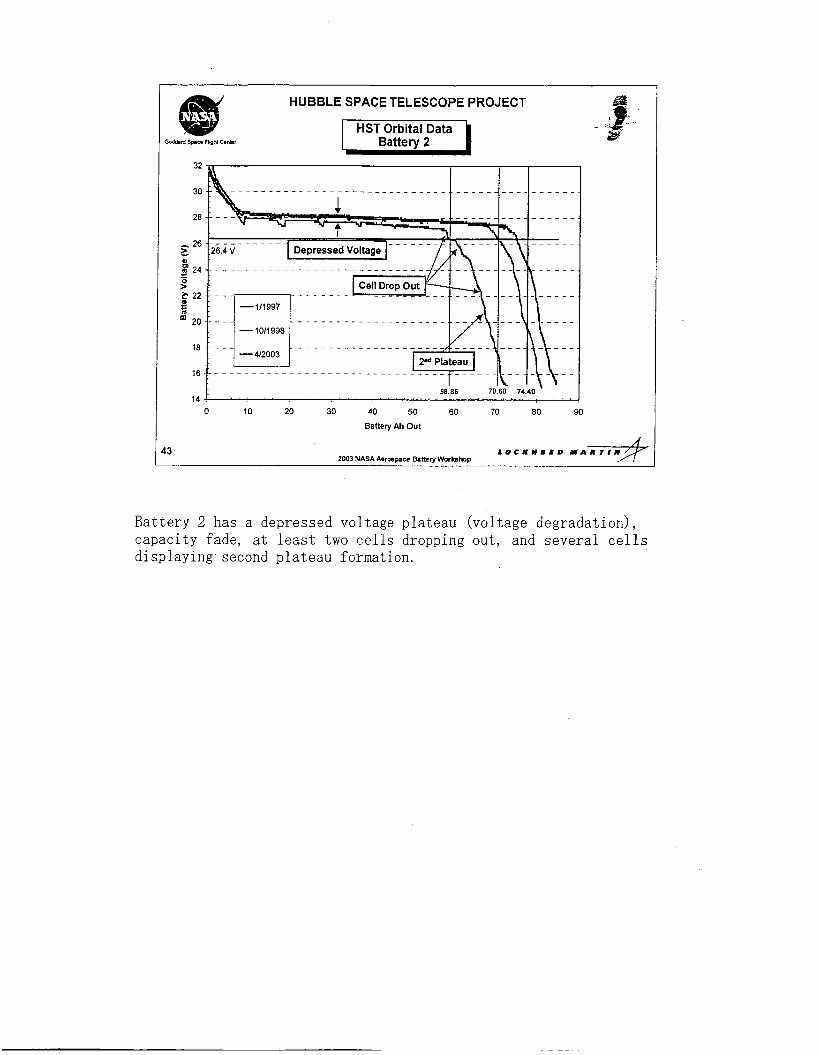
Battery 2 has a depressed voltage plateau (voltage degradation), capacity fade, at least two cells dropping out, and several cells displaying. second plateau formation.
HUBBLE SPACE TELESCOPE PROJECT
-4103 Voltage
- 1 OB8 Pressure
0 10 20 30 40 50 60 70 80 90 Battery Ah Out
2003 NASA Aerospace Fhttery Workshop 14
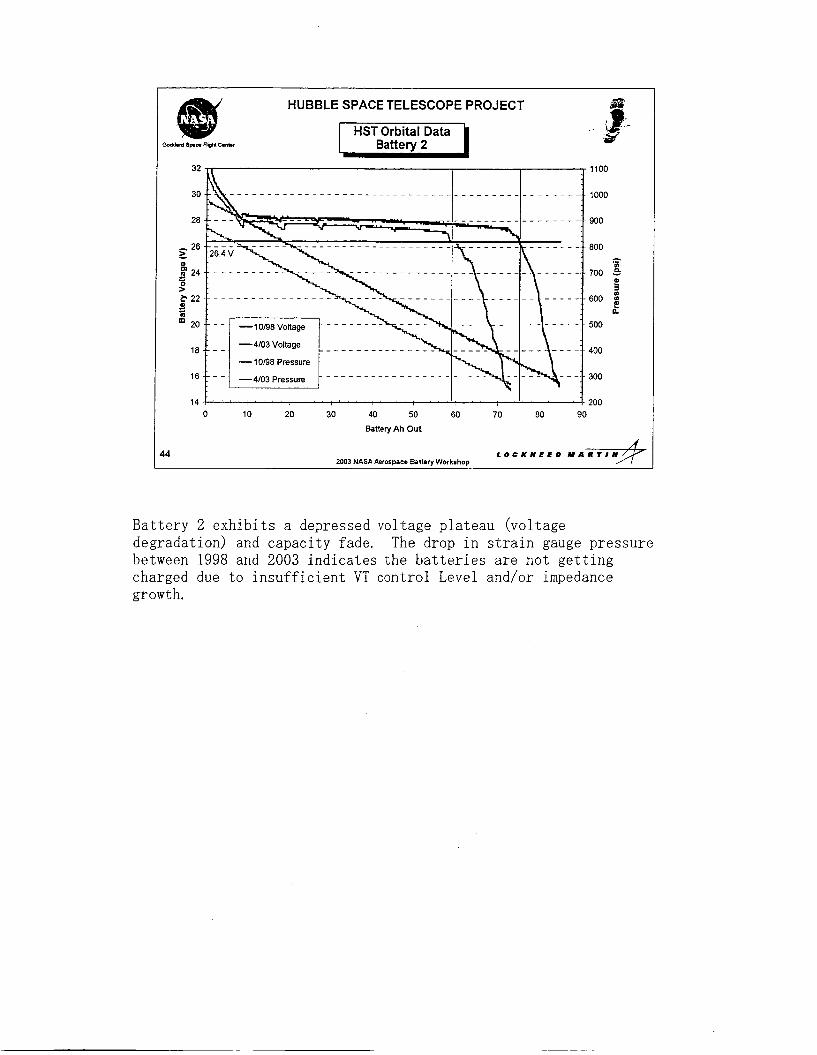
Battery 2 exhibits a depressed voltage plateau (voltage degradation) and capacity fade. The drop in strain gauge pressure between 1998 and 2003 indicates the batteries are not getting charged due to insufficient VT control Level and/or impedance growth.
HUBBLE SPACE TELESCOPE PROJECT
15 2003 NASA Aerospace Battery Workshop
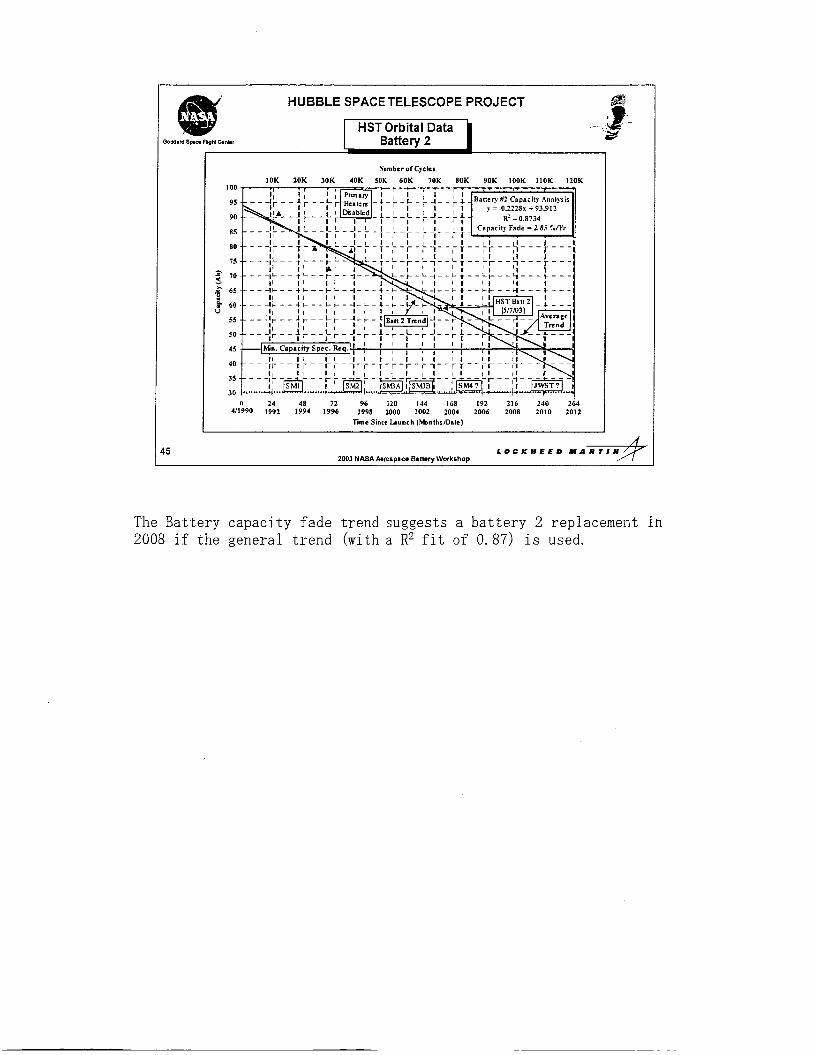
The Battery capacity fade trend suggests a battery 2 replacement in 2008 if the general trend (with a R2 fit of 0.87) is used.
HUBBLE SPACE TELESCOPE PROJECT
14 0 10 20 30 40 50 60 70 80 90
Capacity (Ah)
2003 NASA Aerospace Battery Workshop 16
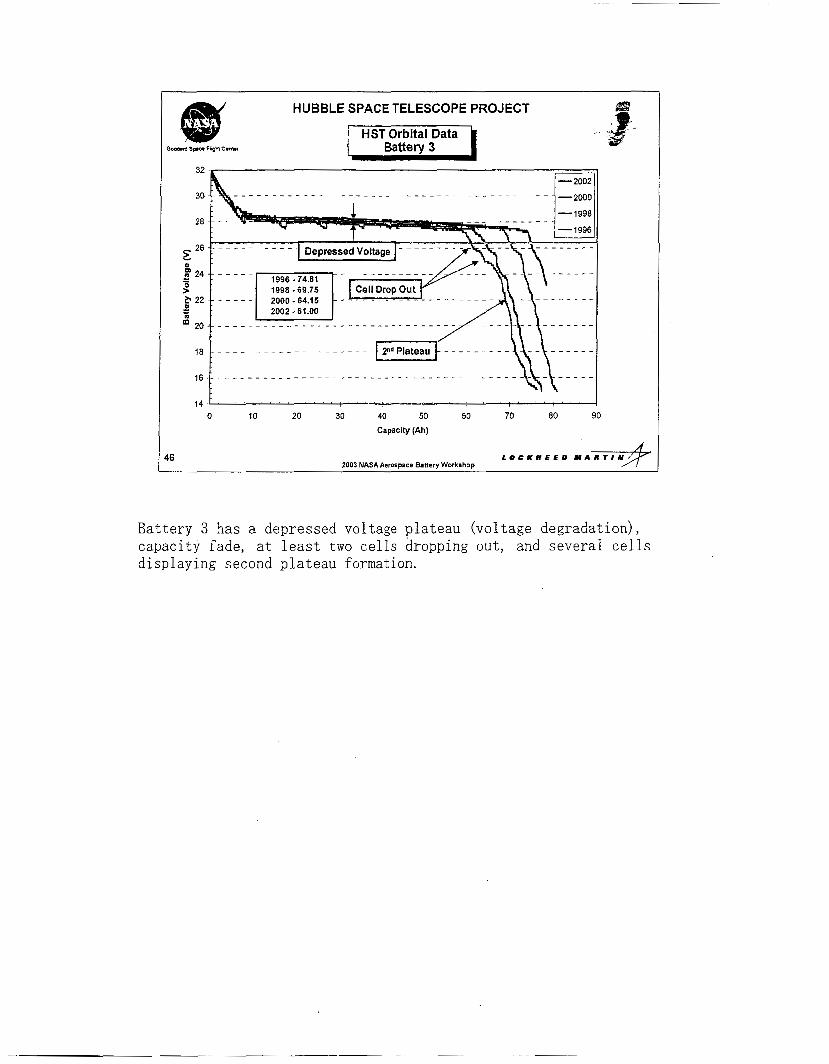
Battery 3 has a depressed voltage plateau (voltage degradation), capacity fade, at least two cells dropping out, and several cells displaying second plateau formation.
HUBBLE SPACE TELESCOPE PROJECT
L
17 L O C K H E E D Y A R T l W 2003 NASA Aeroroace Banem Workrhor,
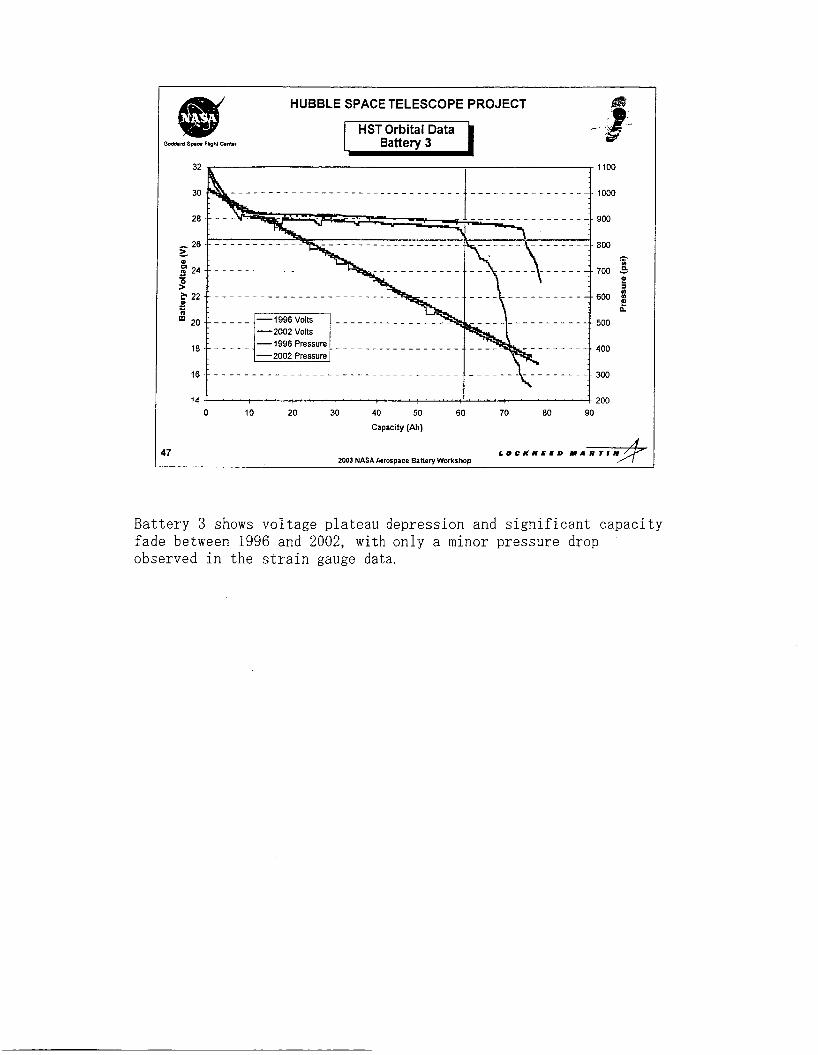
Battery 3 shows voltage plateau depression and significant capacity fade between 1996 and 2002, with only a minor pressure drop observed in the strain gauge data.

HUBBLE SPACE TELESCOPE PROJECT
NumberolCyclcr 10K 2OK 30K 40K 50K 60K 70K 80K 90K IOOK IlOK IlOK
4/1990 1992 1994 1996 1998 2000 2002 2004 2006 2008 2010 2012 lime Since L u n c h (MonthriDatc)
8 2001 NASAAerorpace Battery Workshop
The Battery capacity fade trend suggests a battery 3 replacement i n 2007 if the general trend (with a R2 fit of 0.91 - fairly good fit) is used.
HUBBLE SPACE TELESCOPE PROJECT
-
19
L I 32 -, I ,
. . 55.76 61.88 71.40
14 0 10 20 30 40 50 60 70 80 90
Banery Ah Out
2003 NASA Aeror~ace BaUerv WwkrhoD
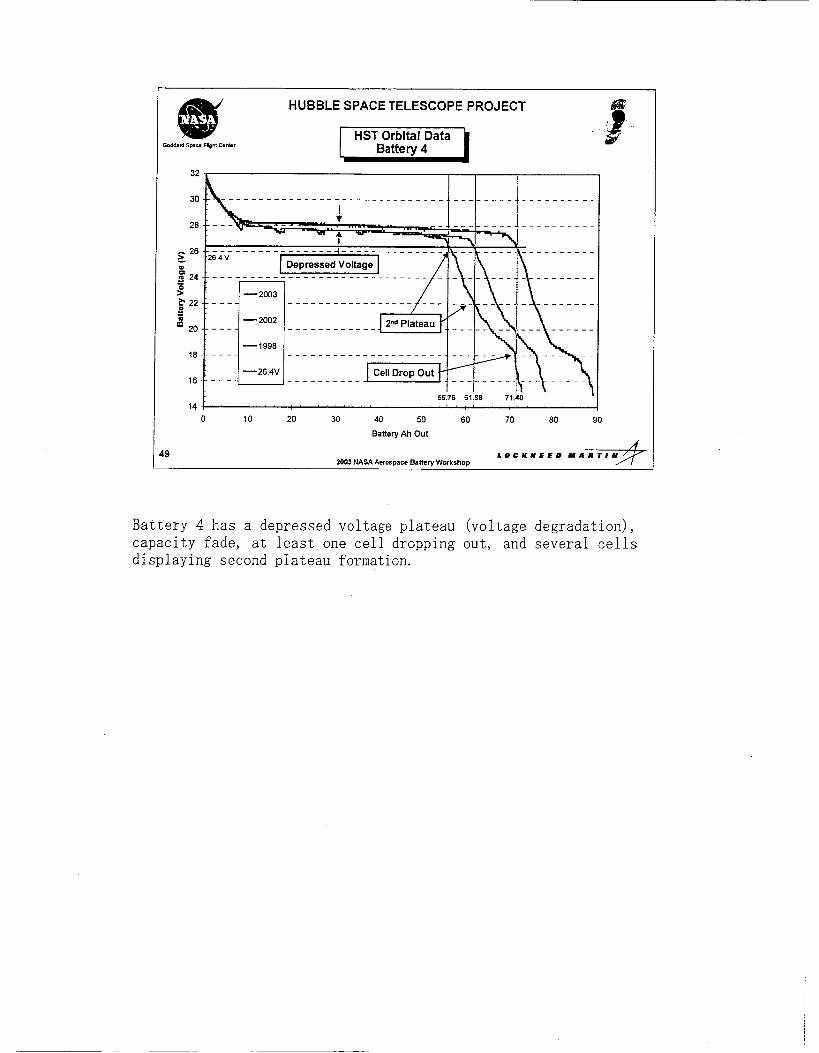
Battery 4 has a depressed voltage plateau (voltage degradation), capacity fade, at least one cell dropping out, and several cells displaying second plateau formation.
HUBBLE SPACE TELESCOPE PROJECT
-
32 I I 1100 55.76 71.40
'0
I ' ' 1 200 I 0 10 20 30 40 50 60 70 80 90
Battery Ah Out
2003 NASA Aerormce bnerv Workrhov
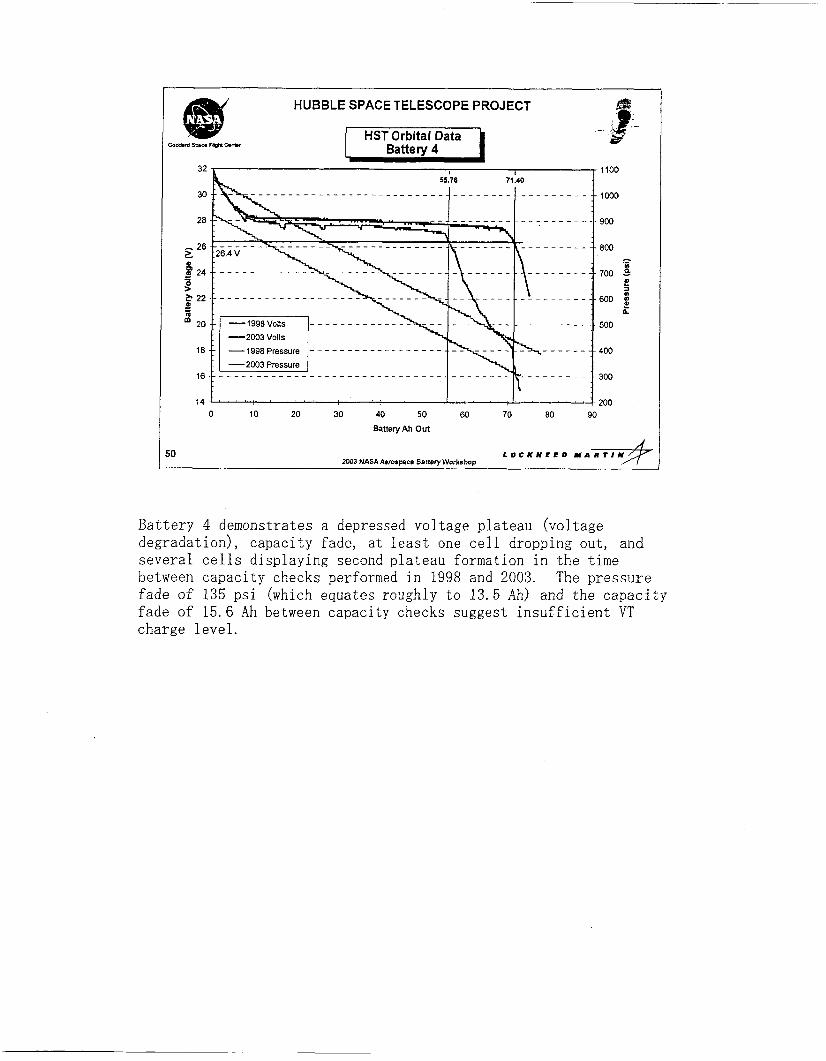
Battery 4 demonstrates a depressed voltage plateau (voltage degradation), capacity fade, at least one cell dropping out, and several cells displaying second plateau formation in the time between capacity checks performed in 1998 and 2003. The pressure fade of 135 p s i (which equates roughly to 13.5 Ah) and the capacity fade of 15.6 Ah between capacity checks suggest insufficient VT charge level.
HUBBLE SPACE TELESCOPE PROJECT
NvmberofCycler 10K 20K 30K 40K 50K 60K 70K 80K 90K IOOK llOK 120K
n 24 48 72 96 120 141 118 192 216 240 2 h 411990 1992 1994 1996 1998 2000 2002 2004 2006 2008 2010 2012
i l 2003 NASA Aerospace Emery Workshop
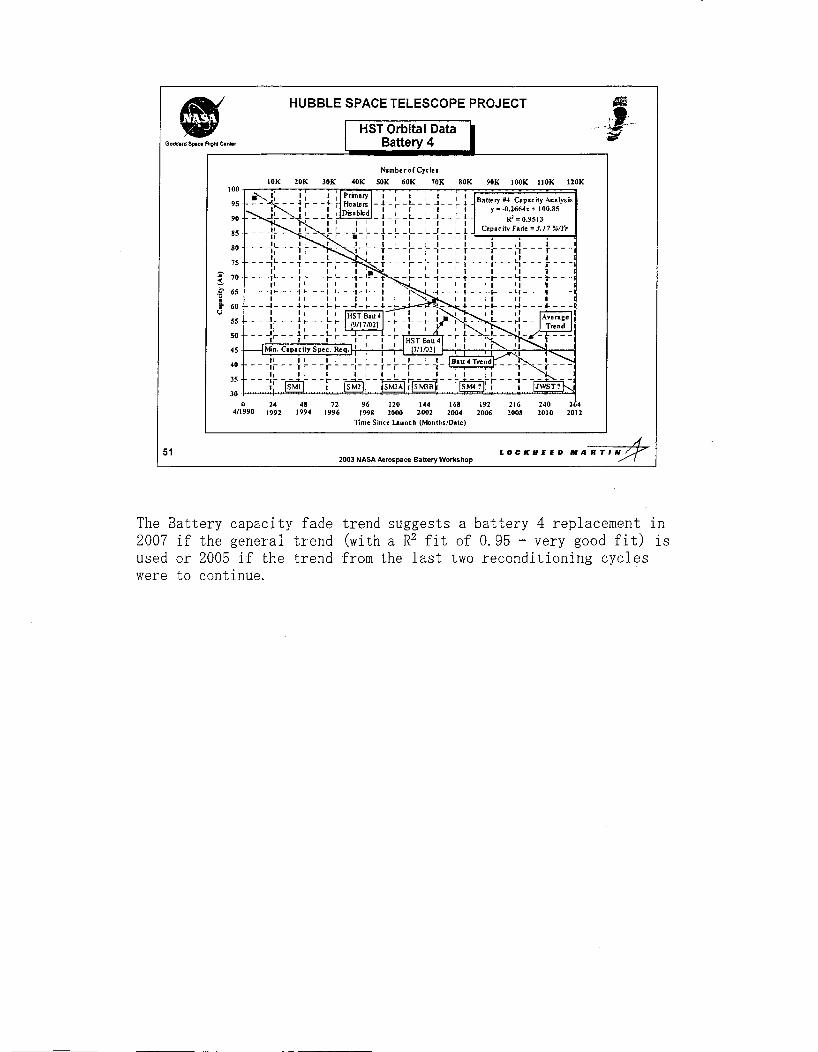
The Battery capacity fade trend suggests a battery 4 replacement in 2007 if the general trend (with a R2 fit of 0.95 - very good fit) is used or 2005 if the trend from the last two reconditioning cycles were to continue.
HUBBLE SPACE TELESCOPE PROJECT
i2
I
0 10 20 30 40 50 60 70 80 90 100
Battery Ah Out
ZOO3 NASA Aeroroace Banerv Workrhon
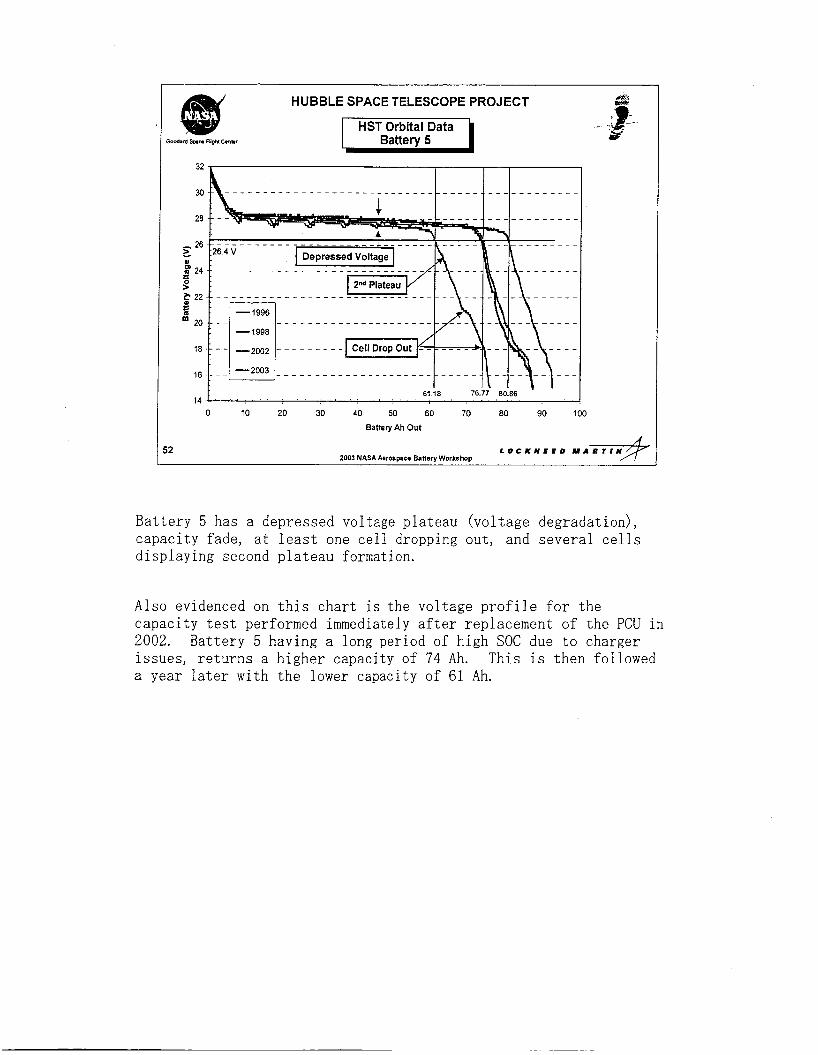
Battery 5 has a depressed voltage plateau (voltage degradation), capacity fade, at least one cell dropping out, and several cells displaying second plateau formation.
Also evidenced on this chart is the voltage profile for the capacity test performed immediately after replacement of the PCU in 2002. issues, returns a higher capacity of 74 Ah. a year later with the lower capacity of 61 Ah.
Battery 5 having a long period of high SOC due to charger This is then followed

HUBBLE SPACE TELESCOPE PROJECT I HSTOrbital Data I Battery 5
32 I I 1 1200 61.18 74.24 80.86
I . 300 0 10 20 30 40 50 60 70 80 90 100
Battery Ah Out
2003 NASA Aerospace Battery Workshop i3
Battery 5 shows evidence of a depressed voltage plateau (voltage degradation), capacity fade, at least several cells dropping out, and several cells displaying second plateau formation in the time between capacity checks in 1998 and 2003. pressure for these two periods shows a pressure fade of about 90 psi (equates to about 9 Ah) and a capacity fade of 13 AH.
The strain gauge
HUBBLE SPACE TELESCOPE PROJECT
Number of Cycler 10K 20K 30K 40K SOK 60K 7OK 80K 90K IOOK llOK 120K
100
9 s
90
85
80
75
5 70
.r" 65 x 3 60
55
so 4s
-
411990 1992 1994 1996 1990 2000 2002 2004 2006 2008 2010 2012 Enie Since h u n c h (bbnthrlDate)
84 ZOO3 NASA Aerospace Battery Workshop
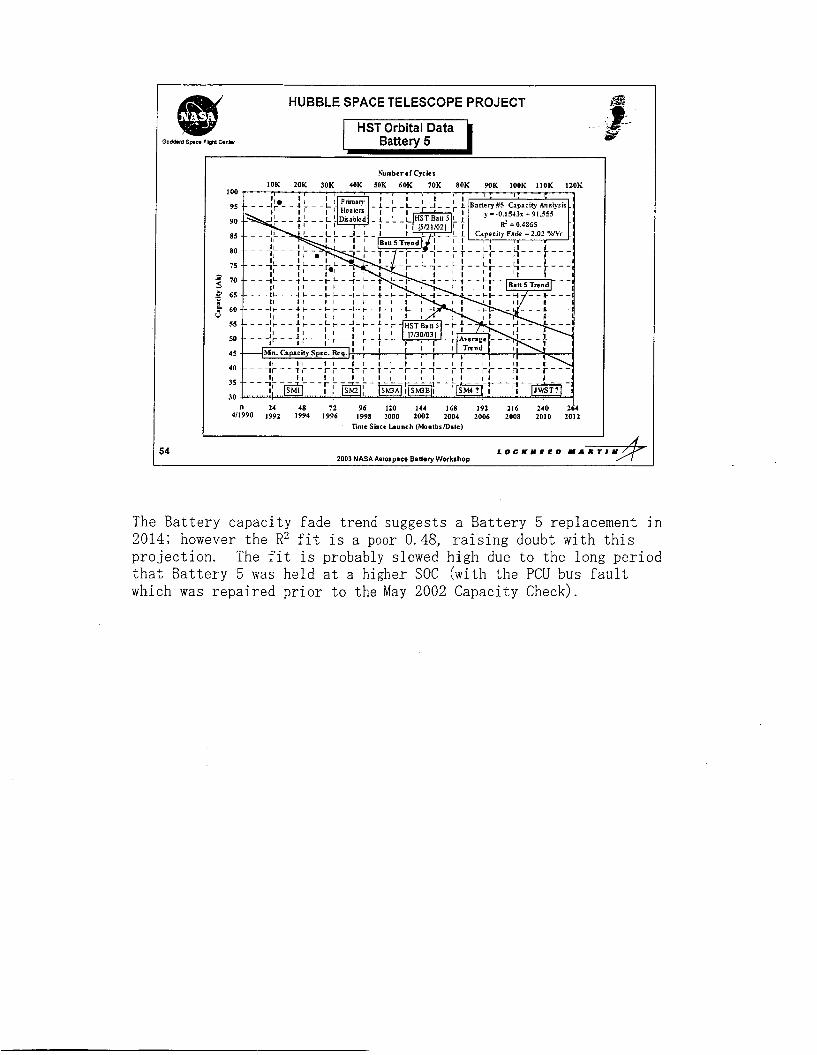
The Battery capacity fade trend suggests a Battery 5 replacement in 2014; however the R2 fit is a poor 0.48, raising doubt with this projection. The fit is probably slewed high due to the long period that Battery 5 was held at a higher SOC (with the PCU bus fault which was repaired prior to the May 2002 Capacity Check).

HUBBLE SPACE TELESCOPE PROJECT
i5
0 10 20 30 40 50 60 70 80 90 100
Battery Ah Out
2003 NASA Pierorvase Batterv WorbhoD
Battery G has a depressed voltage plateau (voltage degradation), capacity fade, at least three cells dropping out, and several cells displaying second plateau formation.

HUBBLE SPACE TELESCOPE PROJECT
-- 1000
- 900
- 800 e
I- 700 5
1- 600 a E! n
f
- 500
- 400
- 300
32 11100
I , I . c 200 0 10 20 30 40 50 60 70 80 90 100
Battety Ah Out
2003 NASA Aerospace Battery Workhop 16
The pressure during the capacity checks performed in 1995 and 2003 are identical indicating this battery has been maintained at a good state of charge, and only minor capacity fade is observed in this time interval. This battery was also maintained at high SOC during the PCU charger anomaly.
d HUBBLE SPACE TELESCOPE PROJECT
1 HSTOrbital Data b
i7
1 Battery 6 I Number o f Cycles
10K 20K 30K 40K 50K 60K 70K 80K 90K IOOK IlOK 120K
I C - - 3 c - -
n 24 48 72 96 n o 144 168 192 216 240 2k4 U1990 1992 1994 1996 1998 2000 2002 2004 2006 2008 2010 2012
l ime Since Launch (MonthrlDate)
2003 NASA Aerospace Banery Workshop
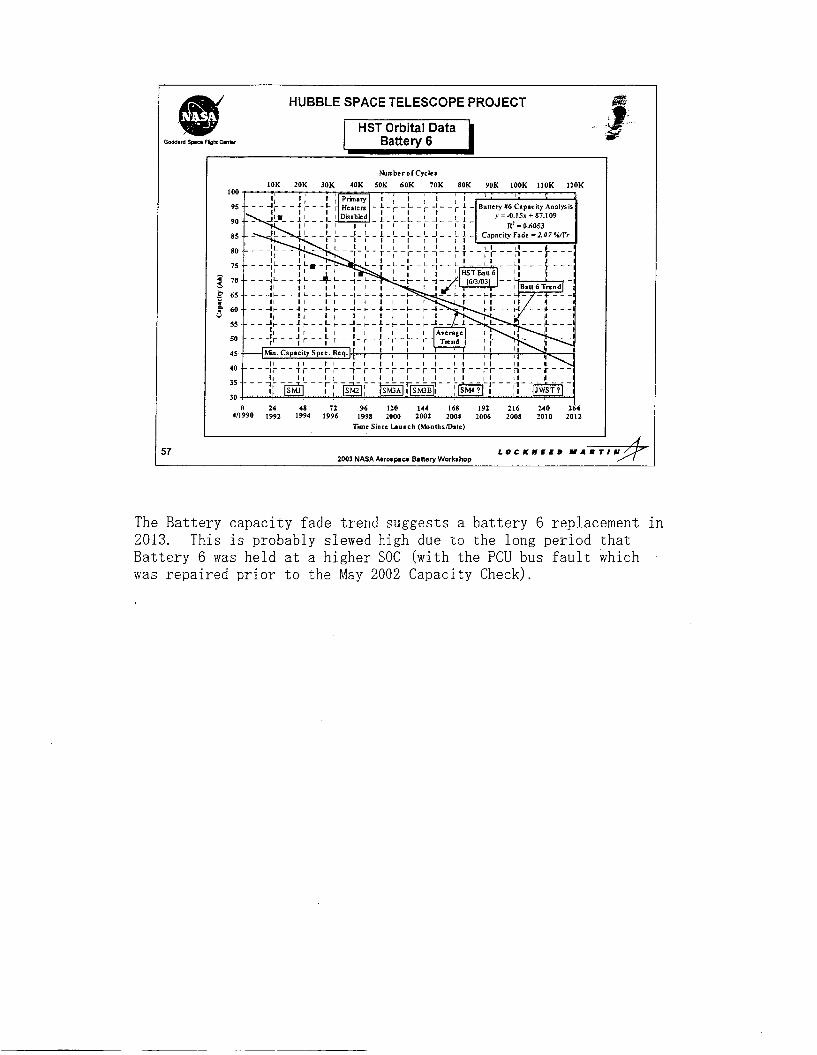
The Battery capacity fade trend suggests a battery 6 replacement in 2013. This is probably slewed high due to the long period that Battery 6 was held at a higher SOC (with the PCU bus fault which was repaired prior to the May 2002 Capacity Check).
__ Capacity Fade (% A W r ) 2.60 2.43 2.85 2.85 3.17 2.02 2.07 .Since Primary Heaters Disabled (I997 - ) I
System Batl Bat2 Bat3 Bat4 Bat5 Bat6 '
5?jecEdCife CC!l.L ?E!! - ..... 20.1 ..... !?2 ..... ..I 82.- .... ll,S .... 33.4 Z?.?...?._. Date CSystem Mi" Ah)..
R2 ___.-___I__.. __ . . -~.'?58.. . &98.- -..@?. ..... 0.20 . 0.94
.Since SM3B (412002 - ) i System Bat1 Bat2 Bat3 Bat4 Bat5 Bat6
---___ Projected Life (YE) - -. ... Fa -. .- 2 I:%.- -.L4A- -_14.4 -. n/a oate (Sy>t%Mi?Ahl._.._ _.L~kZoOS .~ .Oct-2005 n/a Sep:???? Feb-2~05 sep:2OO4 n/a
n/a
... ... ......... .......... !!SY-Z.F!-. M?Y:?010 .P.ec:?E? .n!Jr-200a oct-2006 SeJ-?023 ..JU!-?_Ol_q.
CapacW Fade (% A W r ) 2.62 2.76 3.08 2.04 3.53 1.42 1.57 ! i
......... ..15.4-- 1 5.5
.... . . . . R2 O,z? _n/a._ -. .!.!E.. 1:0_0. - LOP_
58 2003 NASAAerospace Banery Workshop
Capacity Fade (% A W r ) 4.79 4.70 nla Last Recondition
System Bat l Bat2 - Capacity (Ah) .. .~ .. 60.70 -. 58.86 .. .- ..... ..
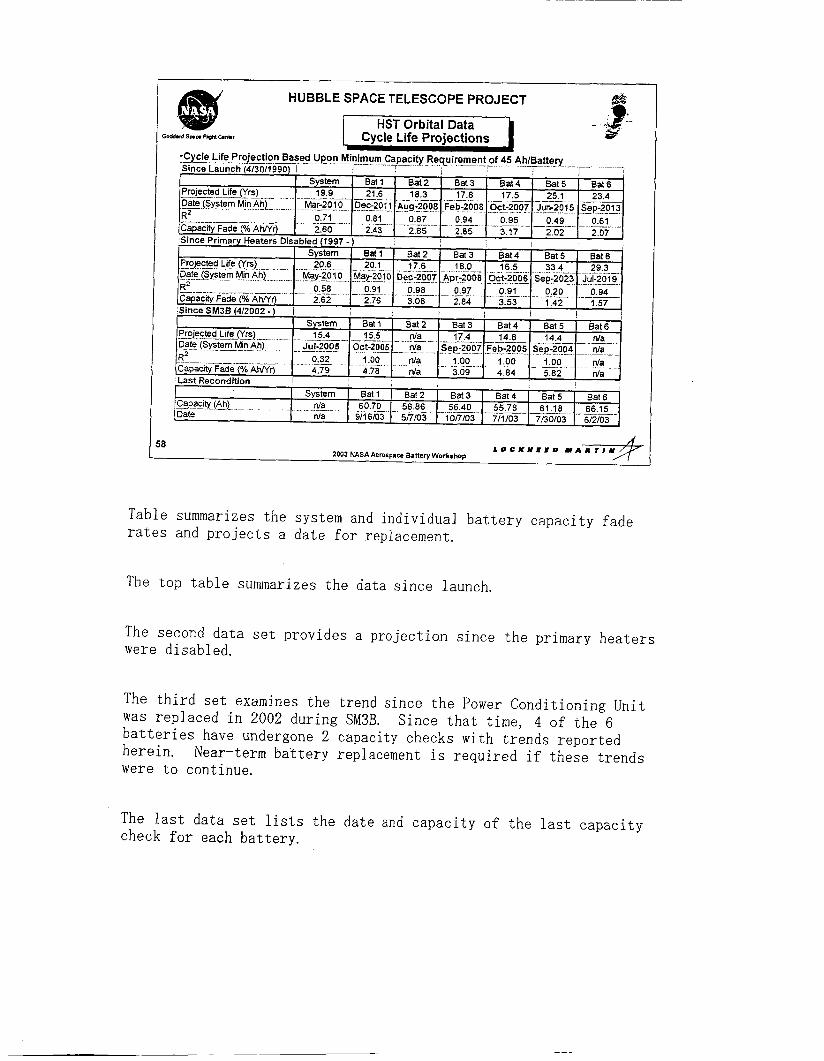
Table summarizes the system and individual battery capacity fade rates and projects a date for replacement.
3.09 4.84 5.82 n/a
Bat3 Bat4 Bat 5 Bat6 i
56.40 _.-__ 55.78 61.18 66.15 ..
The top table summarizes the data since launch.
Date
The second data set provides a projection since the primary heaters were disabled.
nla 9/16/03 517103 10/7/03 7/1/03 7/30/03 6/2/03
The third set examines the trend since the Power Conditioning Unit was replaced in 2002 during SM3B. batteries have undergone 2 capacity checks with trends reported herein. were to continue.
Since that time, 4 of the 6
Near-term battery replacement is required if these trends
The last data set lists the date and capacity of the last capacity check for each battery.
HUBBLE SPACE TELESCOPE PROJECT
GQ6daI.J s p a mhl w r
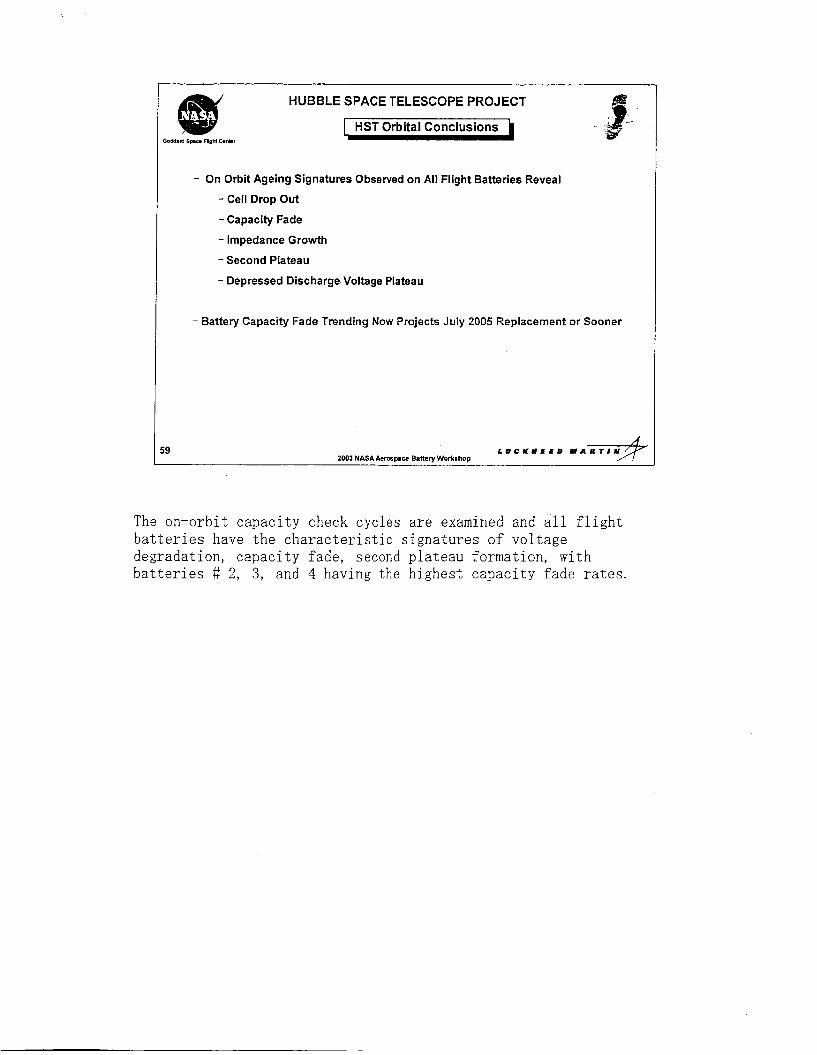
- On Orbit Ageing Signatures Observed on All Flight Batteries Reveal
- Cell Drop Out
- Capacity Fade
- Impedance Growth
- Second Plateau
- Depressed Discharge Voltage Plateau
- Battery Capacity Fade Trending Now Projects July 2005 Replacement or Sooner
i9 2003 NASA AerorMcd Banerv Workshoo
The on-orbit capacity check cycles are examined and all flight batteries have the characteristic signatures of voltage degradation, capacity fade, second plateau formation, with batteries # 2, 3, and 4 having the highest czpacity fade rates.

HUBBLE SPACE TELESCOPE PROJECT - -
1 ACKNOWLEDGEMENTS I - This Work Was Supported by NASA Contract Mod 593 Dated 2 June 1987 - Directed LMMSO to Design, Develop and Deliver Nickel-hydrogen Battery Modules
For the Hubble Space Telescope Low Earth Orbit Mission *Per NAS 8-32697 and NAS 5-5000.
LMMSO Wishes to Acknowledge the Technical Support From * HST Program Office for Orbital Data
NASAlMSFC for Ground Test Data. Eagle Picher Technologies for Hardware Development and Testing
60 2003 NASA Aerospace Banery Workshop