Warm-up Define Target Market Is it possible to target everyone?
Upload
iowa-city-area-development-groupCategory
view
213download
0description
[_
tu63
tu30
§̈¦80
§̈¦380
tu151
§̈¦88
tu61
tu218
tu67
tu30
tu52
§̈¦74
§̈¦80
tu30
tu34 tu61
TiptonMarengo
Muscatine
Fairfield
Williamsburg
Marion
Solon
Iowa City
Mount Pleasant
Central City
Iowa City
ElyLowden
West Branch
Keota
Eldridge
Swisher
Springville
Coralville
Mount Vernon
Riverside
Fairfax
West Liberty
Le ClaireBettendorf
North Liberty
Cedar Rapids
Iowa City
Cedar Rapids
DavenportDavenport
HiawathaLINNTAMA
IOWA
JONES
BENTON
CEDAR
CLINTON
KEOKUK
SCOTT
JACKSON
JOHNSON
HENRY
DAVIS
LOUISA
MAHASKA
POWESHIEK
WAPELLO
WASHINGTON
MUSCATINE
JEFFERSON
DES MOINES
VAN BUREN
MONROE
G U
PPANOOSE
ASPER
MARSHALL
KNOX
HENRY
MERCER
WARREN
WHITESIDE
CARROLL
PEORIA
ROCK ISLAND
HENDERSON
STARK
JO DAVIESS
BUR
STEPHENS
Potential Available Labor Per Occupational Category: Business Operations: Management - 5,398 Analysts - 3,534 Operation Specialists - 2,957 Accountants - 3,599 Personal Financial Advisors - 1,221 Loan Officers - 1,800 Accounting Clerks - 5,978 Customer Service Reps - 6,004 Information Clerks - 2,378 Office Clerks - 6,556 Claims Processors - 2,364 Secretaries & Office
Support - 14,847 Computers: Programmers - 578 Management - 592 Software Engineers - 2,378 Support Specialists - 1,789 Systems Analysts - 1,221 Specialists - 585 Desktop Publishers - 569
An estimated total of 64,348 people
in the Laborshed area
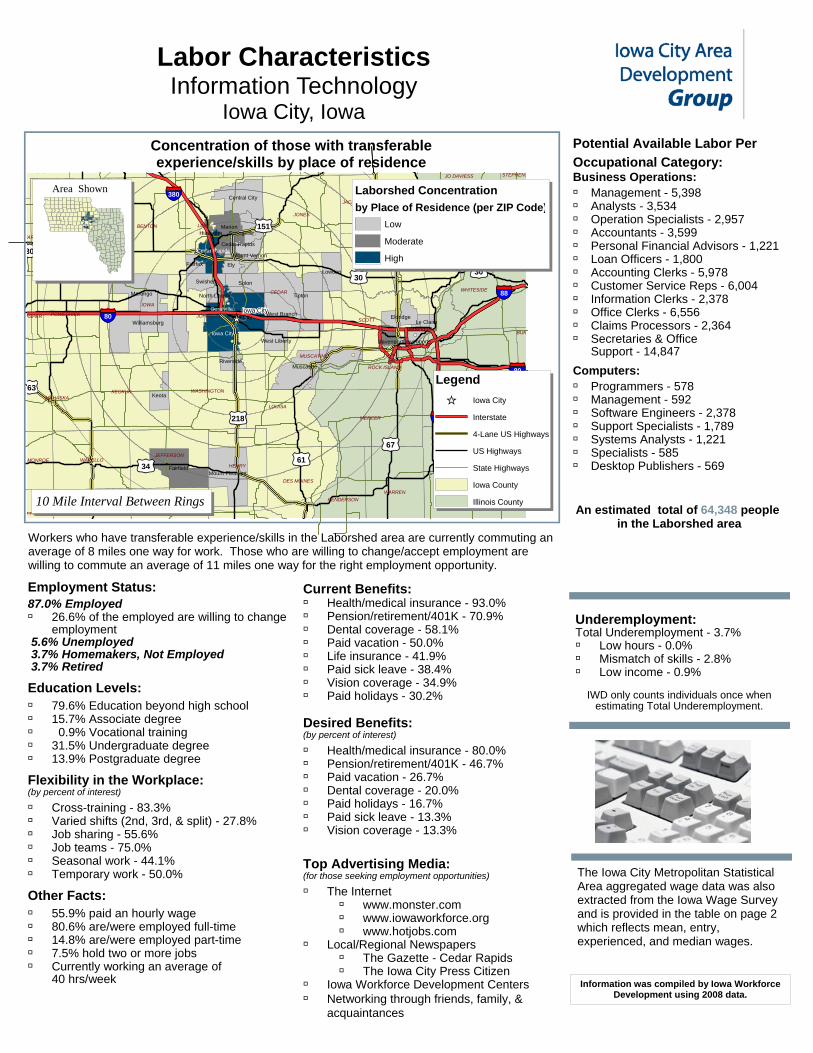
Concentration of those with transferable experience/skills by place of residence
Workers who have transferable experience/skills in the Laborshed area are currently commuting an average of 8 miles one way for work. Those who are willing to change/accept employment are willing to commute an average of 11 miles one way for the right employment opportunity.
Current Benefits: Health/medical insurance - 93.0% Pension/retirement/401K - 70.9% Dental coverage - 58.1% Paid vacation - 50.0% Life insurance - 41.9% Paid sick leave - 38.4% Vision coverage - 34.9% Paid holidays - 30.2%
Desired Benefits: (by percent of interest)
Health/medical insurance - 80.0% Pension/retirement/401K - 46.7% Paid vacation - 26.7% Dental coverage - 20.0% Paid holidays - 16.7% Paid sick leave - 13.3% Vision coverage - 13.3%
Top Advertising Media: (for those seeking employment opportunities)
The Internet www.monster.com www.iowaworkforce.org www.hotjobs.com
Local/Regional Newspapers The Gazette - Cedar Rapids The Iowa City Press Citizen
Iowa Workforce Development Centers Networking through friends, family, &
acquaintances
Employment Status: 87.0% Employed 26.6% of the employed are willing to change
employment 5.6% Unemployed 3.7% Homemakers, Not Employed 3.7% Retired
Education Levels: 79.6% Education beyond high school 15.7% Associate degree 0.9% Vocational training 31.5% Undergraduate degree 13.9% Postgraduate degree
Flexibility in the Workplace: (by percent of interest)
Cross-training - 83.3% Varied shifts (2nd, 3rd, & split) - 27.8% Job sharing - 55.6% Job teams - 75.0% Seasonal work - 44.1% Temporary work - 50.0%
Other Facts: 55.9% paid an hourly wage 80.6% are/were employed full-time 14.8% are/were employed part-time 7.5% hold two or more jobs Currently working an average of
40 hrs/week
The Iowa City Metropolitan Statistical Area aggregated wage data was also extracted from the Iowa Wage Survey and is provided in the table on page 2 which reflects mean, entry, experienced, and median wages.
Information was compiled by Iowa Workforce Development using 2008 data.
10 Mile Interval Between Rings
Underemployment: Total Underemployment - 3.7% Low hours - 0.0% Mismatch of skills - 2.8% Low income - 0.9%
IWD only counts individuals once when
estimating Total Underemployment.
Labor Characteristics Information Technology
Iowa City, Iowa
Legend
[_ Iowa City
Interstate
4-Lane US Highways
US Highways
State Highways
Iowa County
Illinois County
Laborshed Concentrationby Place of Residence (per ZIP Code)
Low
Moderate
High
Area Shown

Iowa City Area Development Group 325 East Washington Street Suit 100 Iowa City, Iowa 52240 Phone: (319) 354.3939 www.iowacityareadevelopment.com
This Iowa Wage Survey for the Iowa City Metropolitan Statistical Area (MSA) was produced by the Workforce Data & Business Development Bureau to provide communities local information on wages by occupation. This publication was developed specifically for the Iowa City MSA . The source of the wage and employment data is the 2007 Iowa Wage Survey. Additional data from the Iowa Wage Survey for individual counties, Iowa Workforce Development regions, and by industry statewide are available on the Iowa Workforce Development web site located at www.iowaworkforce.org.
Occupation
Occupational
Code
Mean Wage
Entry Wage
Experienced
Wage
Median Wage
Accountants and Auditors 13-2011 $ 24.97 $ 17.46 $ 28.74 $ 22.81 Computer and Information Systems Managers 11-3021 $ 39.27 $ 28.03 $ 44.88 $ 38.86 Computer Operators 43-9011 $ 14.76 $ 10.18 $ 17.05 $ 13.68 Computer Programmers 15-1021 $ 24.01 $ 18.04 $ 27.00 $ 23.48 Computer Software Engineers, Systems Software 15-1032 $ 30.99 $ 24.18 $ 34.39 $ 31.11 Computer Specialists, All Other 15-1099 $ 26.60 $ 18.78 $ 30.52 $ 27.46 Customer Service Representatives 43-4051 $ 12.77 $ 9.87 $ 14.23 $ 12.25 Data Entry Keyers 43-9021 $ 12.09 $ 8.66 $ 13.81 $ 10.96 Database Administrators 15-1061 $ 28.61 $ 17.98 $ 33.93 $ 26.65 First-Line Supervisors/Managers of Office and Administrative Support Workers 43-1011 $ 21.65 $ 15.19 $ 24.88 $ 20.36
Network Systems and Data Communications Analysts 15-1081 $ 26.87 $ 17.56 $ 31.53 $ 26.40 Office and Administrative Support Workers, All Other 43-9199 $ 9.89 $ 6.75 $ 11.45 $ 10.26 Sales Representatives, Wholesale and Manufacturing, Technical and Scientific Products 41-4011 $ 39.89 $ 13.95 $ 52.86 $ 51.09
Telecommunications Equipment Installers and Repairers, Except Line Installers 49-2022 $ 21.17 $ 16.49 $ 23.50 $ 18.19
Telecommunications Line Installers and Repairers 49-9052 $ 20.95 $ 17.28 $ 22.79 $ 20.95