HSCRC Rate System - Maryland HFMAhfmamd.org/downloads/HSCRC_2016_Workshop/brozic_lieu_hscrc... ·...
55
HSCRC Rate System January 29, 2016
Transcript of HSCRC Rate System - Maryland HFMAhfmamd.org/downloads/HSCRC_2016_Workshop/brozic_lieu_hscrc... ·...

HSCRC Rate SystemJanuary 29, 2016
Discussion Topics• Overview• Rate Order• Annual Rate Order Adjustments• Unit Rate Compliance• Compliance• Required Reporting• Terminology and Acronyms
Overview• HSCRC has developed methodologies to constrain
healthcare costs in Maryland
• Currently, Hospitals are under one of the following rate methodologies:– Total Patient Revenue (TPR)– Global Budget Revenue (GBR)

Total Patient Revenue (TPR)• Inpatient and outpatient revenue is constrained by the TPR
System• Implemented July 1, 2010 (Garrett and McCready
transitioned to TPR prior to 2010)• Approved revenue amount in a given year is a fixed cap• No adjustment for changes in volume• No adjustment for changes in Case Mix Index (CMI)• Available to sole community provider hospitals and hospitals
operating in regions of the State that don’t share service areas with other hospitals
Global Budget Revenue (GBR)• CPC and CPE hospitals transitioned to GBR in FY 2014 and
FY 2015• It is an extension of the TPR methodology
– Inpatient and outpatient revenue is fixed– No adjustment for changes in volume– No adjustment for changes in Case Mix Index (CMI)
• Encourages hospitals to focus on population-based health management

TPR vs. GBRAreas of Difference TPR GBR
Excluded Services • All services are included under TPR
• GBR agreements may exclude out of state revenue, categorical exclusions, or transfer in cases (listed in Appendix B of theAgreement)
Investments in Infrastructure Reporting
• No annual report requirement detailing how investments in infrastructure promoted improvement in care delivery and reduction in Potentially Avoidable Utilizations (PAUs)
• Annual report detailing how investments in infrastructure promoted improvement in care delivery and reduction in Potentially Avoidable Utilizations (PAUs) due 90 days after end of fiscal year starting in FY15
Out-of-State Monitoring • Does not mention out-of-state monitoring
• HSCRC/Hospital will monitor and identify significant changes in %’s of out-of-state patient services/revenues to help stay within the constraints of the Agreement
Termination of Agreement• May terminate the TPR agreement if
unwilling to accept HSCRC revenue adjustments
• May transition to a different rate setting approach with a 6 month notice to the HSCRC

Which rate methodology is your hospital under?TPR GBR
Calvert Memorial Hospital Anne Arundel Medical Center MedStar Union Memorial HospitalCarroll Hospital Center Atlantic General Hospital Mercy Medical CenterGarrett County Memorial Hospital Bon Secours Hospital Northwest HospitalMcCready Doctors Community Hospital Peninsula Regional Medical CenterMeritus Medical Center Frederick Memorial Hospital Prince Georges Hospital CenterUM Shore at Chestertown Ft. Washington Medical Center Shady Grove Adventist HospitalUM Shore at Dorchester Greater Baltimore Medical Center Sinai HospitalUM Shore at Easton Holy Cross Hospital St. Agnes HospitalUnion Hospital of Cecil County Holy Cross Germantown Suburban HospitalWestern Maryland Health System Howard County General Hospital University of Maryland Medical Center
Johns Hopkins Hospital UM Baltimore Washington Medical CenterJohns Hopkins Bayview Medical Center UM Charles Regional Medical CenterLaurel Regional Hospital UM Harford Memorial HospitalMedStar Franklin Square Hospital Center UM MidtownMedstar Good Samaritan Hospital UM Rehab & Ortho InstMedStar Harbor Hospital Center UM St. Joseph Medical CenterMedStar Montgomery General Hospital UM Upper Chesapeake Medical CenterMedStar Southern Maryland Hospital Washington Adventist HospitalMedStar St. Mary Hospital

HEALTH SERVICES COST REVIEW COMMISSION
Maryland Medical Center
BudgetedService Unit Budgeted Annual
Revenue Center Unit Rates Volume Revenues
Med./Surg. Acute Patient Days $1,169.6980 10,074 $11,783,537Pediatrics Patient Days $1,537.7093 504 $774,544Obstetric Acute Patient Days $892.5342 5,037 $4,495,695Definitive Observation Patient Days $1,618.4499 5,037 $8,152,132Med./Surg. I.C.U. Patient Days $2,344.1673 2,015 $4,723,028Neo-Natal I.C.U. Patient Days $1,565.4003 1,007 $1,576,984New Born Nursery Patient Days $733.7898 5,037 $3,696,099Admissions Admission $189.3488 5,037 $953,750Emergency Services MD RVU'S $49.6919 402,960 $20,023,840Clinic Services RVU'S $43.2071 251,850 $10,881,707Operating Room Minutes $27.3030 1,007,400 $27,505,073Laboratory MD RVU'S $1.3387 2,014,800 $2,697,187Electrocardiography MD RVU'S $3.6443 100,740 $367,124Electroencephalography 74 CAL RVU'S $13.7141 100,740 $1,381,559Radiology-Diagnostic HSCRC RVU'S $32.1426 201,480 $6,476,089Respiratory Therapy MD RVU'S $1.9639 1,007,400 $1,978,460Physical Therapy MD RVU'S $7.7004 503,700 $3,878,691Renal Dialysis Treatments $798.4351 101 $80,434Observation RVU'S $83.3950 20,148 $1,680,242Med./Surg. Supplies Invoice Cost $50,788,303Drugs Invoice Cost $38,718,608
(R) Rebundled Rate TOTAL $202,613,086
Interim Global Budget Revenue Target Effective December 31, 2014 $101,306,543
New Approved Revenue and Unit Ratesfor
GLOBAL BUDGETEffective
July 1, 2014

Rate Order• Revenue Center: Hospitals
have different revenue centers depending on the services they provide
• Service Unit: The service unit is the same for all hospitals (i.e. every hospital charges for Operating Room services by the minute)
• Unit Rates: Unit rates (prices) vary by hospital – These rates must be
charged to all payers - no contract negotiations
Service UnitRevenue Center Unit Rates
Med./Surg. Acute Patient Days $1,169.6980Obstetric Acute Patient Days $892.5342Med./Surg. I.C.U. Patient Days $2,344.1673New Born Nursery Patient Days $733.7898Admissions Admission $189.3488Emergency Services MD RVU'S $49.6919Clinic Services RVU'S $43.2071Operating Room Minutes $27.3030Laboratory MD RVU'S $1.3387Radiology-Diagnostic HSCRC RVU'S $32.1426Physical Therapy MD RVU'S $7.7004Observation RVU'S $83.3950

RVUs• RVUs relate to the
complexity (time and cost) of tests and procedures
• The service units for RVU's (relative value units) are defined by the HSCRC in Appendix D
• For example, a chest x-ray, single view, has the same RVUs at all Maryland hospitals
APPENDIX DSTANDARD UNIT OF MEASURE REFERENCES
DIAGNOSTIC RADIOLOGY
CPTCODE DESCRIPTION RVUs71010 Chest, single view, post 271015 Stereo, frontal 371023 With fluoroscopy 671030 Chest, complete, minimum of 4 views 5

The patient charge becomes a calculation…Service Unit
Revenue Center Unit Rates
Med./Surg. Acute Patient Days $1,169.6980Obstetric Acute Patient Days $892.5342Med./Surg. I.C.U. Patient Days $2,344.1673New Born Nursery Patient Days $733.7898Admissions Admission $189.3488Emergency Services MD RVU'S $49.6919Clinic Services RVU'S $43.2071Operating Room Minutes $27.3030Laboratory MD RVU'S $1.3387Radiology-Diagnostic HSCRC RVU'S $32.1426Physical Therapy MD RVU'S $7.7004Observation RVU'S $83.3950
CPTCODE DESCRIPTION RVUs71010 Chest, single view, post 271015 Stereo, frontal 371023 With fluoroscopy 671030 Chest, complete, minimum of 4 views 5
2 RVUs x $32.1426 = $64.29

Updates to Rate Orders• Hospitals receive an updated rate order once per year -
effective July 1• Unit rates are updated for:
– Inflation (Update Factor)– Change in Markup– Population– Infrastructure Investments– Price Variances and Penalties– NSP I and NSP II– Assessments and Fees– Quality Measures

Updates to Rate Orders"GBR/TPR-2"
Calculation of New Budgeted Revenue for GBR/TPR Hospitals
HOSPITAL Maryland Medical Center EFFECTIVE DATE: 07/01/14
A. Current Approved Revenue $200,000,000
B. Reversal of Previous Retroactive Adjustments:1 Prior Savings/Dissavings $02 Prior Price Penalty 03 NSP I (585,884)4 NSP II (585,884)5 MHIP (5,033,641)6 Health Care Coverage Fund (6,224,152)7 Deficit Assessment (13,084,485)8 CRISP 09 Newborn Testing (370,790)
10 HSCRC User Fee Assessment (268,518)11 MHCC User Fee Assessment (172,474)12 QBR Scaled Revenue for RY 2013 (83,668)13 MHAC Scaled Revenue for RY 2013 723,301
Total Price Leveling Adjustments (25,686,195)
C. Permanent Revenue before update 174,313,805
D. Update Factor 2.17%
E. Change in Markup -0.87%
F. Population Adjustment (calculated as per GBR/TPR Agreement) 0.74%
G. Infrastucture Adjustment 0.33%
H. Approved Revenue Inflated (C x (D+1) x (E+1) x (F+1) x (G+1)) 178,427,778
Other Permanent Adjustments $ - I. Adjusted Approved Revenue Inflated 178,427,778
Adjustments:1 Net Overcharge Adjustment (1,000,000)$ 2 Current Year Price Penalty - 3 NSP I 601,276 4 NSP II 601,277 5 MHIP 2,315,329 6 Health Care Coverage Fund 6,497,092 7 Deficit Assessment 13,181,524 8 CRISP 113,766 9 Newborn Testing 370,790
10 HSCRC User Fee Assessment 445,973 11 MHCC User Fee Assessment 173,489 12 QBR Scaled Revenue for RY 2015 584,738 13 MHAC Scaled Revenue for RY 2015 300,054 14 Other -
Subtotal Special Adjustments 24,185,308 24,185,308
New Approved Revenue 202,613,086$
December 31, 2014 Target 101,306,543$

History of Update Factors• The following chart displays the previous six years’
update/inflation factors that have been applied to hospitals’ rates:
• FY 2010 to FY 2014, the update factor was adjusted by the variable cost factor (VCF)
• In FY 2015 and FY 2016, the update factor was adjusted by the shared savings adjustment
FY2016 FY2015 FY2014 FY2013 FY2012 FY2011Inpatient 2.40% 2.40% 1.65% -1.00% 2.20% 1.77%Outpatient 2.40% 2.40% 1.65% 2.59% 3.05% 1.27%

Change in Markup• Rates are marked up based on hospital payer mix and
uncompensated care • Payer mix for FY 2014 was used to mark up FY 2016 rates
1 A 0.3975 <-- From Sched. PDA, LINE H2 B1 0.1045 <-- From Sched. PDA, LINE I2 B2 0.1065 <-- From Sched. PDA, LINE I13 C 0.0511 <-- From Sched. PDA, LINE J4 D 0.0116 <-- From Sched. PDA, LINE K
5 0.0429 <-- From UCC Policy & Regression For Reference
6 0.29752 Payer DifferentiaMC & MA
7 1.08752 0.023848145
1 A 0.3975 <-- From Sched. PDA, LINE H2 B1 0.1045 <-- From Sched. PDA, LINE I2 B2 0.1065 <-- From Sched. PDA, LINE I13 C 0.0511 <-- From Sched. PDA, LINE J4 D 0.0116 <-- From Sched. PDA, LINE K
5 0.0616 <-- Statewide Average UCC Included in RatesFor Reference
6 0.27882 Payer DifferentiaMC & MA
7 1.10964 0.023848145
Provision for Other Payors : FP = 1 - (A + B1 + B2 + C +
Approved Markup: GP = GP
Deductibles Paid by Medicaid & Blue
Provision for Uncollectable Accounts : EP - Prospective
Markup Calculation - Statewide Bad Debt Provision
Ratio of Medicare & Medicaid ChargesRatio of Blue Cross I/P ChargesRatio of Blue Cross O/P ChargesRatio of HMO Charges to Total
Deductibles Paid by Medicaid & Blue
Provision for Uncollectable Accounts : EP - Prospective
Provision for Other Payors : FP = 1 - (A + B1 + B2 + C +
Approved Markup: GP = GP
Markup Calculation - Hospital Specific Bad Debt Amount
Ratio of Medicare & Medicaid ChargesRatio of Blue Cross I/P ChargesRatio of Blue Cross O/P ChargesRatio of MCO Medicare, Medicaid
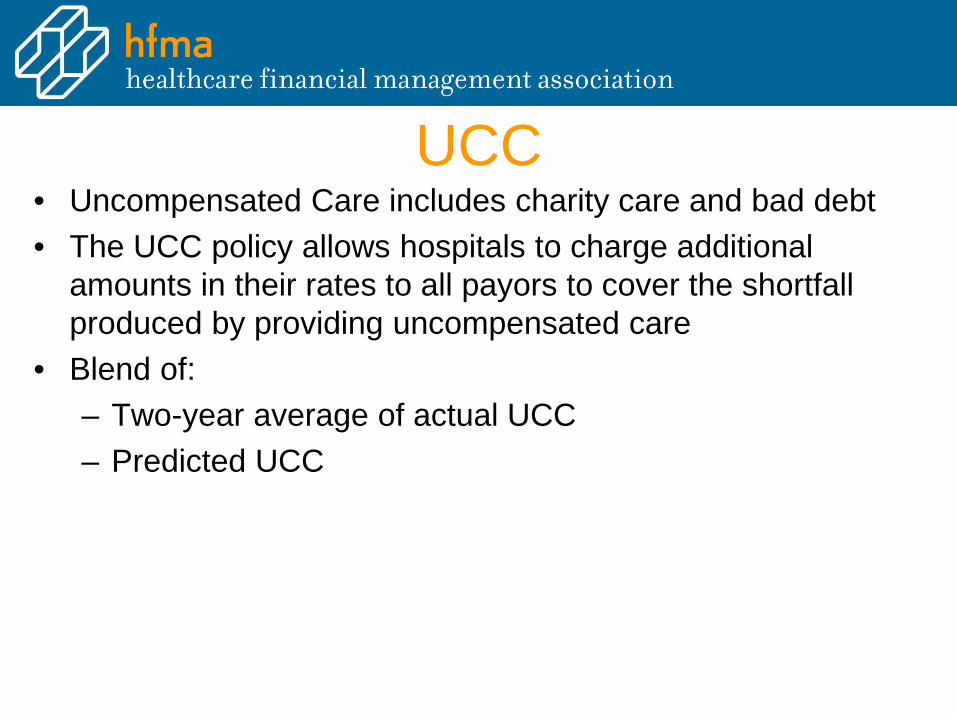
UCC• Uncompensated Care includes charity care and bad debt• The UCC policy allows hospitals to charge additional
amounts in their rates to all payors to cover the shortfall produced by providing uncompensated care
• Blend of:– Two-year average of actual UCC– Predicted UCC

UCC• Two-year average actual UCC is based on the Hospital’s
two most recent year’s Annual Filings• Predicted UCC uses a linear regression model
– Independent variable (x): Actual Uncompensated Care– Dependent variables (y):
1) The proportion of a hospital’s total charges from inpatient Medicaid admissions through the ER
2) The proportion of a hospital’s total charges from inpatient commercial insurance cases
3) The proportion of a hospital’s total charges from inpatient self-pay, and charity cases
4) The proportion of a hospital’s total charges from outpatient self-pay and charity ER charges
5) The proportion of a hospital’s total charges from inpatient self-pay and charity admissions through the ER from the top 80% Medicaid undocumented aliens enrollment zip codes

UCC• UCC Pool – since Statewide UCC % is built into all
hospitals’ rates, the UCC Pool acts as a settlement methodology to account for hospitals that experience more or less UCC than the State
• Hospital position relative to the state determines what each hospital pays into or receives from the pool
UCC Policy Result
Statewide UCC %
UCC Above / (Below) Average
Hospital A 15.00% 7.47% 7.53%Hospital B 7.47% 7.47% 0.00%Hospital C 3.50% 7.47% -3.97%

Population Adjustment• HSCRC calculates population growth for each
hospital’s primary and secondary service area by age cohort
• An adjustment is made to the TPR/GBR Cap in order to account for the increase or decrease in the population

Infrastructure Adjustment• Funding of infrastructure investments is included in
rates • Hospital investments to improve population health
– Patient Centered Investments– Provider/Care Team Investments– Health Information Technology Investments

Nurse Support Program• Nurse Support I
– Goal is to increase the number of bedside nurses in Maryland through retention and recruitment
– Funding to enable hospitals to promote nursing through enhanced educational opportunities, leadership development, research and shared governance
– Opportunities translate into higher satisfaction among Maryland nurses and better outcomes for patients
• Nurse Support II– Funding to increase nursing faculty and expand educational
capacity to increase the number of qualified bedside nurses in Maryland

Assessments• Two assessments pass through hospitals in order to support
“medically uninsurable” patients and Medicaid expansion– MHIP (Maryland Health Insurance Plan)– Health Care Coverage Fund
• Medicaid Budget Deficit Assessment– State total spread to hospitals based on % of total revenue– Payer portion put into rates (all-payers) 86%– Hospital portion paid by hospital throughout year 14%
• CRISP Funding– Funding to meet expanded data needs under the new all-payer
model

Fees• HSCRC User Fees
– Funding based on a blend of number of admissions and total revenue reported in HSCRC Annual Filing
– FY 2015 Annual Filing used to calculate fees in FY 2017 rate order
• MHCC User Fees– Funding based on a blend of number of admissions and total
revenue reported in HSCRC Annual Filing– FY 2015 Annual Filing used to calculate fees in FY 2017 rate order
• Newborn Testing– Funding for mandated newborn testing– Funding based on number of births from prior year

Quality Based Reimbursement (QBR)• Implemented: July 2008• What’s Measured:
– Clinical process measures (core measures)– Patient satisfaction (HCAHPS)– Outcomes measures
• Morality• Patient safety indicators (new for FY 2017 rates)• Central line-associated blood stream infections (new for FY 2017 rates)
• Source of Data: CMS QIO Clinical Warehouse• Measurement Period: Calendar Year
– For example, results from CY 2015 will impact FY 2017 rates • % of Revenue at Risk: 2% for FY 2017
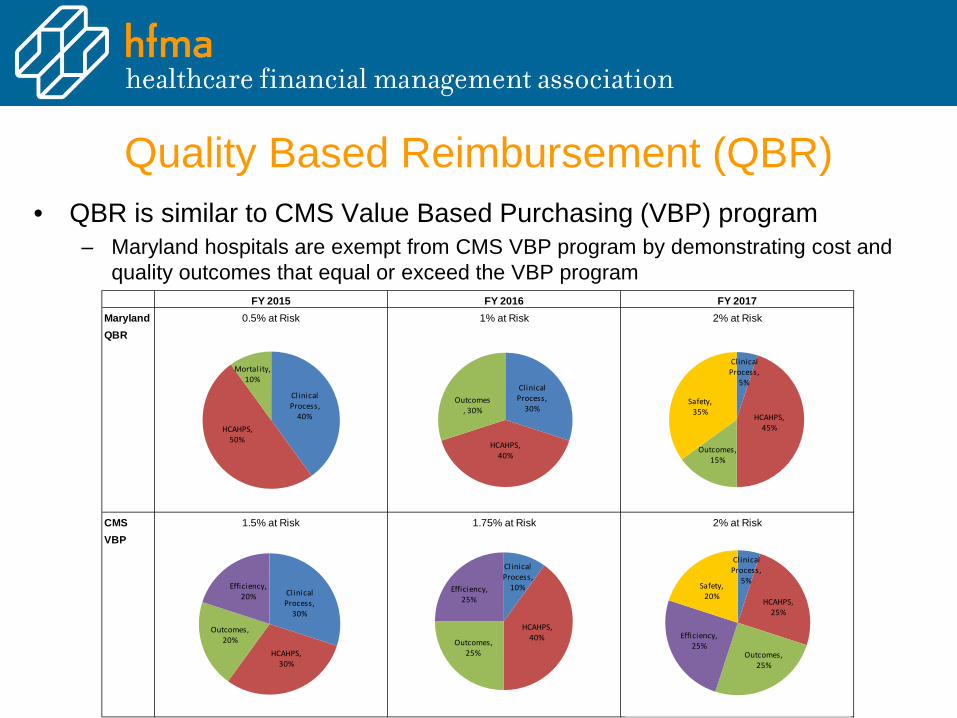
Quality Based Reimbursement (QBR)• QBR is similar to CMS Value Based Purchasing (VBP) program
– Maryland hospitals are exempt from CMS VBP program by demonstrating cost and quality outcomes that equal or exceed the VBP program
FY 2015 FY 2016 FY 2017Maryland 0.5% at Risk 1% at Risk 2% at RiskQBR
CMS 1.5% at Risk 1.75% at Risk 2% at RiskVBP
Clinical Process,
40%HCAHPS,
50%
Mortality, 10%
Clinical Process,
30%
HCAHPS, 40%
Outcomes, 30%
Clinical Process,
5%
HCAHPS, 45%
Outcomes, 15%
Safety, 35%
Clinical Process,
30%
HCAHPS, 30%
Outcomes, 20%
Efficiency, 20%
Clinical Process,
10%
HCAHPS, 40%Outcomes,
25%
Efficiency, 25%
Clinical Process,
5%
HCAHPS, 25%
Outcomes, 25%
Efficiency, 25%
Safety, 20%

Maryland Hospital Acquired Conditions (MHAC)• Implemented: July 2009• What’s Measured: 65 Potentially Preventable Conditions (PPC's)
– Diagnosis present on admission? If POA=No, possible PPC • Source of Data: Monthly discharge data submitted by hospitals • Measurement Period: Calendar year
– Results from CY 2015 will impact FY 2017 rates • Statewide Target: 8% reduction in PPCs• % of Revenue at Risk: 3% for FY 2017• Point system with PPCs weighted in 3 tiers: 100%, 60% and 40%• Hospitals are evaluated for both attainment and improvement
– Attainment compares hospital to statewide thresholds and benchmarks– Improvement compares hospital year-over-year improvement– Hospital score is the higher of attainment or improvement for each PPC

MHACs• Tiered approach where the
reward/penalty differs based on statewide progress
• If statewide target of 8% is met, maximum penalty/reward of 1%
• If statewide target of 8% is not met, maximum penalty of 3% and no reward opportunity

Readmissions Reduction Incentive • Implemented: January 1, 2014• What’s Measured: Inpatient, all-payer, all cause readmissions within
30 days of an inpatient admission– Includes inter & intra hospital readmissions– Adjusted for planned readmissions
• Measurement Period: Calendar year – Results from CY 2015 will impact FY 2017 rates
• Statewide Target: Cumulative improvement target of 9.3% for all hospitals for CY2015 compared to CY2013
• % of Revenue at Risk: 2% for FY 2017– Hospitals may receive up to a 1% inpatient revenue reward for reducing
readmission rates at or better than the minimum required improvement target

Market Shift Adjustments (MSA)• Implemented to provide criteria for increasing or decreasing the
approved regulated revenue of hospitals under GBR or TPR arrangements
• An MSA should reflect shifts in patient volume independent of general volume increases in the market
• MSA features include: – A specified population from which hospital’s market shifts will be calculated– A defined set of covered services– An approach that is budget neutral to the maximum extent practicable and/or results
in demonstrably higher quality of care • Market Shift Algorithm:
– Calculated based on a specific service for a defined geographic location – Algorithm compares growth in volumes at hospitals with utilization increases to the
decline in volumes at hospitals with utilization decreases – Adjustments are capped at the lesser of the growth for volume gains or the decline for
volume losses

Rate Realignment• Charges are related to the underlying cost of providing the
service • This does not change a hospital's total revenue; it just
reallocates it among revenue centers• Costs for FY 2015 were used to realign FY 2017 rates

Rate RealignmentUsing the M schedule from the most recent Annual Filing, the revenue is realigned based on
the volume adjusted cost in each center. For example, if MSG has 15% of the costs, then 15% of the revenue will be allocated to that center.
-0.20GBR % Adjusted Prorated Permanent Final Final
Revenue Schedule M (Pop. Adj.) Difference Schedule M Non RR Current Realigned Revenue Permanent One -Time Rate Order Rate OrderCenter Units Revenue Units Units Revenue Revenue Revenue Rates After Update Rate Adjustments Revenue Rates
$174,313,805 $178,427,778 $24,185,308 $202,613,086MSG 9,500 10,447.9 10,074 1.0604 8,989.6 $10,118,236 $1,004.39 $10,376,972 $1,030.07 $1,406,565 $11,783,537 $1,169.70PED 510 750.2 504 0.9876 590.9 $665,082 $1,320.39 $682,089 $1,354.16 $92,455 $774,544 $1,537.71OBS 4,800 4,038.0 5,037 1.0494 3,429.8 $3,860,343 $766.40 $3,959,057 $786.00 $536,637 $4,495,695 $892.53DEF 4,500 6,764.9 5,037 1.1193 6,219.2 $7,000,037 $1,389.72 $7,179,037 $1,425.26 $973,095 $8,152,132 $1,618.45MIS 1,750 3,787.6 2,015 1.1513 3,603.2 $4,055,549 $2,012.88 $4,159,255 $2,064.35 $563,774 $4,723,028 $2,344.17NEO 950 1,398.2 1,007 1.0604 1,203.1 $1,354,118 $1,344.17 $1,388,744 $1,378.54 $188,240 $1,576,984 $1,565.40NUR 4,000 2,662.0 5,037 1.2593 2,819.7 $3,173,750 $630.09 $3,254,907 $646.20 $441,192 $3,696,099 $733.79ADM 4,500 791.5 5,037 1.1193 727.6 $818,962 $162.59 $839,904 $166.75 $113,846 $953,750 $189.35EMG 350,000 11,676.9 402,960 1.1513 17,410,962 $17,410,962 $43.21 $17,633,655 $43.76 $2,390,185 $20,023,840 $49.69CL 200,000 6,448.2 251,850 1.2593 9,461,771 $9,461,771 $37.57 $9,582,790 $38.05 $1,298,916 $10,881,707 $43.21OR 900,000 18,746.5 1,007,400 1.1193 20,983.5 $23,617,934 $23.44 $24,221,876 $24.04 $3,283,197 $27,505,073 $27.30LAB 1,500,000 1,531.9 2,014,800 1.3432 2,057.7 $2,316,008 $1.15 $2,375,232 $1.18 $321,955 $2,697,187 $1.34EKG 823,823 2,290.4 100,740 0.1223 280.1 $315,241 $3.13 $323,302 $3.21 $43,823 $367,124 $3.64EEG 231,246 2,419.4 100,740 0.4356 1,054.0 $1,186,311 $11.78 $1,216,646 $12.08 $164,912 $1,381,559 $13.71RAD 414,049 10,153.1 201,480 0.4866 4,940.6 $5,560,859 $27.60 $5,703,058 $28.31 $773,031 $6,476,089 $32.14RES 3,594,268 5,385.2 1,007,400 0.2803 1,509.4 $1,698,855 $1.69 $1,742,297 $1.73 $236,163 $1,978,460 $1.96PTH 1,404,433 8,250.5 503,700 0.3587 2,959.0 $3,330,537 $6.61 $3,415,703 $6.78 $462,987 $3,878,691 $7.70RDL 2,477 1,508.8 101 0.0407 61.4 $69,067 $685.60 $70,833 $703.13 $9,601 $80,434 $798.44OBV 64,338 4,093.3 20,148 0.3132 1,281.9 $1,442,783 $71.61 $1,479,677 $73.44 $200,565 $1,680,242 $83.39MSS 29,000,000 37,179.6 30,222,000 1.0421 38,746.3 $43,610,676 $1.44 $44,725,858 $1.48 $6,062,445 $50,788,303 $1.68CDS 19,000,000 27,855.3 20,148,000 1.0604 29,538.3 $33,246,723 $1.65 $34,096,885 $1.69 $4,621,722 $38,718,608 $1.92
TOTAL 57,515,144 168,179.5 56,015,067 $130,995.2 $26,872,733.0 174,313,805 178,427,778 24,185,308 202,613,086

Price Compliance• TPR/GBR unit rate compliance corridors are
relaxed• Hospitals may charge up to 5% above or below the
approved unit rates without penalty• This limit can be extended to 10% with approval by
Commission Staff

Unit Rate Compliancea b c d=b/c e=(d-a)*c f=(d-a)/a g h i=g/h j=(i-a)*h k=(i-a)/a
07/01/2014 Current Month Year to DateOver Over Upper Lower
Final Actual Rate (Under) % Actual Rate (Under) % Price PriceRates Revenue Volumes Charged Charge Variance Revenue Volumes Charged Charge Variance Limit Limit
MSG Med/Surg $1,169.6980 $5,934,280 5,100 $1,163.5843 ($31,180) -0.52% $17,187,790 14,500 $1,185.3648 $227,169 1.34% 5.00% -5.00%PED Pediatrics 1,537.7093 175,956 115 1,530.0522 (881) -0.50% 447,304 275 1,626.5600 24,434 5.78% 5.00% -5.00%OBS Obstetrics 892.5342 811,120 900 901.2444 7,839 0.98% 2,813,843 3,250 865.7977 (86,894) -3.00% 5.00% -5.00%DEF Definitive Care 1,618.4499 1,339,634 850 1,576.0400 (36,048) -2.62% 3,759,429 2,250 1,670.8571 117,916 3.24% 5.00% -5.00%MIS Med Surg ICU 2,344.1673 766,504 300 2,555.0133 63,254 8.99% 2,865,313 1,250 2,292.2504 (64,896) -2.21% 5.00% -5.00%NEO NICU 1,565.4003 940,260 650 1,446.5538 (77,250) -7.59% 2,770,355 1,650 1,679.0030 187,445 7.26% 5.00% -5.00%NUR Nursery 733.7898 534,322 700 763.3171 20,669 4.02% 1,791,646 2,500 716.6582 (42,829) -2.33% 5.00% -5.00%ADM Admissions 189.3488 358,578 1,900 188.7253 (1,185) -0.33% 1,097,506 5,875 186.8095 (14,918) -1.34% 5.00% -5.00%EMG Emergency Room 49.6919 3,809,853 80,000 47.6232 (165,499) -4.16% 10,710,286 225,000 47.6013 (470,392) -4.21% 5.00% -5.00%OBV Observation 83.3950 1,015,793 12,000 84.6495 15,053 1.50% 2,686,903 32,500 82.6739 (23,435) -0.86% 5.00% -5.00%CL Clinic 43.2071 2,162,848 50,000 43.2570 2,493 0.12% 6,254,746 150,000 41.6983 (226,319) -3.49% 5.00% -5.00%OR Operating Room 27.3030 5,010,118 180,000 27.8340 95,578 1.94% 15,143,743 550,000 27.5341 127,093 0.85% 5.00% -5.00%LAB Laboratory 1.3387 1,758,435 1,250,000 1.4067 85,060 5.08% 5,543,112 4,281,566 1.2946 (188,620) -3.29% 5.00% -5.00%EKG EKG 3.6443 211,190 60,000 3.5198 (7,468) -3.42% 668,497 174,000 3.8419 34,389 5.42% 5.00% -5.00%EEG EEG 13.7141 184,089 14,000 13.1492 (7,908) -4.12% 720,887 55,645 12.9551 (42,234) -5.53% 5.00% -5.00%RAD Radiology 32.1426 985,589 30,000 32.8530 21,311 2.21% 2,901,759 99,707 29.1029 (303,083) -9.46% 5.00% -5.00%RES Respiratory Therapy 1.9639 535,025 275,000 1.9455 (5,048) -0.93% 1,448,931 801,663 1.8074 (125,455) -7.97% 5.00% -5.00%PTH Physical Therapy 7.7004 822,340 118,500 6.9396 (90,157) -9.88% 2,729,540 295,000 9.2527 457,922 20.16% 5.00% -5.00%RDL Renal Dialysis 798.4351 131,528 174 755.9090 (7,400) -5.33% 435,204 520 836.9302 20,017 4.82% 5.00% -5.00%
Subtotal 27,487,463 2,080,189 (118,765) -0.43% 81,976,791 6,697,151 (392,691) -0.48%
MSS Supplies 50,788,303 4,164,444 3,516,827 (67,914) -1.60% 27,215,866 19,229,591 1,821,715 7.17% 5.00% -5.00%CDS Drugs 38,718,608 4,703,521 3,869,355 476,971 14.78% 18,273,888 16,299,238 (1,085,416) -5.61% 5.00% -5.00%
89,506,911 8,867,966 7,386,182 409,056 5.48% 45,489,755 35,528,829 736,299 1.65%
Total $36,355,429 9,466,371 $290,291 0.80% $127,466,546 42,225,980 $343,609 0.27%

GBR Compliance274 274 91 91
FY 2013 YTD thru March YTD thru March YTD thru March Remaining Estimated Projected Projected ProjectedApproved Pop Adjusted Approved Actual Actual Actual Revenue Volume Estimated Rate Year End Year End Year EndRevenue Volumes Rates Revenue Volume Rate To Charge To Charge Rates % Change Revenue Volumes Rates % Change
MSG Med/Surg $11,783,537 10,074 $1,169.6980 $17,187,790 14,500 $1,185.3648 $5,914,552 4,816 $1,228.1829 5.00% $23,102,342 19,316 $1,196.0400 2.25%PED Pediatrics 774,544 504 1,537.7093 447,304 275 1,626.5600 147,464 91 1,614.5948 5.00% 594,768 366 1,623.5769 5.58%OBS Obstetrics 4,495,695 5,037 892.5342 2,813,843 3,250 865.7977 1,011,552 1,079 937.1609 5.00% 3,825,395 4,329 883.5896 -1.00%DEF Definitive Care 8,152,132 5,037 1,618.4499 3,759,429 2,250 1,670.8571 1,269,878 747 1,699.3724 5.00% 5,029,306 2,997 1,677.9664 3.68%MIS Med Surg ICU 4,723,028 2,015 2,344.1673 2,865,313 1,250 2,292.2504 1,021,830 415 2,461.3757 5.00% 3,887,143 1,665 2,334.4159 -0.42%NEO NICU 1,576,984 1,007 1,565.4003 2,770,355 1,650 1,679.0030 900,719 548 1,643.6703 5.00% 3,671,074 2,198 1,670.1941 6.69%NUR Nursery 3,696,099 5,037 733.7898 1,791,646 2,500 716.6582 639,723 830 770.4793 5.00% 2,431,368 3,330 730.0766 -0.51%ADM Admissions 953,750 5,037 189.3488 1,097,506 5,875 186.8095 387,927 1,951 198.8162 5.00% 1,485,433 7,826 189.8030 0.24%EMG Emergency Room 20,023,840 402,960 49.6919 10,710,286 225,000 47.6013 3,898,955 74,726 52.1765 5.00% 14,609,241 299,726 48.7419 -1.91%OBV Observation 1,680,242 20,148 83.3950 2,686,903 32,500 82.6739 945,156 10,794 87.5648 5.00% 3,632,059 43,294 83.8933 0.60%CL Clinic 10,881,707 251,850 43.2071 6,254,746 150,000 41.6983 2,260,094 49,818 45.3675 5.00% 8,514,840 199,818 42.6131 -1.37%OR Operating Room 27,505,073 1,007,400 27.3030 15,143,743 550,000 27.5341 5,236,646 182,664 28.6682 5.00% 20,380,388 732,664 27.8168 1.88%LAB Laboratory 2,697,187 2,014,800 1.3387 5,543,112 4,281,566 1.2946 1,998,785 1,421,980 1.4056 5.00% 7,541,897 5,703,546 1.3223 -1.22%EKG EKG 367,124 100,740 3.6443 668,497 174,000 3.8419 221,128 57,788 3.8265 5.00% 889,625 231,788 3.8381 5.32%EEG EEG 1,381,559 100,740 13.7141 720,887 55,645 12.9551 266,118 18,481 14.3998 5.00% 987,005 74,126 13.3153 -2.91%RAD Radiology 6,476,089 201,480 32.1426 2,901,759 99,707 29.1029 1,117,601 33,114 33.7497 5.00% 4,019,360 132,821 30.2614 -5.85%RES Respiratory Therapy 1,978,460 1,007,400 1.9639 1,448,931 801,663 1.8074 549,024 266,246 2.0621 5.00% 1,997,955 1,067,909 1.8709 -4.74%PTH Physical Therapy 3,878,691 503,700 7.7004 2,729,540 295,000 9.2527 792,165 97,974 8.0854 5.00% 3,521,704 392,974 8.9617 16.38%RDL Renal Dialysis 80,434 101 798.4351 435,204 520 836.9302 144,785 173 838.3569 5.00% 579,989 693 837.2859 4.87%
Subtotal 113,106,175 5,645,067 81,976,791 6,697,151 28,724,102 2,224,236 110,700,894 8,921,387
MSS Supplies 50,788,303 27,215,866 19,229,591 1.4153 25,572,437 18,000,000 1.4207 52,788,303 37,229,591 1.4179 3.94%CDS Drugs 38,718,608 18,273,888 16,299,238 1.1211 19,444,719 17,000,000 1.1438 37,718,608 33,299,238 1.1327 -2.58%
Subtotal 89,506,911 45,489,755 35,528,829 45,017,156 35,000,000 90,506,911 70,528,829
Total $202,613,086 5,645,067 $127,466,546 42,225,980 $73,741,258 37,224,236 Based on estimated volume $201,207,804 79,450,216
$202,613,086 Perfect Compliance($1,405,282) Possible Over/(Under)charge
-0.69% % Projected Overcharge
Final Rate Order effective07/01/2014

• Penalties will be applied if rates exceed year-endcorridors
• If gross revenue charged exceeds approved revenue, the difference, along with any penalties assessed, are subtracted from the following year approved revenue
• If gross revenue charged is less than approved revenue, the difference minus any penalties will be added to the following year approved revenue
Penalties for Exceeding the Corridors

TPR/GBR Compliance Corridors• Overcharge Corridors:
– 0% to 0.50% No Penalty– 0.51% to 1% 20% Penalty– 1% and greater 50% Penalty
• Undercharge Corridors:– 0% to 0.50% No Penalty– 0.51 to 1% 40% Penalty– 1% to 2% 50% Penalty– 2% and greater 100% Penalty

Required Monthly ReportingName of Report Description Frequency Due Date
Volumes and RevenueInpatient and outpatient volumes and revenue by rate center. Expanded to report in-state vs. out-of-state and Medicare FFS vs. Non-Medicare FFS. Monthly
30 days afterend of month
Unaudited Financial Statements Income Statement and Balance Sheet Monthly30 days afterend of month
Price Variance Letter, Schedule SB, Schedule CSS
Letter to HSCRC with listing of rate centers that have rates charged outside of allowed corridors. Monthly supplemental birth (SB) schedule and supply & drug (CSS) compliance schedule. Monthly
30 days afterend of month
Inpatient Case Mix Data,Outpatient Case Mix Data
Patient specific data including demographics, diagnosis and procedure coding, and financial data. Monthly
15 days afterend of month
Reconciliation of Case Mix Data to Monthly Financial Data
Hospitals must reconcile monthly "tape" data to monthly financial data within 2% Monthly
50 days afterend of month

Required Quarterly ReportingName of Report Description Frequency Due Date
Bad Debt, Charity and DenialsPatient accounts identified with bad debt, charity and denials to guide future development of UCC models. Quarterly
30 days after end of quarter
AR1, AR2, AR3Income, expense and utilization of global pricing and capitation arrangements. Not applicable to all hospitals. Quarterly
30 days after end of quarter
Denied AdmissionsReport patients and related charges when 100% of bed charges are written off for medical necessity Quarterly
45 days after end of quarter
Inpatient HospiceListing of hospice patients with related charges and payments. Not applicable to all hospitals. Quarterly
45 days after end of quarter
Reconciliation of Case Mix Data to Monthly Financial Data
Hospitals must reconcile quarterly "tape" data to monthly financial data within 1% Quarterly
61 days after end of quarter
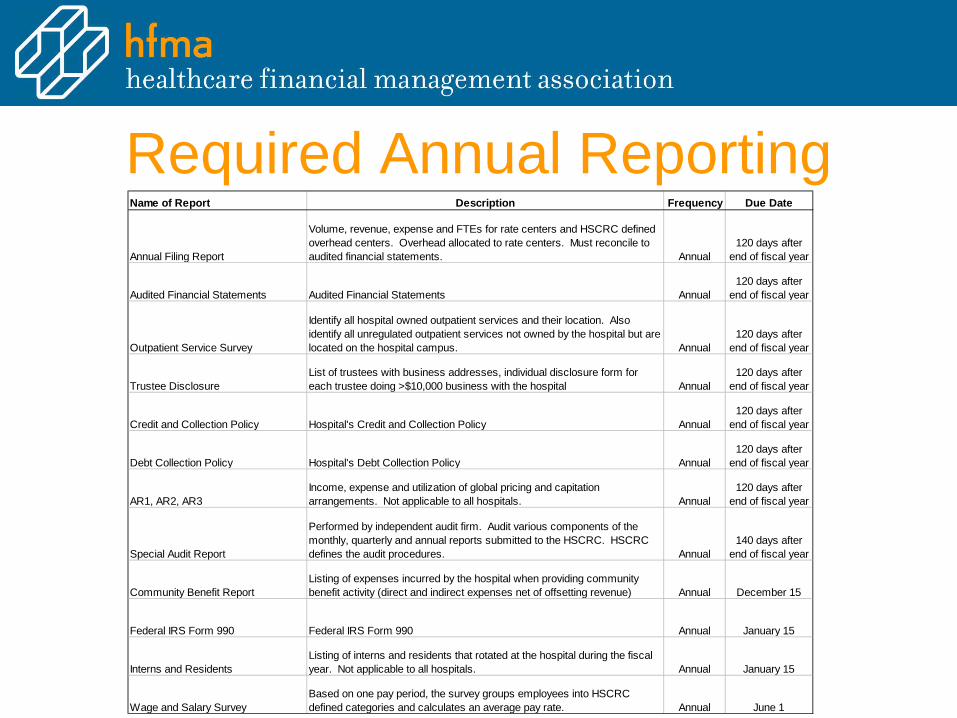
Required Annual ReportingName of Report Description Frequency Due Date
Annual Filing Report
Volume, revenue, expense and FTEs for rate centers and HSCRC defined overhead centers. Overhead allocated to rate centers. Must reconcile to audited financial statements. Annual
120 days afterend of fiscal year
Audited Financial Statements Audited Financial Statements Annual120 days after
end of fiscal year
Outpatient Service Survey
Identify all hospital owned outpatient services and their location. Also identify all unregulated outpatient services not owned by the hospital but are located on the hospital campus. Annual
120 days afterend of fiscal year
Trustee DisclosureList of trustees with business addresses, individual disclosure form for each trustee doing >$10,000 business with the hospital Annual
120 days afterend of fiscal year
Credit and Collection Policy Hospital's Credit and Collection Policy Annual120 days after
end of fiscal year
Debt Collection Policy Hospital's Debt Collection Policy Annual120 days after
end of fiscal year
AR1, AR2, AR3Income, expense and utilization of global pricing and capitation arrangements. Not applicable to all hospitals. Annual
120 days afterend of fiscal year
Special Audit Report
Performed by independent audit firm. Audit various components of the monthly, quarterly and annual reports submitted to the HSCRC. HSCRC defines the audit procedures. Annual
140 days afterend of fiscal year
Community Benefit ReportListing of expenses incurred by the hospital when providing community benefit activity (direct and indirect expenses net of offsetting revenue) Annual December 15
Federal IRS Form 990 Federal IRS Form 990 Annual January 15
Interns and ResidentsListing of interns and residents that rotated at the hospital during the fiscal year. Not applicable to all hospitals. Annual January 15
Wage and Salary SurveyBased on one pay period, the survey groups employees into HSCRC defined categories and calculates an average pay rate. Annual June 1

QUESTIONS??

Terminology & AcronymsAcronym What It Represents What It Means% Occ % of Occupancy Calculated by dividing total patient days by (# of beds x 365
days).
ACS Ambulatory Care Services Services rendered to persons who are not confined overnight in a healthcare institution. Often referred to as “O/P” (Outpatient) services.
ACO Accountable Care Organization Are groups of doctors, hospitals, and other health care providers, who come together voluntarily to give coordinated high quality care to the Medicare patients they serve.
ADC Average Daily Inpatient Census Average number of I/Ps (Inpatients) (based on the daily inpatient census) present each day of a given period of time.
ADM Admission Formal acceptance by an institution of a patient who is provided with room and board, continuous nursing service and other institutional services while lodged in the institution.
APG Ambulatory Payment Group Classification system used to group ambulatory cases.

Terminology & AcronymsAcronym What It Represents What It MeansALOS Average Length of Stay Average number of days of service rendered to each I/P
discharged during a given period.
AOB Average Occupied Beds Total Inpatient Days divided by 365.
APR-DRG All Payer Refined-Diagnosis Related Group
System used by 3M Health Information Systems as the basis of all-payer hospital payment system; used by many hospitals in the US to analyze comparative hospital performance.
ARR Admission Readmission Revenue Inpatient revenue measurement on a per episode basis.
ARMS Alternative Rate Setting Methods When a hospital is permitted to accept financial risk for the provision of services under certain conditions and circumstances.
CMI Case Mix Index Measure of complexity of patient population and/or treatment provided by an institution; tells how complex patients and services are.
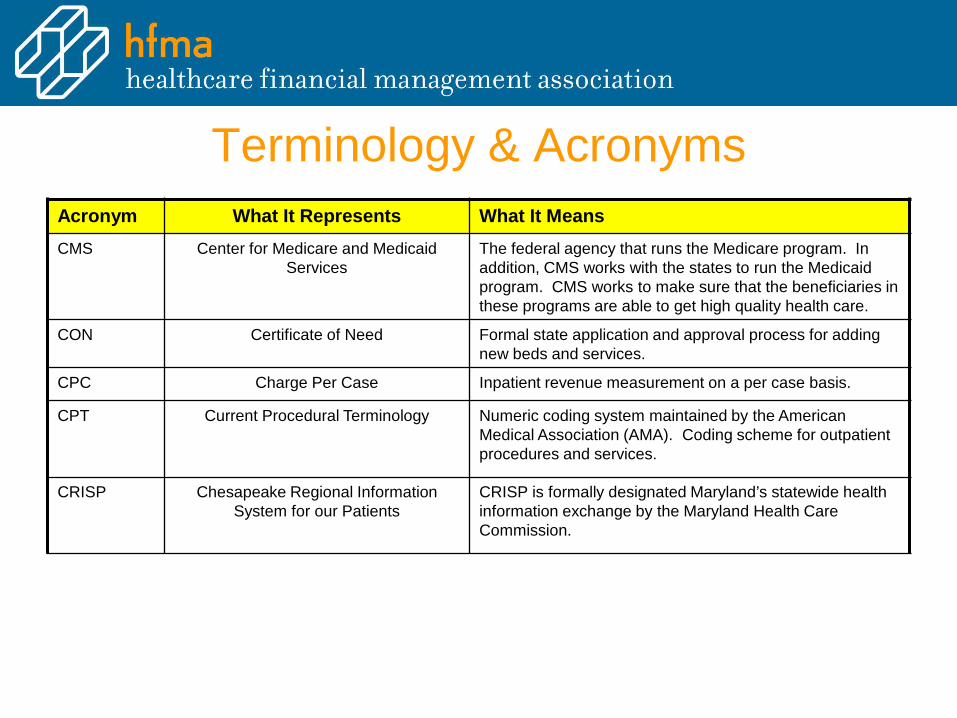
Terminology & AcronymsAcronym What It Represents What It MeansCMS Center for Medicare and Medicaid
ServicesThe federal agency that runs the Medicare program. In addition, CMS works with the states to run the Medicaid program. CMS works to make sure that the beneficiaries in these programs are able to get high quality health care.
CON Certificate of Need Formal state application and approval process for adding new beds and services.
CPC Charge Per Case Inpatient revenue measurement on a per case basis.
CPT Current Procedural Terminology Numeric coding system maintained by the American Medical Association (AMA). Coding scheme for outpatient procedures and services.
CRISP Chesapeake Regional Information System for our Patients
CRISP is formally designated Maryland’s statewide health information exchange by the Maryland Health Care Commission.
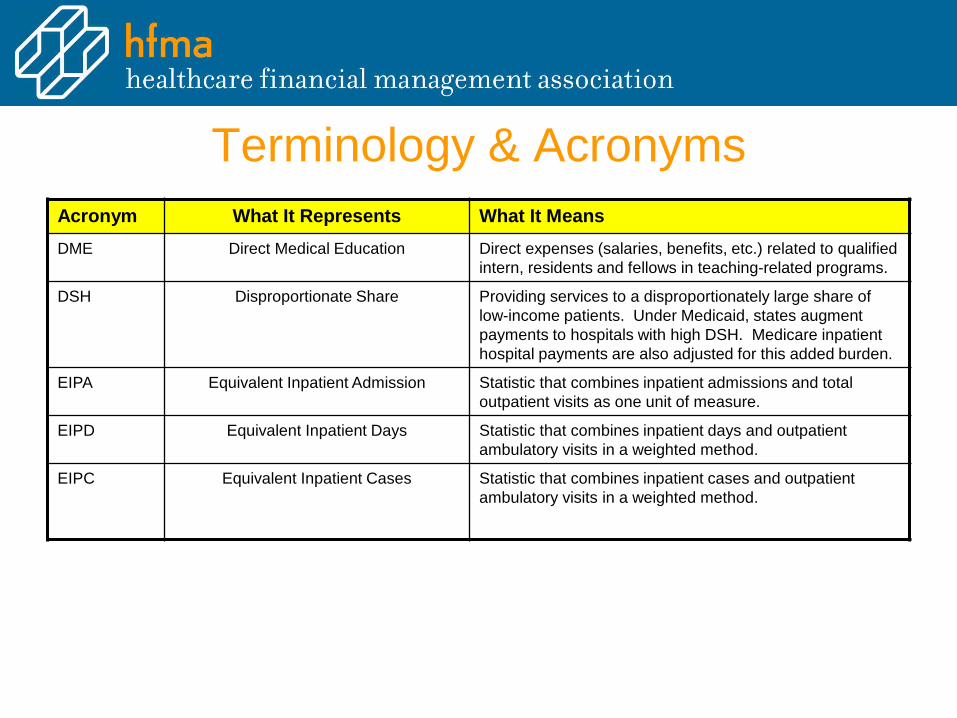
Terminology & AcronymsAcronym What It Represents What It MeansDME Direct Medical Education Direct expenses (salaries, benefits, etc.) related to qualified
intern, residents and fellows in teaching-related programs.
DSH Disproportionate Share Providing services to a disproportionately large share of low-income patients. Under Medicaid, states augment payments to hospitals with high DSH. Medicare inpatient hospital payments are also adjusted for this added burden.
EIPA Equivalent Inpatient Admission Statistic that combines inpatient admissions and total outpatient visits as one unit of measure.
EIPD Equivalent Inpatient Days Statistic that combines inpatient days and outpatient ambulatory visits in a weighted method.
EIPC Equivalent Inpatient Cases Statistic that combines inpatient cases and outpatient ambulatory visits in a weighted method.

Terminology & AcronymsTotal Inpatient Revenue $ 63,304.8 A
Total Inpatient Admissions 6,637 B
Inpatient Unit Revenue 9.54 C = A / B
Total Outpatient Revenue $ 29,845.7 D
Total Outpatient Visits 47,274 E
Outpatient Unit Revenue 0.63 F = D / E
Inpatient / Outpatient Unit Ratio 15.11 G = C / F
Total Inpatient Admissions 6,637 H
Outpatient Visits 3,129 I
EIPAs 9,766 J = H + I
Calculation of EIPAs:
Terminology & Acronyms
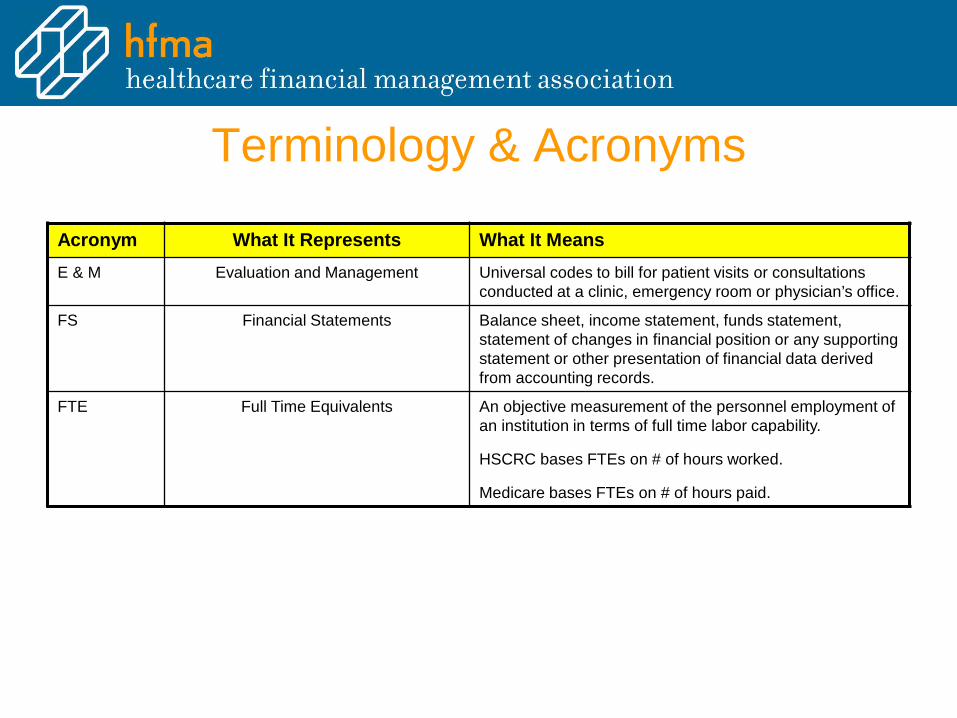
Acronym What It Represents What It MeansE & M Evaluation and Management Universal codes to bill for patient visits or consultations
conducted at a clinic, emergency room or physician’s office.
FS Financial Statements Balance sheet, income statement, funds statement, statement of changes in financial position or any supporting statement or other presentation of financial data derived from accounting records.
FTE Full Time Equivalents An objective measurement of the personnel employment of an institution in terms of full time labor capability.
HSCRC bases FTEs on # of hours worked.
Medicare bases FTEs on # of hours paid.

Terminology & AcronymsAcronym What It Represents What It MeansGBR Global Budget Revenue An agreement that is an extension of TPR methodology,
which encourages hospitals to focus on population-based health management by prospectively establishing a fixed annual revenue cap for each GBR hospital.
GL General Ledger A ledger containing accounts in which all the transactions of a business enterprise or accounting unit are classified either in detail or in summary form.
GME Graduate Medical Education Generally defined as the clinical training following graduation from medical school. This clinical training, which ranges from three to seven years in length (internship and/or residency), has traditionally taken place in teaching hospitals or academic medical centers (AMCs). This is funded in Maryland’s rate-setting system and is the cost of graduate medical education (GME) generally for interns and residents trained in Maryland hospitals.
HCPCS Healthcare Common Procedure Coding System
Alpha numeric billing codes used to identify and bill for items and services not included in the CPT Codes.
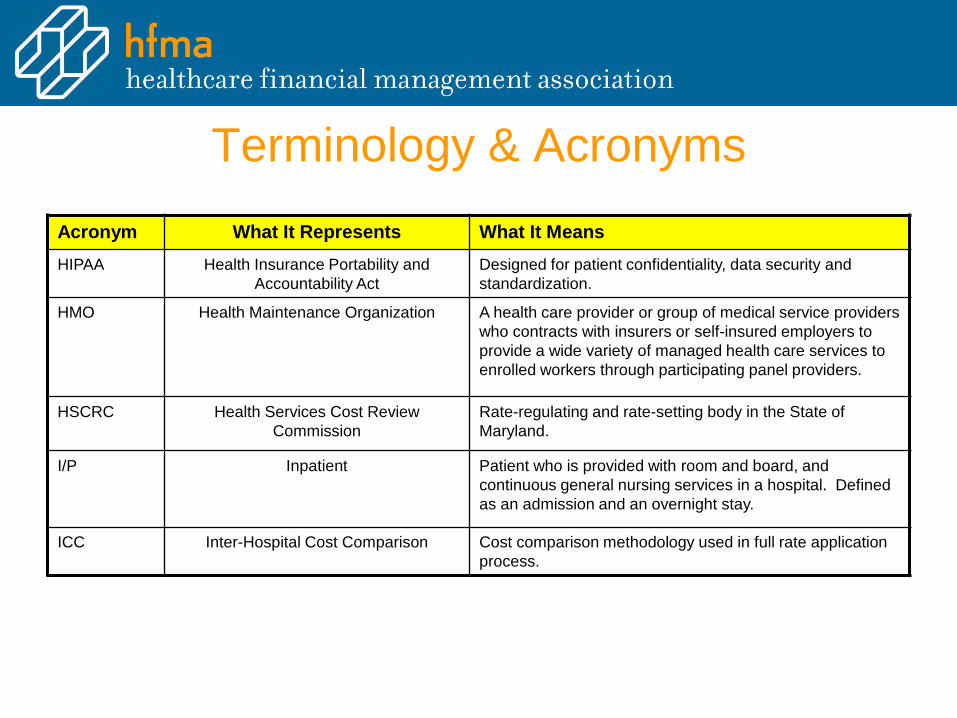
Terminology & AcronymsAcronym What It Represents What It MeansHIPAA Health Insurance Portability and
Accountability ActDesigned for patient confidentiality, data security and standardization.
HMO Health Maintenance Organization A health care provider or group of medical service providers who contracts with insurers or self-insured employers to provide a wide variety of managed health care services to enrolled workers through participating panel providers.
HSCRC Health Services Cost Review Commission
Rate-regulating and rate-setting body in the State of Maryland.
I/P Inpatient Patient who is provided with room and board, and continuous general nursing services in a hospital. Defined as an admission and an overnight stay.
ICC Inter-Hospital Cost Comparison Cost comparison methodology used in full rate application process.

Terminology & AcronymsAcronym What It Represents What It MeansICD-9 International Classification of Diseases
– 9th Revision Clinically ModifiedClassification of codes that represent diagnoses, conditions and symptoms.
ICD-10 International Classification of Diseases – 10th Revision Clinically Modified
Classification of codes that represent diagnoses, conditions and symptoms. October 2015
IME Indirect Medical Education Indirect Medical Education expenses are generally described as those additional costs incurred as a result of the teaching process (e.g., extra tests ordered by interns / residents or the extra costs of supervision).
MCO Managed Care Organization A type of Medicare managed care plan where a group of doctors, hospitals and other health care providers agree to give health care to Medicare beneficiaries for a set amount of money from Medicare every month. You usually must get your care from the providers in the plan.
MHA Maryland Hospital Association State organization of Maryland hospitals.

Terminology & AcronymsAcronym What It Represents What It MeansMHAC Maryland Hospital Acquired Conditions Subset of PPC. Considered as “never events”.
MHCC Maryland Health Care Commission An independent regulatory agency whose mission is to plan for health system needs, promote informed decision-making, increase accountability and improve access in a rapidly changing health care environment by providing timely and accurate information on availability, cost and quality of services to policy makers, purchasers, providers and the public.
MHIP Maryland Health Insurance Plan State-managed health insurance program for Maryland residents who are unable to obtain health insurance from other sources. Each hospital is assessed at 1% of its net patient revenue to operate the program.
NOR Net Operating Revenue Operating gross revenue less any contractual or other revenue deductions.

Terminology & AcronymsAcronym What It Represents What It MeansNSP Nursing Support Program Nursing Support Program developed to help address the
nursing workforce shortage. Each rate-regulated hospital is eligible for a percentage of rate increase to help pay for programs to recruit and / or retain nurses (NSPI and NSPII).
O/P Outpatient Patient involved in an emergency visit, diagnostic test or clinic visit procedure or service and is not admitted to the hospital.
Permanent Revenue
Total Allowed Revenue Permanent revenue represents revenue that a hospital is entitled to on a permanent and ongoing basis. The opposite of permanent revenue is one-time revenue which is only approved for a one year period.
ODS Zero and One-Day Length of Stay Patients admitted and discharged by a hospital with a length of stay less than or equal to one.
P4P Pay for Performance Initiative which gives incentive to provider to improve quality of care.

Terminology & AcronymsAcronym What It Represents What It MeansPAU Potentially Avoidable Utilization Hospital care that is unplanned and can be prevented
through improved care coordination, effective primary care and improved population health (Readmissions, Revisits, PQIs and PPCs).
PIP Periodic Interim Payment When a hospital receives cash payments from third-party payers (Usually Medicare) in constant amounts each period. The total of these payments received over a year is an estimated cost of providing services to patients covered by the plan.
PLF Price Leveling Factor Factor used to inflate and / or adjust charges from a historical / current period to a current / future period.
PPC Potentially Preventable Complications 64 Complications that are highly preventable as defined by 3M.
PPR Potentially Preventable Readmissions Readmission scenarios deemed preventable.
PQI Prevention Quality Indicator Defined by the Agency for Healthcare Research and Quality (AHRQ) as a set of measures that can be used with hospital inpatient discharge data to identify conditions for which good outpatient care can potentially prevent the need for hospitalization.

Terminology & AcronymsAcronym What It Represents What It MeansRA Readmission An admission within 30 days of a discharge
RAC Recovery Audit Contractor Approved CMS contractors who have been commissioned to review the Medicare claims of acute care facilities to deem if services were necessary or appropriate.
ROC Reasonableness of Charges (Suspended)
HSCRC’s Reasonableness of Charges Report. This report is the Commission’s tool for assessing the reasonableness of each hospital’s charges on a per case basis relative to their peer group.
RVU Relative Value Unit Index number assigned to various procedures based upon the relative amount of labor, supplies and capital needed to perform the procedure. Predominantly for ancillary activities and clinic visits (by time and complexity).
TPR Total Patient Revenue An agreement which establishes a revenue cap for qualifying hospitals. A qualifying hospital is typically located in a rural area and has a well-defined catchment area with a stable population.

Terminology & Acronyms
Acronym What It Represents What It MeansUB-04 Uniformed Billing 2004 Standard form used for the billing of facility-based /
inpatient services, effective July 2007.
UCC Uncompensated Care Care provided for which compensation is not received (bad debts and charity care).
W&S Wage & Salary Report Job-specific pay information for hospitals. This is used in the calculation of the Labor Market Adjustment for HSCRC ROC and Full Rate Settings.
VCF Variable Cost Factor A method to constrain volume growth (i.e. 50% variable cost factor means 50% of volume increase taken out of rates).
QBR Quality Based Reimbursement New HSCRC reimbursement methodology which adjusts reimbursement for identified quality measurements.

Michael BrozicDirector of Finance, Bon Secours Baltimore
Health [email protected]
Nina LieuSenior Associate, KPMG LLP