HSC ECONOMICS 2006 TOPIC: ECONOMIC ISSUES DISTRIBUTION OF INCOME & WEALTH.
77
TOPIC: ECONOMIC ISSUES TOPIC: ECONOMIC ISSUES DISTRIBUTION OF INCOME DISTRIBUTION OF INCOME & WEALTH & WEALTH
-
Upload
mark-wiggins -
Category
Documents
-
view
224 -
download
1
Transcript of HSC ECONOMICS 2006 TOPIC: ECONOMIC ISSUES DISTRIBUTION OF INCOME & WEALTH.

HSC ECONOMICS 2006 HSC ECONOMICS 2006 TOPIC: ECONOMIC TOPIC: ECONOMIC ISSUESISSUES
DISTRIBUTION OF DISTRIBUTION OF INCOME & WEALTHINCOME & WEALTH

IntroductionIntroduction
Despite sustained economic Despite sustained economic growth, lower unemployment growth, lower unemployment and higher productivity and and higher productivity and structural change Australia has structural change Australia has become a more divided society become a more divided society i.e. the degree of inequality in i.e. the degree of inequality in income and wealth is growing. income and wealth is growing. This is compared to OECD This is compared to OECD countries.countries.

IntroductionIntroduction
The creation of a more efficient and The creation of a more efficient and international competitive economy international competitive economy have been major factors have been major factors contributing to increased contributing to increased inequality. inequality.
The tax system becoming more The tax system becoming more regressive, welfare payments, regressive, welfare payments, deregulated labour markets and deregulated labour markets and reductions in Government services reductions in Government services all contribute to the increase in the all contribute to the increase in the degree of inequality.degree of inequality.

This topic will cover:This topic will cover:
Measuring Wealth & Income DistributionMeasuring Wealth & Income Distribution Sources of Income as a % of household incomeSources of Income as a % of household income Sources of WealthSources of Wealth Dimensions & Trends, according to trends, age, Dimensions & Trends, according to trends, age,
occupation, ethnic background and family occupation, ethnic background and family structure.structure.
Economic and Social Costs & Benefits of Economic and Social Costs & Benefits of Income DistributionIncome Distribution
Government policies and their impact on Government policies and their impact on
income and wealth distributionincome and wealth distribution

Measuring Income & Measuring Income & WealthWealth Measuring wealth and income is Measuring wealth and income is
complex. Firstly income is acomplex. Firstly income is a Flow concept measured in money Flow concept measured in money
terms, indicating a return to individuals terms, indicating a return to individuals or households for sale of factors of or households for sale of factors of production over time. production over time.
Research focuses on disposable income Research focuses on disposable income rather than final income because of the rather than final income because of the difficulty in calculating the social wage difficulty in calculating the social wage expenditures, such as schools and expenditures, such as schools and hospitals. Households are a single hospitals. Households are a single income unit.income unit.

Types of Income
Market (Private) income i.e. from employment & investments
Plus cash transfers, e.g. dole & pensions
Gross Income Minus income tax
Disposable Income
Plus social wage Less indirect taxes
Final Income

Income Inequality Income Inequality
Income Inequality refers to Income Inequality refers to the degree to which income is the degree to which income is unevenly distributed among unevenly distributed among income earners.income earners.
It is measured by the LORENZ It is measured by the LORENZ CURVE (graphical) and GINI CURVE (graphical) and GINI CO-EFFICIENT (mathematical).CO-EFFICIENT (mathematical).

The Lorenz CurveThe Lorenz Curve
The Lorenz curve measures the The Lorenz curve measures the degree of income inequality compared degree of income inequality compared to the line of absolute inequality. The to the line of absolute inequality. The more concave the curve the more more concave the curve the more income distribution becomes unequal.income distribution becomes unequal.
When reading the curve the axis When reading the curve the axis shows cumulative percentages for shows cumulative percentages for income recipients (horizontal axis), income recipients (horizontal axis), expressed in deciles or quintiles and expressed in deciles or quintiles and for real incomefor real income (vertical axis). (vertical axis).

Lorenz Curves for Lorenz Curves for Income and WealthIncome and Wealth
Income UnitsIncome Units Income Income Wealth Wealth CumulativeCumulative Cumulative Cumulative Cumulative Cumulative
PercentagePercentagePercentagePercentagePercentagePercentagePercentagePercentagePercentagePercentagePercentagePercentage
a Lowest 20 20 4 4 0 0
b Second 20 40 9 13 3 3
c Third 20 60 15 28 10 13
d Fourth 20 80 24 52 22 35
e Highest 20 100 48 100 65 100

Income and Wealth in Income and Wealth in Australia 1999-2000Australia 1999-2000
0
10
2030
40
50
60
7080
90
100
0 20 40 60 80 100
CUMMULATIVE % OF INCOME UNITS
CU
MM
ULA
TIV
E %
OF
INC
OM
E
Line ofequality

Interpreting the Interpreting the Lorenz CurveLorenz Curve If income were distributed evenly across If income were distributed evenly across
the whole population, the Lorenz curve the whole population, the Lorenz curve would be the diagonal line through the would be the diagonal line through the origin of the graph.origin of the graph.
The Gini coefficient is defined as the The Gini coefficient is defined as the ratio of the area between the actual ratio of the area between the actual Lorenz curve and the diagonal (or line of Lorenz curve and the diagonal (or line of equality) and the total area under the equality) and the total area under the diagonal.diagonal.
The Gini coefficient ranges between The Gini coefficient ranges between zero when all incomes are equal and one zero when all incomes are equal and one when one unit receives all the income, when one unit receives all the income, that is, the smaller the Gini income.that is, the smaller the Gini income.

Income and Wealth in Income and Wealth in Australia 1999-2000Australia 1999-2000
0
10
2030
40
50
60
7080
90
100
0 20 40 60 80 100
CUMMULATIVE % OF INCOME UNITS
CU
MM
ULA
TIV
E %
OF
INC
OM
E
Income
Line ofequality

Income and Wealth in Income and Wealth in Australia 1999-2000Australia 1999-2000
0
10
2030
40
50
60
7080
90
100
0 20 40 60 80 100
CUMMULATIVE % OF INCOME UNITS
CU
MM
ULA
TIV
E %
OF
INC
OM
E
Income
Wealth
Line ofequality


Interpreting the graphInterpreting the graph
Normally the degree of inequality is Normally the degree of inequality is greater for the whole population than for greater for the whole population than for a subgroup within the population a subgroup within the population because subpopulations are usually because subpopulations are usually more homogeneous than full more homogeneous than full populations. homogeneous than full populations. homogeneous than full populations. populations.
This is illustrated in the graph below, This is illustrated in the graph below, which shows two Lorenz curves from the which shows two Lorenz curves from the 2003–04 Survey of Income and Housing. 2003–04 Survey of Income and Housing.

Interpreting the Interpreting the Lorenz CurveLorenz Curve The Lorenz curve for the whole The Lorenz curve for the whole
population of the survey is further from population of the survey is further from the diagonal than the curve for persons the diagonal than the curve for persons living in one parent, one family living in one parent, one family households, with at least one households, with at least one dependent child.dependent child.
Correspondingly, the calculated Gini Correspondingly, the calculated Gini coefficient for all persons was 0.294 coefficient for all persons was 0.294 while the coefficient for the persons in while the coefficient for the persons in the one parent households included the one parent households included here was 0.247.coefficient the more here was 0.247.coefficient the more even the distribution of incomeeven the distribution of income

Interpreting the Data Interpreting the Data
Refer to diagrams and tables 0n page 198 Refer to diagrams and tables 0n page 198 & 199 (Dixon) and answer the questions & 199 (Dixon) and answer the questions below:below:
Comment on the individual and overall Comment on the individual and overall trends in income distribution from 1995-trends in income distribution from 1995-2004 based on the information provided in 2004 based on the information provided in Figure 11.1Figure 11.1
________________________________________________________________________________________________________________________________________________________________________________________________________________________________________________________________________________________________________________________________________________________________________________________________________________________________________________________________________________________________________________________________________________________________________________________________________________________________________________________________________________________________________________________________________________________________________________________________________________________________

Interpreting the data Interpreting the data (cont.)(cont.) Based on the information provided in Based on the information provided in
Figure 11.2 approximately comment Figure 11.2 approximately comment on the following:on the following:
a. Australia has equality of income a. Australia has equality of income distribution. Justify you response.distribution. Justify you response.
________________________________________________________________________________________________________________________________________________________________________________________________________________________________________________________________________________________________________________________________________________________________________________________________________________________________________________________________________________________________________________________________________________________________________________

Interpreting the data Interpreting the data (continued)(continued) What implications exist for What implications exist for
income inequality if the Lorenz income inequality if the Lorenz curve moved closer to the line of curve moved closer to the line of equality?equality?
________________________________________________________________________________________________________________________________________________________________________________________________________________________________________________________________________________________________________________________________________________________________________________________________________________________________________________________________________________________________________________________________________________________________

The GINI-COEFFICIENTThe GINI-COEFFICIENT
The Gini co-efficient is a way of The Gini co-efficient is a way of calculating income inequality for the calculating income inequality for the Lorenz curve. It’s the ratio between the Lorenz curve. It’s the ratio between the line of absolute inequality and the line of absolute inequality and the Lorenz Curve as indicated by A and the Lorenz Curve as indicated by A and the total area below the line of absolute total area below the line of absolute equality as indicated by A+B. The larger equality as indicated by A+B. The larger the co-efficient the greater the income the co-efficient the greater the income inequality, the co-efficient range is inequality, the co-efficient range is between zero (0) for absolute equality between zero (0) for absolute equality and one (1) for absolute inequality.and one (1) for absolute inequality.
Therefore the smaller the co-efficient, Therefore the smaller the co-efficient, the less income equality i.e. more even the less income equality i.e. more even distribution of income.distribution of income.

GINI CO-EFFICIENTGINI CO-EFFICIENT
The Gini co-efficient hovers The Gini co-efficient hovers around 0.3 for Australia around 0.3 for Australia from 2000 it has was 0.311 from 2000 it has was 0.311 and in 2004 it was 0.294.and in 2004 it was 0.294.
GINI CO-EFFICIENT (G) = _GINI CO-EFFICIENT (G) = _AA___ ___
A + BA + B

The Gini Co-efficientThe Gini Co-efficient
A
B
%ofINCOME
% of HOUSEHOLDS0
100
100

GINI COEFFICIENTGINI COEFFICIENT
The Gini coefficient is a single statistic which summarises The Gini coefficient is a single statistic which summarises the distribution of income across the population. the distribution of income across the population. The Gini coefficient can best be described by reference The Gini coefficient can best be described by reference to the Lorenz curve. to the Lorenz curve.
The Lorenz curve is a graph with horizontal axis showing The Lorenz curve is a graph with horizontal axis showing the cumulative proportion of the persons in the the cumulative proportion of the persons in the population ranked according to household income and population ranked according to household income and with the vertical axis showing the corresponding with the vertical axis showing the corresponding cumulative proportion of equivalised disposable cumulative proportion of equivalised disposable household income. household income.
cumulative proportion of equivalised disposable cumulative proportion of equivalised disposable household income. The graph then shows the income household income. The graph then shows the income share of any selected cumulative proportion of the share of any selected cumulative proportion of the population, as can be seen below.population, as can be seen below.

MEASURING THE MEASURING THE DISTRIBUTION OF WEALTH DISTRIBUTION OF WEALTH IN AUSTRALIAIN AUSTRALIA
Measuring wealth is more Measuring wealth is more complex and relies on complex and relies on surveys. NATSEM attempts surveys. NATSEM attempts to do this. to do this.

Interpreting dataInterpreting data
Refer to p.200 and answer the following Refer to p.200 and answer the following questions.questions.
Comment on the degree of wealth inequality in Comment on the degree of wealth inequality in Australia; use an example to illustrate your Australia; use an example to illustrate your response.response.
____________________________________________________________________________________________________________________________________________________________________________________________________________________________________________________________________________________________________________________________________________________________________________________________________________________________________________________________________________________________________________________________________________________________________________________________________________________________________________________________________________________________________________________________________________________________________________________

Interpreting the dataInterpreting the data
Comment on whether wealth distribution has Comment on whether wealth distribution has improved or deteriorated over the past 80 improved or deteriorated over the past 80 years.years.
________________________________________________________________________________________________________________________________________________________________________________________________________________________________________________________________________________________________________________________________________________________________________________________________________________________________________________________________________________________________________________________________________________________________________________________________________________________________________________________________________________________________________________________________________________________________________________________________________________________________________________________________________________________________________________________________________________________________________________________________________________________________________________________________________________________________

DISTINGUISHING DISTINGUISHING BETWEEN INCOME AND BETWEEN INCOME AND WEALTHWEALTH

DISTINGUISHING DISTINGUISHING BETWEEN INCOME AND BETWEEN INCOME AND WEALTHWEALTH Personal IncomePersonal Income is the flow of is the flow of
funds received by individuals funds received by individuals or households mainly from or households mainly from the sale of factors of the sale of factors of productionproduction
Personal WealthPersonal Wealth refers to the refers to the value of assets of a person or value of assets of a person or household, stock of assets household, stock of assets e.g. shares, bonds, bank e.g. shares, bonds, bank deposits and property.deposits and property.

FOCUS QUESTIONSFOCUS QUESTIONS
DistinguishDistinguish between wealth and between wealth and income.income.
________________________________________________________________________________________________________________________________________________________________________________________________________________________________________________________________________________________________________________________________________________________________________________________________________________________________________________________________________________________________________________________

FOCUS QUESTIONSFOCUS QUESTIONS
Explain how the following can be used to measure Explain how the following can be used to measure the degree of inequality in the distribution of the degree of inequality in the distribution of income:income:
The Lorenz Curve (explain using diagram)The Lorenz Curve (explain using diagram)
______________________________________________________________________________________________________________________________________________________________________________________________________________________________________________________________________________________________________________________________________________________________________________________________________________________________________________________________________________________________________________________________________________________________________________________________________________________________________________________________________________________________________________________________________________________________________________________________________________________________________________________________________________________________________________________________________________________________________________________________________________________________________________________________________________________________________________________________________________________________________________________________________________

FOCUS QUESTIONSFOCUS QUESTIONS
The Gini coefficient ( explain The Gini coefficient ( explain using numerical examples)using numerical examples)
________________________________________________________________________________________________________________________________________________________________________________________________________________________________________________________________________________________________________________________________________________________________________________________________________________________________________________________________________________________________________________________________________________________________________________________________________________________________________________________________________________________________________________________________________________________________________________________________________________________________________________________________________________________________________________________________________________________________________________________________________________________________________________________________________________________________

FOCUS QUESTIONSFOCUS QUESTIONS
Explain the relationship between Explain the relationship between income inequality and wealth income inequality and wealth inequality.inequality.
________________________________________________________________________________________________________________________________________________________________________________________________________________________________________________________________________________________________________________________________________________________________________________________________________________________________________________________________________________________________________________________________________________________________________________________________________________________________________________________________________________________________________________________________________________________________________________________________

SOURCES OF INCOME- SOURCES OF INCOME- p.200-201 Dixonp.200-201 Dixon
Wages from the sale of labourWages from the sale of labour Rent from landRent from land Interest (from sale of capital) Interest (from sale of capital)
CapitalCapital Profits from sale of Profits from sale of
entrepreneurial skillsentrepreneurial skills social welfaresocial welfare

The ABS divides income The ABS divides income flow into two categories flow into two categories based on GDP:based on GDP: compensation to employees in compensation to employees in
the form of wages, salaries the form of wages, salaries and other benefitsand other benefits
Gross operating surplus- Gross operating surplus- value of profits, rents and value of profits, rents and interest earned by interest earned by organisations and individuals organisations and individuals or PROPERTY INCOMEor PROPERTY INCOME

Additional IncomeAdditional Income
Transfer payments are received by Transfer payments are received by about 1/3 of households but are not about 1/3 of households but are not included in GDP as it is not earned but included in GDP as it is not earned but simply a transfer of income from one simply a transfer of income from one group to another.group to another.
For most households wages & salaries For most households wages & salaries form the main income with transfer form the main income with transfer payments coming in as second. payments coming in as second.
Even though we have one of the highest Even though we have one of the highest share ownership rates in the world share ownership rates in the world income from these sources is less than income from these sources is less than 10%.10%.

Copy pie chart on page Copy pie chart on page 201 Fig. 11.4 into you 201 Fig. 11.4 into you notesnotes

SOURCES OF WEALTH SOURCES OF WEALTH IN AUSTRALIAIN AUSTRALIA

SOURCES OF WEALTH IN SOURCES OF WEALTH IN AUSTRALIA pp.201-AUSTRALIA pp.201-202(Dixon)202(Dixon)
Value of assets owned less value of Value of assets owned less value of liabilities owed. liabilities owed.
The composition of wealth includes:The composition of wealth includes:– dwelling capitaldwelling capital– business capitalbusiness capital– consumer durablesconsumer durables– government securitiesgovernment securities– money basemoney base– Australian investments abroadAustralian investments abroad

Focus QuestionsFocus Questions
Examine Figure 11.5 p.202 and answer Examine Figure 11.5 p.202 and answer the following questionsthe following questions
Which two components make up the Which two components make up the largest percentage of wealth in largest percentage of wealth in Australia? Justify your response.Australia? Justify your response.
________________________________________________________________________________________________________________________________________________________________________________________________________________________________________________________________________________________________________________________________________________________________________________________________________________________________________________

Distribution of wealthDistribution of wealth
In 2005 according to Federal Treasury the In 2005 according to Federal Treasury the value of private sector wealth has value of private sector wealth has increased by 9.9%, this is despite a slowing increased by 9.9%, this is despite a slowing economy.economy.
This is still greater than a 7% average over This is still greater than a 7% average over the last two decades. Net private sector the last two decades. Net private sector wealth is $6,217 billion – equivalent to wealth is $6,217 billion – equivalent to $305,000 per Australian. $305,000 per Australian.
The strong performance of the The strong performance of the sharemarket has been the greatest sharemarket has been the greatest contributing factor. Despite this the largest contributing factor. Despite this the largest source of wealth (58%) is represented in source of wealth (58%) is represented in the family home.the family home.

How does a nation How does a nation Accumulate Wealth?Accumulate Wealth?
Increases in the quantity and quality of Increases in the quantity and quality of the factors of productionthe factors of production
Increases in the production of capitalIncreases in the production of capital Higher levels of economic growth are Higher levels of economic growth are
associated with higher levels of associated with higher levels of investmentinvestment
Willingness to tap into export markets – Willingness to tap into export markets – that is to gain a % of wealth in foreign that is to gain a % of wealth in foreign nationsnations
Foreign entrepreneurs by providing Foreign entrepreneurs by providing scarce savings and technologyscarce savings and technology
Monetary measures e.g. inflationMonetary measures e.g. inflation

How do individuals How do individuals accumulate wealth?accumulate wealth?
surplus income i.e. savingssurplus income i.e. savings existing wealthexisting wealth inheritanceinheritance personal qualities- inventiveness, personal qualities- inventiveness,
innovation, entrepreneurial skillsinnovation, entrepreneurial skills luckluck in inflationary periods the choice in inflationary periods the choice
of assets e.g. real estateof assets e.g. real estate

TRENDS IN THE TRENDS IN THE DISTRIBUTION OF INCOME DISTRIBUTION OF INCOME AND WEALTH pp.202-208AND WEALTH pp.202-208 The extent of inequality has fallen The extent of inequality has fallen
in recent years it is still high when in recent years it is still high when compared to other industrialised compared to other industrialised nationsnations
Refer to Fig. 11.6 p.203Refer to Fig. 11.6 p.203 almost 60% of people earn less almost 60% of people earn less
than the mean incomethan the mean income a relatively small % of households a relatively small % of households
have high income while a large have high income while a large number have relatively low number have relatively low incomesincomes

TRENDS IN THE TRENDS IN THE DISTRIBUTION OF INCOME DISTRIBUTION OF INCOME AND WEALTH AND WEALTH pp.202-208 Dixonpp.202-208 Dixon Some groups are more affected than Some groups are more affected than
others by inequality of income. This others by inequality of income. This depends on depends on
ageage gendergender occupationoccupation cultural backgroundcultural background family type family type geographygeography

TRENDS IN THE TRENDS IN THE DISTRIBUTION OF INCOME DISTRIBUTION OF INCOME AND WEALTHAND WEALTH Prepare summaries using the Prepare summaries using the
above categories:above categories: age___________________________________age___________________________________
________________________________________________________________________________________________________________________________________________________________________________________________________________________________
gender_______________________________gender___________________________________________________________________________________________________________________________________________________________________________________________________________________________________________________________________

TRENDS IN THE TRENDS IN THE DISTRIBUTION OF INCOME DISTRIBUTION OF INCOME AND WEALTHAND WEALTH occupationoccupation
______________________________________________________________________________________________________________________________________________________________________________________________________________________________________________________________________________________________________________________________________________________________________________________________________________________________________________________________________________________________________________________________________________________________________________________________

TRENDS IN THE TRENDS IN THE DISTRIBUTION OF INCOME DISTRIBUTION OF INCOME AND WEALTHAND WEALTH cultural backgroundcultural background
____________________________________________________________________________________________________________________________________________________________________________________________________________________________________________________________________________________________________________________________________________________________________________________________________________________________________________________________________________________________________________________________________________________________________________________________________________________________________

TRENDS IN THE TRENDS IN THE DISTRIBUTION OF INCOME DISTRIBUTION OF INCOME AND WEALTHAND WEALTH family type family type ________________________________________________________________________________________________________
______________________________________________________________________________________________________________________________________________________________________________________________________________________________________________________________________________________________________________________________________________________________________________________________________________________________________________________________________________________
geographygeography ________________________________________________________________________________________________________
________________________________________________________________________________________________________________________________________________________________________________________________________________________________________________________________________________________

FOCUS QUESTIONSFOCUS QUESTIONS
OutlineOutline how age and gender can influence how age and gender can influence the distribution of income.the distribution of income.
________________________________________________________________________________________________________________________________________________________________________________________________________________________________________________________________________________________________________________________________________________________________________________________________________________________________________________________________________________________________________________________________________________________________________________________________________________________________________________________________________________________________

FOCUS QUESTIONSFOCUS QUESTIONS
Discuss the general trends in the distribution Discuss the general trends in the distribution of income and wealth in Australia in recent of income and wealth in Australia in recent year.year.
________________________________________________________________________________________________________________________________________________________________________________________________________________________________________________________________________________________________________________________________________________________________________________________________________________________________________________________________________________________________________________________________________________________________________________________________________________________________________________________________________________________________________________________________________________________________________________________________________________________________________________________________________________________________________________________________________________________________________________________________________________________________________________________________________________________________________________________________________________________________________________________________

THE COSTS AND BENEFITS OF INEQUALITYpp.208-211The cost and benefits of inequality are divided into economic and social
BENEFITSEconomic
Social

COSTS OF IINEQUALITYCOSTS OF IINEQUALITY
EconomicEconomic
SocialSocial

FOCUS QUESTIONSFOCUS QUESTIONS
Outline the economic costs and benefits Outline the economic costs and benefits associated with income inequalityassociated with income inequality..
________________________________________________________________________________________________________________________________________________________________________________________________________________________________________________________________________________________________________________________________________________________________________________________________________________________________________________________________________________________________________________________________________________________________________________________________________________________________________________________________________________________________________________________________________________________________________________________________________________________________________________________________________________________________________________________________________________________________________________________________________________________________________________________________________________________________________________________________________________________________________________________________________________________________________________________________________________________________________________________________________________________________________

FOCUS QUESTIONSFOCUS QUESTIONS
Outline the social costs and benefits associated Outline the social costs and benefits associated with income inequalitywith income inequality..
________________________________________________________________________________________________________________________________________________________________________________________________________________________________________________________________________________________________________________________________________________________________________________________________________________________________________________________________________________________________________________________________________________________________________________________________________________________________________________________________________________________________________________________________________________________________________________________________________________________________________________________________________________________________________________________________________________________________________________________________________________________________________________________________________________________________________________________________________________________________________________________________________________________________________________________________________________________________________________________________________________________________________________________________________________________________________________________________________________________________________________________________________________________________________________________________________________________________________________________________________________________________________________________________________________________________________________________________________________________________________________________________________5454

What Effect have What Effect have Government Policies Government Policies Had on Income and Had on Income and Wealth Distribution Wealth Distribution in Australia?in Australia?

GOVERNMENT POLICIES GOVERNMENT POLICIES & INEQUALITY& INEQUALITY
The overall objective of The overall objective of government is to achieve a government is to achieve a fairer distribution of income. fairer distribution of income. Governments accept that the Governments accept that the operation of the free markets operation of the free markets will produce unfair outcomes will produce unfair outcomes for some individuals.for some individuals.

GOVERNMENT GOVERNMENT POLICIES & POLICIES & INEQUALITYINEQUALITY Government does not see its aim to Government does not see its aim to
remove all inequalities but generally remove all inequalities but generally accepts its responsibility to make accepts its responsibility to make provisions for the needs of people who provisions for the needs of people who cannot provide for themselves- such as cannot provide for themselves- such as the aged, people with disabilities or the aged, people with disabilities or illness and those unable to find work. illness and those unable to find work. This is represented in the fact that most This is represented in the fact that most of the Federal Governments budget of the Federal Governments budget each year is spent on Social Security.each year is spent on Social Security.

GOVERNMENT GOVERNMENT POLICIES & POLICIES & INEQUALITYINEQUALITY In general, government policies aim to reduce In general, government policies aim to reduce
some of the gap between higher and lower some of the gap between higher and lower income earners through redistribution policies income earners through redistribution policies such as higher tax rates for higher income such as higher tax rates for higher income earners and social security payments for lower earners and social security payments for lower income earners, especially those with families.income earners, especially those with families.
In recent years there has been less of an In recent years there has been less of an emphasis on reducing inequalities, instead the emphasis on reducing inequalities, instead the government has focused on low inflation, government has focused on low inflation, economic growth, increased savings, lower economic growth, increased savings, lower unemployment and lower CAD.unemployment and lower CAD.
They argue that strong growth will benefit all They argue that strong growth will benefit all income earners at all levels rather than policies income earners at all levels rather than policies to redistribute income to lower income earners.to redistribute income to lower income earners.

GOVERNMENT GOVERNMENT POLICIES & POLICIES & INEQUALITYINEQUALITY Government policies can influence inequality Government policies can influence inequality
both direct and indirectly.both direct and indirectly. Fiscal and labour market policies generally have Fiscal and labour market policies generally have
the most direct impact through changing the the most direct impact through changing the level of benefits, taxation and wages. However level of benefits, taxation and wages. However the side-effects of microeconomic reforms the side-effects of microeconomic reforms undertaken in the Australian economy can also undertaken in the Australian economy can also affect inequality.affect inequality.
Despite the extensive micro reforms Despite the extensive micro reforms undertaken in Australia income inequality undertaken in Australia income inequality remains little unchanged from a decade ago due remains little unchanged from a decade ago due to the fall in the unemployment rate and the to the fall in the unemployment rate and the general success of policies to redistribute general success of policies to redistribute income to lower income households. In other income to lower income households. In other words it has not got better but it has not got words it has not got better but it has not got worse either.worse either.

MACROECONOMIC MACROECONOMIC WEAPONSWEAPONS Fiscal Policy:Fiscal Policy: Patterns in government spending and revenue Patterns in government spending and revenue
collection have the most impact on inequality in collection have the most impact on inequality in Australia.Australia.
Overall government intervention tends to Overall government intervention tends to reduce income inequality by taxing higher reduce income inequality by taxing higher income groups more and redistributing to lower income groups more and redistributing to lower economic groups (i.e. through the progressive economic groups (i.e. through the progressive tax system). tax system).
However it is government payments to the However it is government payments to the unemployed, low income earners and the unemployed, low income earners and the elderly, and the provision of government elderly, and the provision of government services such as health, education and housing services such as health, education and housing are the primary mechanisms for reducing are the primary mechanisms for reducing disadvantage in Australia.disadvantage in Australia.

Examine Fig. 11.15 p.213 and Examine Fig. 11.15 p.213 and comment on the impact on comment on the impact on inequality of government inequality of government intervention through the tax intervention through the tax system.system.
________________________________________________________________________________________________________________________________________________________________________________________________________________________________________________________________________________________________________________________________________________________________________________________________________________________________________________________________________________________________________________________________________________________________________________________________________________________________________________________________________________________________________________________________________________________________________________________________________________________________________________________________________________________________________________________________________________________________________________________________________________________________________________

MACROECONOMIC MACROECONOMIC WEAPONSWEAPONS GSTGST: the introduction of a regressive tax has : the introduction of a regressive tax has
the impact of increasingthe impact of increasing income inequality for lower and fixed income inequality for lower and fixed
income earners.income earners. WEALTH TAXWEALTH TAX: Changes to capital gains tax : Changes to capital gains tax
and no tax on inheritance ensures that the and no tax on inheritance ensures that the more income to more wealth cycle continues.more income to more wealth cycle continues.
The absence of tax on wealth is justified by The absence of tax on wealth is justified by the emphasis on incentivisation by the the emphasis on incentivisation by the Howard government i.e. the fewer barriers to Howard government i.e. the fewer barriers to wealth accumulation the greater economic wealth accumulation the greater economic efficiency will result in a stronger incentive efficiency will result in a stronger incentive to accumulate wealth overall.to accumulate wealth overall.

The The 2005-06 Budget2005-06 Budget
The The 2005-06 Budget2005-06 Budget will have a mixed impact on the will have a mixed impact on the distribution of income, but overall the effect is likely to distribution of income, but overall the effect is likely to increase income inequality.increase income inequality.
The changes in the Budget were:The changes in the Budget were: TaxationTaxation:: a. reduction the lowest marginal income rate from a. reduction the lowest marginal income rate from
17% to 15% will give lower income earners a larger 17% to 15% will give lower income earners a larger proportional taxcut.proportional taxcut.
b. changes to the two top income tax brackets will b. changes to the two top income tax brackets will much larger much larger
cuts for high income earnerscuts for high income earners c. the combined effect will make the taxation system c. the combined effect will make the taxation system
less progressive.less progressive.

Net Personal Income Tax Brackets and Rates (excludes Medicare levy)
Tax Brackets 2003/04Current tax Brackets
2004/05Brackets from 1/7/05 Brackets from 1/7/06
$0 – $6,000 0%$6,001 – $21,600
17%$21,601 - $52,000 30%$52,001 – $62,500 42%Over $62,500 47%
0-$6,000 0%6,001-21,600 17%21,6001-58,000 30%58,001-70,000 42%70,000+ 47%
0-6,000 0%6,001-21,600
15%21,601-63,000
30%63,001-95,000 42%95,000+
47%
0-6,000 0%6,001-21,600 15%21,6001-70,000
30%70,001-125,000 42%125,000+
47%
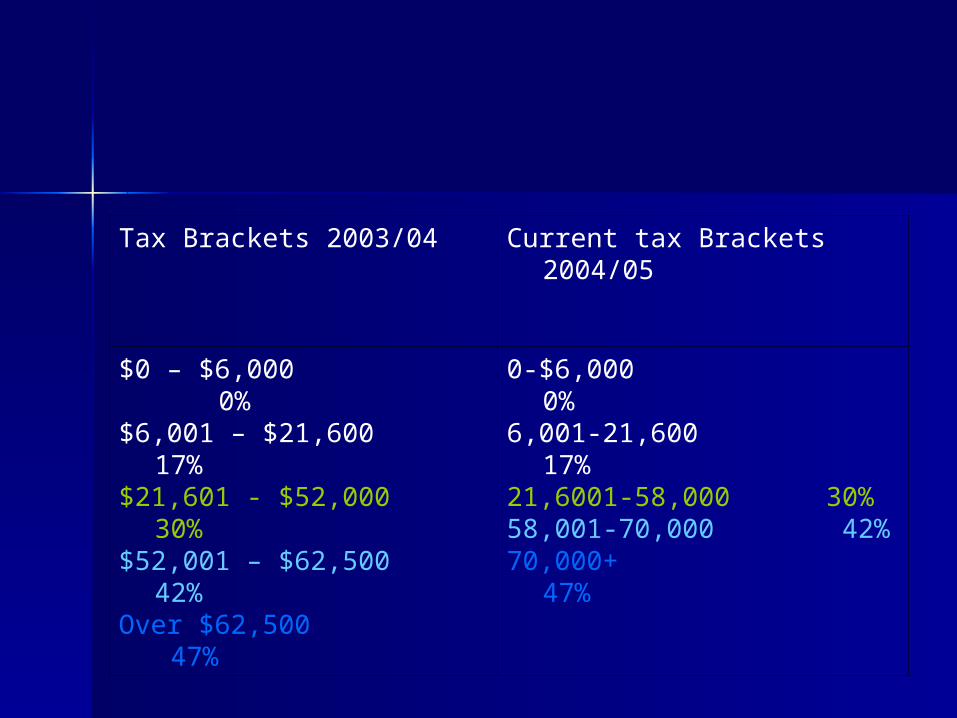
Tax Brackets 2003/04 Current tax Brackets 2004/05
$0 – $6,000 0%$6,001 – $21,600 17%$21,601 - $52,000 30%$52,001 – $62,500 42%Over $62,500 47%
0-$6,000 0%6,001-21,600 17%21,6001-58,000 30%58,001-70,000 42%70,000+ 47%

Brackets from 1/7/05 Brackets from 1/7/06
0-6,000 0%6,001-21,600 15%21,601-63,000 30%63,001-95,000 42%95,000+ 47%
0-6,000 0%6,001-21,600 15%21,6001-70,000 30%70,001-125,000 42%125,000+ 47%

Budget 2006-07Budget 2006-07
– – There has been much discussion There has been much discussion about further changes to the about further changes to the taxation system. taxation system.
WATCH THIS SPACEWATCH THIS SPACE

MACROECONOMIC MACROECONOMIC WEAPONSWEAPONS
Welfare to WorkWelfare to Work: The principle of mutual : The principle of mutual obligation (i.e. income support is obligation (i.e. income support is dependent on willingness to seek work or dependent on willingness to seek work or re-enter education).re-enter education).
New applicants for Parenting Payments New applicants for Parenting Payments and Disability Support Pension who do not and Disability Support Pension who do not actively seek work receive the lower actively seek work receive the lower NewstartNewstart welfare payment, is also likely to welfare payment, is also likely to cause an increase in inequality if these cause an increase in inequality if these individuals do not receive adequate individuals do not receive adequate support to find employmentsupport to find employment

MACROECONOMIC MACROECONOMIC WEAPONSWEAPONS ‘‘Social wage’Social wage’ type government spending on health, type government spending on health,
housing and education since 1996 have seen:housing and education since 1996 have seen: sharp spending in a wide range of the sharp spending in a wide range of the social wagesocial wage
mattersmatters dismantling of dental servicesdismantling of dental services sharp reductions in education spending growth sharp reductions in education spending growth
concentrated on the tertiary sectorconcentrated on the tertiary sector restraints on spending growth in health- hospitals, restraints on spending growth in health- hospitals,
Medicare benefits. This had an electoral backlash, so Medicare benefits. This had an electoral backlash, so government did some reversal in outer metropolitan government did some reversal in outer metropolitan areas.areas.
increase in the ‘user pay’ principle to areas such as increase in the ‘user pay’ principle to areas such as nursing homes costs and tertiary educationnursing homes costs and tertiary education
Subsidies to dairy farmers and buyers of private Subsidies to dairy farmers and buyers of private health insurance, redistributes income to those health insurance, redistributes income to those sectors but not necessarily improving income sectors but not necessarily improving income redistribution.redistribution.

MONETARY POLICYMONETARY POLICY

MONETARY POLICYMONETARY POLICY
The monetary stance to keep interest The monetary stance to keep interest rates low ensures greater income rates low ensures greater income equality as less income is spent on equality as less income is spent on interest repayments. Lower income interest repayments. Lower income earners also tend to be borrowers rather earners also tend to be borrowers rather than lenders. than lenders.
Higher interest rates will tend to favour Higher interest rates will tend to favour savers and result in further wealth savers and result in further wealth creation thereby increasing the level of creation thereby increasing the level of inequality both for incomes and wealth.inequality both for incomes and wealth.

MICROECONOMIC MICROECONOMIC REFORMSREFORMS
Privatisation: Policies to aggressively pursue Privatisation: Policies to aggressively pursue economic growth can result in negative social economic growth can result in negative social effects such as privatised companies sharply effects such as privatised companies sharply raising prices or downsizing that can lead to raising prices or downsizing that can lead to structural unemployment. structural unemployment.
These actions can worsen inequality in the short These actions can worsen inequality in the short term but in the long term the belief is that term but in the long term the belief is that improved efficiency will benefit all Australians improved efficiency will benefit all Australians by creating sustainable employment and by creating sustainable employment and therefore improved equality.therefore improved equality.
However the long term unemployed can However the long term unemployed can contribute to increased inequality but in recent contribute to increased inequality but in recent years the government has had some success in years the government has had some success in reducing this type of unemployment.reducing this type of unemployment.

Labour Market Labour Market Reforms:Reforms:

Labour Market Labour Market Reforms:Reforms:
Changes in the pattern of employment Changes in the pattern of employment i.e. increased casualisation have created i.e. increased casualisation have created the problem of underemployment. the problem of underemployment.
People in casual or part-time jobs have People in casual or part-time jobs have greater fluctuating incomes. This can greater fluctuating incomes. This can make it difficult for them to borrow to make it difficult for them to borrow to purchase assets thereby reducing their purchase assets thereby reducing their capacity to acquire wealth, this further capacity to acquire wealth, this further impacts on wealth inequality.impacts on wealth inequality.

Labour Market Labour Market Reforms:Reforms: Deregulation of labour markets has widened Deregulation of labour markets has widened
inequality between wage earners. Under enterprise inequality between wage earners. Under enterprise agreements workers with greater skills and agreements workers with greater skills and stronger bargaining power have achieved higher stronger bargaining power have achieved higher average incomes than those with fewer skills who average incomes than those with fewer skills who rely on industrial awards for wage rises (award rely on industrial awards for wage rises (award simplification). simplification).
However in recent years the AIRC has granted However in recent years the AIRC has granted significant increases to minimum wages in recent significant increases to minimum wages in recent years which has helped minimise the gap between years which has helped minimise the gap between higher and low income earners. higher and low income earners.
The present Howard government has criticised the The present Howard government has criticised the actions of the AIRC and has now transferred its actions of the AIRC and has now transferred its power to set minimum wages to the Equal Pay power to set minimum wages to the Equal Pay Commission.Commission.

Compulsory Compulsory SuperannuationSuperannuation Compulsory Superannuation is the Compulsory Superannuation is the
most important recent policy to most important recent policy to improve distribution of wealth in improve distribution of wealth in Australia. A minimum of 9% of Australia. A minimum of 9% of employee wage is to be contributed employee wage is to be contributed by the employer to a by the employer to a superannuation fund in provision superannuation fund in provision for retirement.for retirement.
The superannuation pool makes up The superannuation pool makes up
70% of the wealth for the poorest 70% of the wealth for the poorest 40% for of people.40% for of people.

International Business International Business CycleCycle
Australia’s integration into the world Australia’s integration into the world economy has effectively resulted in the economy has effectively resulted in the government having less effective government having less effective control over the business cycle. control over the business cycle.
This in turn can have an impact on the This in turn can have an impact on the distribution of income as 1/5 workers distribution of income as 1/5 workers are to work in export related industries.are to work in export related industries.
Therefore if there is a downturn in the Therefore if there is a downturn in the
global economy, Australian workers can global economy, Australian workers can be displaced resulting in an increase in be displaced resulting in an increase in income inequality.income inequality.