hsbc Cover of 2008 Interim Results slide presentation Download 2008 Interim Results slide...
68
Presentation to Investors and Analysts HSBC Holdings plc Interim Results 2008
-
Upload
quarterlyearningsreports2 -
Category
Business
-
view
1.480 -
download
0
Transcript of hsbc Cover of 2008 Interim Results slide presentation Download 2008 Interim Results slide...

Presentation to Investors and Analysts
HSBC Holdings plcInterim Results 2008

Forward-looking statements
2
This presentation and subsequent discussion may contain certain forward-looking statements with respect to the financial condition, results of operations and business of the Group. These forward-looking statements represent the Group’s expectations or beliefs concerning future events and involve known and unknown risks and uncertainty that could cause actual results, performance or events to differ materially from those expressed or implied in such statements. Additional detailed information concerning important factors that could cause actual results to differ materially is available in our Interim Report

Reported results
3
Profit before tax
US$10.2bn, down 28%(down 22% excl. dilution gains in 1H07)
Earnings per share
US$0.65, down 32%(down 24% excl. dilution gains in 1H07)
Dividends per share1
Up 6% to US$0.36
Attributable profit
US$7.7bn, down 29%(down 22%, excl. dilution gains in 1H07)
Return on total shareholders’ equity
12.1% compared to 19.1%
Tier 1 capital
8.8% against 8.7% at end 2007Core Equity Tier 1, 7.5%
Note:(1) In respect of 1H08, as disclosed in the 2007 Annual Report and Accounts

Performance in 1H08
• Resilient performance in most difficult market for several decades
• Balance of earnings between markets and businesses helped cushion market turmoil
• Profitable in all our Customer Groups, including Global Banking and Markets
• Profitable across all our Geographies, with the continued exception of North America
• Unwavering commitment to financial strength
• Continued our dividend policy and commitment to make capital available for future investment
• Costs well controlled
• TSR performance top five in peer group
4

Douglas FlintFinancial performance in first half 2008

Summary of results
Net operating income before loan impairment charges 38,493 39,475 +3 Loan impairment charges (6,346) (10,058) +58Net operating income 32,147 29,417 -8Total operating expenses (18,611) (20,140) +8Profit before tax 14,159 10,247 -28Profit attributable to shareholders 10,895 7,722 -29Cost efficiency ratio (%) 48.3 51.0 Earnings per share (US$) 0.95 0.65 -32Dividends per share (US$), in respect of 1H07, 1H08 0.34 0.36 +6Tier 1 ratio (%) 9.31 8.82
% Change (US$m) 1H07 1H08 vs 1H07
Notes:(1) Basel I(2) Basel II
6

Underlying growth, 1H08 vs 1H07
US$m1H07
restated1Dilution gains2
and disposals
1H07 restated, excl dilution gains 1H08 Acquisitions
Rest of HSBC
% Change
Net operating income before loan impairment charges 39,824 1,114 38,710 39,475 68 39,407 +2
Loan impairment charges (6,470) - (6,470) (10,058) - (10,058) +55
Net operating income 33,354 1,114 32,240 29,417 68 29,349 -9
Total operating expenses (19,349) (55) (19,294) (20,140) (28) (20,112) +4
Profit before tax 14,676 1,059 13,617 10,247 28 10,219 -25
Notes:(1) Restated for constant currency(2) Gains arising from dilution of interests in Chinese associates
7

Underlying growth, 1H08 vs 2H07
US$m2H07
restated1Dilution gains2
and disposals
2H07 restated, excl dilution gains 1H08 Acquisitions
Rest of HSBC
% Change
Net operating income before loan impairment charges 40,827 72 40,755 39,475 13 39,462 -3
Loan impairment charges (10,918) - (10,918) (10,058) - (10,058) -8
Net operating income 29,909 72 29,837 29,417 13 29,404 -1
Total operating expenses (20,658) (50) (20,608) (20,140) (11) (20,129) -2
Profit before tax 10,168 22 10,146 10,247 2 10,245 +1
Notes:(1) Restated for constant currency(2) Gains arising from dilution of interests in associates
8

Special factors
Profit before tax 14,159 10,053 10,247
Dilution gains1 1,076 16 -
Fair value of own debt – change in credit spread 172 2,883 824
Goodwill impairment (North America PFS) - - (527)
Global Banking and Markets write-downs - (2,135) (3,931)
Profit before tax, adjusting for special factors 12,911 9,279 13,881
US$m 1H07 2H07 1H08
Effective tax rate (%) 18.7 11.1 18.9
Note:(1) Gains arising from dilution of interests in associates
9

Balance sheet growth
+12%
$1,042
$1,165$1,231
$928$982
$1,049$981
$1,096$1,162
0
200
400
600
800
1,000
1,200
1,400
30-Jun-07 31-Dec-07 30-Jun-08 30-Jun-07 31-Dec-07 30-Jun-08 30-Jun-07 31-Dec-07 30-Jun-08
Risk weighted assets Customer loans and advances Customer accounts
US$bn
Notes:(1) Basel I(2) Basel II
1
22
+6%
+6% +7% +12%+6%
10

Capital strength continues Tier 1 capital ratios (%), Basel II
7.5%7.5%
0.2%0.3%0.9% 1.1%
8.7% 8.8%
0%
1%
2%
3%
4%
5%
6%
7%
8%
9%
10%
31-Dec-07 30-Jun-08
Core Equity Tier 1 Preference share capital Innovative Tier 1 capital
11

Credit quality
Personal Financial Services
Europe 1,127 917 963 1.53 1.21 1.28
Hong Kong 74 101 34 0.40 0.51 0.17
Rest of Asia-Pacific 252 300 375 1.68 1.80 2.09
North America 3,774 8,135 6,952 3.46 7.35 6.68
Latin America 701 791 1,060 8.01 7.56 9.34
Total 5,928 10,244 9,384 2.63 4.38 4.12
Loan impairment charges 1H07 2H07 1H08 1H07 2H07 1H08% of avg advances annualisedUS$m
12

Credit quality
Loan impairment charges 1H07 2H07 1H08 1H07 2H07 1H08% of avg advances annualisedUS$m
Commercial BankingEurope 256 259 285 0.61 0.53 0.53Hong Kong 1 27 28 0.01 0.21 0.20 Rest of Asia-Pacific 54 7 (16) 0.46 0.05 (0.09)North America 46 145 156 0.27 0.77 0.81 Latin America 74 138 110 1.25 1.92 1.27
Total 431 576 563 0.49 0.56 0.50
Loan impairment charges 1H07 2H07 1H08 1H07 2H07 1H08% of avg advances annualisedUS$m
Global Banking and Markets (24) 62 115 (0.02) 0.05 0.08 Private Banking 9 5 (4) 0.05 0.02 (0.02)
13

Write-downs in Global Banking and MarketsA. Trading
Sub-prime mortgage-related assets 1.0 2.9 1.0 3.7
Non-sub-prime credit trading assets 1.4 8.9 0.6 9.8
Leveraged loans 0.3 8.3 0.2 8.7
Fair value of derivative transactions with monolines 1.2 1.3 0.3 1.2
Total 3.9 2.1
1H08 Net exposure at 2H07 Net exposure atUS$bn write-downs 30 June 08 write-downs 31 Dec 07
14

Write-downs in Global Banking and MarketsB. Available for sale ‘Asset Backed Securities’ exposure
Available for salereserve relating Impairment to
Balance Subprime to subprime subprimesheet HELOC HELOC HELOC
exposure Alt-A exposure Alt-A exposure Alt-A exposureUS$bn 30 June 2008 30 June 2008 30 June 2008 1H08 Comments
Securities Investment Conduits and Structured Investment Vehicles
21.3 7.7 (2.9) (0.134) US$1.3bn first loss protection to be absorbed by capital note holders
Directly held 48.4 9.4 (3.6) (0.055) Charge to P&L
Total 69.7 17.1 (6.5)
15

Market risk management
0
50
100
150
200
250
Dec-06 Feb-07 Apr-07 Jun-07 Aug-07 Oct-07 Dec-07 Feb-08 Apr-08 Jun-08
1 1
41 2 3
57
46
1214
16
20
11
7 8
24
10
5
10
15
20
25
-174-162 -106 -94 -82 -70 -58 -46 -34 -22 -10 2 14 26 38 50 62 74 86 98 110122
At period end 84.2 70.1 144.2
Average 62.5 67.9 135.5
Minimum 43.8 57.3 59.8
Maximum 98.1 85.9 230.5
Value at risk for the Group1
(US$m) 1H07 2H07 1H08
Note:(1) Trading and non-trading
Daily Group VAR (trading and non-trading) (US$m) Daily distribution of Global Markets' revenues (US$m)
US$446.0bn US$473.5bn
Quoted marked price 47% 47%
Valuation techniques
– Using observable inputs 50% 50%
– With significant non-observable inputs 3% 3%
Bases for valuingtrading assets 2H07 1H08
US$m
No
of d
ays
16

Michael GeogheganBusiness performance in first half 2008

Measuring our success
Good progress on key metrics
Financial measures Target range 1H08
Return on total shareholders’ equity 15-19% through the cycle 12.1%
Cost efficiency ratio 48-52% 51.0%
Tier 1 capital (Basel II) 7.5-9.0% 8.8%
Total shareholder return Above peer group average Top 5
18

Profitable in all Geographies – with the continuing exception of the US
Profit (loss) before taxGeography % share 1H08 vs 1H07 1H08 vs 2H07
Profit before tax Customer Group US$m 1H08 vs 1H07 1H08 vs 2H07
% change
% change
+0
+7
-23
+14
-40 -20 0 20
+98
+24
-108
+12
+37
-200 -100 0 100 200
+0
-219
+27
+28
-250 -200 0 50 100
Asia 65%
Latin America 12%
Europe 51%
North America (28%)
-51
+5
-35
+35
-118
-150 -100 -50 0 50
Personal Financial Services
Commercial Banking
Global Banking and Markets
Private Banking
Other
US$10,247m
2,690 (26%)
4,611 (45%)
822 (8%)
2,313 (23%)
Other -189 (-2%)
19

Strong growth across Asia1
Profit before tax of US$6.7bn
Profit before taxCustomer Group US$m 1H08 vs 1H072 1H08 vs 2H072
% change
+14
-18
n/a
+35
+53
+20
-40 -20 0 20 40 60
Personal Financial Services
Commercial Banking
Global Banking and Markets
Private Banking
Other
Total
-6
-2
+0
+22
+14
n/a
-10 0 10 20 30US$6,697m
Other -623 (-9%)
2,571 (38%)2,742 (41%)
1,830 (27%)
177 (3%)
• PBT up by 20% vs 1H07, excluding dilution gains
Notes: (1) Asia includes Hong Kong and Rest of Asia-Pacific including Middle East(2) Excludes gains arising from dilution of interests in Chinese and other associates
20

Solid results in Hong Kong against exceptional 2007Profit before tax of US$3.1bn
Profit before tax Customer Group US$m 1H08 vs 1H07 1H08 vs 2H07
% change
123 (4%)
770 (25%)
869 (28%)
2,036 (66%)
US$3,073m
Other -725 (-23%) +7
+14
+10
-24
-8
-290
-300 -20 0 20
Personal Financial Services
Commercial Banking
Global Banking and Markets
Private Banking
Other
Total
+1
-13
-15
-23
-284
-12
-300 -20 0 20
• PBT down by 8%, but flat excluding impairments in value of regional strategic investments
• Fall in PBT for Personal Financial Services 1H08 vs 2H07 reflects impact of decline in global equity markets on fee income and investment returns for insurance
• Decline in PBT for Global Banking and Markets 1H08 vs 2H07 due to weaker credit trading markets
21

Record performance in Rest of Asia-Pacific, excluding Middle EastProfit before tax of US$2.6bn
1,546 (59%)
653 (25%)
57 (2%)52 (2%)
326 (12%)
Profit before taxCustomer Group US$m 1H08 vs 1H071 1H08 vs 2H071
% change
US$2,634m
+44
+73
+75
-5
+58
-53
-100 -50 0 50 100
Personal Financial Services
Commercial Banking
Global Banking and Markets
Private Banking
Other
Total
+13
+42
+53
-2
+34
+33
-50 0 50 100
• Exceptional growth in PBT, up 58% to US$2.6bn• Global Banking and Markets is the major contributor generating 59% of the region’s
profit, and grew profits by 75% to US$1.5bn, based on strong revenue growth from Balance Sheet Management, foreign exchange and securities services
• Commercial Banking increased PBT by 73% to US$0.7bn which was largely volume-driven following customer acquisition
Note: (1) Excludes gains arising from dilution of interests in Chinese and other associates
22
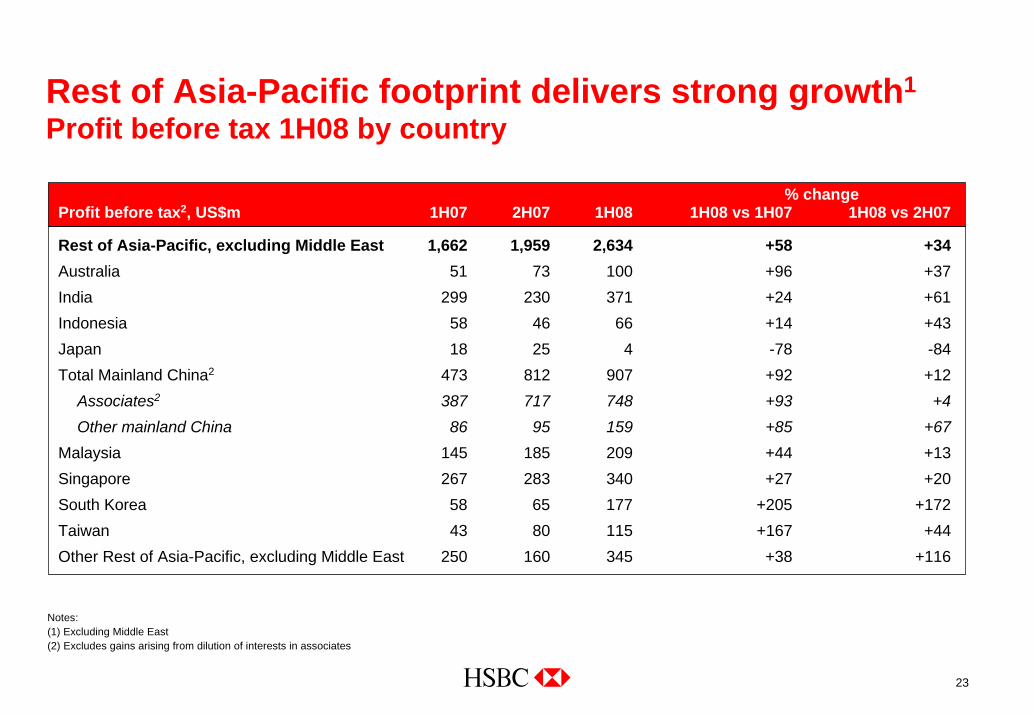
Rest of Asia-Pacific footprint delivers strong growth1
Profit before tax 1H08 by country
Profit before tax2, US$m 1H07 2H07 1H08 1H08 vs 1H07 1H08 vs 2H07% change
Rest of Asia-Pacific, excluding Middle East 1,662 1,959 2,634 +58 +34Australia 51 73 100 +96 +37India 299 230 371 +24 +61Indonesia 58 46 66 +14 +43Japan 18 25 4 -78 -84Total Mainland China2 473 812 907 +92 +12
Associates2 387 717 748 +93 +4Other mainland China 86 95 159 +85 +67
Malaysia 145 185 209 +44 +13Singapore 267 283 340 +27 +20South Korea 58 65 177 +205 +172Taiwan 43 80 115 +167 +44Other Rest of Asia-Pacific, excluding Middle East 250 160 345 +38 +116
Notes: (1) Excluding Middle East(2) Excludes gains arising from dilution of interests in associates
23

Exceptional growth in the Middle EastProfit before tax of US$990m
Profit before tax Customer Group US$m 1H08 vs 1H07 1H08 vs 2H07
% change
2 (0%) 45 (5%)
426 (43%)
308 (31%)
209 (21%)
US$990m
+67
+100
+2
+40
+97
+63
0 20 40 60 80 100 120
Personal Financial Services
Commercial Banking
Global Banking and Markets
Private Banking
Other
Total
+74
+18
+41
+53
+18
0 20 40 60 80
Middle East 606 701 990 +63 +41
Egypt 72 81 115 +60 +42
United Arab Emirates 295 322 522 +77 +62
Other Middle East 128 172 178 +39 +3
Total Middle East (excl. Saudi Arabia) 495 575 815 +65 +42
Total Saudi Arabia 111 126 175 +58 +39
Profit before tax, US$m 1H07 2H07 1H08 1H08 vs 1H07 1H08 vs 2H07% change
24

Balance sheet driven growth in Latin AmericaProfit before tax of US$1.3bn
8 (1%)
383 (30%)
411 (32%)
468 (37%)
Other -4 (0%)
1H08 vs 1H07Profit before taxCustomer group US$m 1H08 vs 1H07 1H08 vs 2H07
% change
+21
+17
+51
-20
+27
n/a
-60 -40 -20 0 20 40 60
Personal Financial Services
Commercial Banking
Global Banking and Markets
Private Banking
Other
Total
-7
+45
-47
+7
n/a
+6
-60 -40 -20 0 20 40 60US$1,266m
• PBT growth of 27% reflected strong growth in customer advances, particularly in Brazil for Personal Financial Service and Commercial Banking
• Benefit of business expansion partially offset by increase in loan impairment charge in Mexico
• Strong growth in Global Banking and Markets from higher net interest income and foreign exchange
% change
25

Tight cost control and brand strength help grow profit in Europe – Profit before tax of US$5.2bn
144 (3%)579 (11%)
1,190 (23%)
1,940 (37%)
1,324 (26%)
Profit before taxCustomer Group US$m 1H08 vs 1H07 1H08 vs 2H07
% change
US$5,177m
• 45% growth in PBT for UK to US$3.5bn with strong performance from Personal Financial Services and Commercial Banking– Called the top of the real estate market in 2006– Reduced unsecured lending– Strong cost discipline– Growth in customer deposits and mortgage balances
• Global Banking and Markets remained profitable despite write-downs• Disposal of French regional banks will be reflected in 2H08 with a gain on sale of US$2.1bn
+119
+57
-29
+17
+235
+28
-100 0 100 200 300
Personal Financial Services
Commercial Banking
Global Banking and Markets
Private Banking
Other
Total
-86
+14
+37
+40
+52
+36
-100 -50 0 50 100
26

North America continues to suffer from weak economy and market turmoil – Loss before tax of US$2.9bn
Profit (loss) before taxCustomer Group 1H08 vs 1H07 1H08 vs 2H07
% change
Personal Financial Services (2,050)
Commercial Banking 430
Global Banking and Markets (1,625)
Private Banking 58
Other 294
Total (2,893)
-238
-3
-10
-473
-219
n/a
-500 -400 -300 -200 -100 0
+32
-49
-81
-23
-16
-3
-100 -50 0 50
US$m
• Personal Financial Services recorded a pre-tax loss of US$2.1bn (vs PBT US$1.5bn in 1H07) following 84% increase in loan impairment charge. The loss was less than in 2H07 with a 15% reduction in the loan impairment charge
• Global Banking and Markets incurred further write-downs of US$2.3bn as a consequence of the market turmoil and produced a loss of US$1.6bn
• Commercial Banking profits declined by 10% due to the increase in loan impairment charge from the low levels in 1H07
27

Personal Financial ServicesWeak US performance offsets good growth in other Geographies
• Flight to quality continued with strong customer accounts growth at 14%
• Global initiatives making strong headway– HSBC Premier: 2.4m customers, up 10% v 2H07– Direct banking: gross balances US$16.1bn, up 19% v 2H07– Cards: growth in emerging markets up 5% v 2H07
• In the UK, Group has strengthened its positionin the mortgage market (from 3% in March to 12% in May of gross lending)
• Revenue momentum maintained in Hong Kongand Rest of Asia-Pacific
Net operating income before loan impairment charges 22,422 +7 -
Loan impairment charges (9,384) +58 -8
Net operating income 13,038 -13 +8
Total operating expenses (11,099) +6 -2
Operating profit 1,939 -57 +144
Associates and JVs 374 +76 -1
Profit before tax 2,313 -51 +98
US$m 1H08 vs 1H07 vs 2H07% chg
-2.2bn
1.3bn
-3.0 -2.0 -1.0 0.0 1.0 2.0
1H08
1H07
US PFS Rest of Group PFS
3.4bn
4.5bn
0.0 1.0 2.0 3.0 4.0 5.0 6.0
1H08
1H07+33%
Customer loans and advances (US$bn) 458.3 - -1
Customer accounts (US$bn) 474.3 +14 +5
28

HSBC Finance CorporationContinued reduction of exposure in the US
• Delinquencies continued to rise broadly in line with expectations
• Continued to tighten underwriting standards in all businesses
• Reduced size of loan portfolio
• Focus on cost reduction measures
7.2 7.89.6
11.7 12.1 12.2
5.7%
4.7%4.2%
7.8%7.5%
7.0%
4%
6%
8%
1Q07 2Q07 3Q07 4Q07 1Q08 2Q0802468101214
US$bn
2+ d
elin
quen
cy1
Note: (1) IFRS management basis for US, excludes operations in UK and Canada
170.6 168.3 167.9 167.3161.0
156.6
140
150
160
170
180
1Q07 2Q07 3Q07 4Q07 1Q08 2Q08
Cus
tom
er lo
ans1
US$bn
29

HSBC Finance CorporationUS Mortgages – continuing to shrink the Mortgages Services portfolio
• Continue to make progress on mortgage strategy, reduced Mortgage Services portfolio from US$36.2bn to US$31.4bn (run-off mostly by repayment)
• Expanded loan modification and foreclosure avoidance programme• Reduced Consumer Lending branch network• Tightened underwriting in Consumer Lending
Consumer Lending
1.1 1.11.6
2.12.5 2.8
3.2%2.3%2.2%
5.7%5.0%4.2%
0%
2%
4%
6%
1Q07 2Q07 3Q07 4Q07 1Q08 2Q080
1
2
3
US$bn
47.6 48.8 49.9 50.2 49.9 49.0
2030405060
1Q07 2Q07 3Q07 4Q07 1Q08 2Q08
US$bn
Mortgage Services
2.3 2.63.2
4.1 4.2 4.1
8.2%6.2%4.9%
13.0%12.5%11.2%
4%6%8%
10%12%14%
1Q07 2Q07 3Q07 4Q07 1Q08 2Q08012345
US$bn
46.741.5 38.9 36.2 33.9 31.4
2030405060
1Q07 2Q07 3Q07 4Q07 1Q08 2Q08
US$bn
Man
agem
ent
actio
ns2+
del
inqu
ency
Loan
s
30

HSBC Finance CorporationManagement action helps trends in cards
Cards Private Label
• Tightened underwriting, reduced mailings, cancelled higher risk credit lines• Expanded collection activities• Reviewed of card merchant relationships for renegotiation• Continued progress of US cards business in helping to develop the Group’s global operations
US$bn
1.3 1.31.6
1.8 1.8 1.7
5.2%4.4%4.5%5.7%5.9%5.8%
0%
2%
4%
6%
8%
1Q07 2Q07 3Q07 4Q07 1Q08 2Q080
1
2
US$bn
0.5 0.5 0.6 0.6 0.6 0.63.2% 3.4% 3.6% 3.6%
2.9% 2.8%
0%
2%
4%
1Q07 2Q07 3Q07 4Q07 1Q08 2Q080
1
27.8 29.3 29.9 31.0 29.4 29.3
10
20
30
40
1Q07 2Q07 3Q07 4Q07 1Q08 2Q08
17.3 17.4 17.7 18.7 17.4 17.4
10
20
30
40
1Q07 2Q07 3Q07 4Q07 1Q08 2Q08
US$bn
US$bn
Man
agem
ent
actio
ns2+
del
inqu
ency
Loan
s
31

HSBC US Finance CorporationVehicle Finance will be run off
Unsecured Personal Credit Vehicle Finance
• Continued to tighten underwriting criteria and increase collections
• In July, it was decided to cease originations of new business and we will manage an orderly run-off of the portfolio
1.8 1.9 2.22.6 2.6 2.6
11.9%14.4% 15.0% 15.4%
9.9% 10.5%
0%
5%
10%
15%
20%
1Q07 2Q07 3Q07 4Q07 1Q08 2Q080
1
2
3
0.3 0.4 0.4 0.50.4 0.4
3.5% 3.7%2.9%
3.5%
2.4%3.0%
0%
2%
4%
1Q07 2Q07 3Q07 4Q07 1Q08 2Q080
1
18.4 18.5 18.1 17.5 16.818.5
0
10
20
30
1Q07 2Q07 3Q07 4Q07 1Q08 2Q08
12.6 12.7 12.9 12.9 12.8 12.5
0
10
20
1Q07 2Q07 3Q07 4Q07 1Q08 2Q08
US$bn
US$bn
US$bn
US$bn
Man
agem
ent
Act
ions
2+ d
elin
quen
cyLo
ans
32

Commercial BankingAnother strong performance from a core business
• Strong profit growth (+35%), even excluding card acquiring gain (+22%)
• Growth strong in the Middle East, Asia-Pacific and Brazil. Share of profits from emerging markets increased from 52% to 54%1
• Rapid revenue growth (+29%) from trade and supply chain and (+44%) foreign exchange reflected the Group’s “Leading International Business” strategy
• Value of cross-border deals up 83% through Global Links
• Success for the “Best Bank for Small Business” strategy evident in 8% growth in customers and contributed strongly to income growth
• Continued expansion of physical and online distribution capabilities
Net operating income before loan impairment charges 8,156 +24 +11
Loan impairment charges (563) +31 -2
Net operating income 7,593 +23 +12
Total operating expenses (3,280) +13 -2
Operating profit 4,313 +33 +25
Associates and JVs 298 +66 +9
Profit before tax 4,611 +35 +24
US$m 1H08 vs 1H07 vs 2H07% chg
Customer loans (US$bn) 238.1 +28 +8
Customer accounts (US$bn) 247.7 +21 +4
Note: (1) Excluding the card acquiring gain
33

Global Banking and Markets Emerging markets strength helped business remain profitable in difficult market conditions
• 35% decline in PBT after write-downs of US$3.9bn. Improved performance since 2H07
• ‘Emerging markets-led and financing-focused’strategy enabled Group to support clients in cross-border transactions into and out of emerging markets. PBT up 51% in emerging markets
• In Global Markets– Record revenue from foreign exchange– Strong results in rates– Growth in securities services– Challenging markets in credit trading and Principal
Investments• Global Banking: greater transaction volumes
led to growth in income for payments and cash management
• Balance Sheet Management income significantly higher
Net operating income before loan impairment charges 7,379 -13 +10
Loan impairment charges (115) n/a +85
Net operating income 7,264 -15 +9
Total operating expenses (4,827) +8 -1
Operating profit 2,437 -40 +38
Associates and JVs 253 +122 +31
Profit before tax 2,690 -35 +37
US$m 1H08 vs 1H 07 vs 2H07 % chg
34

Global Banking and MarketsStrength in emerging markets, improvement in profit from 2H07 and resilient revenues across our businesses
1H08 vs 1H07 vs 2H07Global Markets 1,688 -56 -11Global Banking 2,432 +23 +10Balance Sheet Management 1,630 +213 +131Global Asset Management 669 +5 -4Principal Investments 167 -78 -66Other 833 +1 +14
Total operating income 7,419 -13 +10
Asia 2,742 102
Latin America 383 14
Europe 1,190 44
North America (1,625) (60)
Total 2,690 100
Profit (loss) before tax 1H08 US$m %
Management view of total operating income
1H08 vs 1H07
1H08 vs 2H07
+22
-16
+37
+40
+45
-20 0 20 40 60
Asia
Latin America
Europe
North America
Total
+53
+51
-29
-35
-473
-500 -50 0 50 100
Asia
Latin America
Europe
North America
Total
Regional mix Growth in profit before tax (%)
% chgUS$m
35

Private Banking Continued profit growth
Client assets (US$bn)
At 1 January 421 +26 +14
Net new money 15 -12 -21
Value change (20) n/a n/a
Exchange and other 5 -38 -80
At 30 June 421 +14 -
• PBT up 5% with strong performances in Switzerland and Monaco
• Success with inward referrals from other Customer Groups resulted in US$3.4bn of net new money (US$2.0bn in 1H07)
• Client assets increased by 14% to US$421bn against June 2007 and stable against December 2007
• Total client assets, which include some non-financial assets held in client trusts, amounted to US$499bn and included US$19bn of net new money
Net operating income beforeloan impairment charges 1,916 +12 +5
Loan impairment recovery 4 n/a n/a
Net operating income 1,920 +12 +5
Total operating expenses (1,098) +18 -
Operating profit 822 +5 +13
Associates and JVs - - -
Profit before tax 822 +5 +12
US$m 1H08 vs 1H07 vs 2H07% chg
36

InsuranceContinued success in difficult market conditions
Manufacturing (59%)
Distribution (25%)
Ping An (16%)
PBT by insurance business, 1H08
PBT by region
0.0
0.3
0.6
Asia exclPing An
Europe LatinAmerica
NorthAmerica
US$
bn
1H07 1H08
• Insurance contributed US$1.6bn, 16% of Group profit before tax, up 4% on 1H07
• Strong bancassurance performance:– Net earned premiums up 30% to US$5.2bn
– Europe up 54% (excl. acquisition & disposals up 21%)– Asia up 15%– Latin America up 23%
– North America insurance fee income up 34%• In Asia profit was 83% below 1H07 due to lower
investment returns in difficult equity market conditions
• Indian and South Korean joint ventures launched• Number 1 for Income Protection in the UK1
• “Best Life Insurance Provider” in Brazil2
• Product excellence awards in France3
• Preferred Strategic Partner relationships now in 23 countries with 82 product launches or migrations agreed during 1H08Notes:
(1) Based on market share: Association of British Insurers results for 1Q08(2) Awarded by Gazetta Mercantil in 2007(3) “Labels d’Excellence 2008” awarded by Les Dossiers de l’Epargne
37

Growing revenue and improving efficiency throughJoining Up the Company
Revenue
• HSBC Premier: 2.4m customers each generating more than US$2,000 annualised revenues. 208,000 new customers in 1H08
• Global Links: Cross border referrals increased by 126% in number and 83% in value to US$5.6bn
• Global Transaction Banking: revenues increased by 17% to US$4.6bn
Costs
38
• One HSBC cards
• One HSBCnet
• One HSBC internet
• Core Banking
• One HSBC call centre
• One HSB
• One HSBC cu
• Core HSBC pay
C collection
stomer data management
ments
Cost growth lower than world inflation

Key highlights of first half performance
• Europe benefited from good cost control (PBT +28%)
• Exceptional growth in Middle East (PBT +63%)
• Latin America was strong (PBT +27%)
• Good growth in Asia (+20%, excl. dilution gains)
• Solid results in Hong Kong against exceptional 2007 (PBT flat, excl. impairments in regional strategic investments)
• Record performance in Rest of Asia-Pacific, excl Middle East (PBT + 58%, excl. dilution gains)
• North America suffers weak economy and market turmoil
Geographic performance Customer Group performance• Good growth in Personal Finance Services, excl.
US (PBT +33%)
• Commercial Banking, strong performance (PBT +35%)
• Global Banking and Markets – emerging markets strength profitable (PBT -35%, +37% v 2H07)
• Private Banking continued growth (PBT +5%)
• US Personal Financial Services loss making but reduced from level in 2H07
Operating performance
• Strong cost control• Brand strength evident in flight to quality• Benefits of ‘Joining Up the Company’ being realised
39

Stephen GreenOutlook

Outlook
The World HSBC
41
• Near-term outlook remains negative with significant uncertainty
• Pressure from inflation on growth in some fast-growing economies
• Decline in credit availability as financial markets deleverage increases risk of delinquency and default
• Emerging market growth expected to hold up reasonably well, albeit with less momentum
• Our strategy continues to be aligned with global trends
• Advantages: – Strong brand
– Capital and liquidity strength– Broad-based business with international
connectivity• World’s leading international bank in
emerging markets

Appendix

Appendix contents
43
Asia 44Hong Kong 45Rest of Asia-Pacific (excl. Middle East) 46Middle East 47Latin America 48North America 49Europe 50Profit (loss) before tax by country 51-52Personal Financial Services 53Commercial Banking 54Global Banking and Markets 55Private Banking 56HSBC Finance Corporation 57-68

Asia
Customer lending, 30 June 2008, US$bn
Profit before tax, 1H08, US$mGrowth in profit before tax (%)1
US$6,697m
Business mix
US$213.5bnOther
Note: (1) Excludes gains arising from dilution of interests in Chinese and other associates
Other -623 (-9%)
1H08 vs 1H07+14
-18n/a
+35+53
+20
-40 -20 0 20 40 60
Personal Financial ServicesCommercial Banking
Global Banking and MarketsPrivate Banking
OtherTotal
1H08 vs 2H07
-6
-2+22
+14
n/a
(10) 0 10 20 30
Personal Financial ServicesCommercial Banking
Global Banking and MarketsPrivate Banking
OtherTotal
2,571 (38%)2,742 (41%)
1,830 (27%)
177 (3%)
78.5 (37%)55.3 (26%)
69.5 (32%)
8.2 (4%)2.0 (1%)
0
44

Hong Kong
Customer lending, 30 June 2008, US$bn
1.8 (2% )4.9 (5% )
20.3 (20% )
32.1 (32% )
40.6 (41% )
+7+14
+10-24
-8-290
-300 - 20 0 20
Personal Financial ServicesCommercial Banking
Global Banking and MarketsPrivate Banking
OtherTotal
123 (4%)
770 (25%)
869 (28%)
2,036 (66%)
Growth in profit before tax (%)
US$3,073m
Business mix
US$99.7bn
Other -725 (-23%)
Profit before tax, 1H081, US$m
1H08 vs 2H07
+1
-23
-15-13
-284
-12
-300 - 20 0 20
Personal Financial ServicesCommercial Banking
Global Banking and MarketsPrivate Banking
OtherTotal
1H08 vs 1H07
Notes: (1) Decrease reflects impairment of US$296m in the value of several of HSBC’s strategic investments in the region(2) Fall in PBT for PFS 1H08 vs 2H07 reflects impact of decline in global equity markets
on fee income and investor return on securities held by insurance
1
3
2
4
3
1
(3) Reduced PBT resulted from diminished demand for equity-related structured products(4) Decline in PBT due to write-downs in monoline exposures and weaker trading markets
45

Rest of Asia-Pacific (excl. Middle East)
0.2 (0%)
28.6 (32%)
3.3 (4%)
25.3 (29%)
31.4 (35%)
57 (2%)52 (2%)
1,546 (59%)
653 (25%)
326 (12%)
Growth in profit before tax (%)1
US$2,634m
Business mix
US$88.8bn
Customer lending, 30 June 2008, US$bn
Profit before tax, 1H08, US$m 1H08 vs 1H07
1H08 vs 2H071
+44
-5-53
+73+75
+58
-60 -40 -20 0 20 40 60 80
Personal Financial ServicesCommercial Banking
Global Banking and MarketsPrivate Banking
OtherTotal
+13
+53-2
+33+42
+34
-60 -40 -20 0 20 40 60 80
Personal Financial ServicesCommercial Banking
Global Banking and MarketsPrivate Banking
OtherTotal
Note: (1) Excludes gains arising from dilution of interests in Chinese and other associates
46

Middle East
Customer lending, 30 June 2008, US$bn
Profit before tax, 1H08, US$m
6.4 (26%)
12.1 (48%)
6.5 (26%)
2 (0%) 45 (5%)
426(43%)
308 (31%)
209 (21%)
Growth in profit before tax (%)
US$990m
Business mix
US$25.0bn
1H08 vs 1H07
1H08 vs 2H07
+67
+100+2
+40+97
+63
0 20 40 60 80 100 120
Personal Financial ServicesCommercial Banking
Global Banking and MarketsPrivate Banking
OtherTotal
+74
+18+41
+53+18
0 20 40 60 80
Personal Financial ServicesCommercial Banking
Global Banking and MarketsPrivate Banking
OtherTotal
0
47

Latin America
-7
-47n/a
+6+45
+7
-60 -40 -20 0 20 40 60
Personal Financial ServicesCommercial Banking
Global Banking and MarketsPrivate Banking
OtherTotal
10.7 (20% )
19.1 (35% )
24.5 (45% )
8 (1%)383 (30%)
411 (32%)
468 (37%)
US$1,266m
Business mix
US$54.3bn
Growth in profit before tax (%)
Customer lending, 30 June 2008, US$bn
Profit before tax, 1H08, US$m
Other -4 (0%)
1H08 vs 1H07
1H08 vs 2H07
+21
-20n/a
+27
+51+17
-40 -20 0 20 40 60
Personal Financial ServicesCommercial Banking
Global Banking and MarketsPrivate Banking
OtherTotal
Note: (1) Improved performance in Brazil was offset by expenditure in Mexico
1
48

North America
Personal Financial Services 1,488 (2,050)Commercial Banking 477 430 Global Banking and Markets 436 (1,625)Private Banking 60 58 Other (26) 294 Total 2,435 (2,893)
Profit (loss) before tax, US$m 1H07 1H08
5.7 (2%)27.1 (10%)
37.8 (14%)201.9 (74%)
Business mix
US$272.5bn
Growth in profit before tax (%)
Customer lending, 30 June 2008, US$bn
1H08 vs 1H07
1H08 vs 2H07
-238
-3
-10-473
-219n/a
-600 -400 -200 0
Personal Financial ServicesCommercial Banking
Global Banking and MarketsPrivate Banking
OtherTotal
+32
-49-81
-23
-16-3
-100 0 100
Personal Financial ServicesCommercial Banking
Global Banking and MarketsPrivate Banking
OtherTotal
49

Europe
31.9 (6%)
210.7 (42%)
111.8 (22%)
153.5 (30%)
144 (3%)579 (11%)
1,190 (23%)
1,940 (37%)
1,324 (26%)
US$5,177m
Business mix
US$509.0bn
Growth in profit before tax (%)
Customer lending, 30 June 2008, US$bn
Profit before tax, 1H08, US$m 1H08 vs 1H07
1H08 vs 2H07
+36
+37-86
+14
+40+52
-100 0 100
Personal Financial ServicesCommercial Banking
Global Banking and MarketsPrivate Banking
OtherTotal
Other 1.1 (0%)
+119
+17+235
+28
-29+57
-100 0 100 200 300
Personal Financial ServicesCommercial Banking
Global Banking and MarketsPrivate Banking
OtherTotal
50

Profit (loss) before tax by country
US$m 1H07 2H07 1H08 1H08 vs 1H07 1H08 vs 2H07% change
Hong Kong 3,330 4,009 3,073 -8 -23Rest of Asia-Pacific 3,344 2,665 3,624 +8 +36Australia 51 73 100 +96 +37India 299 230 371 +24 +61Indonesia 58 46 66 +14 +43Japan 18 25 4 -78 -84Mainland China 1,549 812 907 -41 +12
Associates 1,463 717 748 -49 +4Associates, excluding dilution gains 387 717 748 +93 +4Other mainland China 86 95 159 +85 +67
Malaysia 145 185 209 +44 +13Middle East 606 701 990 +63 +41
Egypt 72 81 115 +60 +42United Arab Emirates 295 322 522 +77 +62Other Middle East 128 172 178 +39 +3Total Middle East (excl. Saudi Arabia) 495 575 815 +65 +42Total Saudi Arabia 111 126 175 +58 +39
Singapore 267 283 340 +27 +20South Korea 58 65 177 +205 +172Taiwan 43 80 115 +167 +44Other Rest of Asia-Pacific 250 165 345 +38 +109
51

Profit (loss) before tax by country
US$m 1H07 2H07 1H08 1H08 vs 1H07 1H08 vs 2H07% change
Latin America 1,000 1,178 1,266 +27 +7Mexico 475 505 385 -19 -24Brazil 360 519 660 +83 +27Argentina 95 106 119 +25 +12Panama 39 47 63 +62 +34Other Latin America 31 1 39 +26 n/aNorth America 2,435 (2,344) (2,893) -219 -23United States 1,849 (2,915) (3,481) -288 -19Canada 493 490 494 - +1Bermuda 93 80 94 +1 +18Other North America - 1 - - n/aEurope 4,050 4,545 5,177 +28 +14United Kingdom 2,406 3,386 3,479 +45 +3France 712 321 709 - +121Germany 169 126 155 -8 +23Malta 79 78 71 -10 -9Switzerland 260 215 335 +29 +56Turkey 161 175 126 -22 -28Other Europe 263 244 302 +15 +24
52

Personal Financial Services
+14
-238
-51
+119
+21
-300 -200 -100 0 100 200
Asia
Latin America
Europe
North America
Total
Asia 2,571 111
Latin America 468 20
Europe 1,324 57
North America (2,050) (88)
Total 2,313 100
Profit (loss) before tax, 1H08 US$m %
201.9 (44% )
153.5 (34% )
24.4 (5% )
78.5 (17% )
US$458.3bn
Customer lending, 30 June 2008, US$bn
1H08 vs 1H07
1H08 vs 2H07
-6
+32
+98
+36
-7
-20 0 20 40 60 80 100 120
Asia
Latin America
Europe
North America
Total
Regional mix Growth in profit before tax (%)
53

Commercial Banking
37.8 (16% )
111.8 (47% )19.0 (8% )
69.5 (29% )
430 (9%)
411 (9%)
1,940 (42%)
1,830 (40%)
US$4,611m
US$238.1bn
Customer lending, 30 June 2008, US$bn
Profit before tax, 1H08, US$m 1H08 vs 1H07
1H08 vs 2H07
+14
-3
+24
+52
+6
-20 0 20 40 60
Asia
Latin America
Europe
North America
Total
Regional mix Growth in profit before tax (%)
+35
-10
+35
+57
+17
-20 0 20 40 60 80
Asia
Latin America
Europe
North America
Total
54

Global Banking and Markets
1H07 1H08Global Markets 3,825 1,688Global Banking 1,974 2,432Balance Sheet Management 521 1,630Global Asset Management 636 669Principal Investments 755 167Other 826 833Total operating income 8,537 7,419
Profit (loss) before tax, 1H08 US$m %
Management view of total operating income, US$m
Asia 2,742 102
Latin America 383 14
Europe 1,190 44
North America (1,625) (60)
Total 2,690 100
1H08 vs 1H07
1H08 vs 2H07
+22
-16
+37
+40
+45
-20 0 20 40 60
Asia
Latin America
Europe
North America
Total
+53
+51
-29
-35
-473
-500 -50 0 50 100
Asia
Latin America
Europe
North America
Total
Growth in profit before tax (%)Regional mix
55

Private Banking
31.9 (70% )
5.7 (12% ) 8.3 (18% )
58 (7%)
579 (70%)
8 (1%)
177 (22%)
US$822m
US$45.9bn
Customer lending, 30 June 2008, US$bn
Profit before tax, 1H08, US$m 1H08 vs 1H07
1H08 vs 2H07
-2
-49
+12
+37
-47
-60 -40 -20 0 20 40 60
Asia
Latin America
Europe
North America
Total
-18
-3
+5
+17
-20
-30 -20 -10 0 10 20
Asia
Latin America
Europe
North America
Total
Regional mix Growth in profit before tax (%)
56

HSBC Finance CorporationKey developments
57
• Continued focus on positioning businesses for the future – Launched a new program through our Consumer Lending (CL) business along with an affiliate, HSBC Bank USA, to sell real estate secured
receivables to the Federal Home Loan Mortgage Corporation (“Freddie Mac”). Program has been launched in six states and we anticipate a nation-wide rollout of the program during the third quarter of 2008
– Sold our U.K. business to HSBC Overseas Holdings (U.K.) Limited, a subsidiary of HSBC Holdings plc in 1H08 to focus our operations on North America. As a result, the U.K. business results have been presented as discontinued operations
– As of June 30, 2008, the sold U.K. business held US$5.0 billion of customer loans and advances with a 2+ delinquency ratio of 7.8%
– Exited all Taxpayer Financial Services independent relationships except H&R Block
– In July 2008, decision was made to discontinue new motor vehicle loan originations from the dealer and direct-to-consumer channels. However, we intend to continue offering motor vehicle loans in our Consumer Lending branch offices supported by the direct-to-consumer channel until a third party provider is arranged. We will honor all outstanding loan commitments to our customers
– In July 2008, decided to sell the common stock of HSBC Financial Corporation Limited, the holding company for our Canadian business to an HSBC affiliate. Subject to regulatory approval, it is anticipated that ultimate ownership of the Canadian operations will reside with HSBC Bank Canada. Projected aggregate sales price will be established based upon a third party valuation but is expected to be between US$325 million and US$365 million. Sale is expected to close in the fourth quarter of 2008, subject to certain approvals
• Delinquency dollars and ratios continued to increase on a continuing operations basis in most products as home prices continued to decline in certain markets during the first half of 2008, unemployment rates continued to rise in those same areas and gasoline and home energy cost increases had an impact on the ability of some borrowers to make payments on their loans – While delinquencies have increased, the rate of delinquency increase has declined in part due to increased collection efforts and favorable
customer payment experience coinciding with the federal economic stimulus package
– Gross delinquency dollars for the Mortgage Services portfolio have stabilized over the last three quarters

HSBC Finance Corporation Key developments, continued
58
• Continued focus on managing risks, delinquencies and right sizing strategies of our businesses and product offerings to enhance value to our customers and reduce risk for our stakeholders– Decreased the size of overall customer loans and advances portfolio
– Reduced Consumer Lending branch network to about 900 branches from approximately 1,000
– Continued to tighten underwriting standards in all businesses
– Reduced available credit lines in our credit card portfolio
– Canadian operations sold a small mortgage brokerage firm
– Focus on cost containment measures and improving our cost efficiency ratio
• Expanded outreach and assistance to our mortgage customers– Modified 1,837 loans ahead of ARM resets with an aggregate balance of US$328 million in the first half of 2008
– Modified approximately 12,200 loans ahead of ARM resets with an aggregate balance of US$2.0 billion since October 2006. Approximately US$692m of ARM loans modified under this program will experience the first rate reset in H208. 76 percent of outstanding loans and advances granted a modification under this program are less than 60-days delinquent and 9 percent of these loan balances modified have paid in full
– Expanded our foreclosure avoidance/account modification programs to qualify more customers for payment relief with longer term modifications (generally either two or five years) with potentially lower interest rates. Modified 32,288 accounts year to date through these programs
– Supported a variety of national and local efforts in homeownership preservation and foreclosure avoidance
• Actions taken highlight HSBC’s commitment to our stakeholders and businesses– Capital infusion of US$2.2 billion from HSBC Holdings plc in the first half of 2008
– In February 2008, appointed Brendan McDonagh as CEO of HSBC North America Holdings Inc and Niall Booker as CEO of HSBC Finance Corporation

HSBC Finance Corporation – financial results
US$m 1H07 2H07 1H08 % Better/(Worse)vs.1H07 vs.2H07
Net operating income before loan impairment charges $8,001 $9,508 $7,970 -0.40% -16.20%
Loan impairment and other related charges (3,734) (7,996) (6,686) (79.10%) 16.40%
Net operating income 4,267 1,512 1,284 (69.90%) (15.10%)
Total operating expenses, excluding goodwill impairment (2,871) (2,802) (2,458) 14.40% 12.30%
Goodwill impairment (5,549) 0.00% 100.00%
Profit (Loss) from continuing operations before tax (1) 1,396 (6,839) (1,174) (184.10%) 82.80%
Profit (Loss) from discontinued U.K. operations before tax (2) (282) (867) (388) (37.60%) 55.20%
Profit (Loss) before tax 1,114 (7,706) (1,562) (240.20%) 79.70%
Cost efficiency ratio from continuing operations (3) 35.90% 29.50% 30.80% 510 bps (130) bps
Cost efficiency ratio from continuing operations - normalized (4) 36.60% 34.70% 31.90% 470 bps 280 bps
Customer Loans & Advances (as at period end) 178,222 177,732 160,933 (9.70%) (9.50%)
Fair value option (FVO) income included above 161 1,422 270 67.70% (81.00%)Profit/(Loss) before tax excluding FVO 953 (9,128) (1,832) (292.20%) 79.90%
Note: The figures above are presented on an IFRS Management Basis. See Note 11 ‘Business Segments’ of Form 10-Q for the period ended 30 June 2008 for a reconciliation of IFRS to US GAAP(1) 2H07 loss before tax from continuing operations excluding goodwill impairment impact of US$5,549 million (US$3,730 million relating to Consumer Lending business, US$1,343 million related to
Mortgage Services and US$476 million related to Motor Vehicle Finance business) is (US$1,290) million(2) 2H07 loss from discontinued U.K. operations before tax excluding goodwill impairment impact of US$410 million is (US$458) million. 1H08 loss from discontinued U.K. operations before tax
excluding loss on sale of U.K. operations to an affiliate of US$375 million is (US$13) million(3) Cost efficiency ratio from continuing operations before tax excluding the impact of the goodwill impairment charge of US$5,549 million in 2H07(4) Cost efficiency ratio from continuing operations before tax excluding the impact of the goodwill impairment charge of US$5,549 million in 2H07, also normalized to exclude the impact of fair value
option income of US$161 million, US$1,422 million and US$270 million for 1H07, 2H07 and 1H08, respectively
59

HSBC Finance Corporation – H108 Highlights
60
• 1H08 loss before tax from continuing operations of US$1,174 million was US$2,570 million below prior year, primarily due to higher loan impairment charges of US$3.0 billion partially offset by lower operating expenses (US$0.4 billion)
• Net operating income before loan impairment charges from continuing operations was broadly flat with 1H07 as overall lower borrowing costs along with higher revenues from the Card and Retail Services (CRS) business were offset by lower revenues from the Mortgage Services (MS) and Consumer Lending businesses– Card and Retail Services revenues increased due to higher net interest income and other income from higher average loan balances along with lower
interest expense. This benefit was partially offset by lower other income following changes in billing practices implemented in the fourth quarter of 2007 and higher delinquencies
– Mortgage Services and Consumer Lending revenues decreased as a result of lower yields from higher delinquencies and product mix shift along with increased losses on REO portfolio partially offset by the closure of the Decision One operations in 2007. Mortgage Services results were also impacted by lower average loan balances
• 1H08 loan impairment charges from continuing operations increased US$3.0 billion (or 79%) from 1H07 largely driven by impairment increases in our real estate secured (US$1.6 billion), credit card (US$0.5 billion), private label (US$0.4 billion), personal non-credit card (US$0.3 billion) and motor vehicle finance (US$0.1 billion) portfolios – Loan impairment charges increased within the Consumer Lending business as the U.S. residential market further deteriorated and credit conditions
continued to tighten for a broad segment of customers, removing refinancing alternatives. In addition, lower loans and advances run-off, portfolio seasoning, rising unemployment rates in certain markets and continued weakening of the U.S. economy have had an impact
– Mortgage Services continued to experience higher loan impairment charges and delinquencies as portions of this portfolio purchased in 2005 and 2006 continued to season. In addition, this portfolio has also been impacted by worsening industry trends and slower loans and advances run-off
– Card and Retail Services business experienced higher loan impairment charges from higher average loan balances, product mix changes, portfolio seasoning, an increase in bankruptcy filings and the effect of a weakening U.S. economy
– Motor Vehicle Finance business was impacted by higher severity due to falling values of SUVs and trucks
• 1H08 operating expenses from continuing operations decreased US$413 million (or 14%) from 1H07– Staff costs decreased as a result of strategic actions in 2007 to discontinue new correspondent channel acquisitions, cease Decision One operations and
right-size the branch network. Further consolidation was done in 2008– Marketing expenses decreased primarily due to strategic decision to slow loan growth in our credit card portfolio– Efforts resulted in improved normalized cost efficiency ratio from continuing operations year over year of 470bps

HSBC Finance Corporation2+ delinquency ratio
2.0%4.0%6.0%8.0%
10.0%12.0%14.0%16.0%
Q1 07 Q2 07 Q3 07 Q4 07 Q1 08 Q2 08R/E Secured - 1st Lien R/E Secured - 2nd Lien Credit Card Private LabelMotor Vehicle Finance Personal Non-Credit Card Non - U.S. Total
7.8%
12.5%
5.7%3.6%3.5%
15.4%
4.8%7.7%
• Increase in total 2+ delinquency (27 basis points over 1Q08) reflects the continuing weakening of the housing and mortgage industry and rising unemployment rates in certain markets as well as the impact of broader weakening in the U.S. economy, partially offset by extended seasonal factors due to the federal economic stimulus package and improvements in collection activities during the first half of the year
• First and second lien real estate secured 2+ delinquency ratios were also negatively impacted by decreased principal balances from the continued liquidation of our Mortgage Services portfolio and lower outstanding balances from product offering changes in our Consumer Lending business
• 2+ delinquency in our credit card portfolios decreased as extended seasonal factors due to the federal economic stimulus package and improvements in collections were partially offset by continued deterioration in the marketplace and weakened economic conditions, portfolio seasoning, a higher mix of non-prime credit card loans, and lower loan balances following actions implemented since the fourth quarter of 2007 to slow loan and account growth
• The increase in the 2+ delinquency ratio in our motor vehicle finance portfolio reflects deterioration of marketplace and broader economic conditions and to a lesser extent, the impact of lower receivable levels due to lower origination volumes, partially offset by improvements in collection activities
• Personal non-credit card 2+ delinquency ratio increased as a result of portfolio seasoning, deterioration due to marketplace and broader economic conditions partially offset by improvements in collection activities. Lower receivable levels due to our risk mitigation efforts also contributed to the increase
• Decline in Non-U.S. portfolio reflects the sale of the U.K. operationsNote: See ‘Credit Quality’ in the MD&A of Form 10-Q for the period ended 30 June 2008 for delinquency information reported on a US GAAP basis.
61

HSBC Finance CorporationU.S. Real estate secured 2+ delinquency
• 2005 and 2006 vintages in Mortgage Services continue to season and progress as expected into later stages of delinquency as run-off slows as customers have fewer refinancing options. Gross delinquency dollars have stabilized within Mortgage Services. As the portfolio continues to decline, the delinquency ratio may continue to increase although dollar amount of delinquencies may fall depending on underlying economic circumstances
• Consumer Lending real estate secured delinquencies increased as credit performance continued to deteriorate from continued weakening in the housing and mortgage industry, rising unemployment rates and continued weakening in the U.S. economy. The rise in the delinquency ratio is also a result of lower loans and advances levels
1.7 1.9 2.4 3.0 3.2 3.20.7
0.8
1.1 1.0 0.9
0.8 0.9 1.3 1.6 2.0 2.20.30.3
0.50.5 0.6
0.6
0.21.1
2.3
3.2
1.6
4.1
2.1
4.2
2.5
4.1
2.8
1.1
2.6
0.0
1.0
2.0
3.0
4.0
5.0
1Q 07 2Q 07 3Q 07 4Q 07 1Q 08 2Q 082+ d
elin
quen
cies
(US$
bill
ions
)
2+ MS First Lien 2+ MS Second Lien2+ CL First Lien 2+ CL Second Lien
4.55.8
7.5
10.311.6 12.2
6.47.9
11.2
15.416.9 16.6
2.2 2.9 3.7 4.5 5.23.3 3.6
5.07.0 8.0
9.0
2.002468
1012141618
1Q07 2Q07 3Q07 4Q07 1Q08 2Q08
2+ d
elin
quen
cies
(%)
2+ MS 1st Lien (%) 2+ MS 2nd Lien (%)2+ CL RE 1st Lien (%) 2+ CL RE 2nd Lien (%)
62

HSBC Finance CorporationImpairment allowance – MS and CL real estate secured
$1,751
$509
$440$478
($259)
$543
($186)
$659
($140)
($311)
-
500
1,000
1,500
2,000
June2007
Q3 C/O
Q3 LIC
Q4 C/O
Q4 LIC
Q1 C/O
Q1 LIC
Q2C/O
Q2 LIC
Other June2008
US$m
$18
• Mortgage Services loan impairment charges relatively stable quarter over quarter in 2008
• Consumer Lending real estate secured reserves markedly increased from 2Q07 as a result of higher delinquency and loss estimates from current housing market trends and reduced secondary market liquidity limiting home buyer financing options. However, loan impairment charges have decreased over last 3 quarters
• The increasing net charge-offs in the loan portfolios reflected higher severity especially in 2nd liens
$2,096
$3,780$919
( $406)
$670
( $468)
$1,634
( $722)
$969
( $876)
( $36)
-500
1,0001,5002,0002,5003,0003,5004,000
June2007
Q3 C/O
Q3 LIC
Q4 C/O
Q4 LIC
Q1 C/O
Q1 LIC
Q2C/O
Q2 LIC
Other June2008
US$m
Mortgage Services Consumer Lending Real Estate Secured
Note: C/O = Net Charge-offs (amounts written off)LIC = Loan Impairment Charge
63

HSBC Finance CorporationImpairment allowance – Card and Retail Services
Card and Retail Services • CRS reserves increased from prior year as a result of higher delinquency and loss estimates from higher levels of non-prime receivables, portfolio seasoning, higher levels of bankruptcy filings, lower recovery estimates and the continuing deterioration in the marketplace and broader economic conditions
$2,410
($17)
($1,042)
($674)
$1,058
($798)
$1,382
($969)
$1,024$1,236 $3,610
-
500
1,000
1,500
2,000
2,500
3,000
3,500
4,000
June2007
Q3 C/O
Q3 LIC
Q4 C/O
Q4 LIC
Q1C/O
Q1 LIC
Q2C/O
Q2LIC
Other June2008
US$m
Note: C/O = Net Charge-offs (amounts written off)LIC = Loan Impairment Charge
64

31.533.936.238.941.546.7
49.049.950.249.948.847.629.329.431.029.929.327.8 17.417.418.717.717.417.3 12.512.812.912.912.712.6 16.917.618.318.618.618.6 9.910.410.49.99.54.3
160.9170.9177.7178.3178.2180.1
0.0
40.0
80.0
120.0
160.0
200.0
2Q081Q084Q073Q072Q071Q07
US$bn
Mortgage Services CL Real Estate Secured Credit Cards Private Label Cards
Motor Vehicle Finance Other Non - U.S.
HSBC Finance CorporationCustomer loans and advances
• Decreases in customer loans and advances compared to 1Q08 reflects the sale of the U.K business to an affiliate, changes in product offerings, risk appetite and business strategy actions, including reductions in branch offices, tightening in underwriting standards and a portfolio reclassification to loans held for sale designation
• Reductions in the Mortgage Services and CL real estate secured portfolios were partially offset by a decline in loan prepayments which has continued during 2Q08
• Decrease in credit card loans and advances compared to 1Q08 was due to strategic initiatives to slow receivable growth• Canada motor vehicle finance portfolio (US$0.3 billion) was reclassified to loans held for sale, a component of other assets, in 2Q08. On a US
GAAP basis, a total of US$9.4 billion was classified as loans held for sale in Q2 08 including a planned transfer of the GM credit card portfolio to HSBC USA Inc. of US$6.3 billion. We will maintain reporting of GM credit card portfolio on management basis as HSBC Finance Corporation will continue to manage and service the portfolio after the transfer
65

$40.2 bn28%
13%
11%
86%
19%
22%
8%
24%
52%
32%
6%
24%
13%
36%
5%
18% 3%
0% 20% 40% 60% 80% 100%
$40.7 bn
$2.7 bn
$6.5 bn
$0.3 bn
December 2007 June 2008
First Lien Fixed
First Lien ARM
Second Lien Fixed
Second Lien ARM$0.4 bn
$2.3 bn
$6.1 bn
2004 and prior 2005 2006 2007 2008
26%
12%
35%
25%
48%
33%
7%
19%
21%
19%
8%
30%
13%
19%
85%
0% 20% 40% 60% 80% 100%
Consumer LendingReal Estate Loans by vintage and type
Vintages (US$bn)
December 2007 June 2008
2008 - 2.3 2007 13.1 12.32006 13.6 12.72005 9.8 92004 and prior 13.7 12.7
50.2 49.0
66

15%
7%
6%
10%
26%
10%
5%
20%
45%
52%
35%
29%
38%
37%
50%
10%
4% 1%
0% 20% 40% 60% 80% 100%
December 2007
9% 29%
36%
36%
20%
46%
54%
36%
27%
11%
4%
5%
15%
7%
5%1%
51% 8%
0% 20% 40% 60% 80% 100%
$1.8 bn
$4.9 bn
$14.3 bn
$15.2 bn
June 2008
First Lien Fixed
First Lien ARM
Second Lien Fixed
Second Lien ARM$1.5 bn
$11.8 bn
$14.2 bn
$4.0 bn
Pre-2004 2004 2005 2006 2007
Mortgage ServicesReal Estate Loans by vintage and type
Vintages (US$bn)
December 2007 June 2008
2007 1.5 1.52006 12.2 10.82005 12.9 10.72004 5.9 5.2Pre-2004 3.7 3.3
36.2 31.5
67

HSBC Finance CorporationOngoing areas of focus
68
• Recreate the value of our core Consumer Lending business and reposition for long-term success
• Deliver high brand values and strong customer value proposition in our products and services
• Manage collection resources and evolve collection strategies, including wider range of modification programs to help our customers
• Achieve a balance sheet size consistent with our desired risk profile and the current funding environment– Maintain desired capital ratios and liquidity
• Continue liquidation of Mortgage Services portfolio• Continue cost reduction and streamline operations across the organization,
right-sizing in markets experiencing fundamental change• Continue progress of the US Card business role in developing the global
cards business