HSBC - Abundant Scarcity
166
The capital intensity of fibre is now improving fixed-line competitive dynamics and pricing conditions Mobile capacity constraints are starting to make their effect felt, both in terms of capex and better tariffs European cable operators, mobile players (Vodafone) and some vendors (Ericsson) are best placed Disclosures and Disclaimer This report must be read with the disclosures and analyst certifications in the Disclosure appendix, and with the Disclaimer, which forms part of it Abundant Scarcity Pricing power is returning to telecoms Global Telecoms, Media & Technology – Equity February 2011
-
Upload
laurent-barbezieux -
Category
Documents
-
view
286 -
download
11
Transcript of HSBC - Abundant Scarcity

*Employed by a non-US affiliate of HSBC Securities (USA) Inc, and is not registered/qualified pursuant to FINRA regulations.
Ab
un
dan
t Scarc
ity
The capital intensity of fibre is now improving fixed-line competitive dynamics and pricing conditions
Mobile capacity constraints are starting to make their effect felt, both in terms of capex and better tariffs
European cable operators, mobile players (Vodafone) and some vendors (Ericsson) are best placed
Disclosures and Disclaimer This report must be read with the disclosures and analyst
certifications in the Disclosure appendix, and with the Disclaimer, which forms part of it
Glo
bal T
ele
co
ms, M
ed
ia &
Tech
no
log
y –
Eq
uity
Feb
ruary
2011
Abundant ScarcityPricing power is returning to telecoms
Global Telecoms, Media & Technology – Equity
February 2011
Main Contributors
Luis A Hilado*Analyst, Global Telecoms, Media & Technology ResearchThe Hongkong and Shanghai Banking Corporation Limited, Singapore+65 6239 [email protected]
Luis Hilado joined HSBC in 2010 from a US investment bank, where he covered the SE Asia telecom sector. He has over 15 years of equity research experience primarily covering SE Asia telecoms. Luis held a number of positions on the sell-side including Head of Research, Philippines for a European stock brokerage. He holds a BA in Economics and a BS in Commerce and BusinessManagement from De La Salle University.
Dominik Klarmann*, CFAAnalyst, Global Telecoms, Media & Technology ResearchHSBC Trinkaus & Burkhardt AG, Dusseldorf+49 211 910 2769 [email protected]
Dominik Klarmann has worked as a telecoms analyst since 2007. He obtained a degree in management at Bamberg and Madrid Universityin 2004. He has been with HSBC since 2007, having previously worked in management consulting and investor relations at Deutsche TelekomAG. Dominik is a CFA charterholder.
Richard DineenAnalyst, Global Telecoms, Media & Technology ResearchHSBC Securities (USA) Inc, New York+1 212 525 [email protected]
Richard joined HSBC in 2004 to work on the Global Telecoms Research team, with a particular emphasis on technology strategy. Prior tothis, he was research director for Mobile Telecoms at Ovum, a highly respected industry analyst firm, where he spent seven years.
Hervé Drouet*Analyst, Global Telecoms, Media & Technology ResearchHSBC Bank plc+44 20 7991 [email protected]
Hervé has been covering GEMs/CEEMEA Telecoms research for more than 9 years and has been ranked highly and regularly acrossnumerous external surveys. Prior to this, he worked as a senior management consultant in the TMT practice at Deloitte Consulting. He has15 years experience in the Media, Telecoms and Technology sectors, having worked previously as a project manager for SchlumbergerTechnologies. He holds a Full time MBA from London Business School and graduated from Ecole Supérieure d'Ingénieurs enElectrotechnique et Electronique in France.
Tucker Grinnan*Analyst, Global Telecoms, Media & Technology ResearchThe Hongkong and Shanghai Banking Corporation Limited, Hong Kong+852 2822 [email protected]
Tucker joined HSBC in November 2005 and has 15 years of experience as an analyst in the telecommunications, media and technologyindustries. Prior to joining HSBC, he spent five years as a head of regional telecoms for Asia and Latin America. Tucker also spent five yearswith a management consulting firm servicing clients in telecommunications and media. He holds degrees from the University of Virginiaand George Washington University.
Neale Anderson*Analyst, Global Telecoms, Media & Technology ResearchThe Hongkong and Shanghai Banking Corporation Limited, Hong Kong+852 2996 [email protected]
Neale Anderson joined HSBC in March 2007. Previously he spent seven years at the specialist consultancy Ovum, where he was ResearchDirector for Asia-Pacific telecommunications markets. He holds a BA from Oxford University and an MA in Advanced Japanese Studiesfrom Sheffield University.
Nicolas Cote-Colisson*Head of European Telecoms, Media & Technology ResearchHSBC Bank plc+44 20 7991 [email protected]
Nicolas joined HSBC in 2000 as a telecoms analyst in the Global Telecoms research team. Prior to that, he worked as an economist with CCFin Paris for five years and also with the French Ministry of Finance. Nicolas holds a DEA in Econometrics from Paris la Sorbonne.
Kunal Bajaj*Analyst, Global Telecoms, Media & Technology ResearchHSBC Bank Middle East Limited, Dubai+9714 507 [email protected]
Kunal joined HSBC in 2005. Before covering Middle Eastern telecoms, he was a member of HSBC’s EMEA telcos team, working on Eastern European and South African telecoms companies. Kunal is a Chartered Accountant and has an MBA in Finance.
Stephen Howard*Head, Global Telecoms, Media & Technology ResearchHSBC Bank plc+44 20 7991 [email protected]
Stephen Howard is Head of the Global Telecoms, Media & Technology Research team. He has covered the telecoms sector since joiningHSBC in 1996. He also brings experience in the technology industry, having worked previously with IBM.
Luigi Minerva*Analyst, Global Telecoms, Media & Technology ResearchHSBC Bank plc+44 20 7991 [email protected]
Luigi joined HSBC in 2005 as a telecoms analyst in the Global Telecoms Research team. Before this, he was a buy-side analyst at a fundmanager, having previously worked in the Telecoms Practice of McKinsey & Co based in Milan. Luigi holds a Masters in Finance from theLondon Business School and an M.Sc. in Economics and Econometrics from the University of Southampton.
Steve Scruton*Head of Equity Research, CEEMEAHSBC Bank plc+44 20 7992 [email protected]
Steve Scruton is the Head of Equity Research, CEEMEA. He has been with HSBC since 1997, and was previously the co-head of Global TMTin London and Head of Research, Bangalore, a team that provides support to Global Research across countries, sectors, products andservices. Prior to joining HSBC, Steve worked with British Petroleum, Cable & Wireless and a banking house in London.
110214_28253 Telecoms thematic - Stephen Howard_R3:Layout 1 2/16/2011 1:09 AM Page 1
1
Telecoms, Media & Technology – Equity 16 February 2011
abc
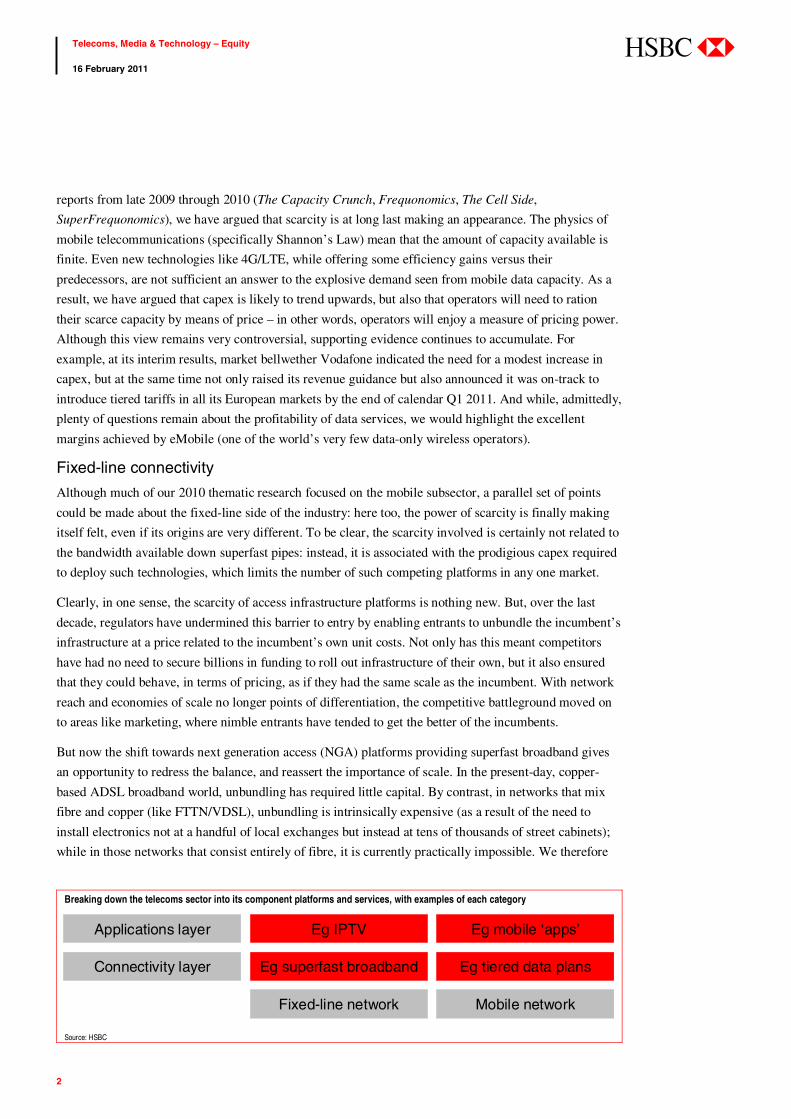
Abundant scarcity One way to think about the telecoms sector’s complexities is to break it down into its constituent portions.
A popular division is frequently made between the fixed-line (wireline) and mobile (wireless) portions of
the industry. We would overlay this with a second distinction: between the provision of connectivity (ie
raw bandwidth or capacity) and applications (ie the services that exploit the underlying connectivity).
Combined, this approach yields a two-by-two grid that acts as a convenient means of analysing the sector.
Focusing first on the connectivity layer, our argument is that there is much to play for. The key quality to
bear in mind is scarcity. We believe that this vital ingredient has been largely missing in both the fixed-
line and mobile elements of the sector over the last decade, but is now making a reappearance; as a
consequence, we think that telecoms should – at long last – begin to enjoy a measure of pricing power.
This is of tremendous importance: volumes in telecoms traditionally look after themselves; the problem is
that price deflation is commonly still more powerful, with the result that revenues decline. But if prices
fall less rapidly, the growth in volumes actually has the chance to translate into growth in revenues.
Mobile connectivity
Take the mobile subsector. Although this part of the industry enjoyed heady growth in the late 1990s,
since then the relentless deflationary nature of pricing has taken its toll. However, in a series of research
Summary
A degree of pricing power is (at long last) becoming apparent in the telecoms sector, thanks to scarcity emerging as a factor on both the fixed-line and the mobile sides of the industry. In fixed line, the capital required in the shift from copper-based infrastructure to fibre platforms is re-asserting the importance of scale at the expense of the unbundlers, and resulting in a more benign pricing environment. Meanwhile, in mobile, the intrinsically finite nature of cellular resource has already led operators to begin rationing capacity on price. In view of this new-found ‘abundant scarcity’, we believe that the prospects for monetising connectivity services look very encouraging. Alas, we are much less sanguine about the operators’ ability to monetise the applications that run over this connectivity (such as IPTV or mobile ‘apps’). In our opinion, the connectivity opportunity will have to suffice – but it is enough.
2
Telecoms, Media & Technology – Equity 16 February 2011
abc
reports from late 2009 through 2010 (The Capacity Crunch, Frequonomics, The Cell Side,
SuperFrequonomics), we have argued that scarcity is at long last making an appearance. The physics of
mobile telecommunications (specifically Shannon’s Law) mean that the amount of capacity available is
finite. Even new technologies like 4G/LTE, while offering some efficiency gains versus their
predecessors, are not sufficient an answer to the explosive demand seen from mobile data capacity. As a
result, we have argued that capex is likely to trend upwards, but also that operators will need to ration
their scarce capacity by means of price – in other words, operators will enjoy a measure of pricing power.
Although this view remains very controversial, supporting evidence continues to accumulate. For
example, at its interim results, market bellwether Vodafone indicated the need for a modest increase in
capex, but at the same time not only raised its revenue guidance but also announced it was on-track to
introduce tiered tariffs in all its European markets by the end of calendar Q1 2011. And while, admittedly,
plenty of questions remain about the profitability of data services, we would highlight the excellent
margins achieved by eMobile (one of the world’s very few data-only wireless operators).
Fixed-line connectivity
Although much of our 2010 thematic research focused on the mobile subsector, a parallel set of points
could be made about the fixed-line side of the industry: here too, the power of scarcity is finally making
itself felt, even if its origins are very different. To be clear, the scarcity involved is certainly not related to
the bandwidth available down superfast pipes: instead, it is associated with the prodigious capex required
to deploy such technologies, which limits the number of such competing platforms in any one market.
Clearly, in one sense, the scarcity of access infrastructure platforms is nothing new. But, over the last
decade, regulators have undermined this barrier to entry by enabling entrants to unbundle the incumbent’s
infrastructure at a price related to the incumbent’s own unit costs. Not only has this meant competitors
have had no need to secure billions in funding to roll out infrastructure of their own, but it also ensured
that they could behave, in terms of pricing, as if they had the same scale as the incumbent. With network
reach and economies of scale no longer points of differentiation, the competitive battleground moved on
to areas like marketing, where nimble entrants have tended to get the better of the incumbents.
But now the shift towards next generation access (NGA) platforms providing superfast broadband gives
an opportunity to redress the balance, and reassert the importance of scale. In the present-day, copper-
based ADSL broadband world, unbundling has required little capital. By contrast, in networks that mix
fibre and copper (like FTTN/VDSL), unbundling is intrinsically expensive (as a result of the need to
install electronics not at a handful of local exchanges but instead at tens of thousands of street cabinets);
while in those networks that consist entirely of fibre, it is currently practically impossible. We therefore
Breaking down the telecoms sector into its component platforms and services, with examples of each category
Applications layer Eg IPTV Eg mobile ‘apps’
Eg superfast broadband Eg tiered data plansConnectivity layer
Fixed-line network Mobile network
Source: HSBC

3
Telecoms, Media & Technology – Equity 16 February 2011
abc
believe that the landscape of competition is set to change, moving away from an unbundled framework
and towards being based around wholesale offerings. Crucially, the economics of the latter are radically
better than those of the former, so far as incumbents are concerned. Indeed, there are already indications
that this transition is underway, as well as that pricing conditions are improving as a result.
Naturally, there is the risk that regulators turn tough on the wholesale pricing of fibre-based connectivity.
However, to do so would be to jeopardise the roll-out of this infrastructure in less economically attractive
areas, thereby creating a ‘digital divide’. Our survey of recent regulatory developments points to an
environment much improved by comparison with that pertaining to copper infrastructure, though still
disappointing in some respects. On the closely related issue of net neutrality, a trans-Atlantic divide is
evident, with European bodies adopting a more pragmatic and telecoms-sympathetic stance.
We therefore believe that there is, for the first time in recent history, ‘abundant scarcity’ evident in the
telecoms connectivity layer, on both the fixed-line and mobile sides. Unfortunately, though, we think that
prospects in the industry’s other layer – applications – are rather less rosy.
Mobile applications
Almost wherever one looks, the telecoms players have failed in their ambitions to become providers of
applications. Perhaps the most high profile instance of this has been in the mobile space, where the very
term ‘application’ is now synonymous with Apple and its iPhone. And while Apple does face competition
in this area, the most conspicuous source of rivalry is from Google’s Android platform, rather than from
telecoms companies. The risk here is that, by losing control of the applications layer, the operators will
find themselves disintermediated from some of their most traditional activities.
For example, consider the rise of social networking sites, and the way that they might very well become
the obvious address book intermediary for users looking to contact one of their social circle. Any
software like Facebook, which effectively organises an individual’s contacts, is in a strong position to
help guide how communications between those individuals takes place – and could readily direct a call to
take place via a VoIP application, like Skype. Efforts by telecoms operators in the mobile space to meet
this threat, and bring address book management out of the era of the telephone directory and into the
modern age (via platforms like RCS, the Rich Communications Suite) look to be too little too late. The
dangers here will be self-evident, although it should be emphasised that even service such as VoIP still
rely on underlying connectivity. This remains the preserve of the telecoms operators, and is not territory
that we see players in the applications layer as having either the skills or the appetite to pursue. Even
modest or oblique encroachments in this area by the vendors or technology companies (such as by setting
up as a MVNO or introducing soft SIM functionality) would likely be dilutive and/or counter-productive.
Fixed-line applications
Companies like Skype and Facebook are generally termed ‘over-the-top’ (OTT) providers, since they
offer an application that runs over the top of the connectivity that the telecoms operators deliver. In the
mobile subsector, it is already difficult to avoid the conclusion that this is the natural arrangement of
things. However, OTT is also becoming increasingly relevant in the fixed-line market, especially with
reference to payTV services – a topic closely examined in our thematic report, DisContent (September,
2009). Since this publication, ever more parties have entered the fray, with recent initiatives from players
4
Telecoms, Media & Technology – Equity 16 February 2011
abc
as diverse as Google and Tesco. We suspect that even established media players will struggle in this
environment, let alone telecoms operators. Arguably the incumbents, by investing in what are termed
content delivery networks (CDNs), are themselves tacitly acknowledging this state of affairs, by looking
to provide the hosting services required by OTT providers of video content.
In this confusing environment, we would argue that there remain only two fixed poles: firstly, customers
want the best content; and, secondly, this content is in need of delivery (with ‘content’ here referring to
any application, whether IPTV, VoIP offerings like Skype, iPhone apps, etc). So, content is king, but it
cannot be ‘teleported’ to the customer: it requires delivery – and hence connectivity.
We would argue that, at the very least in the developed world, it is time the telecoms operators embraced
the realities – positive and negative – of the market’s structure. The industry is well placed to be able to
monetise connectivity; it is much less clear what it can really add in the applications layer. Admittedly,
there is an argument for a degree of continued activity in this latter space, if only to retain bargaining
power with the other market participants and to stimulate the uptake of the connectivity services upon
which applications depend. But it is perhaps time that operators embraced the fact that one of the fastest
and most efficient means of encouraging the uptake of new forms of connectivity (such as superfast
broadband and mobile data packages) is to adopt open platforms, as it is these that best foster innovation.
Ironically, the appeal – from a profitability perspective – of applications like IPTV has long been dubious.
Although this service might generate healthy revenues, the bulk of these would need to be passed onto the
content owners. As a result, whether or not a telecoms company owns an IPTV revenue stream matters
less, in our view, than the fact that this service is likely to promote adoption of superfast broadband
connectivity – a field where the operator is much more clearly poised to benefit. Moreover, third parties
might be less anxious of the need to push net neutrality regulation if they could be confident that
prioritisation would not be used to favour the incumbents’ own retail services in the applications layer.
Winners and losers Clearly, the emergence of pricing power in telecoms should be a powerful positive right across the sector –
especially after so long an absence. However, because this positive is concentrated in the connectivity
layer, the benefits are by no means evenly distributed. In terms of the fixed-line subsector, we believe that
the best-placed operators are those with NGA infrastructure. Incumbents furthest ahead deploying this
network will be the first to benefit (Swisscom, KPN, Bezeq and Verizon being good examples), but we
think that the greatest benefits will actually accrue to the cable operators (KDG, Liberty Global, Telenet,
Virgin Media and ZON; as well as, in a sense, TDC), as their upgrade path via DOCSIS3.0 is relatively
inexpensive as well as rapid to deploy. In terms of the mobile industry, we favour larger operators with the
necessary scale to out-invest their smaller rivals (and thereby provide superior a quality of service with
their data offerings), as well as those equipment manufacturers that will supply them. As a consequence,
we prefer networks like Vodafone, Telenor , NTT DoCoMo and KT, plus Ericsson among the vendors.
In the emerging markets, the dynamics are somewhat different. There should still be the opportunity to
monetise scarcity in terms of connectivity, and hence we would suggest stocks like TIM Brazil. However,
additionally, there may still be some scope for operators to capture a portion of the applications layer: we
would advocate STC and MTN on this basis. We see the losers on this theme as being those companies
that have been slow to invest in their core connectivity capabilities, like TI and TPSA.
5
Telecoms, Media & Technology – Equity 16 February 2011
abc
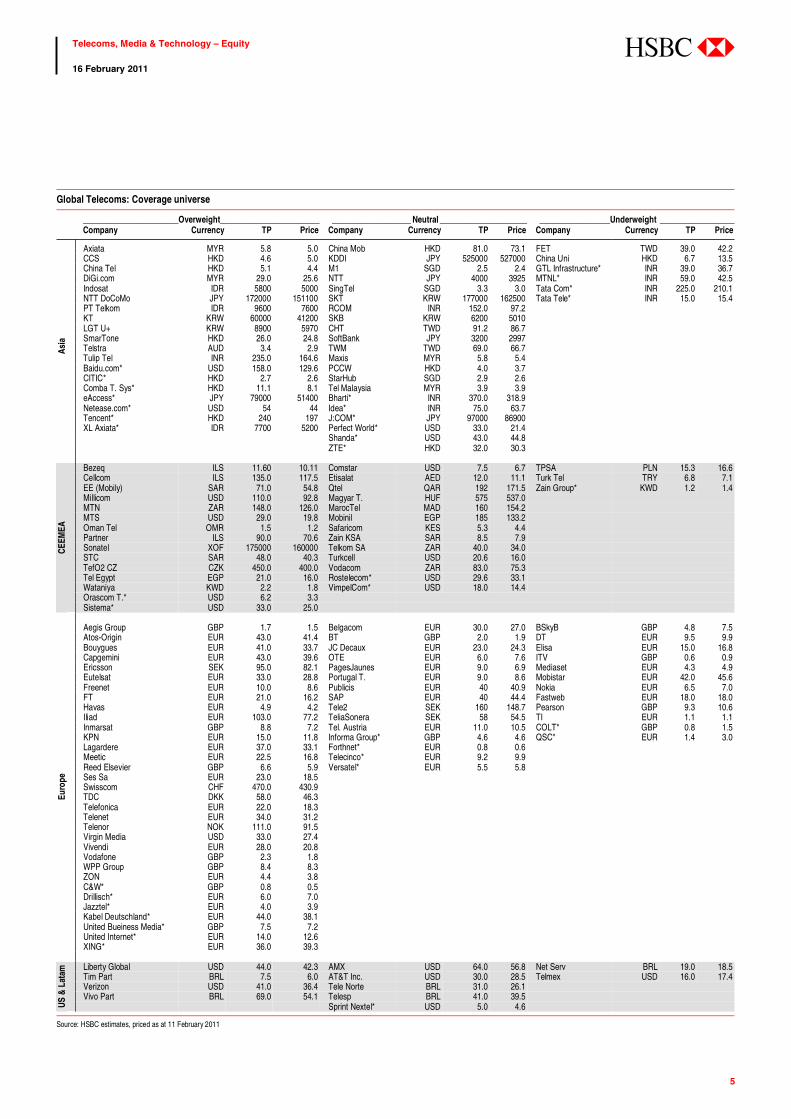
Global Telecoms: Coverage universe
_______________________Overweight________________________ ___________________ Neutral _____________________ _________________Underweight __________________ Company Currency TP Price Company Currency TP Price Company Currency TP Price
Axiata MYR 5.8 5.0 China Mob HKD 81.0 73.1 FET TWD 39.0 42.2CCS HKD 4.6 5.0 KDDI JPY 525000 527000 China Uni HKD 6.7 13.5China Tel HKD 5.1 4.4 M1 SGD 2.5 2.4 GTL Infrastructure* INR 39.0 36.7DiGi.com MYR 29.0 25.6 NTT JPY 4000 3925 MTNL* INR 59.0 42.5Indosat IDR 5800 5000 SingTel SGD 3.3 3.0 Tata Com* INR 225.0 210.1NTT DoCoMo JPY 172000 151100 SKT KRW 177000 162500 Tata Tele* INR 15.0 15.4PT Telkom IDR 9600 7600 RCOM INR 152.0 97.2 KT KRW 60000 41200 SKB KRW 6200 5010 LGT U+ KRW 8900 5970 CHT TWD 91.2 86.7 SmarTone HKD 26.0 24.8 SoftBank JPY 3200 2997 Telstra AUD 3.4 2.9 TWM TWD 69.0 66.7 Tulip Tel INR 235.0 164.6 Maxis MYR 5.8 5.4 Baidu.com* USD 158.0 129.6 PCCW HKD 4.0 3.7 CITIC* HKD 2.7 2.6 StarHub SGD 2.9 2.6 Comba T. Sys* HKD 11.1 8.1 Tel Malaysia MYR 3.9 3.9 eAccess* JPY 79000 51400 Bharti* INR 370.0 318.9 Netease.com* USD 54 44 Idea* INR 75.0 63.7 Tencent* HKD 240 197 J:COM* JPY 97000 86900 XL Axiata* IDR 7700 5200 Perfect World* USD 33.0 21.4 Shanda* USD 43.0 44.8
Asia
ZTE* HKD 32.0 30.3
Bezeq ILS 11.60 10.11 Comstar USD 7.5 6.7 TPSA PLN 15.3 16.6Cellcom ILS 135.0 117.5 Etisalat AED 12.0 11.1 Turk Tel TRY 6.8 7.1EE (Mobily) SAR 71.0 54.8 Qtel QAR 192 171.5 Zain Group* KWD 1.2 1.4Millicom USD 110.0 92.8 Magyar T. HUF 575 537.0 MTN ZAR 148.0 126.0 MarocTel MAD 160 154.2 MTS USD 29.0 19.8 Mobinil EGP 185 133.2 Oman Tel OMR 1.5 1.2 Safaricom KES 5.3 4.4 Partner ILS 90.0 70.6 Zain KSA SAR 8.5 7.9 Sonatel XOF 175000 160000 Telkom SA ZAR 40.0 34.0 STC SAR 48.0 40.3 Turkcell USD 20.6 16.0 TefO2 CZ CZK 450.0 400.0 Vodacom ZAR 83.0 75.3 Tel Egypt EGP 21.0 16.0 Rostelecom* USD 29.6 33.1 Wataniya KWD 2.2 1.8 VimpelCom* USD 18.0 14.4 Orascom T.* USD 6.2 3.3
CEEM
EA
Sistema* USD 33.0 25.0
Aegis Group GBP 1.7 1.5 Belgacom EUR 30.0 27.0 BSkyB GBP 4.8 7.5Atos-Origin EUR 43.0 41.4 BT GBP 2.0 1.9 DT EUR 9.5 9.9Bouygues EUR 41.0 33.7 JC Decaux EUR 23.0 24.3 Elisa EUR 15.0 16.8Capgemini EUR 43.0 39.6 OTE EUR 6.0 7.6 ITV GBP 0.6 0.9Ericsson SEK 95.0 82.1 PagesJaunes EUR 9.0 6.9 Mediaset EUR 4.3 4.9Eutelsat EUR 33.0 28.8 Portugal T. EUR 9.0 8.6 Mobistar EUR 42.0 45.6Freenet EUR 10.0 8.6 Publicis EUR 40 40.9 Nokia EUR 6.5 7.0FT EUR 21.0 16.2 SAP EUR 40 44.4 Fastweb EUR 18.0 18.0Havas EUR 4.9 4.2 Tele2 SEK 160 148.7 Pearson GBP 9.3 10.6Iliad EUR 103.0 77.2 TeliaSonera SEK 58 54.5 TI EUR 1.1 1.1Inmarsat GBP 8.8 7.2 Tel. Austria EUR 11.0 10.5 COLT* GBP 0.8 1.5KPN EUR 15.0 11.8 Informa Group* GBP 4.6 4.6 QSC* EUR 1.4 3.0Lagardere EUR 37.0 33.1 Forthnet* EUR 0.8 0.6 Meetic EUR 22.5 16.8 Telecinco* EUR 9.2 9.9 Reed Elsevier GBP 6.6 5.9 Versatel* EUR 5.5 5.8 Ses Sa EUR 23.0 18.5 Swisscom CHF 470.0 430.9 TDC DKK 58.0 46.3 Telefonica EUR 22.0 18.3 Telenet EUR 34.0 31.2 Telenor NOK 111.0 91.5 Virgin Media USD 33.0 27.4 Vivendi EUR 28.0 20.8 Vodafone GBP 2.3 1.8 WPP Group GBP 8.4 8.3 ZON EUR 4.4 3.8 C&W* GBP 0.8 0.5 Drillisch* EUR 6.0 7.0 Jazztel* EUR 4.0 3.9 Kabel Deutschland* EUR 44.0 38.1 United Bueiness Media* GBP 7.5 7.2 United Internet* EUR 14.0 12.6
Euro
pe
XING* EUR 36.0 39.3
Liberty Global USD 44.0 42.3 AMX USD 64.0 56.8 Net Serv BRL 19.0 18.5Tim Part BRL 7.5 6.0 AT&T Inc. USD 30.0 28.5 Telmex USD 16.0 17.4Verizon USD 41.0 36.4 Tele Norte BRL 31.0 26.1 Vivo Part BRL 69.0 54.1 Telesp BRL 41.0 39.5
US &
Lat
am
Sprint Nextel* USD 5.0 4.6
Source: HSBC estimates, priced as at 11 February 2011
6
Telecoms, Media & Technology – Equity 16 February 2011
abc
Fixed-line connectivity 7
Mobile connectivity 28
Fixed-line applications 54
Mobile applications 67
Winners and Losers 74
Company profiles 97 America Movil (Neutral, TP USD64) 98
AT&T (Neutral, TP USD30) 100
Belgacom (Neutral, TP EUR30) 102
BT Group (Neutral, TP 200p) 104
Bezeq (Overweight, TP ILS11.6) 106
Deutsche Telekom (Underweight, TP EUR9.5) 108
eAccess (Overweight (V), TP 79,000) 110
France Telecom (Overweight, TP EUR21 112
KPN (OW, TP EUR15) 114
KT Corp (Overweight, TP KRW60,000) 116
Mobily (Overweight, TP SAR71) 118
MTN (Overweight, TP ZAR148) 120
Mobile Telesystems (Overweight, TP USD29) 122
NTT DoCoMo (Overweight, TP JPY172,000) 124
Portugal Telecom (Neutral, TP EUR9) 126
Saudi Telecom Company (Overweight, TP SAR48) 128
Sprint Nextel (Neutral (V), TP USD5) 130
Swisscom (Overweight, TP CHF470) 132
TDC (Overweight, TP DKK58) 134
Tele2 (Neutral, TP SEK160) 136
Telecom Italia (Underweight, TP EUR1.05) 138
Telefonica (Overweight, TP EUR22) 140
Telekom Austria (Neutral, TP EUR11) 142
Telenor (Overweight, TP NOK111) 144
TeliaSonera (Neutral, TP SEK58) 146
Telstra (Overweight, TP AUD3.40) 148
TIM Participações (Overweight, TP BRL7.50) 150
TPSA (Underweight, TP PLN15.3) 152
Turk Telekom (Underweight, TP TRY6.80) 154
Verizon (Overweight, TP USD41) 156
Vodafone (Overweight, TP 230p) 158
Disclosure appendix 161
Disclaimer 164
Contents

7
Telecoms, Media & Technology – Equity 16 February 2011
abc
Introduction There are now the first clear signs emerging that
the transition to next generation access (NGA)
superfast broadband is shifting the competitive
landscape away from unbundling and towards
wholesale. This should provide incumbents (as
well as their cable rivals) with a considerably
better operating environment than has been the
case during the last decade, when the highly
corrosive regulatory intervention that is the
unbundling of the local loop (ULL) dominated the
picture.
Generally, it is only fair to acknowledge that
European regulation is becoming more
sympathetic to those deploying fibre upgrades,
although some of the detailed terms still fall far
short of what the Federal Communications
Commission (FCC) offered to supercharge NGA
roll outs in the US. However, the situation is
reversed on the topic of net neutrality, where it is
the Europeans, in our opinion, who have adopted
the more rational policy – accepting that there are
actually benefits to being able to prioritise certain
types of data traffic, provided the process is
transparent and non-discriminatory.
Such a pragmatic approach seems entirely
appropriate for a wide variety of reasons. One
worth mentioning is the operators’ increasing
interest in entering the content delivery network
(CDN) space, which effectively signals their
interest in hosting providers of over-the-top
(OTT) services. Hence, far from using their
network ownership to discriminate against third-
party suppliers of services utilising their
infrastructure, they are now specifically setting
out to sell to such players.
Age of enlightenment It is obviously ironic to even be discussing
scarcity in the context of the tremendous
bandwidths that NGA access network upgrades
deliver. But the speeds involved do come at a
price, particularly for incumbent operators that
must generally replace all or part of their existing
twisted-copper pair infrastructure with fibre.
Historically, regulators have undermined the
incumbents’ traditional barrier to entry (the
enormous expense of replicating their access
infrastructure) by making it available to third
parties at a unit-cost based price. With the
infrastructure (and its price) effectively common
ground, the terms of competition have migrated
elsewhere – into areas like marketing and
customer service. In such territory, it has all too
often been the entrants rather than the incumbents
that have held the upper ground.
However, the shift towards NGA platforms looks
set to redress the balance, and highlight once more
the importance of scale in the telecoms industry.
Fixed-line connectivity
NGA already resulting in competitive landscape shifting to wholesale
EC regulation more sympathetic to NGA, but concerns remain
Net neutrality threat receding in Europe; CDN opportunity emerging

8
Telecoms, Media & Technology – Equity 16 February 2011
abc
Today’s unbundling platforms require relatively
little by way of capital commitment, with altnets’
infrastructure deployment needing to be no more
diffuse than encompassing the local exchange.
But, in a FTTN/VDSL platform, their equipment
must be installed in street cabinets – of which
there are commonly 20-40 for each local
exchange. This implies vastly greater costs for the
altnet – to the extent that it is very difficult to see
it being economically viable. For more
information, see our own detailed report on NGA
and its consequences, Age of Enlightenment,
September, 2008; note that independent reports
commissioned by a variety of regulators have
reached similar conclusions in both Ireland and
the Netherlands. Moreover, in the case of fibre-to-
the-premises (FTTP), unbundling is presently
practically unfeasible.
Hence we conclude that the landscape of
competition is likely to fundamentally change,
shifting away from the unbundling of copper.
Altnets that wish to continue to compete in the
world of NGA-delivered superfast broadband will
most likely need to purchase the connectivity
wholesale from the incumbent. Wholesale pricing
is naturally much more attractive to an incumbent
than that associated with unbundling (as, with
wholesale, the incumbent is doing all the real
work).
Naturally, regulators could turn tough on
wholesale pricing, but to do this would jeopardise
the build out of fibre in less economically
attractive regions. Once these projects are
complete, the intensification of regulation does
therefore represent a real risk, but – given the
duration of fibre deployments – we believe that
this is many years away.
The process of migrating toward fibre has been a
slow and painful one (we originally discussed it in
our thematic report Phoenix – rising from the
ashes, all the way back in September, 2004).
Operators have been wary of investing in
upgrading their infrastructure, given the very poor
reputation that capex in the telecoms sector
acquired post the internet bubble – or, more
specifically, its burst. Moreover, with regulators
aggressively pushing interventions like
unbundling, management teams have
understandably questioned the merits of investing
in a platform that they might then be forced to sell
at, or even beneath, cost.
Then came the credit crunch, and arguably the
worst global economic slowdown in three-
Future NGA and DOCSIS coverage plans (as % of total households) ( Incumbent vs cable)
0%
10%
20%
30%
40%
50%
60%
70%
80%
90%
Belgium Germany Netherlands Portugal Spain Sw itzerland UK France Italy
Incumbent Cable (key competitor)
Mid 2011
2009 2012e
2012e
20092012e
2009
2015e
2015e
2009
2009
2012e 2010e
2010e
FT plans: Fibre in all 96 homeland and in 3 overseas administrative districts by 2015
Numericable : No future coverage plans available
2015e
No cable operator in Italy
Source: company data, HSBC estimates

9
Telecoms, Media & Technology – Equity 16 February 2011
abc
quarters of a century. Although the free cash flow
yields currently seen in the telecoms sector might
give the impression that the industry is
particularly fragile (given these valuation levels,
the markets would certainly seem to perceive it as
such), in fact the sector displayed a quite
remarkable degree of resilience during the
downturn. Admittedly, revenues were negatively
impacted by the troubled macro environment;
however, operators were able to offset this
pressure by making cost savings – with capex
being a primary focus in this regard.
Inevitably, such cuts had an impact on the pace at
which operators invested in NGA upgrades, which
are intrinsically expensive. In Europe, even those
incumbents that were among the more
enthusiastic (like KPN) adopted cautious roll-out
schedules. Meanwhile, in the US, although
Verizon pushed ahead with its highly ambitious
FiOS project, AT&T extended its U-verse
programme over a longer period, effectively
slowing the pace of deployment.
As we argued at the time (in our thematic Déjà vu,
February, 2009), the extent of the cuts possible in
discretionary capex on a short-term view meant
that the sector’s cash flow generation could
remain robust. The key phrase here, though, is
‘short-term’. Operators can indeed cut back on
capex over brief timescales – a process that is
made even easier if their primary rivals are
engaged in the same behaviour. But it is
dangerous to overly prolong this hiatus – and,
indeed, undesirable to do so if there is an
appealing opportunity in the offing. We believe
that NGA upgrades fall into this category.
Despite the macro difficulties, these investments
are now broadly underway, and some of the
benefits that they bring to the competitive
landscape are becoming apparent. The most
important aspect of NGA builds, so far as we are
concerned, are not that they will enable operators
to drive retail ARPUs higher (though, of course,
this is a distinct possibility), but rather that they
encourage a shift away from unbundled-based
competition towards that based on wholesale
products. The latter are typically priced on terms
far more attractive to the incumbent than the
former.
Unbundled to wholesale
We have already seen several altnet competitors
accepting the logic of this transition. For example,
in an event of – we would argue – seismic
significance (but one that went largely
unrecognised by the financial press), UK
broadband provider Orange (better known for its
mobile network) decided to abandon its
German broadband market in 2007… …and 2010: NGA drives consolidation
DT44%
Arcor13%
UTDI14%
Vodafone1%
others1%
TEF O21%
Cable4%
Alice12%
freenet7%
Versatel3%
DT46%
UTDI13%
Cable13%
TEF O28%
Vodafone14%
others4%
Versatel2%
Source: company data, HSBC Source: company data, HSBC
10
Telecoms, Media & Technology – Equity 16 February 2011
abc
unbundled ADSL offering and move onto BT’s
wholesale platform. Admittedly, Orange is now a
relatively small player in the UK broadband
market (though once having been far stronger). Its
DSLAM equipment may have been somewhat
antiquated, and so may well have required
significant investment even to maintain an
unbundled ADSL service. The prospect of having
to invest capex in an ADSL offering at just the
time BT is beginning to deploy fibre was clearly
an unattractive one – given that any new assets
Orange put in place would have a fairly limited
lifespan (in the face of the incumbent’s faster
NGA technology).
Hence, even if Orange had invested in upgrading
its unbundled ADSL platform, it would still have
faced the dilemma of whether or not to invest a
great deal more in a few years time. Maintaining
its presence as an unbundler with ADSL would
have been relatively inexpensive, but becoming an
unbundler of BT’s FTTN/VDSL platform would
involve an immense outlay. And if this capital
commitment was too large to contemplate, what
would be the point in remaining an unbundler in
the meantime? In the end, Orange presumably
decided that, given it could not afford to unbundle
the FTTN/VDSL platform, there was little point
in continuing to invest in unbundling ADSL, and
the company moved directly into taking a
wholesale service.
The example provided by Orange proved to be an
early warning of a broader trend. The choice
confronting Orange arrived sooner than for most
of its peers, owing to the age of some of its
existing infrastructure, and therefore its need to
make an investment to maintain even its existing,
unbundled ADSL capability. However, the same
issue would sooner or later confront every
unbundler. TalkTalk remains an enthusiastic
unbundler of BT’s copper at the local exchange,
but (although it is conducting a small-scale fibre
trial) looks set to wholesale the incumbent’s NGA
product rather than unbundle at the street cabinet
level. Indeed, although Ofcom is insisting that BT
make available unbundled FTTN/VDSL reference
products, the regulator acknowledges that these
have not attracted a great deal of attention.
TalkTalk has made the point in its strategy
presentation that it can still obtain the same,
healthy margin reselling BT’s wholesale NGA
offerings that it achieves today with unbundled
ADSL. BT’s Openreach division, which has the
task of deploying the NGA platform, needs to
tread a difficult line in setting its prices. On the
one hand, obviously, these must be sufficient to
justify the investment made (and the not
inconsiderable risk involved); on the other, these
must not be so high as to deter take up. On
TalkTalk’s suggested numbers, it can indeed
maintain its gross margin, but the really standout
aspect is surely rather the fact that its payment to
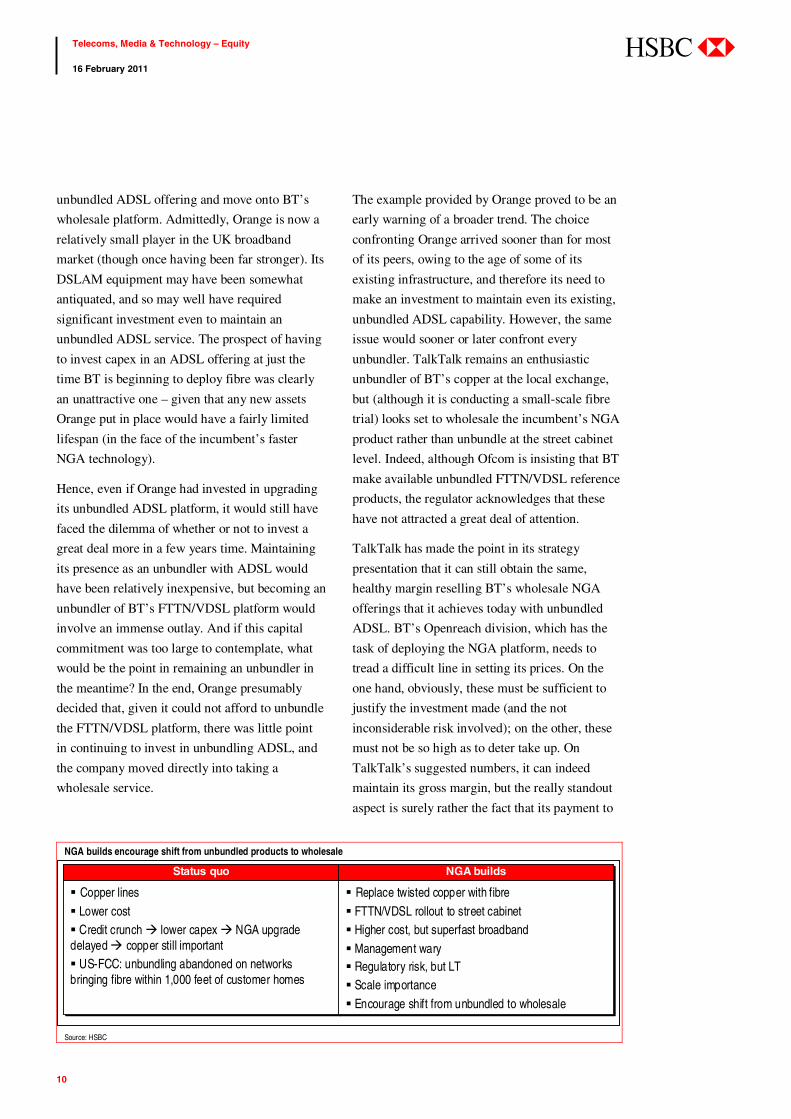
NGA builds encourage shift from unbundled products to wholesale
Status quoStatus quo NGA buildsNGA builds
Copper linesLower cost
Credit crunch lower capex NGA upgrade delayed copper still important
US-FCC: unbundling abandoned on networks bringing fibre within 1,000 feet of customer homes
Copper lines
Lower costCredit crunch lower capex NGA upgrade
delayed copper still importantUS-FCC: unbundling abandoned on networks
bringing fibre within 1,000 feet of customer homes
Replace twisted copper with fibreFTTN/VDSL rollout to street cabinet
Higher cost, but superfast broadbandManagement wary
Regulatory risk, but LTScale importanceEncourage shift from unbundled to wholesale
Replace twisted copper with fibre
FTTN/VDSL rollout to street cabinetHigher cost, but superfast broadband
Management waryRegulatory risk, but LTScale importance
Encourage shift from unbundled to wholesale
Source: HSBC

11
Telecoms, Media & Technology – Equity 16 February 2011
abc
BT approximately doubles when comparing
wholesale NGA to unbundled copper.
The utility of NGA upgrades to the incumbent
should therefore be perfectly clear. The
incumbents are the only operators with the
necessary scale, capital and experience to
undertake nationwide fibre upgrades; even
unbundling such a platform becomes prohibitively
expensive, and this should leave unbundled
copper competitors shifting towards a wholesale
NGA service, for which they will have to pay
(quite properly) considerably more.
Incipient fixed-line pricing power
What is important to emphasise here is that the
prerequisite for a more orderly pricing
environment is the upgrade to NGA infrastructure
(to fibre in the case of incumbents, or to
DOCSIS3.0 on cable platforms). Unfortunately,
because the process of migrating towards fibre
platforms is so expensive and time-consuming,
progress here has often been frustratingly slow.
It is for this reason that the evidence for incipient
pricing power emerging on the fixed-line side of
the industry is much less clear cut than that seen
in the mobile subsector.
Nevertheless, we feel that the anecdotal evidence
is increasingly convincing. The slow pace of
incumbent NGA upgrades also explains why the
clearest examples of pricing power in the fixed-
line market are often to be found among the cable
operators, since their upgrade path to NGA status
via DOCSIS3.0 technology is relatively swift.
Those cable operators already using DOCSIS3.0
in significant portions of their footprint have been
able to show a remarkably resilient top line, even
during the difficult macro environment of the past
few years.
ZON Multimedia (ZON.LS, EUR3.78, OW) in
Portugal provides an example of a cable operator
that has been able to command a certain degree of
pricing power – having found itself able to
increase the pricing on its services for each of the
last three years. In the course of 2010, ZON was
able to raise its tariffs in the region of 3-4% across
the board. This move was then followed by the
incumbent, Portugal Telecom. PT was able to lift
its prices because it has itself conducted a
substantial NGA network upgrade. ZON expects
to be able to increase its prices by about 1% in
2011, despite the austerity measures that have
been implemented in Portugal and the 2ppt
increase in VAT effective from January 2011.
Turning to the UK, cable operator Virgin Media
(VMED.O, USD27.38, OW) has been a
frontrunner among its European peers in
upgrading to DOCSIS3.0, which enabled it to
offer a service that is clearly differentiated from
that of the incumbent, BT. But BT is now also
rolling out a NGA deployment of its own – which
seems to be persuading present-day unbundlers
(like Orange) that a move towards wholesale-
based services is inevitable. Note that despite the
difficult macro conditions in the UK, Virgin
Media announced in February 2011 a set of tariff
increases in its TV packages: the price of its ‘L’
package is to rise by GBP1.25 per month, while
that of its ‘XL’ package is to step up by GBP1.0
per month. In addition, its broadband packages are
to cost an extra GBP0.75 per month. Conversely,
though, the price of the 30Mbps package has been
reduced from GBP20 to GBP18.5 per month.
The above examples therefore suggest that
investing in network upgrades creates the
conditions necessary for the exercise of pricing
power. In our view, failure to invest tends
inevitably to condemn operators to pure price-
based competition. Arguably, one good example
of this is Telecom Italia. On the plus side, the lack
of a cable infrastructure in Italy has limited the
damage that the company’s decision to repeatedly
postpone its NGA roll-out plans would otherwise

12
Telecoms, Media & Technology – Equity 16 February 2011
abc
have caused. However, the resulting lack of
service differentiation has exposed TI to the
aggressive pricing of altnets exploiting
unbundling. For instance, in Q4 2010
Wind/Infostrada, Tele2 and Tiscali started
offering double-play broadband products for a
two year (sic) promotional price of EUR19.95 per
month. TI has opted not to follow this move, but
this decision is likely to have hit the performance
of its domestic fixed-line business in Q4 2010.
The same risk potentially applies to other
operators that have elected to postpone NGA
capex during the recent recession – and so may
also apply to the likes of Telefonica de Espana,
for example.
There is also the hint in some of those (rare)
markets where the deployment of NGA could be
relatively broad based that the elevated levels of
capital involved (a particular step change so far as
the incumbent’s competitors are concerned) will
trigger more responsible pricing policies. This
would seem to be the case in France, a market that
has been the cheapest in Europe in terms of triple-
play services effectively ever since Iliad launched
its EUR29.99 per month offer back in 2003. Its
competitors were forced to align their pricing to
Iliad’s, with only FT managing to retain some sort
of premium to this. (Even this premium has been
eroding, following FT’s price cuts in summer
2010.)
However, in Q4 2010, retail prices were raised by
all the major operators, in response to a hike in the
VAT rate. What is significant, though, is that the
price rises were in excess of what the higher VAT
charge alone would have justified, and therefore
also represents an increase in the underlying
pricing at Iliad and SFR. These operators can
legitimately claim that they now incorporate
additional features in their offerings, such as
unlimited calls to mobile phones or a new set-top
box – but the fact remains that triple-play
packages now cost more on a headline basis than
previously. For example, Iliad's new customers
will be paying EUR37.97 per month (for its triple-
play, fully unbundled, unlimited calls to mobile
package), compared with EUR29.99 previously.
Of the total price increase, only a third can be
attributed to the higher VAT rate. Similarly, at
SFR, the new triple-play offer now costs EUR36.9
per month compared with EUR29.9 previously.
The equivalent bundles would cost EUR39.9 per
month at Bouygues (including three hours of calls
to mobile, rather than unlimited calls) and EUR37
at Orange (but with only one hour of calls to
mobile phones included, and excluding EUR3 for
set-top box rental).
Note that fibre is currently priced at the same
level as ADSL in France, although it has not yet
received any mass-market push. Hence, there
remains the possibility that the operators will also
attach a price premium to the superior bandwidth
services that fibre can support.
Finally, there is the example of the US. In this
market, traditional fixed-line revenues have been
under sustained pressure, driven in particular by
line losses in the region of 8-10% per annum.
An additional headwind arises from the weak
economy. Nevertheless, the absence of regulator-
mandated wholesale or unbundled fibre products,
as well as the growing popularity of services that
exploit superfast broadband connectivity, do
together have the potential to lead to some form of
pricing power.
Of course, because of the very different
bandwidths available over fibre compared with
copper, life-for-like price comparisons are
somewhat spurious. Nonetheless, it is worth
drawing attention to the positive nature of the
‘share of wallet’ effects as seen at the RBOCs.
The ARPU from Verizon’s FiOS customers in Q4
increased by 4% year-on-year, reaching USD146.
Similarly, AT&T’s fixed-line revenues are

13
Telecoms, Media & Technology – Equity 16 February 2011
abc
benefiting from growth generated by its U-Verse
connectivity offerings and related services. Fixed-
line consumer revenues per household have now
been growing for the last 12 quarters in
succession. Additionally, the evidence suggests
that fibre offerings are helping to mitigate the
traditional process of line loss.
Ray of light One concern about any scenario in which the
incumbent’s scale and ability to deploy capital
work to its advantage must inevitably be that the
regulator will intervene to the detriment of the
incumbent. To an extent, this is inevitable.
However, incumbents still have some powerful
bargaining chips that should ensure they are more
equitably treated than in the present, copper-
dominated world.
The first point to make is simply to repeat that it
will be very difficult – at any conceivable price –
to make activities like unbundling at the street
cabinet very financially attractive, because of the
capital outlay involved (not to mention the
logistical challenges). Most unbundled players
have relatively limited experience with
infrastructure, given that they are presently tasked
with installing their DSLAMs in perhaps a few
hundred local exchanges. They are not generally
geared up for deployments that would involve
visiting literally thousands of street cabinets. So,
even though regulators will undoubtedly define
products and pricing on unbundled FTTN/VDSL
platforms, this does not imply that they will
actually be used.
There have been efforts in some countries by
governments, notably in Australia, to wrest
responsibility for upgrading the infrastructure to
fibre away from the incumbent, namely Telstra.
However, this has proven hugely controversial,
time-consuming and complex. Most governments
would likely prefer to see the work done by the
local expert (ie the incumbent), using the latter’s
access to capital (rather than potentially impacting
an already over-extended state).
Incumbents, in our view, should be enthusiastic to
build NGA platforms, provided the regulation is
supportive. In practice, they likely will look to
receive sympathetic treatment, via (for instance)
flexibility on pricing, or – if it must be dictated –
tariffs established with the use of generous cost of
capital assumptions.
Ultimately, once capital has been irrevocably
committed, regulators have generally shown a
tendency to turn more aggressive. But, in the
meantime, while they are looking to see
substantial quantities of capital deployed, they
have an incentive to remain more generous. And
this ‘meantime’ could represent a considerable
period – fibre networks can take years to deploy,
particularly if there are to be upgrades beyond
FTTN/VDSL towards FTTP.
Hence the incumbents should possess a
bargaining tool that they can make use of for
years to come. If regulators were to turn unduly
harsh mid-build, this could potentially jeopardise
further deployment of fibre. And because
operators are likely to begin their roll out in the
more affluent, densely populated areas, and only
Fibre to the node vs fibre to the premises
FTTN
FTTP
Fibre optic Copper
En
d u
ser
bui
ldin
gE
nd u
ser
bui
ldin
g
Telco office
Telco office
FTTN
FTTP
Fibre optic Copper
En
d u
ser
bui
ldin
gE
nd u
ser
bui
ldin
g
Telco office
Telco office
FTTN
FTTP
Fibre optic Copper
FTTN
FTTP
Fibre optic Copper
En
d u
ser
bui
ldin
gE
nd u
ser
bui
ldin
g
Telco office
Telco office
Source: HSBC

14
Telecoms, Media & Technology – Equity 16 February 2011
abc
then move onto less financially compelling
regions, it becomes particularly important that
regulatory decisions do not impair the profitability
of earlier build – which, in a sense, must cross-
subsidise that which follows.
In our view, the most enlightened approach (pun
intended) is that adopted by the FCC in the US,
which decided to abandon unbundling altogether
on networks bringing fibre within 1,000 feet of
the customer premises. This has encouraged the
very rapid deployment of fibre NGA platforms in
the US. European regulators have not taken this
approach, and consequently have not triggered
anything like the same speed of build out.
However, regulators like Ofcom have at least
conferred pricing flexibility on BT – in other
words, the incumbent has the freedom to set its
own prices for both retail and wholesale NGA
products.
Commission regulation
It will be interesting to see how this particular
arrangement can co-exist with the line coming out
of the European Commission. The Commission’s
earlier documents on the subject of NGA
regulation were very worrying from the
perspective of those hoping to see a supportive
regime put in place to encourage fibre investment.
For instance, the Commission has previously
suggested that the use of fibre between local
exchange and street cabinet was to be considered
a conventional upgrade, and therefore not one that
should attract any cost of capital premium. This
despite the fact that there would be no
conceivable to reason to make such an upgrade
other than to offer superfast broadband services –
services that the Commission itself recognises
entail taking on board a good deal of risk.
The latest documents from the Commission show
some relaxation of its attitude, although arguably
still leave much to be desired from the perspective
of a prospective investor. The Commission’s
argument for its adopting an active role in this
process is that regulation in Europe might
otherwise become fractured, given the wide
variety of approaches national regulators have
already adopted towards NGA. We would be
tempted to see this as something of an advantage
– providing an opportunity to test out a variety of
techniques, and then evolve regulation across the
region towards the most successful variants.
The Commission is adamant that the principle of
the so-called ‘ladder of investment’ must be
maintained, despite the fact that it has been of
only limited success to date. The idea here is to
attract players into the market via products that
require relatively little capital to exploit (ie
wholesale offerings, where the incumbent service
is simply resold), and then have them graduate
towards taking on a greater degree of
responsibility in terms of infrastructure as they
gain in terms of size and experience (ie towards
unbundled offerings, where the altnet provides the
electronics and relies on the incumbent only for
passive network components). The same concept
was applied to ADSL broadband services, and –
indeed – many altnets began with wholesale and
later migrated to unbundling. However, there was
no obvious next stage, given the enormous capital
involved in access infrastructure. Arguably this is
still very much the case.
With respect to NGA, the regulatory mandated
products cover everything from the basic passive
infrastructure (eg trenches and poles) for those
wishing to deploy their own fibre connections, up
through unbundling (eg of the copper loop
between the street cabinet and customer) for those
looking to launch unbundled FTTN/VDSL, and
culminating in wholesale offerings (ie where the
reseller simply resells the incumbent’s service).
But it will be a very tall order, in our view, for an
altnet successful with a wholesale product (given
the relatively thin margins that a relatively

15
Telecoms, Media & Technology – Equity 16 February 2011
abc
undifferentiated product such as this implies) to
make sufficient profit to justify committing the
capital required for unbundling, let alone laying
fibre of its own.
More positively, the Commission does seem clear
that part of its role is to encourage investment in
network:
The [EC] Recommendation… does emphasize the
need for NRAs [national regulatory authorities]
to reflect investment risk in terms of risk premia
and, importantly, in terms of price flexibility
We feel it is a pity, though, that this approach is
not more clearly reflected in its comments on
FTTP unbundling. Clearly, all forms of NGA are
risky, but the degree of capital required for FTTP
puts it in a different league to even FTTN. Hence,
while we see it as regrettable that European
regulators have not followed the FCC in ruling
out unbundling even on FTTN, we would concede
that this form of regulatory intervention does
make more sense applied to FTTN rather than to
FTTP. Given the costs of FTTP, it might have
been hoped that unbundling would have been
ruled out. In fact, with today’s technology,
unbundling FTTP is not really technically
practically feasible, but the Commission still
seems determined that it ought to be introduced as
soon as it becomes so.
Cost orientation
Another weakness, in our opinion, of the
Commission's approach is the focus (for both
unbundling and wholesale, as well as for FTTN
and FTTP) on cost-orientated pricing. The
problem here is that the regulator is referring to
the costs of the incumbent – the largest player in
the market and therefore that with the lowest unit
cost. This tends to penalise those competitors that
have gone to the expense and trouble to deploy
infrastructure of their own, the most prominent
example of which are the cable operators. But
cable companies typically lack the market share
and geographic reach of the incumbents, and
hence also their scale efficiencies. In our view, if
the regulator really wants to encourage
infrastructure-based competition, it ought to be
pricing unbundled infrastructure at a unit cost
price determined not from the incumbent, but
rather from its smaller rivals. The smaller the rival
selected, the greater the incentive for competitors
to commit to investing in infrastructure. (It is also
worth pointing out that the cable operators
themselves might be tempted to extend their
footprints were the potential returns adequately
attractive).
It is worth highlighting the potential injustice
here. An altnet could theoretically simply resell a
wholesale superfast broadband service at a price
offering it a higher return than a cable operator
could generate from its own infrastructure (which
would be smaller scale and, thus, higher unit cost
than the network of the incumbent that the reseller
was wholesaling). This is hardly a circumstance
likely to incentivise future investment.
Ultimately, though, despite the discouraging
nature of the Commission’s philosophical
approach, a great deal rests simply on the cost of
capital that regulators apply to NGA investments.
Here the Commission is clear (without prescribing
actual figures) that the incumbent is entitled to a
premium:
In cases where investment into NGAs depends for
its profitability on uncertain factors such as
assumptions of significantly higher ARPUs or
increased market shares, NRAs should assesss
whether the cost of capital reflects the higher risk
of investment relative to investment into current
networks based on copper.
We have long argued that the immense cost of the
upgrade to NGA platforms could be in part paid
for out of the elimination of the artificial and

16
Telecoms, Media & Technology – Equity 16 February 2011
abc
transient arbitrage that is local loop unbundling.
However, one alternative would admittedly be for
regulators to choose to permit a greater share of
the returns to accrue to the provider of the NGA
infrastructure. The problem with this is simply
that it is likely to translate into higher retail prices,
which is likely to deter uptake – thereby
potentially damaging the economics of the entire
programme.
Like Ofcom, the Commission is also prepared to
countenance a degree of pricing flexibility. This
seems to boil down to permitting the incumbent a
limited degree of flexibility in terms of pricing
use of its FTTx infrastructure at a discount to
those prepared to purchase it either on a longer-
term basis or in higher volumes (since both reduce
the risk of the NGA investment). However, it does
not seem very apparent that the regulator is
permitting the type of price differentiation that is
commonly seen in other industries.
In the scenario where a scarcity of capital on the
scale required for superfast broadband platforms
results in a diminishing number of infrastructure
competitors, it is – in theory – possible to see the
operators being able to introduce a broader range
of price differentiation techniques. The most
obvious mechanism available is to price
differentiate according to the bandwidth provided,
selling faster services at a premium. It is possible
this could meet with regulatory approval, if only
by virtue of the fact that the faster bandwidths
possible over a FTTP platform as compared to
FTTN/VDSL cost greatly more to provide,
because of the need to take the fibre all the way to
the customer’s premises.
In a more conventional market, though, other
forms of price differentiation would likely appear.
For example, operators might sell tiers of data
capacity, just as they are starting to do in the
mobile side of the industry. The size of the tiers
would be considerably greater for fixed-line
broadband than for mobile, but this might
nonetheless be a good way of differentiating
between casual users of broadband (who would
tend to value the service less) and those reliant
upon it satisfy all their entertainment needs,
thereby consuming a great deal of capacity-
hungry video (who would tend to value the
service more highly).
However, it remains to be seen whether the
wholesale pricing structures to be imposed by the
regulators will support this type of price
differentiation. This is despite the fact that it
would perform a useful function: enabling
operators to charge intensive users a figure more
closely representative of the utility they derive
from the service, and therefore helping to pay for
the deployment of this controversial technology
sooner than would be the case had the build out
depended exclusively on the price that less
committed users would be prepared to pay.
The specific issue here is that there is not
necessarily a substantial differential between the
cost to supply a modest and a large quantity of
data over a broadband network (given the
essentially fixed-cost structure of the industry). A
regulatory-imposed, cost-orientated wholesale
pricing regime would therefore tend to undermine
any attempt to price differentiate based on
volumes, because a reseller could always undercut
any materially premium-priced high-usage
offering. While such a pricing regime might be
justified, were the only goal to eliminate
‘distortions’ relating to the misalignment of costs
and pricing, it would also prevent useful price
differentiation aimed at charging customers more
closely in relation to their derived utility – and
thereby securing an improved revenue outlook of
just the type that might encourage a faster
deployment of NGA infrastructure.

17
Telecoms, Media & Technology – Equity 16 February 2011
abc
Could try harder
Overall, we would argue that the regulatory regime
does show some limited signs of being more
sympathetic, with the motive being to encourage
incumbents to deploy NGA platforms. At the same
time, we would continue to emphasise that there
are aspects of the transition to NGA that are
intrinsically unfavourable to unbundling (ie the
expense of visiting the street cabinet). It is evident
that regulators themselves do seem nervous that
they might be perceived as becoming overly
tolerant towards the incumbents, even though the
‘concessions’ involved (as discussed above) would
be solely aimed at encouraging an expensive, risky
investment programme (ie NGA) while
acknowledging the realities imposed by physics (ie
the fact that unbundling is unlikely to be economic
at the street cabinet level).
It is this anxiety that is perhaps the best way to
interpret innovations like the rebranding of
Ofcom’s Active Line Access (ALA) wholesale
product as ‘virtual unbundling’. These labels refer
to a sophisticated wholesale product that Ofcom
intends to impose upon BT – one which will
enable the wholesaler to exert a good deal more
control over its service than would be possible via
equivalent ADSL products. This makes perfect
sense, but the decision to rechristen this service
‘virtual unbundling’ – when what is on offer is
quite obviously a wholesale product – looks
decidedly odd. It is almost as if Ofcom felt the
desire to retain the ‘unbundling’ moniker in order
to emphasise the fact that it is not relaxing its
stance towards BT (a fact that no one would likely
dispute in any case). Note that the European
Commission has accepted Ofcom’s proposal, but
indicated that the virtual unbundling product will
not be sufficient in itself. The Commission wants
Ofcom to secure the unbundling of BT’s NGA
infrastructure as soon as this is practicable.
Net neutrality However, there is one further area of activity
where European regulators – if not their US
counterparts – seem to be leaning towards a
stance that really should be supportive of
investment: on the fraught topic of net neutrality.
The question here boils down to the degree of
freedom that operators should have in how they
manage and tariff their networks, and could have
wide ranging implications in terms of the structure
of the overall market and the degree of incentive
operators are provided to invest in NGA platforms
(and hence the likely speed of their deployment).
Operators can use deep packet inspection (DPI) technology to implement traffic management policies, such as prioritisation according to the requirements of the underlying service (e.g. delay-intolerant voice and video prioritised over email and browsing)
Payload
Hea
der
Policy Engine (PE)
- Prioritize premium users
- Prioritize by service need
- Block objectionable content
Node
Deep packet inspection
Fixed/mobile Internet
Users
Payload
Hea
der
Policy Engine (PE)
- Prioritize premium users
- Prioritize by service need
- Block objectionable content
Node
Deep packet inspection
Fixed/mobile Internet
Users
Source: HSBC
18
Telecoms, Media & Technology – Equity 16 February 2011
abc
We have never found the arguments for net
neutrality to be in the least convincing (see Net
Neutrality, April 2006). Unfortunately, this has not
prevented the concept from gaining widespread
acceptance in certain quarters, and with certain
regulators – especially the FCC in the US.
The scope for conflicts of interest in this area will
be readily apparent. Operators, faced with the
colossally expensive challenge of rolling out
superfast broadband networks would like
maximum flexibility in terms of managing, and
charging for, the use of their infrastructure. This
boils down to two key areas:
First, telecoms companies would like to
manage their resources as efficiently as
possible with the use of traffic management
techniques. This would involve, for example,
prioritising the packets of a time-sensitive
video stream (time-sensitive because the
viewer will be immediately conscious of any
delays or interruptions) over that of an email
(where the recipient is likely to be less
sensitive to a modest delay); see the
accompanying diagram.
Second, the operators would like flexibility in
charging for this prioritisation. This would
involve not only applying a premium for the
delivery of prioritised traffic, but also
potentially billing not only the recipient but
also the party sending the packets.
Naturally, the internet players are concerned that
their services might be de-prioritised in favour of
services sponsored by the telecoms operator (rival
video streaming services, for instance); and/or that
they would start having to foot more of the bill for
the ongoing explosion in data traffic volumes
(rather than this being borne by the end-user).
The FCC has been largely sympathetic to these
worries - one of the reasons that we have become
progressively less positive on the US RBOCs as
investments and more upbeat about prospects for
the incumbents in Europe, where the regulation on
net neutrality is looking more reasonable. It will
not have escaped the FCC’s attention that the US
has produced a set of enormous internet
powerhouses, such as Google and Amazon. Such
companies can export their services across the
globe in a way that domestic telecoms providers
cannot. In terms of US industrial policy, therefore,
it arguably makes sense to privilege the internet
names over their telecoms peers. This is
particularly the case given that much of the NGA
fibre upgrade has already been completed in the
US. In other words, the capital has already been
committed, and hence the regulator no longer
needs to create a more attractive returns
environment in order to stimulate the relevant
capex.
One flashpoint has been the legal case embroiling
the FCC and Comcast, the US cable giant.
Comcast had been de-prioritising peer-to-peer
traffic on its network from services like
BitTorrent. The FCC objected to this, and
intervened; in response, Comcast changed its
approach but nonetheless introduced a 250GB
usage cap on its customers. This move did not
please the regulator, which then decided to
sanction Comcast. The latter took the matter to
court, winning the case on the grounds that the
FCC lacked the necessary authority to intervene.
The longer-term implications of this tussle,
however, remain unclear. One risk is that it
incentivises the FCC to secure the necessary
authority via the statute book. However, the
regulator has also been pursuing a more informal
approach, with the aim of keeping regulation of
the internet to a minimum (which seems to be
something that most sides can at least agree is
desirable).
Nonetheless, the fact that this dispute entered the
courts in the first place is surely somewhat

19
Telecoms, Media & Technology – Equity 16 February 2011
abc
alarming. Comcast acted to ensure that it could
preserve a good quality of service on its
contended cable network despite the excessive
burdens placed on its platform by a small minority
of its customers using peer-to-peer applications.
Cable networks are intrinsically contended, as all
customers on a given street share the same coaxial
cable; hence capacity taken by one user is no
longer available for another. In such
circumstances, individual customers can degrade
the service of their neighbours, and Comcast’s
actions were taken to prevent this. It is surely an
added irony that probably the most popular use of
the application in question – peer-to-peering – is
video piracy.
Atlantic divide
In Europe, circumstances are somewhat different
to those across the Atlantic. Most of the
investment in NGA upgrades has yet to be made,
and incumbents are cautious about the economic
case for fibre. Given this environment, it makes
sense to give telecoms players as much freedom
as possible to create business models that will
support NGA deployment. Europe’s politicians
have made it perfectly plain that fibre is a priority,
out of fear that the continent’s economy might fall
behind; supporting NGA investment will arguably
be more important (in their eyes) than ensuring
that existing internet giants – largely foreign in
origin – enjoy the benefits of connecting to their
end users at the minimum price.
Ultimately, we remain of the view that hard-line
net neutrality is simply unworkable. Even in the
fixed-line network, there will always be
bottlenecks where capacity is scarce. It is simply
not possible to build a network that at all times
and in all places will be free of constraints. Given
this reality, it will always be necessary to apply
some traffic management policies. Packets
belonging to services that are particularly time-
sensitive to delay (with that most traditional of
offerings, voice, being the clearest example) need
to be conveyed with priority over and above data
traffic relating to, for example, an overnight
routine system backup. Indeed, services that are
really demanding in terms of bandwidth – such as
high-definition video – will arguably never be
able to mature successfully unless supported by
techniques such as prioritisation. It is thus,
ironically, actually in the internet players own
interests’ that prioritisation be permitted, because
otherwise they will likely find themselves
practically constrained in terms of what they are
able to offer customers with an adequate quality
of service.
Although net neutrality advocates often suggest to
the contrary, the presence of prioritisation is
actually the status quo. For example, to take a
case reduction ad absurdum, a corporate taking a
leased line is purchasing dedicated capacity
between two points, in other words, full
prioritisation. Note that traditional switched voice
services are also, in effect prioritised, given that
the circuit conveying the communications is held
open between the callers for the duration of the
call, with no other traffic being permitted over
that portion of the pipe.
It is further worth highlighting that the presence
of net neutrality should not be thought of as
necessarily helping the ‘little guy’. Net neutrality
advocates often suggest that prioritisation charges
would hamper the development of the next
generation of internet entrepreneurs, but it is
revealing that the current giants of this space
invest prodigious quantities of capital in
optimising their response times. For instance, the
likes of Google have constructed numerous data
centres at optimally located points on the global
telecoms network in order to ensure their sites’
services are as responsive as possible. In other
words, even in today’s, supposedly ‘net neutral’
world, the advantage lies with the scale players.

20
Telecoms, Media & Technology – Equity 16 February 2011
abc
Admittedly, to agree that there ought to be some
form of traffic management does not necessarily
imply that a charging structure should be
employed. It might be conceptually possible to
introduce a hierarchy, where all video enjoyed
priority over voice, voice over emails, and emails
over backups (for example). But there are obvious
problems with this arrangement. For instance, a
corporate’s voice communications might be held
to be more important than a schoolchild streaming
YouTube videos. Of course, the conventional
method employed to allocate scarce resources (at
least in capitalist societies) is to use a pricing
mechanism. This gives customers the ability to
ascribe a value to the timeliness of the delivery of
their data. Without such a pricing mechanism
acting as a deterrent, the likelihood is that all
traffic would soon become flagged as highest
priority video, rendering the whole system otiose.
There is also the broader point, well made by
Ofcom in its recent report Traffic Management
and ‘net neutrality’ (24 June 2009), that it is
hardly desirable that regulators determine from
the very outset what business model an industry
should pursue. Ofcom cites the example of
newspapers, which charge not only their readers
(ie the purchase price) but also businesses wanting
to reach those readers (ie for advertising). In
effect, the advertising cross-subsidises the
purchase price of the newspaper.
To apply a similar template to, say, an IPTV
service, the cost might be borne partially by the
viewer (via a subscription charge) and partly by
the corporate owning the content (via
prioritisation fees). This is not so very different
from the way in which traditional broadcasters
work today, since they already pay fees to those
operating the broadcast platform (whether
terrestrial or in geosynchronous orbit).
Non-discrimination and transparency
European NRAs seem to be gravitating towards a
relatively hands-off approach, while at the same
time making it clear that they will be imposing
demands in terms of non-discrimination and
transparency. On the former issue, ARCEP (the
French regulator) has made use of a powerful
analogy, comparing the situation to that of a toll
road. ARCEP observes that toll roads price
differentiate price between cars and trucks, on the
grounds that the latter are more demanding than
the former (since trucks will cause more wear to
the road, and thus require higher maintenance to
support). However, toll roads are not able to
discriminate between, say, a red truck and a blue
truck.
Translating this into the world of telecoms, this
suggests that a network should be able to price
delivery of packets that are part of a high-priority,
time-sensitive video stream over and above those
that comprise an email. However, it would not be
permitted to discriminate between a video packet
originating from an incumbent retail division’s
IPTV product over one originating with the
equivalent service of a rival (assuming, of course,
that the two were paying for the same level of
video prioritisation). This is, in our opinion, the
real risk that regulators are entitled to address,
rather than the excitable warnings about the
emergence of a new form of ‘censorship’ that are
heard from some quarters. (For instance, certain
of the shriller voices on the net neutrality side
have even claimed that, were net neutrality
ignored, Republican-leaning political blogs would
be quicker to access than Democrat-leaning sites;
such claims seem far fetched).
It will be observed that the debate over non-
discrimination is therefore in essence merely
another repeat of the time-worn ‘infrastructure
dominance leads to downstream market
advantage’ concern, which has been frequently

21
Telecoms, Media & Technology – Equity 16 February 2011
abc
dealt with in the regulation of incumbents. (A
good example being the fact that many
incumbents’ retail arms are obliged to purchase
ADSL services from their associated wholesale
divisions on precisely the same terms as third-
party resellers).
European regulators like Ofcom do, however, flag
the fact that the pricing of prioritisation could in
future become a concern to them. For instance, if
access to the end consumer was controlled by a
relatively small number of parties (quite possible
in a NGA world), this might facilitate over-
charging for prioritisation – which would, in turn,
necessitate regulatory action. But, as Ofcom
acknowledges, this is certainly not an issue at
present.
The above said, being permitted by the regulator
to charge for prioritisation and actually being able
to successfully push through such tariffs are two
entirely different things. So, while the regulator
might be happy for an incumbent to charge for
prioritisation, this is not to say that the latter
would actually be able to persuade, say, Google to
pay such a fee for streaming HD video. And if an
operator was unable to make Google pay, then (on
grounds of non-discrimination) it would find it
difficult to force others with HD video content to
do so. Any broadband provider that refused to
provide prioritised connectivity to Google (since
the latter would not pay the relevant premium)
would obviously risk losing many of its customers
– who might well churn to any competitor that
was prepared to deliver the necessary prioritised
bandwidth without the incremental tariff
(presumably with the goal of taking market
share).
This could prove a stiff test, though the
concentration of the infrastructure market that we
envisage with the evolution towards NGA
platforms should help. The capital intensity
involved in this transition should concentrate the
market, and with fewer participants (each of
which will have committed very substantial
capital to its access network), it is easier to
envisage how an element of prioritised tariffing
might be introduced. It would likely be easiest to
charge incrementally for the prioritisation
required to support newer services, such as the
streaming of HD video. It is also worth
highlighting recent developments in the mobile
market, where the adoption of tiered pricing plans
has been near-uniform – despite the temptation
that would have presented itself to some networks
to decline to follow, and instead to look to capture
market share.
The other vital requirement is that operators be
transparent with their customers about their traffic
management. In other words, customers must be
made aware of the way in which their traffic may
be ‘shaped’. Although this objective is simple
enough to set down on paper, it could prove a real
challenge to implement in practice – after all, the
topic is a complex one with many variables, and it
would be difficult to convey to consumers the
day-to-day implications of the differing
prioritisation offerings. Nonetheless, according to
EC Commissioner, Neelie Kroes, transparent
traffic management is ‘non-negotiable’. This
could become a thorny issue, but the generally
well-considered tone of most European regulators
on the whole net neutrality subject is surely a
positive for telecoms investors. To quote Ofcom:
At the current time we do not think there is
compelling evidence of anti-competitive
behaviour. Therefore, we do not think that there is
a strong rationale for preventing ex ante all forms
of traffic management. Indeed, given the potential
for network congestion, some forms of traffic
management are likely to lead to consumer
benefits.

22
Telecoms, Media & Technology – Equity 16 February 2011
abc
Rise of the CDN Net neutrality is an important topic already, but is
set to become still more so as over-the-top (OTT)
services develop (where OTT denotes any third-
party service delivered over the top of a
broadband platform). Historically, the telecoms
space has been dominated by vertical integration –
that is to say, those operating the infrastructure
have typically also been those selling services
utilising that infrastructure (ie voice, and so on).
However, regulators have intervened in order to
ensure that dominance ‘upstream’ in the network
does not bestow dominance ‘downstream’ in the
services.
As the arguments above (hopefully) outline, it is
perfectly feasible to introduce priority charging
without doing so in a discriminatory fashion that
advantages the incumbent’s own retail services.
And, with access to superfast bandwidth
consequently equally accessible to all, it becomes
all the more important to ask the question whether
or not those providing the network connectivity
are necessarily best placed to deliver the services
that utilise them. After all, to employ an analogy,
most road construction companies do not
manufacture motor vehicles, or run coach
services.
In a regulatory environment where operators are
able to use techniques like bundling to leverage
their network platform advantage (for instance, by
offering packages combining telephony,
broadband and IPTV), it makes sense to do so
(see our thematic report, Quadrophonia, February
2006). But where this type of cross-leverage is
inhibited, the best course of action becomes much
less apparent.
Naturally, there remain some persuasive
arguments in favour of telecoms operators
persisting with the bundling of products that are
outside their traditional sphere of expertise, but
that may nevertheless help them sell connectivity.
So we would continue to advocate operators
pushing IPTV as a part of their service suite.
Persuading customers to take broad bundles also
has a proven track record in terms of lowering
rates of churn. However, we would caution that it
is generally (though with some notable
exceptions) difficult to see how the typical
telecoms operator – at least in developed, western
markets – is really likely to add value in its
capacity as, for example, a media player.
Unless the operator is prepared to invest in
content of its own (a prospect that would probably
terrify the majority of investors), it would simply
be reselling others’ product – with likely thin
margins. Hence, even if a telecoms company
achieved reasonable market share and thereby
captured incremental revenues, the additional
profitability associated with this activity would
likely be relatively minor.
Media content distribution through long-haul vs CDN
Media company
using CDN
Regional server
Regional server
Media company
using long-haul
Media company
using CDN
Regional server
Regional server
Media company
using long-haul
Source: HSBC
But another powerful justification for operators
getting involved in this space is to stimulate the
market in general, knowing that they will receive
their reward, if not necessarily from selling the
service itself, then through providing the
underlying connectivity. And, whereas the gross
margin involved in reselling others’ content is
often negligible, the gross margin from providing

23
Telecoms, Media & Technology – Equity 16 February 2011
abc
superfast broadband connectivity ought to
approach 100%.
In other words, operators need not make a
colossal success of their own retail IPTV efforts
to nonetheless benefit from IPTV services. After
all, whoever owns the content still needs a
distribution mechanism to get it to the viewer –
and the most flexible and powerful of these is the
telecoms (or cable) pipe. The quicker new
applications dependent on superfast bandwidth
develop, the quicker and more compelling end
customers will find the NGA proposition. In other
words, the best way for an operator to spur fibre
adoption may be to ensure that a wide range of
applications are available over its platform – and
are certainly not restricted to those provided via
its retail arm.
Hence, regulatory and commercial interests may
converge with the practical business reality that
telecoms operators are not identified by
consumers as the most natural providers of
services beyond telecoms. And there are signs that
some operators are beginning to acknowledge
this, for instance through their investment in
content delivery networks (CDNs). Capex in this
field is effectively providing third-party providers
of OTT services with the infrastructure they
require to ply their trade. Hence we might say that
CDNs deployed by telecoms incumbents are, in
effect, the infrastructure and connectivity face of
OTT services.
What is a CDN?
The principle behind a CDN is simple enough.
Instead of, say, a media company streaming its
video content from a single bank of servers in one
location to customers wherever they are in the
world, the idea is to distribute the content to
regional servers, closer to the end user. This
obviously significantly cuts down on the quantity
of ‘long-haul’ international data traffic generated,
thereby saving the content owner on traffic
carriage fees.
So telecoms operators could be forgiven for
regarding CDNs with some suspicion, since they
effectively undermine certain revenue streams.
But in practice, operators have often been keen to
have CDNs attached to their network because the
resulting additional traffic enables them to
negotiate better interconnection terms with rival
telecoms networks. Moreover, if time-sensitive
services like video streaming are to achieve the
high degree of quality of service required before
they are to take off, it is clearly advantageous that
the content be as close as reasonably possible to
the consumer (as a shorter distance, requiring
fewer hops between servers, naturally facilitates
quicker delivery and means there is less to go
wrong).
The CDN arena has been dominated by specialists
in this field, often deploying their own proprietary
technologies so as to optimise their service. The
largest and best known of these companies is
Akamai, although it has numerous smaller
competitors. These ranks are now being joined by
the telecoms operators themselves.
The challenge
The CDN represents an interesting revenue
opportunity in its own right so far as the telecoms
operators are concerned. But this field is not
without its challenges: not only does it already
contain a set of entrenched players, but many of
the potential clients could be OTT competitors of
the incumbents. Nevertheless, CDNs are the type
of ‘connectivity’ service in which telecoms
operators ought to have some natural advantages.
One notable aspect of this market is that, because
it has evolved on an ad hoc basis, there has been
little by way of standardisation – quite a contrast
from the telecoms world, where everything
depends on the network effect. Therefore, one
24
Telecoms, Media & Technology – Equity 16 February 2011
abc
opportunity open to the telecoms operators is
effectively to leverage the benefits of
standardisation by bringing this to the CDN
industry, perhaps by forming an international
alliance (although such arrangements admittedly
have a poor track record in telecoms).
One of the benefits to the client of this approach
would be that it could rely upon having its content
distributed from multiple locations across the
globe while only having to manage one, unified
set of technology protocols (even if the various
participants were to use different flavours of
technology underneath). This would also address
an obvious weakness of existing operator CDN
capabilities: although incumbent networks have
unparalleled depth in their home markets, they
typically lack the global reach of the larger CDNs
(meaning that content owners could be put to the
inconvenience of securing deals with several
different companies if they were to cover different
regions).
But can the telecoms operators persuade content
owners to come to their CDNs? Some of the
internet giants that have invested heavily in their
own hosting facilities are in direct competition
with the operators in many market segments; the
likes of Google and Apple fall into this category.
Another prominent class of CDN customer are
those engaged in OTT IPTV services. To cite an
example, the BBC uses Akamai’s platform to host
its popular on-demand iPlayer service.
Parties such as the BBC, that regard themselves
essentially as content producers, and which have
no ambitions in the area of connectivity, might
well be prepared to consider a telecoms-run CDN,
were the price/service level advantageous.
However, other OTT players will have conflicts
of interest: for instance, BSkyB competes with BT
in both television services and ADSL. This rivalry
would likely make it difficult for BSkyB to rely
upon BT’s CDN service.
Nonetheless, it is interesting that BT’s Wholesale
division has recently established a UK CDN
capability (known as ‘Content Connect’) with the
specific objective of hosting video content –
suggesting that it sees OTT IPTV of one sort or
another as an appealing market segment.
Doubtless BT Retail will become a customer,
given the latter’s ambitions for its Vision payTV
product. And Orange – assuming it moves into the
IPTV arena – would also seem a likely customer,
given that it has already decided to take a BT
wholesale product for its retail broadband
offering.
The other potential differentiation that operator
CDNs might offer relates to their ability to
leverage their control of the underlying network to
provide quality of service (QoS) functionality and
guarantees. It is fair to say that content providers
at present remain unconvinced about the merits of
this proposition. This may largely be as a result of
uncertainties over the business model, and in
particular the controversial question of which
party should pay the premium that a prioritised
QoS streaming service would entail. But, at least
in those markets where regulators adopt an
enlightened approach to net neutrality (ie permit
scarce network resource to be rationed on price –
as looks likely in Europe), it would appear
probable that telecoms CDNs could monetise this
capability. This should particularly be the case as
video becomes ever higher definition, so imposing
a greater burden in terms of the sheer volume of
data packets requiring prompt delivery.
Furthermore, it may become harder for existing
CDNs to continue to provide their present level of
quality of service. In the past, CDNs have often
been able to install their servers at key points on
the telecoms operators’ networks. The operators
have consented to this because having the data
cached locally cuts down on the cost of transiting
it in from elsewhere. But the telecoms players
25
Telecoms, Media & Technology – Equity 16 February 2011
abc
might now start charging properly for this
privilege; if this leads to third party CDNs hosting
their content at more distant locations, it could
impair the QoS provided. In turn, this would
increase the appeal of operator-controlled CDNs,
given their ability to provide QoS guarantees.
We therefore conclude that CDNs should provide
some potential upside for the telecoms operators.
Based on the company’s own estimates, Akamai
delivers around 15-30% of all web traffic. In
2011, Bloomberg consensus anticipates revenues
of USD1.2bn and EBITDA of USD544m; as of 11
February, the company had a market capitalisation
of USD7.5bn. If we make the simplistic
assumption that all web traffic is handled by
CDNs (which is not as unrealistic as it might
sound given the particularly heavy bandwidth that
video consumes), then we can gross up to an
estimated market size of about USD4-8bn.
Of course, given the likely increasing importance
of this service, these numbers are doubtless set to
grow strongly. Nonetheless, the size of the market
– while material – is still relatively modest by
comparison with that for connectivity in the
access layer, which NGA upgrades address.
Hence the importance of CDN for telecoms
incumbents is arguably as much in their
recognition of the need for CDNs to drive OTT
services in order to spur NGA penetration rates as
in their intrinsic profitability.
Fixed-line technology The view that a degree of pricing power should
return to the fixed-line telecoms subsector is
clearly predicated on the idea that an element of
scarcity is returning to the sector, given the
tremendous expense of the fibre upgrades that are
now underway. What, though, if alternative
technologies emerge that would permit operators
to upgrade to superfast broadband speeds without
the capital commitment demanded by fibre-based
systems? Recently, a set of upgrades to copper-
based DSL technologies have led to the
suggestion that fibre investment may be
premature. Were this the case, it would obviously
call into question the presence of scarcity in fixed-
line telecoms, and thus the sustainability of any
pricing power that the incumbents might have
begun to enjoy here.
Phantom of the copper-a
Although fibre clearly represents the future of
telecoms access networks, as an infrastructure it is
plainly both expensive and time consuming to
deploy. (Indeed, this is one of the reasons we like
the technology: since it is intrinsically expensive
even to unbundle, let alone to replicate – and the
capital involved should therefore also elicit more
supportive regulation).
However, the above said, a number of vendors
notably including Alcatel Lucent, ECI Telecom
and Ericsson are actively pushing two innovations
that could potentially squeeze more life out of
copper-based DSL systems: namely vectoring and
what is (rather cryptically) termed ‘phantom
mode’.
Alcatel Lucent announced in 2010 the results of a
laboratory test in which two bonded VDSL2
copper pairs delivered 300Mbps over 400 metres
and 100Mbps over 1km. By comparison, a single
VDSL2 copper pair line would have a maximum
bandwidth of around 100Mbps.
These enhanced speeds were, in part, the result of
implementing dynamic spectrum management
level 3 (DSM L3) commonly known as
‘vectoring’. This exploits similar techniques to
those used in noise cancelling headphones to
mitigate far-end cross-talk (FEXT), which acts as a
substantial impairment to the bandwidth and range
that can be provided over bonded DSL pairs.

26
Telecoms, Media & Technology – Equity 16 February 2011
abc
A further boost to the available bandwidth is
generated through the creation of a third, virtual pair.
DSL pairs consist of a ground wire and a signal wire.
When two pairs are bonded together, one of the
ground wires is effectively surplus, and can be
converted into a signal wire, a technique known as
‘phantom mode’. Again, vectoring is applied to
reduce the negative effects of cross-talk from the
phantom mode circuit. Bonded together, these
techniques together can – in the laboratory at least –
create a 300Mbps pipe.
Naturally, these speeds sound exciting. Moreover,
superficially, these technologies might seem to be a
real positive for the industry, since they could
materially reduce its capex requirements. However,
for the reasons outlined above, it turns out that the
amount of capital required for fibre upgrades
(affordable to incumbents but inaccessible to most
altnets) is in fact an important positive for the sector.
But, leaving such points aside, the new technologies
are in fact less practical than they might at first
appear. Firstly Alcatel Lucent’s test relied upon
high-quality 0.6mm-gauge copper. While this might
be standard issue for new copper pairs installed in
the last twenty years or so, the vast majority of the
world’s installed copper plant consists of poorer
quality, thinner, less conductive 0.4mm or 0.5mm
lines.
Secondly, to take advantage of the new technologies,
a home requires not one but two copper pairs. This is
unusual in most markets: lines were doubled up in
the narrowband internet era, when households would
have a second line dedicated to their internet
connection, but this was rendered redundant by the
shift to broadband.
It is also worth noting two additional handicaps.
Firstly, new customer premises equipment (CPE) is
required, as well as upgraded line cards
(incorporating dedicated chips capable of coping
with the greater signal processing demands of real-
time noise cancellation). Secondly, in order to derive
the full benefit from vectoring, an operator really
needs to control all of the pairs connected to the
DSLAM; clearly, this is typically not the case in
markets where local loop unbundling has gained
traction. Hence, our conclusion remains that fibre-
based systems (whether FTTN/VDLS or FTTP) are
required to deliver superfast broadband services, and
given the capital that these roll-outs require, we
continue to be of the view that they will reassert the
importance of capital and scale within the industry.
Techniques such as vectoring and “phantom mode” have produced greater speeds from bonded VDSL2 over copper in lab tests
Ground wire
Signal wire
Ground wire
Signal wire
Signal wire
Ground wire Signal wire “Phantom circuit”
Signal wire
Ground wire
Ve
cto
ring
miti
gate
s FE
XT
b
etw
een
sig
nal w
ires
Vec
tori
ng m
itiga
tes
FE
XT
from
Ph
anto
m
Ground wire
Signal wire
Ground wire
Signal wire
Signal wire
Ground wire Signal wire “Phantom circuit”
Signal wire
Ground wire
Ve
cto
ring
miti
gate
s FE
XT
b
etw
een
sig
nal w
ires
Vec
tori
ng m
itiga
tes
FE
XT
from
Ph
anto
m
Source: HSBC

27
Telecoms, Media & Technology – Equity 16 February 2011
abc
NGA roll-out status
Country Technology Coverage achieved by the incumbent
Incumbent's coverage target Cable network status Cable vs incumbent Broadband market shares
Belgacom VDSL 76% population coverage by end-Q3 10
80% by mid-2011 TNET has upgraded 100% of its network with DOCSIS3.0
Battle of equals 61% incumbent and altnets, 39% for Cable
British Telecom
VDSL/FTTH Ramping up the coverage, aim to reach 4m HH by Dec 2010, adding 70k HH/week
10m (c40%) premises by 2012 (o/w 2.5m FTTH)
50% UK coverage , but100% of its network is DOCSIS3.0
VMED at an advantage in the medium term
21% for Virgin Media Vs 28% for incumbent
Deutsche Telekom
VDSL/FTTH VDSL coverage 25% of German homes
Plans to increase VDSL coverage to 31% HH (c12.4m HH) by 2012, 10% FTTH coverage (c4m HH) by 2012
UnityMedia and KabelBW have upgraded 95% of footprint, Kabel Deutschland 30%; by March 2012 65% of all German homes will have DOCSIS3.0
Cable at advantage even in 2012 1/3 of German homes covered by DOCSIS3.0 but no telco NGA infrastructure
DT 45%, Cable 13%, rest altnets
France Telecom
FTTH c650k HH passed by FTTH at end Q3 10
Fibre in all 96 homeland and in 3 overseas administrative districts by 2015
Numericable covers 9m homes out of 26m, no clear indication of DOCSIS3.0 coverge, we assume c2.7m homes
Cable at a disasdvantage (weak financials + FT Ilad and SFR inveting in FTTH)
Cable is 6% of the BB market
KPN VDSL/FTTH KPN is rolling out FTTH through its JV Reggefiber and has already passed 658k homes. Has 80 % IPTV coverage with VDSL/ADSL+
Targeting 1000-1300k homes passed by FTTH by 2012e and has ambition of 30-60% coverage in Netherlands
UPC (Liberty Global) is nearly fully DOCSIS3.0 upgraded and Ziggo is fully DOCSIS3.0
Battle of equals KPN 41%, all other cables 40% (as of Q4)
Portugal Telecom
FTTH 1m homes passed by Dec 2010
Reach 1.6m households with FTTH
DOCSIS3.0 100% upgraded completed with 3.2m homes passed
Battle of equals (ZON covers more households with DOCSIS3.0, but PT's FTTH is superior to DOCSIS3.0)
PT: 46% ZON: 33% (as of Q3 10)
Swisscom VDSL/FTTH 78% VDSL coverage FTTH coverage of 1m (33%) households by 2015
DOCSIS available to 75% of home passed by Cablecom (Liberty Global)
Battle of equals Cablecom 18% vs incumbent 55%
Telecom Italia
VDSL Upgrading Milan and to start Rome, no significant progress yet.
Target to reach 10-12% HHs by 2012. And 50% HHs by 2018
No cable in Italy TI 55.7% (as of Q3 10)
Telefonica VDSL Awating for regulatory clarity. No material progress as such
Previously guiding to spend EUR 1bn in the period 2008-2012. Update expected in April 2011 (Investors day)
ONO covers 7m homes (44% of total), out of which 4.7m upgraded to DOCSIS3.0 (as on Nov 10)
Battle of equals TEF: 54%, all cable 18.5% (Q2 10 CMT data)
Telekom Austria
VDSL/ FTTEx/ FTTC/FTTH
42% of HHs have access to Giganet network through comination of FTTEx (38%), FTTB,FTTC & FTTH (4%)
Giganet Access (combination of FTTEx, FTTC, FTTB, FTTH) for 50% of Austrian Households by 2011
UPC Austria (LGI) has DOCSIS3.0 covering 40% of Austrian homes
Battle of equals, TKA covers cable footprint with VDSL or FTTH; TKA only incumbent guiding for net line growth
30% TKA, 16% cable, 35% mobile bb only, rest altnets
TeliaSonera VDSL/FTTH Fiber to 430k households (10% of total households)
Fiber to 50% of households by 2014
ComHam covers 40% of Swedish homes and has mostly upgraded to DOCSIS3.0
Battle of equals but with Telia clear commitment to invest in NGA
Telia 35%, ComHem 19%, Bredbandsbolaget 15%, rest altnets
Source: Companies, HSBC
28
Telecoms, Media & Technology – Equity 16 February 2011
abc
Introduction The idea that mobile data capacity is intrinsically
scarce and that this will result in pricing power for
the operators has proven highly contentious. For a
variety of entirely understandable reasons,
operators are nervous about broaching the subject.
Even the suggestion that a company’s network is
under strain and might require remedial
investment might scare off investors and
customers alike. But, that said, there is now an
increasing body of evidence in support of the
arguments originally outlined in our thematic
reports The Capacity Crunch (8 December, 2009)
and Frequonomics (March, 2010). For those
unfamiliar with the technological arguments
underpinning our view on the intrinsic scarcity of
mobile data capacity, we have summarised our
thesis in the final part of the present section.
A few operators such as AT&T and America
Movil now have the confidence to guide for
higher capex, and, in the meantime, there has been
a profusion of networks introducing tiered data
plans to ration their scarce bandwidth resource.
We believe that tiered tariffs will enable operators
to properly monetise the data opportunity. The
potential profitability of this area remains subject
to intense scepticism, although we would
highlight the fact that the track record of eMobile
in Japan – a mobile operator that only provides
data services – is extremely encouraging (moving
from service launch to operating profit break-even
in just under three years).
SuperFrequonomics In our view, the mobile telecoms market stands at
an important juncture. In the past, capacity has
been relatively abundant, thanks in no small part
to the fact that each new generation of technology
has enabled operators to squeeze significantly
greater volumes of traffic over a given portion of
radio spectrum. In tandem with steady increases
in the quantity of radio frequencies devoted to
mobile services, and rapid growth in the number
of base stations deployed by the operators, this
has enabled the industry to move from niche
status to supplying the communications needs of
billions globally.
However, existing technologies are already highly
efficient, and, indeed, are approaching the
physical constraint that is the Shannon limit. This
caps the quantity of data that can be conveyed
over a Hertz of radio frequency in a second.
Given the interference levels that we can expect in
most environments, the Shannon Limit stands at
around 2 bits per second per Hertz. Current
technology already manages around 1, implying
that a doubling in efficiency is the theoretical
maximum; in practice, the next generation of
4G/LTE equipment is likely to be around 30%
more efficient than today’s systems.
Mobile connectivity
Pricing power evident in widespread shift to tiered data tariffs
Certain operators now prepared to indicate capex is set to rise
eMobile shows data-only services can generate healthy profits

29
Telecoms, Media & Technology – Equity 16 February 2011
abc
Of course, operators can also purchase more
spectrum (although this can be very expensive)
and build more base stations (also costly). We
would expect them to do both, and with vigour.
We also anticipate use of alternative strategies –
everything from MIMO (multiple input multiple
output antennae) to base station caching to
wireline offload (of which more later). Yet,
despite all of this, we still think that capacity will
be intrinsically scarce and hence require rationing
by means of price.
Given the unpopular and contentious nature of
capex in telecoms, we would expect operators to
delay as long as possible before investing more.
Certainly, they will need to demonstrate the
attractiveness of the opportunity before they will
be able to confidently justify the additional
expenditure. Hence, the first evidence that we are
on the right track with this thesis is unlikely to
emerge in the capex line. Instead, we would argue
that investors should look to operators’ approach
to tariffs as a leading indicator. Because, by
adopting the appropriate pricing strategy, and
rationing their scarce capacity resource, operators
should be able to manage their capex line while
demonstrating to the market the appeal of data
services. Once this has been accomplished, they
can subsequently announce their intention to
invest more without the same risk of pillory.
The AT&T narrative
AT&T is arguably the best example of a corporate
establishing this narrative. On the company’s Q3
2009 conference call in October, management
were adamant that the network was up to the job,
despite the numerous complaints from iPhone
customers that the AT&T platform was
Shannon Limit sets a ceiling on mobile spectrum efficiency
1
2
3
4
5
6
0
-15 -10 -5 0 5 10 15 20
Typica l loaded mobile n etw ork (outdoors)
Inaccessible
Region
Lower interference environmen ts e .g. isolated hotspots, femtocells
Shannon li mit
Shannon li mit with 3dB offset
OFDMA
CDMA (HSPA)
Required SN R (dB)
Ach
ieva
ble
rate
(bps
/Hz)
1
2
3
4
5
6
0
-15 -10 -5 0 5 10 15 20
Typica l loaded mobile n etw ork (outdoors)
Inaccessible
Region
Lower interference environmen ts e .g. isolated hotspots, femtocells
Shannon li mit
Shannon li mit with 3dB offset
OFDMA
CDMA (HSPA)
Required SN R (dB)
Ach
ieva
ble
rate
(bps
/Hz)
Source: Alcatel Lucent, HSBC
Capex/sales for various operators with wireless operations
0%
2%
4%
6%
8%
10%
12%
14%
16%
18%
Vodafone AM X AT&TWireless
Sprint NextelWireless
VerizonWireless
2009 2010 2011e
Source: Company reports and HSBCe
30
Telecoms, Media & Technology – Equity 16 February 2011
abc
struggling. Then, at the Q4 2009 results
conference call in January 2010, the company
unveiled a significant network investment
programme. But with service revenue growth in
the mobile division of nearly 10%, there were few
complaints. And, in fact, capex growth in the
wireless division for the full year 2010 eventually
came in at around 50%, considerably higher than
implied in the original guidance (a USD2bn or
c30% increase) Investors, though, can plainly see
that the capital is being invested in what is a very
attractive business.
AT&T was also among the first operators to shift
to tiered pricing structures for its iPhone4
smartphones. Such plans have the advantage of
linking consumption with revenues, encouraging
customers to consume capacity responsibly (rather
than utilising their connectivity for peer-to-peer
activities, for example) and, very likely, to
ultimately spend more to obtain additional
bandwidth (in the same way that many customers
have migrated over a period of time to larger
minute plans commanding a higher ARPU).
Remarkable uniformity
Operators right across the developed world have
followed suit in a remarkably short period of time
(while most in the emerging markets had refrained
from offering unlimited data plans in the first
place). In a fractious, highly competitive market
like mobile, where operators are quick to pounce
on any opportunity to take market share, a shift
displaying such uniformity demands a coherent
explanation. The ‘control experiment’ provided
by the voice market (where unit prices continue to
decline rapidly) indicates that, whatever is taking
place, it is unique and specific to the data arena –
rather than being a function of the broader
competitive environment, for instance.
In our minds, the only plausible driver of this
rapid transition is the emergence of capacity
constraints among the operators. An operator
contemplating the otherwise risky introduction of
caps to its data plans can move with greater
confidence because it understands that its rivals
are in a very similar situation, facing similar
challenges. In other words, any operator leading
the way by introducing tiered pricing plans will
likely find its chief competitors following, rather
than attempting to seize market share by
exploiting the lead operator’s introduction of a
more complex and inflationary tariff.
So it was perhaps not so surprising that, at its H1
2010/11 results presentation, Vodafone
management indicated that in almost all of its
European markets, its introduction of tiered data
plans had been followed – rather than undermined
– by its chief competitors. We would infer that the
one exception that Vodafone alluded to was the
Dutch market. And even here, according to KPN’s
Q4 2010 results presentation, the market has now
moved in the direction of tiers.
This is not to suggest that the pricing moves have
been entirely in one direction. Nevertheless, the
degree of uniformity witnessed is remarkable by
telecoms standards. But what of the dissenting
voices? As discussed in our SuperFrequonomics
report (September 2010), some of these are
relatively small operators that are perhaps not
greatly significant in terms of the overall market
(such as Virgin Mobile USA, part of Sprint
Nextel). Others result from local market
circumstances (for instance, South Korean
operators have an unusual abundance of capacity
due to years of government-sponsored, industrial
policy-driven, over-investment in network). Still
others have indicated that their current all-you-
can-eat offers are unsustainable in the longer-term
(for example, Telenor Sweden). However, one
prominent European operator is keen on flat-rate
data tariffs, namely Three.
The view at Three is that the operator has
sufficient capacity not to need to ration it tightly

31
Telecoms, Media & Technology – Equity 16 February 2011
abc
by means of price. What is particularly interesting
about this is that its network sharing partners in
the UK (originally T-Mobile, but now also
Orange, as a result of the ongoing merger between
these two) seem to take a very different view,
despite the fact that all effectively operate off the
same infrastructure. So it is notable that, despite
Everything Everywhere (the name of the
combined Orange/T-Mobile UK entity)
highlighting at its inaugural presentation its
advantage in terms of numbers of base stations
over its rivals O2 and Vodafone, it nonetheless
has the tightest caps among its peers restricting
the usage of its iPhone4 customers.
Who is right? Is capacity abundant, implying that
Three UK can afford to maintain its generous
offers on mobile data? Or is Orange/T-Mobile
UK’s characterisation more accurate, implying
that Three will – in time – be forced to more
tightly limit the bandwidth its customers
consume? At this stage it is too early to tell
directly, although it must have been one fear at
France Telecom and Deutsche Telekom that
merging their UK mobile assets would effectively
permit Three (which had established a prior
network sharing arrangement with T-Mobile UK)
to ‘piggyback’ on the capacity advantage that the
merger was in part designed to create. Everything
Everywhere has therefore been at pains to
emphasise that, if Three generates the requirement
for additional network capacity, then it must bear
the relevant costs.
The real challenge for Three will be what an
economist would term ‘adverse selection’. What
type of customer would consider churning from
their existing network to Three because the former
introduced tiered pricing structures, thereby
effectively capping usage? The answer, plainly, is
that the customers most prone to jump ship are
those who consume the greatest bandwidth. Given
the capex required to support such customers, the
network losing them may consider itself to have
enjoyed the better side of the bargain.
Network failure
Furthermore, recent events in Australia at another
of Three’s networks do raise questions about
operators’ ability to meet the rapidly intensifying
demands of today’s mobile customers. Three’s
Australian business has merged with that of
Vodafone, and competes against Telstra, the
incumbent, and Optus, part of SingTel. In an
effort to gain market share, Vodafone/Hutchison3
positioned itself with a set of generous plans
encouraging heavy voice and data usage.
Unfortunately, even the operators’ combined
network does not seem to have been fully up to
the challenge of meeting the resulting demand.
Customer dissatisfaction has culminated in the
appearance of a local website dedicated to
charting the network’s failings, and even to the
potential launch of a class action lawsuit, with
disgruntled customers looking to sue over the
allegedly poor nature of the service. In response,
the CEO has issued a public apology, and pointed
to the company’s AUD550m network upgrade
programme. With respect to Vodafone
specifically, it should be stressed at this point that
the group’s Australian activities are not a
substantial proportion of the company (and thus
do not derail our investment thesis); as well as
that Vodafone has typically considerably out-
invested its rivals, and so should actually enjoy a
competitive advantage versus the competition in
most of its markets of operation. Nevertheless,
this example is useful in terms of highlighting the
problems that can rapidly emerge when pricing
plans encourage usage that the underlying
network is unable to support.
To summarise, in view of the type of experience
seen in markets like Australia (as well as the
previously mentioned example of Telenor
Sweden), it remains our view that unlimited plans

32
Telecoms, Media & Technology – Equity 16 February 2011
abc
are counter productive. If network service quality
is impaired, the resulting damage to an operator’s
brand could prove enduring. The risks therefore
involved with flat-rate pricing perhaps go a long
way towards explaining its increasing rarity.
Note, though, that while operators would (in our
opinion) be well advised to avoid selling data
tariffs on the basis of a flat rate, all-you-can-eat
approach, nevertheless this concept remains
highly attractive from a marketing perspective.
Hence operators’ marketing may well continue to
suggest that their plans provide a ‘flat-rate’
approach, even while they are in actuality merely
selling a finite chunk of data. So, for example,
certain of E-Plus’s data plans in Germany are
described by the operator as ‘flat-rate’ but in fact
have caps varying between 50MB and 5GB.
Recent pricing trends positive
As discussed above, starting from Q2 2010, tiered
data pricing has been spreading rapidly across the
industry. In the months following the publication
of SuperFrequonomics report (September 2010),
there have been many further announcements
confirming this shift as a consolidated trend. A
selection of the most interesting examples are
detailed below.
Vodafone (Europe)
Vodafone announced in its fiscal Q3 2010/11
(calendar Q4 2010) results release that the
company had completed the migration to tiered
data plans in eight western European markets. The
remainder will follow in Q4 2010/11, so that by
the end of March 2011 all the European
operations should have moved to tiered data
tariffs.
Taking tiering one step further is the practice of
‘smart notification’, which has been tested with
success in the UK over the last quarter. As users
approach their allocations, they are contacted and
offered either a block of additional data or the
option of upgrading to a bigger plan. Such
solutions reinforce the inflationary potential of
tiered data plans. Vodafone will extend the
service to other Western European markets this
quarter, starting with Germany and the
Netherlands.
A further sign of Vodafone’s determination to
ration data capacity comes with the news that
allowances in Italy are being reduced from
2GB/month to 1GB/month, although this move
has so far not been followed by the main
competitor, Telecom Italia.
Everything Everywhere (UK)
The new joint venture between Orange and T-
Mobile in the UK unveiled its strategy in
September last year. The new entity will have the
densest network in the country and enjoy the
largest spectrum allocation. Despite this, it has
decided to opt for tiered data plans: it is currently
offering data in similarly sized blocks as
Vodafone and O2 (500MB or 1GB per month).
Hence, all large operators in the UK have now
introduced what appear to be sensible usage caps.
However, Hutchison 3G has instead decided to
head in the opposite direction and revert to a flat-
rate ‘all-you-can-eat’ approach for the 16GB
version of the iPhone4 (for the 32GB model
500MB and 1GB per month plans are offered in
addition to all-you-can-eat). This is likely to
encourage very heavy users (eg those partial to
peer-to-peer download activity) to churn towards
Three. Arguably, these are the least desirable type
of customers: heavy users with no willingness to
pay.
It is also worth introducing our usual market share
analysis at this point. We would describe Three as
an ‘infant’ player, as it has not yet achieved a
percentage market share in the teens (so as to
qualify as a ‘teenage’ operator). Just like their
teenage rivals, infant networks certainly have the

33
Telecoms, Media & Technology – Equity 16 February 2011
abc
incentive to disrupt the market; however, unlike
teenage operators, they typically lack sufficient
weight to really rock the boat. When teenagers
introduce aggressive price plans, the ‘adults’
(companies with 20%+ market share) generally
must counter; but infants generally the lack the
brand, network and high-street penetration to
force a response.
KPN (Netherlands)
Management has now delivered on the
undertaking made at the Q2 2010 results, namely
that KPN would migrate to tiered data plans in the
Netherlands by the end of 2010. All iPhone plans
come with a data bundle of either 500MB or 1GB
per month. The 1GB per month data plans cost
between EUR45 and EUR110, depending on the
chosen allocation of voice minutes (from 250 to
1,000 per month) and texts (500 to 2,000 per
month).
Meanwhile, KPN’s German operation E-Plus
announced in October a new range of
smartphones to be sold in conjunction with ‘a flat-
fee data package’. Though, at first sight this
would appear to be the very opposite of a tiered
tariff, the plans in fact seem sensibly designed.
Initial caps are as low as 200MB, and beyond this
point customers then have the option of either
accepting a reduced speed or topping up.
It is particularly encouraging to witness a
‘teenage’ operator like E-Plus displaying such a
rational stance with tiered pricing structures.
Firstly – as a teenager – E-Plus has real scope to
damage the overall German market. If it were to
introduce aggressive pricing arrangements – even
if these were of the all-you-can-eat variety - then
the two leading operators (T-Mobile and
Vodafone) might be forced to follow suit. It has
certainly been the case in the past that E-Plus has
adopted aggressive pricing policies in order to
take share, and this has been one of the major
drivers behind the heavy price pressure seen in
Germany over the past half decade. It is also
worth mentioning that O2, the other teenager in
the market, has also been circumspect with its
data tariffs. Its iPhone plan has a monthly data
usage cap of 300MB per month.
Sweden
Sweden is currently one of the most attractive
mobile markets in Europe, with all the major
operators here reporting high single-digit service
revenue growth in Q4 2010. On its results call,
Tele2 management expressed the view that the
market remains only at the bottom of the data
adoption curve. Tele2 was sufficiently confident
about the strength of mobile data demand to be
able to guide for high single-digit service revenue
growth to continue in 2011.
In our view, the key drivers here are rational
pricing in data, together with relatively benign
price competition in voice (and note that MTRs
are already relatively low in Sweden). With the
exception of Telenor, all the major operators have
introduced tiered data pricing. TeliaSonera’s
offering starts with a 2GB block of capacity for
SEK99 (EUR12.7) per month; while its largest
KPN Base Germany: New flat rate data tariffs promotions are actually capped and throttled
Internet Flat S Internet Flat Internet Flat L Internet Flat XL
Offer for… ...people who only occasionally browse the web
…people who access the internet with a smartphone
…smartphone users regularly access the internet
…people who need mobile internet access for their
laptop Data Volume unlimited unlimited unlimited unlimited speed throttled to GPRS (56kbps) at …
50MB 200MB 1GB 5GB
Monthly fee (EUR) 5.00 10.00 15.00 20.00
Source: KPN Base Germany

34
Telecoms, Media & Technology – Equity 16 February 2011
abc
package is a 4G offer of 30GB for SEK599
(EUR77) per month.
Currently TeliaSonera imposes speed restrictions
of 120kbps once a user exhausts their data cap.
Telenor, on the other hand, has continued to sell
unlimited data plans, although it does restrain
consumption by capping the speed it provides
once users exceed their allotted usage. Its
cheapest plan is priced at SEK199 (EUR26) per
month, while its high-end offering weighs in at a
hefty SEK549 (EUR71). The relatively expensive
nature of these plans, in combination with the use
of speed throttling, suggest that the risk to Telenor
Sweden from selling flat-rate plans is, at the
moment, modest. Nonetheless, it was interesting
on the company’s Q4 2010 results conference call
to hear management express the view that
unlimited plans are not sustainable in the long
term.
Telecom Italia
With regards to data pricing, Telecom Italia (TI)
remains an exception among the large European
operators, in that it continues to offer what are
essentially flat-rate plans (albeit with a fair-usage
cap of 2GB per month). This state of affairs is
probably explained by the very specific situation
in which TI finds itself. Following an ill-
conceived price increase introduced in September
2009, the domestic mobile operation has been
underperforming its peers. In addition, its 2010
tariff rebalancing in favour of flat-rate plans (in
voice and data) has caused both revenue
cannibalisation and ARPU dilution. We expect the
mobile business will continue to show significant
weakness in Q4 2010 (results to be reported on 24
February 2011), and most likely also throughout
H1 2011.
However, we do not think that Telecom Italia is in
a different position to its European peers with
respect to the intrinsic scarcity of mobile capacity,
and the pressure that will result from increasing
data usage. So while TI has not yet followed
Vodafone Italy’s move to reduce the cap on its
data tariffs from 2GB to 1GB per month, we
would not be surprised if an announcement in this
direction was made in due course.
SKT and KT (South Korea)
The South Korean mobile market was showing
real promise last year, with KT’s introduction of
tiered data pricing plans. However, in July 2010,
SK Telecom (SKT) announced the introduction of
flat-rate data tariffs for customers spending in
excess of KRW55,000 (cUSD50) per month, as
well as free VoIP minutes over its 3G network –
presumably in a bid to take back market share.
Initially, KT insisted that it would not retreat, but
subsequently, in September, the company
capitulated, indicating that it would match SKT’s
flat-rate offers.
While SKT’s move and KT’s decision to follow
were disappointing, there are some important
mitigating factors to consider. First, note that both
operators’ ‘flat-rate’ offerings come with
constraints: usage is restricted in peak hours, as
well as on a dynamic basis in busy cell sites – thus
limiting the potential for debilitating congestion.
Second, although this is hardly the popular
perception of the market in Korea, smartphone
penetration is currently relatively low, at around
15% of total accounts as at the end of 2010. But,
by the end of 2011, we project this figure could
reach as high as 45%. Hence the operators
probably will be able – in the very short-term – to
absorb the additional volumes that their new tariff
plans will doubtless stimulate. The acid test will
only come as usage grows: will the Korean
operators then be able to retain their present
stance? This pressure is likely to fall
disproportionately on SKT, as it lacks KT’s
extensive WiFi presence (and thus the ability to
offload traffic onto the fixed-line network). As at
September 2010, an impressive 67% of KT’s total

35
Telecoms, Media & Technology – Equity 16 February 2011
abc
mobile data traffic (2,500TB per month) was
being offloaded onto WiFi.
Thirdly, it is important to recognise that the price
points associated with these tariffs represent a
clear step-up as compared to overall ARPU levels.
For example, SKT’s ‘All-in-One’ flat-rate tariffs
begin at KRW55,000, a considerable premium
over its network ARPU of KRW36,000.
Arguably, the situation is analogous to the
Japanese mobile market back in 2003, when
KDDI first introduced its flat-rate data plans, and
initially achieved very strong growth. The risk is
really that the Korean operators – like their
Japanese counterparts – subsequently find
themselves unable to move away from flat-rate
pricing, because of the sheer number of customers
for whom this has become the norm. However,
this does not constitute a near-term risk.
Verizon Wireless (US)
AT&T’s original introduction of tiered data plans
has arguably been the highest profile to date. This
move was necessitated by the immense loads that
the iPhone (which was exclusive to AT&T until
very recently) imposed on the company’s
network. However, the biggest new development
in the US is very clearly that Verizon Wireless has
now finally also been able to launch a version of
the iPhone compatible with its 3G platform.
At least in the initial stages, Verizon Wireless is
not being aggressive as AT&T in charging its
customers for data usage on a tiered basis. The
minimum requirement for its iPhone customers is
that they should take up an ‘unlimited data
package of USD29.99 or higher’. However, in
order to combat the potential for network
congestion, Verizon Wireless has stated that it
may throttle data rates (ie slow the bandwidth) to
those customers falling within the top 5% of
users. For such customers, Verizon Wireless has
further warned that it “may reduce data
throughput speeds periodically for the remainder
of the then current and immediately following
billing cycle”.
Verizon Wireless has further clarified that data
throttling will be applied in those areas where a
user’s data consumption is impacting surrounding
users. This clearly indicates that the company is
very much mindful of capacity and quality of
service issues, and so we suspect that its approach
is ultimately unlikely to be very different from
that of AT&T. We see its initial tariffs as a
tactical move to maximise the appeal of its variant
of the iPhone and poach customers on the AT&T
network who are frustrated with the quality of its
network. In due course, we would anticipate
Verizon Wireless transitioning to tiered plans.
Smaller operators Sprint Nextel and T-Mobile
USA for now are also sticking with unlimited
plans. However, Sprint commented on its Q3
2010 results conference call that it was continuing
to evaluate tiered pricing plans.
Latin America
The situation in Latin America is rather different
from that in the US, given that most operators
here never sold unlimited data packages in the
first place. Admittedly, the Brazilian mobile
networks did initially offer unlimited access to
email and Facebook-type applications, but
distinguished such usage from that of more
bandwith intensive iPhone customers, who faced
‘fair usage’ caps from the outset. But, by 2010,
the operators had switched to some form of
limited tiered price plan in conjunction with most
handset models.
Vivo and Claro, which cater to higher-end
consumers and have a better mix of contract
subscribers (c20%), have largely withdrawn
unlimited data plans altogether. That said, Claro
has been offering an unlimited data plan with the
iPhone, provided the customer pays the full price
(cUSD500) for the 16GB iPhone4. Meanwhile,

36
Telecoms, Media & Technology – Equity 16 February 2011
abc
value player Oi offers tiered pricing, with up to
10GB per month of usage. TIM, which caters to
the large C-class of middle income users (roughly
60% of the population) has taken a different
approach to pricing, by charging on the basis of
time rather than on data volumes. It has also
introduced an unlimited offering for pre-pay
customers, but with speeds that are reduced once a
daily threshold has been reached.
In Mexico, America Movil’s Telcel unit (the clear
market leader) offers a so-called unlimited mobile
data plan, but with speeds that are throttled to a
maximum of 64kbps for the remainder of the
month once a user has reached a 500MB ‘fair use’
threshold. Telcel can afford to be tougher on
pricing than most operators in the Americas given
its dominant market share, and the fact that it is
the only sizeable operator with a 3G service in the
key region of Mexico City.
Capacity crunch We believe that the transformation in data tariff
structure is the most conspicuous ‘smoking gun’
indicating the veracity of our thesis that mobile
data capacity is scarce. The introduction of tiered
pricing is also clearly helpful in providing
evidence that operators should be able to charge
more for the extra capacity that they must supply
if they are to meet demand.
However, there are also indications from other
quarters that mobile data network capacity is
showing signs of being scarce – and even the
admission from certain telecoms companies that
mobile capex is likely to be on the rise, albeit in a
controlled fashion. Given its pan-regional
presence, Vodafone is often regarded as a useful
proxy for the European mobile sector as a whole.
It was therefore particularly interesting to hear
management’s implicit guidance at its H1 2010/11
results that capex was likely to rise somewhat.
The company guided for revenue growth of
between 1% and 4% (as compared to a consensus
of around 1%), as well as for stabilising margins.
However, it did not lift free cash flow guidance on
the basis that it felt it would be advantageous to
invest more in the business. Clearly, additional
subsidies may be required as ever more customers
choose smartphones; but this type of expenditure
is registered above EBITDA. The additional
investment mentioned therefore implies higher
capex. Management remains adamant that the
Vodafone network in Europe does not face
capacity constraints; nonetheless it does now
seem sufficiently confident in the prospects for
data services to implicitly guide to modestly rising
levels of capex.
Again, a crucial point to make here is that
Vodafone has historically out-invested most of its
mobile rivals. In other words, a need (or desire) to
invest more in capex does not indicate (in Europe
at least) that its network is somehow deficient. In
fact, Vodafone cut its capex during the credit
crunch rather less aggressively than most, and so
has been outspending its competitors even
recently. Vodafone’s guidance does not therefore
represent ‘catch-up’ spending. We suspect that if
a consistent, relatively heavy investor like
Vodafone is contemplating rising capex, some of
its rivals may have to up the pace of their
spending by rather more.
We would also point to the track record of AT&T,
which initially guided to a rather modest rise in
capex, but in the end increased its expenditure by
considerably more. While AT&T’s network issues
are somewhat unusual (relating in part to its
somewhat tortuous technology upgrade path), we
would nonetheless argue that there remains scope
for operators to revise upwards their guidance for
capex, as the extent of the opportunity in mobile
data becomes more apparent.

37
Telecoms, Media & Technology – Equity 16 February 2011
abc
There are also more subtle indicators that mobile
data services will be subject to capacity
constraints. An interesting and surprising example
is in the détente reached between two long-term
adversaries, Google and Verizon. The former is,
needless to say, the loudest of activists on the
subject of net neutrality; while the latter has
lobbied hard against such regulatory intrusions.
But, in the aftermath of the Comcast court victory
over the FCC on net neutrality, there have been
efforts by industry participants to broker a
solution that would avoid the FCC taking a more
active role in internet regulation.
One result of this was Google and Verizon
reaching a compromise, in which Verizon agreed
that net neutrality was a viable proposition on its
fixed-line network (which, in Verizon’s FiOS
regions, is all-fibre, and hence has enormous
capacity), but in which Google conceded that net
neutrality should not be applied to the wireless
industry. Implicit in this agreement is the idea that
fixed-line capacity is limitless, but that mobile
capacity is intrinsically limited, and thus does
require rationing.
Further to this, the FCC in December 2010
adopted a modified net neutrality policy along
similar lines: applying strict net neutrality
principles to fixed-line networks but conceding
that due to the inherent scarcity of wireless
capacity, that it was only practical to allow
operators to perform legitimate traffic
management, provided that the reasons for doing
so were transparent.
WiFi provides further evidence
Another interesting recent development has been
the announcement by O2 UK that it is to move
more aggressively into the WiFi hotspot market.
With modest additional investment, the operator is
seeking to deploy its hotspots in areas like retail
outlets and hotels, but will then offer the resulting
connectivity to everyone, not just users of its own
cellular network. Ostensibly, the idea here is to
build the O2 brand and win new customers,
attracted by the operator’s innovation and
generosity. The WiFi coverage should also be
useful in going after the fast-developing mobile
advertising market: for example, customers could
receive an advert for a shop conveyed by a WiFi
hotspot located there. Given WiFi’s very limited
range, the advert would reach only customers who
found themselves in close proximity, and could
therefore pop in to the premises in question.
But we suspect that there is more to the move than
the pursuit of potential new revenue streams. O2
UK has enjoyed good success with its (initial)
iPhone exclusivity, but this has resulted in some
well-publicised strains to its network. Although
remedial capex has been invested in particularly
congested areas like London (O2’s Network
Performance Improvement Plan earmarked an
additional GBP100m in 2010 primarily focused
on adding 3G cell sites in major towns and cities),
it would hardly be a surprise – given the ongoing
explosion in data traffic – if the network was still
feeling under strain.
One way to alleviate this would be to use
‘wireline offload’, in which traffic that would
otherwise hit the (contended) cellular base station
is instead routed via WiFi (or, for that matter, a
femtocell) to the fixed-line network (where
capacity is far greater).
Arguably there is a useful parallel here with
Softbank in Japan – which, just like O2, has had
both iPhone exclusivity and its fair share of
network problems. In an effort to alleviate the
burden being placed upon its cellular network,
Softbank has actually been giving out WiFi units
free – though note it is also engaging in an
ambitious capex upgrade programme at the same
time. In our view, Softbank’s twin-pronged
approach really underlines the severity of the
capacity issues facing the industry: management

38
Telecoms, Media & Technology – Equity 16 February 2011
abc
guidance for 2010 suggested an increase in capex
of over 80%, and yet the company still felt the
need to embark on a parallel and very ambitious
WiFi hotspot strategy.
Naturally, the approach being taken by both O2
UK and Softbank also raises questions about the
respective roles of WiFi and cellular, and whether
there is a risk that the former cannibalises the
latter. There are certainly some vocal bears of the
mobile space who would argue that WiFi amounts
to a powerful competitive challenge to cellular
systems. But, were this really the case, it is
somewhat difficult to explain why there should be
two cellular networks among those that are
leading the WiFi charge. In fact, both operators
would seem to feel that there is more than enough
capacity demand to justify the deployment of both
types of network.
We covered this topic in some detail in our
thematic report The Cell Side last year (April,
2010). A key conclusion was that WiFi
infrastructure is simply not scalable: in other
words, it is fundamentally incapable of providing
any kind of ubiquitous service. As a result, WiFi
will remain a ‘nice-to-have’ rather than a
necessity. Customers valuing ubiquitous service
(which has been a common feature of all
successful mobile services) will continue to need
to take a service from a cellular operator. See
illustration at bottom of page. As such, it is the
mobile operator that owns the intrinsically scarce
element in the value chain, and thus stands the
best chance of being able to charge for it.
Moreover, if mobile data growth comes anywhere
near forecasts suggesting it will double every year
for a decade (implying something like a thousand-
fold increase over the course of a decade), then
networks will need to perform all the wireline
offload of which they are capable (and more tricks
besides) in order to cope.
So, far from signalling that mobile is set to be
displaced, we see moves into WiFi from the likes
of O2 UK and Softbank as providing further
corroboration for our view that cellular capacity is
intrinsically scarce, implying rising capex but also
price-based rationing – or, to put it another way,
pricing power.
Note, though, that O2 UK has not been the only
British company to recently push into the WiFi
space. BSkyB (hitherto primarily a payTV
operator with an extensive presence in the
unbundled ADSL market) has announced its
purchase of The Cloud, a WiFi hotspot startup.
This move implies that BSkyB are concerned
about the mobile operators’ ability to deliver Sky
Player’s streamed video content to its customers.
The deal might also indicate that BSkyB is
concerned about the type of charging structure
that the mobile operators could choose to impose
WiFi: although handover has improved the barrier remains a practical one: patchy coverage
Cellular: hierarchical cell structures support cost-effective ubiquitous service
WiFiNo service WiFiNo service
GPRS/EDGE WCDMA HSPAGPRS/EDGE WCDMA HSPA
Source: HSBC Source: HSBC

39
Telecoms, Media & Technology – Equity 16 February 2011
abc
in order to provide the necessary prioritisation to
ensure adequate quality of service for Sky’s video
streams. However, for the reasons touched on
above, even an acquisition such as this barely
scratches the surface in terms of providing
coverage. BSkyB’s customers will still need to
rely on cellular network transmission if they are to
be able to access their video content in the
majority of locations – although perhaps BSkyB’s
latest acquisition might plausibly improve its
bargaining position.
Note that BSkyB has shown an excellent track
record in terms of being prepared to invest in
order to head off future potential challenges. For
instance, well in advance of BT being able to
bundle IPTV content with its offerings, BSkyB
had entered the broadband market by unbundling
ADSL through its Easynet acquisition. Such a
move need not indicate long-term commitment to
the network market in question – after all, with
the transition to NGA, BSkyB may well return to
wholesaling connectivity from BT, rather than
unbundling the service (although it is participating
in a small fibre trial).
SuperEconomics The commercial appeal of data services remains
subject to widespread scepticism. One part of the
anxiety on this topic relates to the capex that is
required in support. We have argued that levels of
capital intensity are likely to rise, and return to
their (pre-credit crunch) longer-term norms (in
Europe, around 12-13% of sales seems plausible).
Unrestrained, the tremendous growth in demand
for data bandwidth would, in our view, far
outstrip the ability of operators to keep pace (even
allowing for innovations like fixed-line offload
and MIMO (multiple-input multiple-output)
antennas. However, we think that they will be
able to keep the growth to within bounds that they
are capable of satisfying through the use of tiered
plans. But even leaving to one side the question of
capital intensity, there remains the nagging
suspicion in the market that data services are
simply intrinsically unprofitable by comparison
with their voice antecedents. Indeed, it is
frequently said that data is intrinsically dilutive to
returns – perhaps one reason why the prospect of
higher capex in order to deliver it has cast such an
oppressive shadow over the sector.
Judged from first principles, though, there is no
reason to suppose this must intrinsically be the
case. Consider the question through the lens of the
gross margin, for instance. Voice calls often
terminate off-network, necessitating interconnect
payments that remain substantial (despite
regulators’ ongoing efforts). Hence, the gross
margin on voice services must reflect this –
resulting in margins often around the 65% level.
By contrast, with respect to data services,
interconnect is not a factor – hence gross margins
are closer to 100%.
But perhaps the most compelling argument that
mobile data can generate attractive profitability is
of the simple empirical variety. What is needed is
a mobile player that is devoted exclusively to
providing data services. Fortunately, such an
operator does exist, and provides an enticing
insight into the profitability of data, even at a
modest (but not irrelevant) level of market share.
The network in question is eMobile in Japan (the
mobile subsidiary of eAccess): and what should
be truly impressive is that, with market share
standing at a modest 2.4% as at end-2010, we
nonetheless anticipate a full year EBITDA margin
of 27% for the mobile division (for the year to
March 2011).
The eMobile business
eMobile is a wireless broadband operation in
Japan, a country where wireless competition is
intense, while fixed-line broadband services are
the fastest and cheapest in the world (according to
the OECD). Yet, in an environment that looks

40
Telecoms, Media & Technology – Equity 16 February 2011
abc
exceptionally tough (at least on paper), eMobile
has flourished. The company has had a number of
factors in its favour; some are market specific, but
others are more broadly applicable:
Competition specifically for mobile data is
actually limited. Direct wireless broadband
competitors (Willcom, UQ Communications)
are currently ineffective competitors because
of financial and operating difficulties, and –
crucially – the established cellular operators
(NTT DoCoMo, SoftBank, KDDI) are
capacity constrained.
New network equipment. eMobile launched
services in March 2007, benefiting from a
Huawei/Ericsson 3G network of an entirely
different order to that deployed by NTT
DoCoMo in its ground-breaking launch of
non-standard WCDMA back in 2001.
Business model designed for wireless
broadband. eMobile intended from the outset
to focus exclusively on wireless broadband.
Strong demand from younger users. Despite
Japanese wireline broadband being both
cheap and fast, eMobile services have tapped
a need among younger Japanese users (many
of whom live with their parents due to high
rental/housing costs) for a private/personal
broadband service.
eMobile launched services in March 2007, using
equipment from Huawei and Ericsson. From the
outset it has seen solid demand for its wireless
services (which were delivered almost entirely via
datacards for the first three years after launch).
Key milestones have included:
eMobile reached 1.6m subscribers (market
share of 1.5%) and break-even on an
EBITDA basis in the quarter ending June
2009.
In the quarter ending December 2009,
eMobile achieved break-even on an operating
profit basis, and moved to operating free
cashflow break-even in the quarter ending
June 2010.
By end-2010, eMobile had 2.924m wireless
data subscribers, equivalent to market share
of 2.4%. We forecast its EBITDA margin in
the year to March 2011 at 27%.
eMobile CEO Eric Gan has controversially
observed that the job of eMobile was ‘merely’ to
provide access – to be the ‘bit-pipe guys’ (in an
interview in Ericsson magazine, December 2008).
eMobile EBITDA (JPYbn) and EBITDA margin trends
-15
-10
-5
0
5
10
15
Mar-08 Jun-08 Sep-08 Dec-08 Mar-09 Jun-09 Sep-09 Dec-09 Mar-10 Jun-10 Sep-10
0%
5%
10%
15%
20%
25%
30%
EBITDA Margin, %
Source: Company data, HSBC

41
Telecoms, Media & Technology – Equity 16 February 2011
abc
Given mobile operators’ largely ineffectual
attempts to prevent the surrender of value in the
wireless application layer to companies such as
Apple, his focus on building a profitable business
based on data transport now seems prescient.
eMobile’s pricing mechanisms have been both
sensible and consistent, in our view:
Data pricing has been tiered, with recent
declines in ARPU due to the increased take-
up of plans with a lower minimum monthly
fee (but with more expensive overage
charges).
Netbook subsidies are repaid over a two-year
contract. This is as compared to operators in
Taiwan, which have run several heavily
subsidised, value-destructive offers on
netbook and wireless broadband
combinations. eMobile customers are
required to pay an additional amount over the
monthly fee on a 24-month contract that
cumulatively equates to the value of the
netbook.
Unlike operators seeing substantially higher
marketing costs for smartphones (such as in Taiwan
and Korea), eMobile has seen average subscriber
acquisition costs (SACs) fall due to the sharp
declines in the cost of procuring wireless broadband
modems. Previous company guidance had been for
SACs of JPY30,000, to be split equally between
device subsidy, commission and advertising. Recent
price declines should see the subsidy portion decline
substantially – we project SACs falling to
JPY24,000 in the year to March 2013.
Obviously, with respect to SACs, eMobile’s
experience may prove less relevant to more
conventional operators that will be subsidising
smartphones rather than datacards. Nonetheless,
the operation’s profitability (whether considering
its market share or its time since launch) is
impressive given mobile data’s reputation for
dilution.
The power of pricing power The example of eMobile, then, augurs well for the
mobile industry’s profitability as data services
grow in significance. The outlook should be even
better if operators are able to enjoy a degree of
pricing power in this area. Arguably, eMobile
represents an early instance of this phenomenon
as well. It owes part of its success, in terms of its
degree of pricing power, to the capacity
constraints of its chief rivals – for example,
DoCoMo (which has been saddled with a pre-
standardised WCDMA platform that has
hampered its upgrade path) and Softbank (the
network of which is struggling to cope with the
volumes generated as a result of the company’s
iPhone exclusivity).

42
Telecoms, Media & Technology – Equity 16 February 2011
abc
Whatever its precise source, though, there is little
to rival the scale of the impact that the arrival of
pricing power can have on an industry. In order to
drive home this point, it may be useful to consider
a handful of examples. The purpose of this
exercise is not to inspect the mechanisms
conferring pricing power (which are different in
each instance – even within the telecoms sector,
between fixed-line and mobile) so much as to
examine the extent of its impact – most
particularly in terms of valuation.
Perhaps the best known example of the sudden
appearance of pricing power originates from the
oil sector. Lately, OPEC’s ability to control the oil
price has been somewhat diminished as a result of
the development of new reserves in Russia,
Alaska and the Gulf of Mexico. But its members
still own around 79% of the planet’s crude oil
reserves and account for 44% of current
production. It might be supposed that higher oil
prices would translate into greater profitability for
the western oil companies, and thus also, more
generous valuations. However, there are a number
of other factors in the mix – for instance, the
heavy taxation that oil tends to attract. Recently,
strong demand from emerging markets like China
and political tensions in the Middle East have
contributed to a significant appreciation in the
price of both oil itself and the stocks of the
companies that extract it.
There have been two periods of pronounced
scarcity in the oil sector. The first period, 1973 to
1980, was triggered by the actions of OPEC.
Firstly, it decided to raise the price of oil by 70%,
to USD5.11 per barrel. Secondly, it announced its
intention to cut production in 5% instalments over
time until OPEC’s members’ economic and
political objectives were met.
Oil demand is relatively inflexible in the short
term (ie inelastic), and so demand does not tend to
fall dramatically in response to a price increase.
Therefore, the price increase had to be still more
dramatic if it was to curb demand to a level that
the new, lower levels of supply could satisfy. In
anticipation of this, the market price for oil in fact
quadrupled, moving from USD3 per barrel to
USD12 in the space of less than a year.
However, the read-across into oil company
valuations was not straightforward. Of course,
these corporations did not derive as much benefit
from the price rise as those countries actually
owning the oil reserves. Moreover, the sudden
nature of the oil price increase led to a recession,
which impacted demand in the medium term. So,
for example, the share price of Exxon Mobile
OPEC had a dramatic impact on the oil price in the 1970s Oil sector valuations move in tandem with the oil price
0
20
40
60
80
100
120
1965 1969 1973 1977 1981 1985 1989 1993 1997 2001 2005 2009
Crude O il (USD/bbl) (at nominal prices)
0
20
40
60
80
100
120
140
160
1995 1997 1999 2 001 2003 2005 2007 2009 2011
100
200
300400
500
600
700
800
900
1000
Bren t crud e (USD/bbl) (LHS)
FTSE Europe O&G Prod Index (RHS)
Source: BP Source: Thomson Reuters Datastream

43
Telecoms, Media & Technology – Equity 16 February 2011
abc
actually decreased from USD2.95 at the start of
1973 to USD2 at the end of 1974. Looking
slightly further out, though, Exxon Mobile’s
shares almost doubled to reach USD5 in 1980 (by
which time the oil price had reached a peak of
USD40 per barrel).
The second period of oil scarcity has been more
recent, driven in large part by the fact that demand
from emerging markets has increased sharply
during a period when production has stagnated.
Political tensions and conflict in the Gulf region
have further exacerbated the situation. From 2003
to its peak in July 2008, the oil price increased by
a factor of 4.7x, from USD25 to USD143 per
barrel. But on this occasion, because the
appreciation was determined more by basic
economics (ie the demand/supply equation) rather
than exogenous political factors, companies in the
oil and gas sector have directly benefited. The
industry’s valuation (as measured by the FTSE
Europe Oil and Gas production index) rose by
1.6x over this timescale.
So, at least in this latter period, the arrival of
pricing power in the oil industry had a significant
impact on its valuation. We would also argue that
a similar phenomenon has been seen in the steel
sector.
The steel industry has a relatively finite
production capacity (at least over shorter time
durations) and, in addition, has been undergoing a
Steel industry valuations vs steel price increases Steel price relative to world Iron & Steel EV/EBITDA
200
400
600
800
1000
1200
2002 2003 2004 2 005 2006 2007 2008 2009 2010 2011
0
500
1000
1500
2000
2500
3000
Ste el HRC price global av g (USD/tonne) (LHS)Datastream World Iron & Steel index (RHS)
200
300
400
500
600
700
800
900
1000
1100
1200
2002 2003 2004 2005 2006 2007 2008 2009 2010 2011
0
2
4
6
8
10
12
14
Steel HRC price global av g (USD/tonne) (LHS) World Iron & Steel EV/EBITDA
Source: HSBC, Thomson Reuters Datastream Source: HSBC, Thomson Reuters Datastream
Steel prices driven by consolidation and increased demand Sharp rise in steel demand powered by emerging markets
200
300
400
500
600
700
800
900
1000
1100
1200
1980 1984 1988 1992 1996 2000 2004 2008
Steel HRC price global av g (USD/tonne)
600
700
800
900
1000
1100
1200
1300
1400
1980 1984 1988 1992 1996 2000 2004 2008
World apparent crude steel consumption (mt)
Source: Bloomberg Source: World Steel

44
Telecoms, Media & Technology – Equity 16 February 2011
abc
process of consolidation (eg Arcelor/Mittal).
Meanwhile, in recent years, demand from
emerging markets has exploded. The impact on
the steel price of this combination of relatively
tight supply vs exponential growth has been very
marked. Once world apparent crude steel
consumption rose above the 900mt per annum
mark in 2002, the industry became capacity
constrained, and the price began to shoot upwards.
By 2008, apparent crude steel consumption had
reached around 1,300mt, an increase of 45% from
its 2002 level. Over this period, the steel HRC
average global price rose 3.8x, from USD223 per
tonne to a peak of USD1,079 per tonne. This
translated into a massive appreciation in the value
of the industry: the world Iron and Steel index
rose about seven-fold, from 316 in Jan 2002 to
2,202 in August 2008.
Exponential demand, linear supply Our December 2009 report, The Capacity Crunch,
set out our belief that the mobile industry faces a
major imbalance in the demand and supply of
network capacity. Mobile traffic (demand) has
doubled each year for the past couple of years and
is set to continue growing at an exponential rate
for the foreseeable future, perhaps even for the
next ten years. Cisco, for example, forecasts that
mobile network traffic will grow at a 100%
compound rate to 2014. Note also that the firm’s
current forecast (published in February 2011)
increases projected volumes from the year-earlier
analysis, as shown in the chart below.
Cisco has increased its global mobile traffic (Terabytes per month) forecast over the past year
0
500
1,000
1,500
2,000
2,500
3,000
3,500
4,000
2010 2011 2012 2013 2014
Feb-10 Feb-11
100% CAGR
Source: Cisco Visual Networking Index
Exponential mobile traffic growth is the product
of three compounding factors:
Rising penetration of smart devices such as
smartphones, tablets and connected laptops.
These devices feature full web browsing and
rich media capabilities that in turn spur
massive increases in individual bandwidth
consumption: as customers migrate from
simple voice/text usage to mobile broadband,
use of network resource increases typically
twenty-fold or more. See illustration.
Smart devices consume orders-of-magnitude more bandwidth than basic voice/text mobile phones
=
=
=
X 24*
X 122*
X 515*
=
=
=
X 24*
X 122*
X 515*
Cisco, HSBC. Note: multiples based on Cisco’s VNI Mobile 2011

45
Telecoms, Media & Technology – Equity 16 February 2011
abc
As the utility of connected smart devices increases and as the range of mobile applications grows, more and more activities can be executed over the mobile web; hence there will be a propensity for people to use these devices more frequently and for longer periods over time
Consumption will also increase indirectly, as mobile applications become ever more sophisticated and web media ever richer. For example, most web video today is quarter video graphics array (QVGA) format offering approximately half the resolution of a standard-definition (SD) television picture. As mobile video cameras become more ubiquitous and as the quality of video capture on these devices increases, the bandwidth required to upload and download this content wirelessly rises significantly too. A standard definition video file is roughly twice the size of a QVGA format file, while a high definition (HD) file is roughly twice the size again. Bandwidth consumption could thus quadruple – purely due to higher quality video formats – without the user watching another minute of content
Admittedly, though, this is not the first time that the mobile industry has faced skyrocketing demand for capacity – indeed, it has periodically faced capacity crunches a number of times before. This is intuitive when one considers how the mobile market has grown from a handful of developed-market business users in the late 1980s to five billion accounts globally (including 500m mobile broadband users) in a period of a little over twenty years.
It has been possible to add sufficient capacity to support this explosive growth in large measure because of the improved efficiency of mobile network technology. It is this innovation that has massively leveraged the comparatively modest increases in spectrum allocated to mobile services over the period, and thus permitted the mobile market to grow to its current size and scope. Successive generations of infrastructure have enabled operators to squeeze 10-20 times more capacity from a given slice of mobile spectrum than did their predecessors. For example:
2G microcellular architectures and antenna sectorisation enabled much more intensive frequency re-use than was possible in first-generation (1G) analog networks. Replacing,
Global mobile data traffic 2010–2015 (TB per month)
0
1,000,000
2,000,000
3,000,000
4,000,000
5,000,000
6,000,000
7,000,000
2010 2011 2012 2013 2014 2015Nonsmartphones Smartphones Laptops and Netbooks TabletsHome Gateways M2M Other portable devices
Source: Cisco
46
Telecoms, Media & Technology – Equity 16 February 2011
abc
say, a four-mile radius analog macrocell with
four one-mile radius microcells increases
channel capacity four-fold, while splitting
each cell into three 120° sectors (known as
tri-sectorisation) increases it a further three-
fold – in this example a total capacity gain of
1,200%, purely as a result of these 2G
innovations
3G code division multiplexing (CDMA)
enabled universal frequency re-use. 2G
systems used frequency division multiplexing
(FDMA), whereby adjacent cells are required
to use discrete frequencies. This had the
implication that operators were only able to
use a fraction (at best, one-seventh) of their
total spectrum in each 2G cell. By contrast 3G
CDMA ensures separation between
communications by means of a unique code
(pseudorandom noise or PN code). This
enables every cell to make use of all the
frequencies allocated to a given operator.
Increasing utilisation of spectrum from one-
seventh to seven-sevenths represents a 600%
uplift in capacity. In parallel, improved 3G
modulation techniques like QPSK (2 bits per
symbol) and 16QAM (4 bits per symbol)
enable more data to be inserted into each
carrier wave cycle than the GMSK (1 bit per
symbol) modulation used by 2G GPRS data
services – thus doubling or quadrupling data
capacity. Bringing all these techniques
together, it can be seen that the aggregate
capacity gain achieved by moving from 2G to
3G is well over 1,000% on a like-for-like
basis
Innovations such as these have massively
improved mobile network efficiency. In turn, this
has delivered huge increases in capacity over the
past two decades – enough to support the
compounding demands of mass market adoption
of mobile services and the migration from basic
voice and text offerings to mobile broadband.
Habituated to this trend of ever-increasing
efficiency, it is not surprising that – in the face of
the current wall of demand created by mass
market adoption of mobile broadband – there is a
widely-held assumption that the latest generation
of network technology, 4G/LTE, will perform the
same tricks and thereby save the industry from yet
another impending capacity crunch. However, we
are firmly of the opinion that things will not be so
simple this time.
Hitting the Shannon Limit
The problem is that the efficiency of mobile
networks is starting to peak. The practical
implication of this is that we believe new 4G/LTE
technology is barely any more efficient than
today’s 3G platforms – perhaps as little as 30%
more efficient on a strict like-for-like basis. This
gain is trivial by comparison to previous
generational upgrades that have comfortably
yielded 1,000-2,000% like-for-like efficiency
benefits.
The sharply flattening efficiency curve is due to
the technology approaching what is known as the
Shannon Limit. This is a law of radio physics that
governs the maximum amount of error-free data
that can be transmitted over-the-air for a given
level of noise (or interference). Noise is an
unavoidable feature of the mobile environment,
with interference created by buildings and other
obstructions, signals from other users, and simply
due to attenuation of the signal as radio waves
travel through the air. The higher the level of
noise, the more the network has to compensate –
by reverting to less data-intensive but more robust
modulation techniques as well as dedicating a
greater portion of the channel resources to error
correction (and thus leaving less for the end-user’s
data). From a customer’s perspective, the higher
the noise level, the lower the data rate that they

47
Telecoms, Media & Technology – Equity 16 February 2011
abc
will receive. For a typically noisy outdoor urban
cell, the Shannon Limit is around
2bits/second/Hz. Standard 3G (WCDMA)
technology has an optimal performance of around
1bit/Hz, while HSPA-enabled 3G and 4G LTE
can increase this to between 1-2bits/Hz. See the
grey shaded area in the accompanying illustration.
In lower noise environments (for example, where
the user is both close and has line-of-sight to the
base station, or if the cell is relatively uncrowded,
or if it is indoors) then a speed of greater than
2bits/Hz may be achieved. In this type of
scenario, the lowering of the noise allows the user
to move further up the Shannon curve (up-and-to-
the-right in the accompanying illustration).
Some reduction in outdoor cell noise may be
achieved in the future through implementation of
‘smart’ beam-forming antennae that can reduce
co-channel interference (residual noise from other
users). These smart antennas are able to pinpoint a
specific mobile device with a narrow beam; this is
in contrast to the vast majority of antennas today
that blast signals out to a large portion of the
sector in an attempt to find the specific user.
However, note that smart antennas will only
improve one aspect of cell noise (co-channel
interference), and hence significant improvements
in bits/second/Hz as a result of implementing
beam-forming antennas seem unlikely.
The building blocks of efficiency
The spectral efficiency of a radio technology is
largely the product of three different areas:
Multiplexing – whereby radio spectrum is
divided up in order to support multiple
simultaneous connections
Modulation – the process of inserting
information into a radio carrier wave
Coding – or more properly, forward error
correction coding (FEC). This is the process
of transmitting redundant information in the
knowledge that some original data will be lost
or corrupted along the way
Comparing 3G and 4G across these three
fundamental building blocks of spectral
Shannon Limit sets a ceiling on mobile spectral efficiency
1
2
3
4
5
6
0
-15 -10 -5 0 5 10 15 20
Typical loaded mobile network (outdoors)
Inaccessible
Region
Lower interference environments e.g. isolated hotspots, femtocells
Shannon limit
Shannon limit with 3dB offset
OFDMA
CDMA (HSPA)
Required SNR (dB)
Achi
evab
le ra
te (b
ps/H
z)
1
2
3
4
5
6
0
-15 -10 -5 0 5 10 15 20
Typical loaded mobile network (outdoors)
Inaccessible
Region
Lower interference environments e.g. isolated hotspots, femtocells
Shannon limit
Shannon limit with 3dB offset
OFDMA
CDMA (HSPA)
Required SNR (dB)
Achi
evab
le ra
te (b
ps/H
z)
Source: Alcatel Lucent, HSBC

48
Telecoms, Media & Technology – Equity 16 February 2011
abc
efficiency, the first observation to highlight is
simply the degree of similarity seen between the
two platforms:
Modulation options for each are identical
(standard 16QAM with the option to use more
data-intensive 64QAM if conditions permit).
Indeed, underlining the relevance of the
Shannon Limit is the fact that 64QAM (6 bits
per symbol) will likely only function in
around 5-10% of the cell area, where radio
conditions are at their most benign
Similarly, forward error-correction techniques
for 3G and 4G are near-identical, each based
on turbo coding (albeit with 4G/LTE
featuring a minor ‘tail biting’ improvement)
The fundamental similarities between 3G and 4G
in terms of modulation and coding mean that – by
a simple process of elimination – any
improvement in spectral efficiency that exists
between the two generations must be principally
derived from differences in multiplexing.
3G WCDMA employs code division multiplexing
(systemised as CDMA) while 4G LTE uses
orthogonal frequency division multiplexing
(systemised as OFDMA). Both techniques
achieve universal frequency re-use, meaning that
all frequencies may be utilised in all cells. The
only major difference between the two is that
while CDMA is a single-carrier transmission
technology, LTE uses multi-carrier transmission
on the downlink (though note that LTE also uses
single-carrier on the uplink).
By splitting the signal into multiple sub-carriers,
4G/LTE is able to assign groups of sub-carriers to
users based on their bandwidth needs: if the user
requires a higher data rate, then a larger group of
sub-carriers is assigned; if the user requires a
lower data rate, then fewer sub-carriers are
allocated.
This more granular approach of 4G/LTE versus
3G enables the better matching of mobile network
resources to demand – with the flexibility of the
multi-carrier structure able to fill bandwidth
requests more precisely. However, this advantage
is generally only available with certain traffic
patterns when the network is relatively unloaded.
As more users fill the cell, though, radio resource
allocations will, ceteris paribus, be governed by a
policy that supports users more equitably – even if
3G HSPA (WCDMA) assigns resources in relatively large blocks (different colours signify different users)
4G LTE (OFDMA) is more granular enabling better matching of radio resources to demand (different colours signify different users)
Time
T2 T3 T4 T5
Codes
T1
Time
T2 T3 T4 T5
Codes
T1
Tim
e
Sub-carriers
T2
T1
T3
T4
T5
= 23 sub-carriers
1 1589
Tim
e
Sub-carriers
T2
T1
T3
T4
T5
= 23 sub-carriers
1 1589
Tim
e
Sub-carriers
T2
T1
T3
T4
T5
= 23 sub-carriers
1 1589
Source: HSBC Source: HSBC

49
Telecoms, Media & Technology – Equity 16 February 2011
abc
this means that some customers experience
download speeds that fall short of the peak
capabilities of their device (or that are inadequate
to the application or service that they are trying to
access). Hence, as cells become more crowded,
the greater flexibility of OFDMA is negated,
diminishing its relative efficiency gain versus 3G.
MIMO theory undermined in practice
This is not to suggest that all innovation will grind
to a halt – and capacity/efficiency gains with it.
However, in our view, it does seem likely that
future gains will tend to be rather more marginal
than those achieved in the past.
Among the most promising new technological
developments is the use of MIMO (multiple input
multiple output) antenna arrays, which are
supported by both 3G/HSPA+ and 4G/LTE. Most
antennas today are single input single output
(SISO), and incorporate just a single antenna on
the device that communicates with a
corresponding antenna at the base station. By
contrast, MIMO systems use multiple sets of
antennas on both the device and at the base
station. There are two (mutually exclusive)
benefits to this:
By transmitting duplicate information, MIMO
can improve the reliability of connections in a
process known as ‘transmit diversity’. This is
typically of greatest benefit to users at the
edge of the cell, as it is they who experience
the highest levels of interference
Alternatively, the MIMO antennas can
transmit different information from one
another, with specialised algorithms at the
receiver able to constructively combine
signals from the different paths taken by these
signals into one, integrated information
stream. This creates an additional, ‘spatial’
multiplexing efficiency gain
MIMO can improve link reliability or increase spectral efficiency via a spatial multiplexing gain
Tra
nsm
itter
Rec
eive
r
n n
2 2
1 1
Tra
nsm
itter
Rec
eive
r
n n
2 2
1 1
Tra
nsm
itter
Rec
eive
r
n n
2 2
1 1
Source: HSBC
In theory, moving from today’s single input single
output (SISO) antennas to 2 x 2 or 3 x 3 MIMO
arrays should double or treble the efficiency (and
thus the data capacity) of the system. However,
achieving these gains in the real world is more
difficult, if for no other reason than the
complexity of differentiating between the separate
transmission streams.
MIMO’s spatial multiplexing techniques rely on
differences in the timing or incidence (angle of
arrival) of the received signals. When antennas
are spaced too closely together, there is
insufficient difference between the signals for the
system to work – a problem known as ‘spatial
correlation’. In order to mitigate spatial
correlation issues, MIMO antennas need to be
spaced multiple wavelengths apart on the device.
This creates major issues for smaller devices such
as smartphones, which may not have the
dimensions to accommodate anything more than
the most basic 2 x 2 arrays, where the relative
gains versus SISO are smaller.
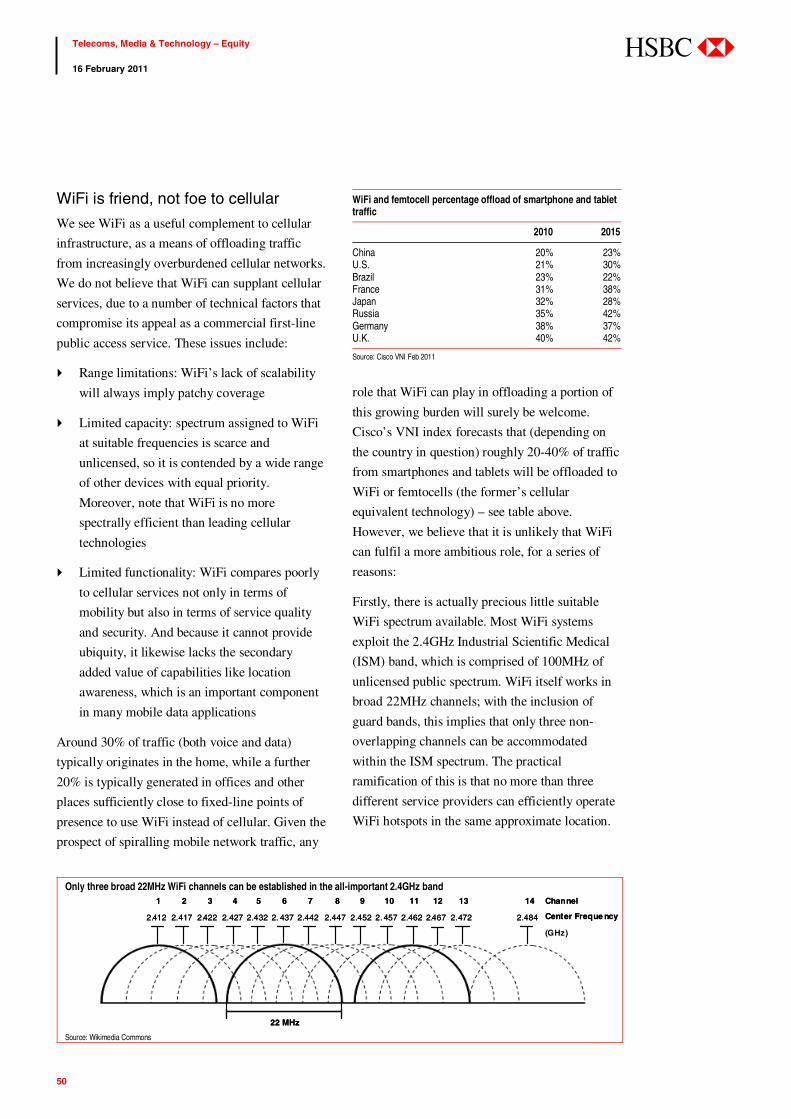
50
Telecoms, Media & Technology – Equity 16 February 2011
abc
WiFi is friend, not foe to cellular
We see WiFi as a useful complement to cellular
infrastructure, as a means of offloading traffic
from increasingly overburdened cellular networks.
We do not believe that WiFi can supplant cellular
services, due to a number of technical factors that
compromise its appeal as a commercial first-line
public access service. These issues include:
Range limitations: WiFi’s lack of scalability
will always imply patchy coverage
Limited capacity: spectrum assigned to WiFi
at suitable frequencies is scarce and
unlicensed, so it is contended by a wide range
of other devices with equal priority.
Moreover, note that WiFi is no more
spectrally efficient than leading cellular
technologies
Limited functionality: WiFi compares poorly
to cellular services not only in terms of
mobility but also in terms of service quality
and security. And because it cannot provide
ubiquity, it likewise lacks the secondary
added value of capabilities like location
awareness, which is an important component
in many mobile data applications
Around 30% of traffic (both voice and data)
typically originates in the home, while a further
20% is typically generated in offices and other
places sufficiently close to fixed-line points of
presence to use WiFi instead of cellular. Given the
prospect of spiralling mobile network traffic, any
role that WiFi can play in offloading a portion of
this growing burden will surely be welcome.
Cisco’s VNI index forecasts that (depending on
the country in question) roughly 20-40% of traffic
from smartphones and tablets will be offloaded to
WiFi or femtocells (the former’s cellular
equivalent technology) – see table above.
However, we believe that it is unlikely that WiFi
can fulfil a more ambitious role, for a series of
reasons:
Firstly, there is actually precious little suitable
WiFi spectrum available. Most WiFi systems
exploit the 2.4GHz Industrial Scientific Medical
(ISM) band, which is comprised of 100MHz of
unlicensed public spectrum. WiFi itself works in
broad 22MHz channels; with the inclusion of
guard bands, this implies that only three non-
overlapping channels can be accommodated
within the ISM spectrum. The practical
ramification of this is that no more than three
different service providers can efficiently operate
WiFi hotspots in the same approximate location.
Only three broad 22MHz WiFi channels can be established in the all-important 2.4GHz band
1
2.412
2
2.417
3
2.422
4
2.427
5
2.432
6
2. 437
7
2.442
8
2.447
9
2.452
10
2. 457
11
2.462
12
2.467
13
2.472
14
2.484
22 MHz
Channel
Center Freque ncy
(GHz)
1
2.412
2
2.417
3
2.422
4
2.427
5
2.432
6
2. 437
7
2.442
8
2.447
9
2.452
10
2. 457
11
2.462
12
2.467
13
2.472
14
2.484
22 MHz
Channel
Center Freque ncy
(GHz)
Source: Wikimedia Commons
WiFi and femtocell percentage offload of smartphone and tablet traffic
2010 2015
China 20% 23% U.S. 21% 30% Brazil 23% 22% France 31% 38% Japan 32% 28% Russia 35% 42% Germany 38% 37% U.K. 40% 42%
Source: Cisco VNI Feb 2011
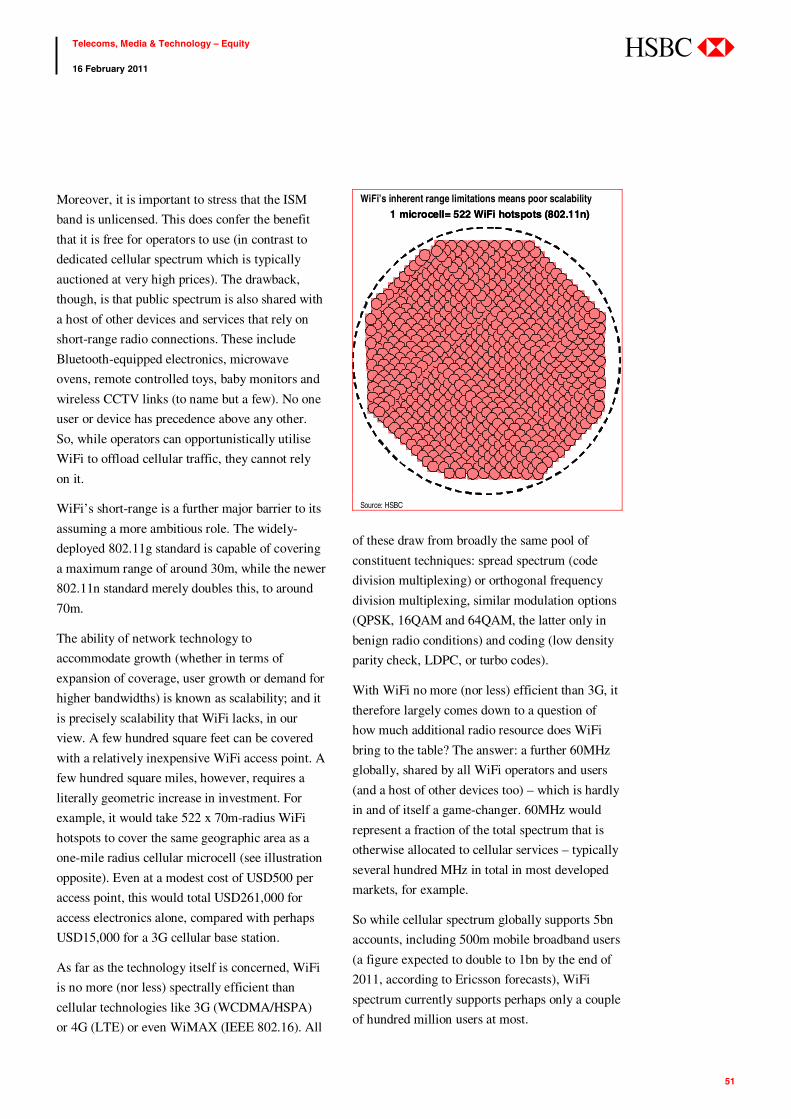
51
Telecoms, Media & Technology – Equity 16 February 2011
abc
Moreover, it is important to stress that the ISM
band is unlicensed. This does confer the benefit
that it is free for operators to use (in contrast to
dedicated cellular spectrum which is typically
auctioned at very high prices). The drawback,
though, is that public spectrum is also shared with
a host of other devices and services that rely on
short-range radio connections. These include
Bluetooth-equipped electronics, microwave
ovens, remote controlled toys, baby monitors and
wireless CCTV links (to name but a few). No one
user or device has precedence above any other.
So, while operators can opportunistically utilise
WiFi to offload cellular traffic, they cannot rely
on it.
WiFi’s short-range is a further major barrier to its
assuming a more ambitious role. The widely-
deployed 802.11g standard is capable of covering
a maximum range of around 30m, while the newer
802.11n standard merely doubles this, to around
70m.
The ability of network technology to
accommodate growth (whether in terms of
expansion of coverage, user growth or demand for
higher bandwidths) is known as scalability; and it
is precisely scalability that WiFi lacks, in our
view. A few hundred square feet can be covered
with a relatively inexpensive WiFi access point. A
few hundred square miles, however, requires a
literally geometric increase in investment. For
example, it would take 522 x 70m-radius WiFi
hotspots to cover the same geographic area as a
one-mile radius cellular microcell (see illustration
opposite). Even at a modest cost of USD500 per
access point, this would total USD261,000 for
access electronics alone, compared with perhaps
USD15,000 for a 3G cellular base station.
As far as the technology itself is concerned, WiFi
is no more (nor less) spectrally efficient than
cellular technologies like 3G (WCDMA/HSPA)
or 4G (LTE) or even WiMAX (IEEE 802.16). All
of these draw from broadly the same pool of
constituent techniques: spread spectrum (code
division multiplexing) or orthogonal frequency
division multiplexing, similar modulation options
(QPSK, 16QAM and 64QAM, the latter only in
benign radio conditions) and coding (low density
parity check, LDPC, or turbo codes).
With WiFi no more (nor less) efficient than 3G, it
therefore largely comes down to a question of
how much additional radio resource does WiFi
bring to the table? The answer: a further 60MHz
globally, shared by all WiFi operators and users
(and a host of other devices too) – which is hardly
in and of itself a game-changer. 60MHz would
represent a fraction of the total spectrum that is
otherwise allocated to cellular services – typically
several hundred MHz in total in most developed
markets, for example.
So while cellular spectrum globally supports 5bn
accounts, including 500m mobile broadband users
(a figure expected to double to 1bn by the end of
2011, according to Ericsson forecasts), WiFi
spectrum currently supports perhaps only a couple
of hundred million users at most.
WiFi’s inherent range limitations means poor scalability 1 microcell= 522 WiFi hotspots (802.11n)1 microcell= 522 WiFi hotspots (802.11n)
Source: HSBC

52
Telecoms, Media & Technology – Equity 16 February 2011
abc
So when considering the question of WiFi as a
potential substitute for cellular, it is useful to think
from first principles. Does WiFi bring
significantly more spectrum to the table? No –
only around a further 60MHz (net of overhead).
Does WiFi squeeze any more out of this spectrum
than cellular technologies? No – WiFi uses
broadly the same techniques as cellular; it is
generally no more (nor less) spectrally efficient.
So is it likely that WiFi could handle the
wholesale migration of the world’s cellular users
(even just cellular broadband users) onto a thin
sliver of unlicensed public spectrum? Clearly not,
in our view.
Importance of capex re-emerges
So, to re-cap: mobile traffic is set to continue
doubling each year for the next several years,
driven by rapid smart device adoption, growing
usage patterns and indirect increases in
consumption as applications become more
sophisticated. At the same time, however, the
industry’s ability to supply significant amounts of
additional capacity is starting to be constrained by
the hard laws of radio physics (specifically the
Shannon Limit). This is what underlies the fact
that 4G technology is barely any more efficient
(perhaps only by 30% or so) than today’s 3G
networks, on a strict like-for-like basis.
Some small efficiency improvements may be
possible going forward, thanks to innovations like
MIMO and smart, beam-forming antennas.
However, we expect these gains to be relatively
modest – and particularly so when set against
historic gains from previous generational
upgrades (ie 2G succeeding 1G, and 3G
succeeding 2G – each of which transitions
delivered orders-of-magnitude improvements in
capacity).
With the idea of any quick fix from innovative
technology breakthroughs likely off the table, we
believe the industry will have to take a ‘back-to-
basics’ approach to adding more mobile capacity.
This will involve offloading traffic to WiFi and
femtocells wherever possible, but it will also
mean increasing substantially the density of
cellular networks, through techniques like cell
splitting. This latter term refers to the shrinkage of
cell sizes, in order to reduce demand on each base
station’s radio resources. While it is a relatively
expensive, time-consuming and complex process,
it does have the advantage of being a tried-and-
tested method of adding substantial capacity.
We believe that WiFi can play an important
supporting role in offloading traffic from
overburdened cell towers – Cisco for example
forecasts that between 20-40% of total
smartphone and tablet traffic can be diverted to
fixed line via WiFi and femtocells. However, we
are highly sceptical that it can play any more than
a supporting role to cellular, due to its manifest
constraints (its use of public spectrum that is itself
in limited supply; the fact that, with only three
channels available, co-location becomes a major
challenge; the shared nature of its radio
frequencies; and its intrinsically short range).
It is therefore our view that, facing the threat of a
capacity crunch and without the prospect of new
technologies to save the day, operators will need
to deploy more cellular infrastructure. This will
necessitate an increase in capex, and hence our
conviction Overweight call on mobile equipment
market leader, Ericsson.
However, in our opinion, investment in cellular
infrastructure is about considerably more than
merely avoiding an imminent network collapse.
We believe that capex is likely to emerge as a
powerful source of competitive advantage – in a
way that has not, frankly, been the case in the 2G
voice-centric world. The reason for this lies in the
difference between circuit-switched voice and
adaptive IP data services.

53
Telecoms, Media & Technology – Equity 16 February 2011
abc
2G voice is a circuit-switched service. Circuit
switching creates a dedicated channel which runs
at a constant bit rate (9.6-14.4kbps depending on
the voice codec), which in turn means that – as
long as the user is within range of the base station
– they will receive a broadly uniform quality of
service. (Poor call quality is typically the result of
being out of range, while call dropping is typically
due to either moving out of range, or the cell
being over-crowded). The key point to note here,
though, is that voice users close to the base station
experience broadly the same level of service as
those who are much farther away (but still within
range). But, while this is the case with 2G voice, it
is emphatically not true of a 3G or 4G data-centric
world.
3G and 4G are adaptive systems. Adaptive
networks change their method of operation based
on prevailing radio conditions. In this sense, 3G
and 4G base stations might be thought of as tool
boxes, offering an array of tools ranging from
sophisticated precision engineering devices at one
end to basic hammers and chisels at the other. The
choice of tool depends on the conduciveness of
the radio environment. When radio conditions are
benign, with low levels of noise (such as when a
user is close to the base station and has line-of-
sight), the network can utilise the most
sophisticated techniques to cram more data into
the radio waves (and simultaneously allocate less
of the radio resource to error-correction). But if
the user is far from the base station and is subject
to high levels of interference (for example, from
intervening buildings and other users in the cell),
then the base station must revert to the most basic
(but robust) of tools. These are less adept at
cramming 1s and 0s into the radio wave, and must
also incur a greater overhead in terms of error
connection.
So while distance matters little in providing a
voice service, it matters greatly in the world of
mobile data. The closer a user is to a base station,
the faster the data speeds that they will receive;
and vice versa. This fact should benefit the larger
networks. Because they will have more base
stations than their rivals, their users will on
average be closer to a base station, and – being
such – should enjoy superior bandwidth. Note that
two operators might have the same capex/sales
ratio, and even the same ratio of customers to base
stations – but if one operator is twice the size of
the other, with twice the number of base stations,
then despite the parity in capital intensity, the fact
that the average distance of its customers to a base
station is shorter implies it should be able to
provide a materially superior data service. Of
course, a final point to make is that, thanks to
their scale, the larger operators should in any case
be able to purchase infrastructure at a per unit
discount to their smaller rivals – which should
compound the scale-friendly nature of the effect
described above.

54
Telecoms, Media & Technology – Equity 16 February 2011
abc
Introduction In one sense the most popular service running
over fixed-line connectivity remains voice.
However, thanks to years of aggressive price
competition (often stimulated by regulatory
intervention) and the arrival of VoIP, voice
revenues represent an ever-diminishing portion of
the total. Operators everywhere have taken
strenuous efforts to rebalance into contracted
revenues, in particular line rental and broadband.
Given this context, what are the fixed-line
applications of the future? One especially stands
out: IPTV – the provision of a payTV service over
a broadband line.
However, this is also an area that arouses
profound suspicions. Investors are (quite rightly,
in our opinion) acutely nervous about the prospect
of any telecoms operator moving out of its natural
comfort zone and into the unknown territory that
is the media sector. Can telecoms operators make
any kind of success of this field? The answer, in
our opinion, simply depends on what they are
trying to achieve. We would argue that most
operators would be best served seeing IPTV in
modest terms: as a way of improving customer
loyalty, as well as a means of stimulating the
market for underlying connectivity by
demonstrating the power of video delivered over a
superfast broadband infrastructure. In developed
markets, it seems unlikely that telecoms operators
will have the right competencies to match existing
media players – or the technology/internet
companies that are also eyeing this territory
(although arguably there is still everything to play
for in some of the emerging markets).
The problem for the telecoms operators is that
they are not merely going into battle against
powerful existing media brands. Indeed, both
traditional telecoms and media companies face a
potential barrage of new entrants in the form of
so-called over-the-top (OTT) competitors piping
payTV over broadband connections. Previously,
entry into the payTV market has been difficult,
due to the very limited number of conduits
available to take payTV content into the home (eg
digital satellite or digital terrestrial broadcast
platforms). But the arrival of superfast broadband
infrastructure means that suddenly any entrant has
access to a conduit able to convey programming
to viewers. As a result, a host of new rivals will
appear – very likely led by some of the biggest
and most innovative companies in the world: the
likes of Apple, Google and Amazon.
Telecoms IPTV: a brave effort Previously, if a customer wanted to receive a
video service, they generally had a choice
between a cable provider and/or a set of
satellite/terrestrial broadcasters. As we argued in
our DisContent thematic report (September,
Fixed-line applications
Operator IPTV has mixed track record; often a response to cable
OTT eliminates barriers to entry, ushering in a new wave of rivals
Set-top boxes fast becoming a ‘Trojan horse’ for OTT services

55
Telecoms, Media & Technology – Equity 16 February 2011
abc
2009), the defining feature of this system is that
the number of conduits into the home (ie
broadcast channels, whether over satellite, cable,
or terrestrial multiplex) is very limited. This has
understandably made those conduits (such as
digital terrestrial broadcast spectrum) very
expensive.
An ‘entrant’ with video content wanting to break
into the market and distribute its programming
therefore faces a real challenge in this
environment. But, with the arrival of broadband
(and particularly superfast broadband), suddenly
any player with content has access to a
distribution mechanism. Broadband is, in essence,
a conduit available to anyone with content – and,
with the removal of such a massive barrier to
entry, it is hardly surprising that there should be
such a large number of players looking to take
advantage of the new opportunities on offer. One
of the challenges for the telecoms operators is that
many of the potential entrants are high-profile and
popular brands from the worlds of the internet,
technology and retail, as well as well-established
media entities.
However, the first entrants into the payTV space
using broadband telecoms pipes have typically
been the incumbent themselves. Most have now
launched a payTV service to augment their more
conventional voice and broadband service
proposition. Incumbent video offerings typically
make use of IPTV – an acronym denoting any
television service that is provided over a
broadband connection using internet protocols. (It
generally also indicates that the service is a
managed one, rather than a best-effort video
stream such as that provided by YouTube).
45m IPTV users globally
In terms of sheer customer numbers, IPTV might
not rival the penetration of mobile, but it has
nonetheless grown to a material size over a
comparatively short period of time. We estimate
that there were more than 45m IPTV users in the
world in January 2011, a 40% year-on-year
increase. IPTV subscriptions represented 8.2% of
total broadband lines in Q3 2010, as compared to
6.2% in Q3 2009 (as shown in the graph below).
If we exclude cable and mobile broadband
accounts, we estimate that IPTV penetration of
broadband lines would be closer to 12%.
Measured by absolute IPTV customer numbers,
Europe is the most significant region, accounting for
46% of global IPTV connections in Q3 2010,
followed by Asia (with 35%) and the Americas
(with 18%). The Middle East and Africa contributed
less than 1% of the total. France is the world leader,
with nearly 10m IPTV connections, followed by
China (9m including HK) and the US (7m).
Global broadband users (million) and IPTV penetration as a percentage of broadband lines
Top 10 IPTV countries, Q3 2010 (IPTV connections, millions)
0
100
200
300
400
500
600
Q1
07
Q2
07
Q3
07
Q4
07
Q1
08
Q2
08
Q3
08
Q4
08
Q1
09
Q2
09
Q3
09
Q4
09
Q1
10
Q2
10
Q3
10
0.0%
2.0%
4.0%
6.0%
8.0%
10.0%
Global BB users IPTV penetration
0
2
4
6
8
10
Fra Chi USA SKor Jap Ger Bel Spa Ita
Source: Point topic, HSBC Source: Point Topic
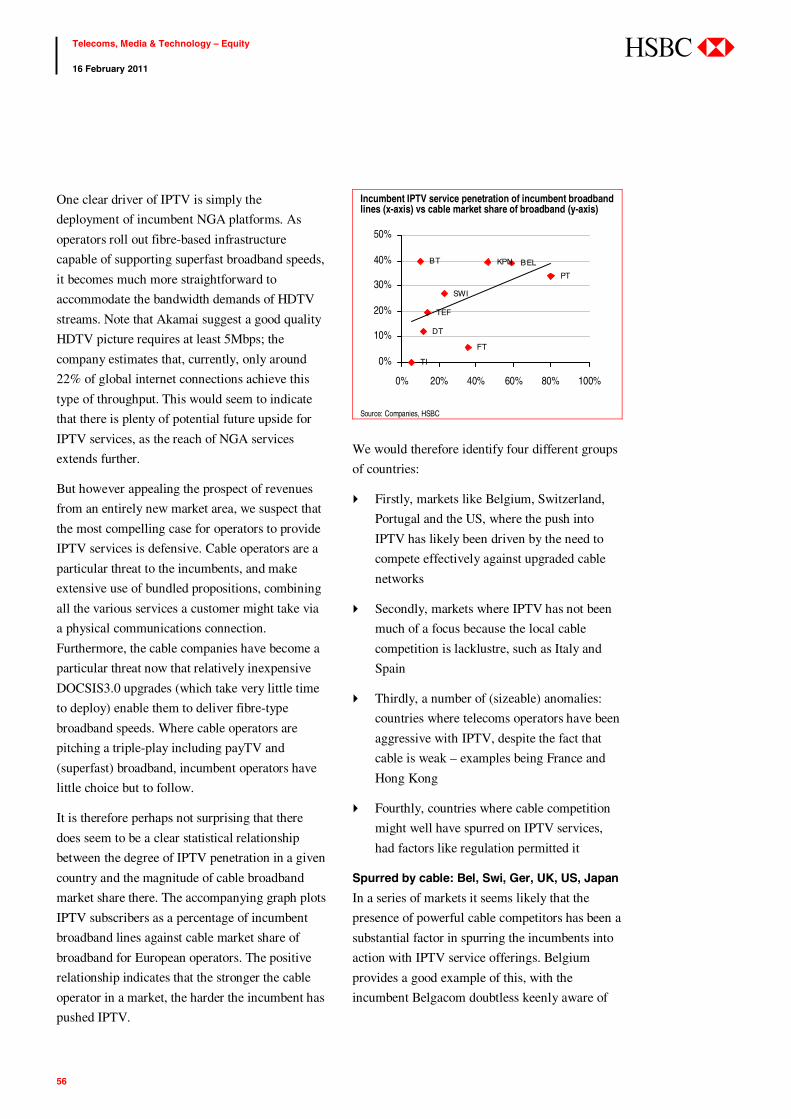
56
Telecoms, Media & Technology – Equity 16 February 2011
abc
One clear driver of IPTV is simply the
deployment of incumbent NGA platforms. As
operators roll out fibre-based infrastructure
capable of supporting superfast broadband speeds,
it becomes much more straightforward to
accommodate the bandwidth demands of HDTV
streams. Note that Akamai suggest a good quality
HDTV picture requires at least 5Mbps; the
company estimates that, currently, only around
22% of global internet connections achieve this
type of throughput. This would seem to indicate
that there is plenty of potential future upside for
IPTV services, as the reach of NGA services
extends further.
But however appealing the prospect of revenues
from an entirely new market area, we suspect that
the most compelling case for operators to provide
IPTV services is defensive. Cable operators are a
particular threat to the incumbents, and make
extensive use of bundled propositions, combining
all the various services a customer might take via
a physical communications connection.
Furthermore, the cable companies have become a
particular threat now that relatively inexpensive
DOCSIS3.0 upgrades (which take very little time
to deploy) enable them to deliver fibre-type
broadband speeds. Where cable operators are
pitching a triple-play including payTV and
(superfast) broadband, incumbent operators have
little choice but to follow.
It is therefore perhaps not surprising that there
does seem to be a clear statistical relationship
between the degree of IPTV penetration in a given
country and the magnitude of cable broadband
market share there. The accompanying graph plots
IPTV subscribers as a percentage of incumbent
broadband lines against cable market share of
broadband for European operators. The positive
relationship indicates that the stronger the cable
operator in a market, the harder the incumbent has
pushed IPTV.
Incumbent IPTV service penetration of incumbent broadband lines (x-axis) vs cable market share of broadband (y-axis)
PT
SWI
BELKPNBT
TI
TEF
DT
FT
0%
10%
20%
30%
40%
50%
0% 20% 40% 60% 80% 100%
Source: Companies, HSBC
We would therefore identify four different groups
of countries:
Firstly, markets like Belgium, Switzerland,
Portugal and the US, where the push into
IPTV has likely been driven by the need to
compete effectively against upgraded cable
networks
Secondly, markets where IPTV has not been
much of a focus because the local cable
competition is lacklustre, such as Italy and
Spain
Thirdly, a number of (sizeable) anomalies:
countries where telecoms operators have been
aggressive with IPTV, despite the fact that
cable is weak – examples being France and
Hong Kong
Fourthly, countries where cable competition
might well have spurred on IPTV services,
had factors like regulation permitted it
Spurred by cable: Bel, Swi, Ger, UK, US, Japan
In a series of markets it seems likely that the
presence of powerful cable competitors has been a
substantial factor in spurring the incumbents into
action with IPTV service offerings. Belgium
provides a good example of this, with the
incumbent Belgacom doubtless keenly aware of

57
Telecoms, Media & Technology – Equity 16 February 2011
abc
the threat potentially posed by cable rival Telenet
(now part of Liberty Global).
Belgacom was among the earliest to launch IPTV
services in Europe, and now has around 20%
market share of the national TV market as at the
end of Q3 2010 – with the rest belonging to cable
operators (predominantly Telenet). Satellite and
DTTV are very small in Belgium (respectively
2% and 4% of the market). IPTV penetration
reached 60% of Belgacom’s broadband
connections by Q3 2010. Indeed, IPTV has
become a relatively material item for the
incumbent, and now provides 16% of its
consumer revenues (growing at 43% year-on-year
in Q3 2010). The company’s triple-play package,
which includes fixed-line voice and broadband
(12Mbps with a 50GB cap) as well as more than
70 TV channels, starts at EUR52 per month.
Telenet’s equivalent triple-play packages start
from EUR45 per month (for 15Mbps broadband
with a 15GB cap and 70 digital TV channels).
Swisscom is another European incumbent that
faces competition from one of Liberty Global’s
cable operations. The Swiss incumbent started
providing IPTV services in 2007 and had secured
around 10% of the TV market by the end of Q3
2010 – by which point, 23% of its broadband lines
were taking an IPTV service. Swisscom’s triple
play package starts at CHF99 per month and
includes line rental, free voice calls to the
Swisscom fixed-line and mobile networks,
10Mbps broadband and a TV service with over
160 channels. The incumbent is competing against
cable operator Cablecom’s triple-play package
(CHF75 per month for fixed-line calls, 20Mbps
broadband and more than 120 TV channels).
Turning to Portugal, incumbent Portugal Telecom
(PT) has made a good measure of progress with
its IPTV offering. The company has secured
control of 28% of the payTV market in a period of
only three years (although payTV in total only
represents about 47.5% of total TV households).
Nearly 80% of PT’s broadband lines take an IPTV
service. The company’s triple-play offering
includes 70 channels as well as video-on-demand,
12Mbps broadband and unlimited voice, all from
EUR42 per month. Zon, the larger of the cable
operators, has a 34% market share in broadband
and 60% in TV. Important content such as
football is available to both PT and ZON on the
same basis.
The two major operators presently offering an
IPTV service in Germany are Deutsche Telekom
(DT) and Hansenet (which is part of Telefonica),
under the Alice brand. Meanwhile, Vodafone is
presently re-launching its IPTV offering. DT is
the largest IPTV provider, though, with 1.4m
subscribers (a circa 3.5% share of the TV market),
which represents only 11.8% of the company’s
broadband lines. DT offers IPTV packages both
on a stand-alone basis and bundled together with
broadband. The price of its stand-alone packages
European incumbents: IPTV performance and market environment
IPTV subs % total BB subscribers TV channels Exclusive content IPTV competitors Cable competitors
FT 3.2m 35.8% 130+ Football rights + cinema Iliad, SFR NumericableDT 1.4m 11.8% 120+ Football rights Hansenet KDG, UnityMedia, KBWTEF 0.8m 13.6% 30+ None Orange, Jazztel OnoTI 0.4m 5.4% 100+ None Fastweb, Vodafone No cable in ItalyBT 545K 9.9% 70+ None Talk Talk, BSkyB Virgin MediaKPN 1.2m 46.5% 50+ None Tele2 Ziggo, UPCBEL 920k 59.2% 70+ Football rights+exclusive content none Telenet, Woo, NumericableSWI 358k 23.1% 160+ none CablecomPT 0.8m 79.8% 70+ None Sonaecom, Vodafone ZonTLSN 450K 39.9% 40+ none Telenor ComHemTDC 128k 9.9% 38+ none Dansk Bredbånd StofaSource: Companies, HSBC

58
Telecoms, Media & Technology – Equity 16 February 2011
abc
range from EUR27.95 to EUR39.95 per month
over a 16Mbps DSL connection. The bundled
packages’ prices range from EUR44.95 to
EUR49.95 per month over a 16Mbps DSL
connection. The TV packages provide 120
channels, although DT also offers 10,000 movies
and soaps on an on-demand basis. DT’s offering
needs to be compelling, because it faces stiff
competition from the cable segment, which has
been in the process of a major network upgrade to
enable it to provide superfast broadband services.
Moving across the Atlantic, IPTV has been a
major focus for the US RBOCs, Verizon and
AT&T. Both have invested heavily in upgrading
their access infrastructure to high capacity fibre
systems since 2004. Although not strictly an IPTV
service (as it is actually broadcast over fibre on
dedicated wavelengths), Verizon’s FiOS TV now
has 3.5m customers, equivalent to 28%
penetration in the areas where it is available for
sale. AT&T uses more economical IPTV switched
video over FTTN/VDSL, and now has 3m U-
verse video customers.
The RBOCs’ motivation for shifting into the
payTV world was in large measure provided by
the increasing threat posed by the cable operators
with their triple-play bundles. And while Verizon
and AT&T have made some solid progress, their
IPTV subscriber bases remain small by
comparison to the 100m payTV households in the
US – the bulk of which continue to be serviced by
cable and satellite providers (see accompanying
chart).
In Japan, NTT has developed its IPTV platform
both to maintain competitiveness with cable
operators as they upgrade broadband capabilities,
and to provide an additional 'hook' for households
to upgrade from DSL. This service is now
demonstrating good momentum, with 1.8m
households were subscribing to NTT's optical
broadcast service at end 2010, equivalent to a
penetration rate of 12.6% of its fibre accounts.
This total includes both the FLETs TV service,
where NTT rebroadcasts SKY Perfect content,
and the Hikari TV IPTV service, which is
operated by NTT Communications. FLETs TV
prices begin low (at JPY700, cUSD9 per month),
and so have succeeded in attracting some of those
cable customers looking to save on their costs, as
well as winning viewers new to payTV services.
After a period during which NTT’s IPTV service
lacked appealing content relative to its cable
peers, NTT has now been able to redress the
balance. In addition to rebroadcasting terrestrial
TV, NTT offers more than 70 IPTV channels,
including around 40 in HD. Half of current users
take the unlimited service, which allows access to
about 13,000 video-on-demand programmes;
recently released movies are available for JPY820
(cUSD10) each.
By contrast, KDDI has focused on broadband and
VoIP rather than IPTV. As at the end of
September 2010, only circa 10% of its fibre
customers took its IPTV service, doubtless
reflecting the fact that it has a weaker channel and
content line-up relative to that provided by NTT.
IPTV not a focus: Italy, Spain
Cable’s presence, though, is patchy even in
developed markets. Several European countries
are notable for having either an, at best, limited
US payTV market share end 2010
Cable
60%
Satellite
33%
Telco
7%
Source: Companies, HSBC estimates

59
Telecoms, Media & Technology – Equity 16 February 2011
abc
cable segment, or none at all – with Spain a case
of the former and Italy of the latter.
Telecom Italia (TI) and Fastweb are the two main
IPTV providers in Italy, although this service is
still minor as compared to satellite – representing
only 20% of the payTV market and 5% of the
total TV market. Telecom Italia’s IPTV customers
are equivalent to only 5% of its broadband lines.
TI’s chief rival, Fastweb, offers a basic triple-play
service with more than 30 TV channels, 10Mbps
broadband and fixed-line voice all starting from
EUR27.45 per month. In addition, Fastweb and
Sky Italia (the largest digital satellite player) have
entered into a commercial agreement whereby
customers can choose services from either within
a joint plan, and then receive a unified bill with
dedicated call centre support. This could provide
TI with a serious challenge, as it combines strong
content from Sky with the high-speed broadband
capability of Fastweb.
Meanwhile, in Spain, IPTV is now being offered
not only by the incumbent Telefonica, but also by
the likes of Orange and Jazztel. However, in total,
IPTV represents around 20% of the payTV market
(with payTV in turn accounting for around 25%
of total TV households). Telefonica is the largest
player, with a market share in IPTV of more than
90%. But this still only represents 14% of the
company’s broadband connections in Spain.
Telefonica’s IPTV package consists of 30
channels and access to a video-on-demand
catalogue, and is available for a monthly price
starting at EUR10.
IPTV not response to cable: France, Hong Kong
In contrast, certain other markets have embraced
IPTV services even without the presence of a
convincing cable threat. France arguably provides
the best example of this, given the relatively
limited nature of cable deployment in this market.
By Q3 2010, France had close to 10m IPTV
subscribers, out of 26m homes and 21m
broadband lines. The French market has been
offering IPTV since 2003, when Iliad launched its
triple-play offers over ADSL. Subsequently, not
only France Telecom (FT) but also other
alternative operators have launched similar
bundles: hundreds of channels, video-on-demand,
payTV and also catch-up TV. The success of
these services has been facilitated by the fact that
FT’s local loops are shorter in length than in most
countries (and also employ thicker wires), which
means that the service can work well with even
basic ADSL technology. Another factor, though,
was the fact that the local loop was made
available on an unbundled basis both relatively
swiftly and at attractive tariffs (at least so far as
FT’s competitors are concerned).
So France is rather atypical in the sense that
IPTV’s success was not triggered by a perceived
need on the part of the incumbent to address
troublesome cable competition (indeed, cable’s
market share of broadband in France is only 6%).
Instead, it was Iliad’s early and innovative move
into IPTV that forced competitors to replicate its
offer.
The above said, it is worth pointing out that most
households in France (unlike those in Belgium or
Switzerland) still rely on digital terrestrial TV
(DTTV) for the bulk of their TV consumption.
We estimate that analogue TV and DTTV still
provide the main mode of access to television for
about 45% of French households. This compares
to about 24% for satellite and 22% for IPTV. But
IPTV is nevertheless a very popular complement
to DTTV services in France.
However, while IPTV services might have
achieved a good measure of uptake, this is not to
suggest that they are necessarily lucrative –
especially so far as the incumbent is concerned.
FT has bought exclusive content, whereas its
60
Telecoms, Media & Technology – Equity 16 February 2011
abc
competitors have preferred to focus on reselling
standard channels and video-on-demand
catalogues. In particular, FT spent EUR625m to
purchase key football rights for the period 2010-
12, and also acquired movie content for the
Orange cinema series of channels (at a cost of
EUR249m). Orange’s payTV offering attracted
1.7m clients as at the end of Q3 2010, a figure
equivalent to 53% of its standard broadband IPTV
users, but seems unlikely to have delivered
attractive returns. As a result, FT has announced
that it will not be bidding for the next round of
football rights, as well as that it now intends to
merge its Orange channels with those of Canal+.
Turning to Hong Kong, incumbent PCCW does
face a cable competitor, but its enthusiasm for
IPTV services has had a long track record, dating
all the way back to the turn of the last decade.
PCCW now runs the market’s largest payTV
service based on an IPTV platform. The offering
is bundled with the company’s market leading
broadband service. Indeed, PCCW is the only
quad-play (fixed-line voice, broadband and IPTV
together with mobile) operator in Hong Kong
(with market shares of 57%, 55%, 46% and 14%,
respectively). As noted above, PCCW does face
cable competition, but it has generally been
ineffectual – although the company was also
doubtless encouraged to push IPTV thanks to the
supportive topology of its network (short loop
lengths serving dense urban neighbourhoods).
IPTV but for regulation: Brazil, Mexico
There are good grounds for doubting developed
world telecoms operators’ expertise with media
content, and hence for scrutinising their IPTV
plans with due caution. However, there is
arguably a very genuine opportunity in the
emerging markets. Here, operators are often able
to more fully leverage their scale and network
advantages. Meanwhile, local content may make
it more difficult for the US technology giants to
gain superiority. Infrastructure permitting, then,
IPTV offered by the telcos would seem to make
most sense in some of the emerging markets. But,
as it happens, the necessary regulation has not
always been forthcoming.
For example, the development of IPTV in Brazil
has hitherto been stymied by the country’s media
laws, which prohibit the offering of IPTV over
terrestrial telecoms networks. This has resulted in
the Brazilian payTV market up to this point
comprising a virtual duopoly between a dominant
cable operator, NET Serviços, and a dominant
satellite player, Sky Brasil.
However, there are signs that this may be about to
change. The telecoms and media regulator Anatel
has been keen to foster greater competition in
payTV, and so has supported proposed changes to
the media law (PLC116) – currently awaiting
review by the Brazilian senate – that would allow
telecoms operators to offer IPTV. Although
precise timing remains unclear, we believe the
necessary changes to legislation will take place in
H1 2011. In fact, Anatel has already removed
language prohibiting IPTV over telecoms
networks in its licence renewals for 2011.
From a practical point of view, though, further
growth in IPTV will still depend on the roll out of
superfast fibre-based broadband platforms. The
Brazilian government is keen to improve
broadband availability, although the focus here is
more on bridging the so-called ‘digital divide’ for
basic broadband rather than on the higher-speed
technologies (FTTP or FTTN/VDSL) that are
needed for good quality IPTV.
The success of alternative operators like GVT
might also stimulate further activity. GVT (part of
Vivendi) has been offering superfast broadband
(ADSL2+, VDSL and FTTP) services in lucrative
areas of its home region II; additionally, it now
has plans to expand into Rio de Janeiro (region I)

61
Telecoms, Media & Technology – Equity 16 February 2011
abc
as well as Sao Paulo. This should help spur the
telecoms operators into fibre investments of their
own that are suitable for IPTV services.
The IPTV market in Mexico has a similar story to
that in Brazil, with current legislation prohibiting
the dominant telecoms player (Telmex) from
entering the market. What is different, however, is
that – unlike Brazil – the prospect of imminent
changes to the legislation seems less likely.
Telmex had struck a deal with the government in
which it agreed to allow cable operators to
interconnect with its fixed-line infrastructure,
thereby enabling these companies to enter the
voice telephony market. In exchange, Telmex was
to be permitted to enter the pay-TV market.
However, although cable companies are now
permitted to offer telephony, Telmex has yet to
receive permission to offer TV (of any kind –
IPTV, satellite or otherwise). The disagreement
between the government and Telmex on this issue
has rumbled on for several years, and shows little
sign of resolution (although we would add that
visibility on this issue is entirely absent – and
hence there is also the potential for a positive
surprise).
IPTV vs OTT
As outlined above, the response to operators IPTV
services has been mixed – and in only very few
countries could the service be described as an
unqualified success. However, the incumbents are
not the only potential providers of IPTV offerings.
Indeed, one of the startling features of superfast
broadband in particular is that it opens up a
conduit to the home capable of carrying HDTV
streams that is potentially available to anyone
with content to distribute.
Because of their knowledge of the underlying
connectivity, it is only natural that the incumbents
should want to exploit this opportunity. But they
will not be alone. And given that regulators
increasingly insist that the connectivity be offered
to all-comers on equal terms, it is no longer very
apparent that expertise in NGA platforms (such as
possessed by the incumbents) is much of a
relevant consideration. The ability to bundle IPTV
with other associated products (particularly
broadband itself) obviously still holds appeal, but
– again – regulation now often permits the
incumbents’ competitors to readily replicate this
proposition.
Over-the-top (OTT) providers are so-called
because their offering runs on top of the
connectivity provided by a telecoms operator’s
infrastructure. It is very plausible that certain OTT
players will not only give the incumbents’ own
IPTV services some stiff competition, but could
also challenge existing media brands that are
today well-established in the payTV market. Most
high-profile among the OTT new entrants are the
likes of Google, Apple and Amazon.
Indeed, if the challenge confronting telecoms
operators looks tough, spare a thought for the
payTV stalwarts. For telecoms’ operators, what is
at stake are potentially attractive additional
revenues, but likely at low margins (as operators
would always have to pay out much of the retail
revenue captured in fees to the content owner).
For payTV players, what is at stake is their
existing livelihood.
Admittedly, due to factors such as the
complexities of rights arrangements and the
power of their existing brands in the entertainment
space, it seems likely that today’s payTV
providers will remain a powerful force in the OTT
world, and their sites a popular destination for
those seeking video content. But there remains the
simple problem that, with the barriers to entry
now much reduced, there are likely many
companies besides the existing payTV players
that will suppose this market holds promise.

62
Telecoms, Media & Technology – Equity 16 February 2011
abc
However, OTT services have a very long way to
go before they can hope to challenge the viewing
figures of mainstream broadcasters. That said,
though, those wishing to downplay OTT’s
significance should beware the deceptive s-curve
displayed by so many new technologies:
penetration rates should not be extrapolated in a
linear fashion from the early adoption phase, as
there is usually a point at which uptake rapidly
accelerates.
In summary, then, the number of market
participants is likely to swell significantly, and
among the new arrivals will probably be some of
the largest, most powerful companies on earth. It
is hard to see how this could be an incremental
positive for today’s payTV companies, even if
they are able to retain a significant position in the
new OTT order. In order to give an impression of
just how many players are involved in the contest
for a share of payTV revenues, the section below
surveys the way in which this struggle has already
manifested itself in the consumer electronics
space.
The fight for your living room In living rooms right across the world, a fierce
contest is now underway – indeed, dear reader, it
is more than likely taking place in your very own
home. The weapons of choice are the otherwise
anonymous plastic boxes that typically house
consumer electronics equipment. Sitting beneath
the world’s television sets are an ever expanding
array of devices, ostensibly devoted to enabling
their owners to variously access content provided
via conventional means, such as DTTV, satellite,
DVD and so on. But almost all of these units
today also include what could be regarded as a
‘Trojan horse’ element, intended for use with
OTT video services.
Consoles such as the Microsoft Xbox 360 or
Sony PS3 might superficially appear to be
dedicated to the (increasingly important)
business of video gaming. But both of these
devices are also capable of streaming video
content from OTT suppliers.
Many DTTV and satellite boxes, while
primarily intended to enable their owners to
watch broadcast content, also contain an
Ethernet interface enabling them to handle
certain video streams. In many cases, these
boxes are produced to work in conjunction
with a specific payTV company’s broadcast
output, but there are also generic standards
emerging that work on an open basis, and will
thus facilitate access to OTT content from a
wide variety of sources.
Dedicated streaming devices have also begun
to make their appearance, an example being
the Roku box in the US, a USD99 device that
enables its owners to view content streamed
from the likes of Netflix and Amazon.
Another example would be the AppleTV set-
top box, which has recently been re-vamped
and re-launched. The GoogleTV platform is
also making its entrance, and will be available
in set-top boxes initially manufactured by
Logitech, in addition to some TVs.
Televisions themselves are also getting in on
the act. The latest premium models are often
internet enabled, meaning that they can
directly access streamed video content from
OTT sites such as Google’s YouTube. Similar
functionality is also appearing in supporting
devices, such as Blue-ray players.
Just to further complicate matters, many
participants have their fingers in more than one
pie. For example, Sony has its own suite of
products such as internet TVs and the PS3, but is
also collaborating with the GoogleTV project.
Additionally, there are a number of conscious
efforts on the part of various participants to
establish some common standards. For instance,

63
Telecoms, Media & Technology – Equity 16 February 2011
abc
in Europe, the Hybrid broadcast broadband TV
(HbbTV) consortium has achieved a good
measure of traction, with a double digit number of
German broadcasters now utilising the format to
provide services like catch-up TV. Sony,
mentioned just a moment ago, is again a
participant. (Note Project Canvas, now renamed
YouView, is approximately a UK equivalent of
HbbTV, and two may converge in future).
There are two asides to make at this stage. The
first is that, amid all the intense rivalry on display
here, there is clearly the risk that an undue degree
of fragmentation takes place, potentially both
confusing the consumer and introducing excessive
costs for those that own content rights but must
port them between numerous different standards
and electronic programme guides (EPGs). By way
of example, note that platforms often use different
DRM (digital rights management) technology:
that appropriate for streaming to a games console
is not necessarily compatible with that working on
an internet TV – even if both units share the same
manufacturer.
The second is that, despite the panoply of
acronyms, there remains one practical issue within
the home that still lacks a good uniform solution:
most houses are simply not wired so as to enable
the television set in the living room to take a
service from a data feed. A variety of technologies
are in contention to address this need, although
none would currently seem to provide all the
answers.
There are new wireless technologies like wireless
HD (WiHD) and wireless home digital interface
(WHDI) but – of course – these are not
incorporated into the majority of pre-existing
consumer equipment, and WiHD is restricted to
line-of-sight implementations. WiFi remains the
most widely deployed domestic wireless data
technology, but does not generally have the
bandwidth to support IPTV streaming,
particularly if in HD. Another alternative is
powerline technology, which enables data to be
streamed over the one form of existing wiring
seen in almost all homes, ie that providing
electricity. Earlier implementations lacked the
bandwidth to cope with HDTV, but there are now
faster upgrades available.
The name of the game
Why all this potential duplication of effort? The
players in this field would naturally each like to
control the customer’s gateway into the world of
streamed video services, hence the desire to see
their software interface alongside (or inside!)
consumers’ televisions. A great deal of jockeying
for position, as well as hedging of risks, is
therefore to be expected.
The problem for telecoms operators in this context
is the sheer number of players (often with
powerful brands) that are eying this space. And
while the telecoms network may be an absolutely
vital component in the overall service (after all,
OTT content can only reach the consumer over
telecoms pipes), the problem is that this element is
somewhat invisible (indeed, this is the usual
dilemma for any service company). In contrast to
telecoms players, electronics and technology
companies will not have to deploy substantial
capital to reach the home; but if it is their EPG
that the customer consults to select content, then –
however ‘unjustly’ – the chances are that it is with
them that the consumer will primarily associate
the service.
Some customers may come to OTT via an orderly
decision process, having selected their optimum
supplier. However, many others (particularly
those less interested in technology) will likely
stray into this territory, rather than making a
definite plan from the outset. There is a good
chance that whichever company is first able to
entice them into experimenting with a service may
secure them as a customer for its platform.

64
Telecoms, Media & Technology – Equity 16 February 2011
abc
Several telecoms operators have therefore made
efforts to get their own set-top boxes into the
home, to ensure that their streamed video services
are competing for the eyeballs of any customers
curious to see what sort of video streaming
service their living room equipment can provide.
Plainly, if the telecoms operator can exert some
form of control over the electronic programme
guide in particular, it would be in the powerful
position of being able to steer customers towards
one video service over another. Even was its own
IPTV service to wither, a telecoms operator able
to act as a gatekeeper in this fashion would
doubtless find it very lucrative. But the problem
here is simply getting heard amidst all the activity
– from so many players – in this space.
Orange/FT, for example, has made a clear effort
to get its own-branded equipment into customers’
homes, via its Livebox. However, the results have
been mixed. In an admirably forward looking
move, Orange gave access to the box’s
application programming interfaces (APIs), with a
view to encouraging the emergence of innovative
applications (rather like Apple has successfully
achieved with its iPhone). However, this has
failed to stimulate the appearance of any kind of
developer ecosystem, although this is not to
detract from the fact that the device’s presence in
many living rooms will have made Orange’s
services an easy upgrade path for its customers.
Telecoms operators interested in a set-top box
presence are not confined to those with a fixed-
line focus. Vodafone has recently announced
boxes for the German and Spanish markets that
are capable of receiving broadcast TV (from a
variety of conventional platforms) alongside OTT
video via broadband.
A particular concern to all market participants
(whatever their origins) will be AppleTV. It
should almost go without saying that Apple has a
formidable reputation in terms of designing and
manufacturing highly desirable consumer
electronics. Rivals will be concerned that the
AppleTV device itself will lure in customers,
particularly those that are already enthusiastic
devotees of the brand. Previous iterations of the
AppleTV product were arguably underpowered
(the device would not support 1080p HDTV) and
overpriced (both in terms of the unit itself and the
HD movies offered over it).
Many competitors may have been relieved that
Steve Jobs’s second iteration of the AppleTV
product was not more radical. The first version
sold in (by Apple’s standards) disappointing
quantities, not even shifting 1m units. Its
replacement offers a greater range of VoD and is
also cheaper, yet it hardly looks like a game
changer. For this paradigm shift, we would argue
that it is necessary to look elsewhere –
specifically to the iPad. In future, these devices
may provide the most immediate viewing
platform, with consumers opting to send a
streamed signal to a more conventional TV only
when they know that several companions are
interested in seeing the same programme.
Furthermore, the iPad and its tablet equivalents
look like the best interface by which to navigate
through the likely bewildering array of content
available from OTT sources. In future, the
purchase of a programme via an OTT video-on-
demand service might involve a transaction via an
iPad, rather like the purchase today of an app. So,
even on the assumption that customers continue
viewing their programming on television screens
(rather than on the tablets themselves), Apple –
through its iPad – has control of the platform that
could effectively become the equivalent of the
remote control in countless households. Hence
Jobs may have concluded that – with or without
AppleTV – his company already owns the most
obvious gateway into the OTT world for many
future viewers.
65
Telecoms, Media & Technology – Equity 16 February 2011
abc
Where Apple goes, Google is usually not too far
behind, and OTT video services are no exception.
The GoogleTV offering seeks to meld together
internet and TV content, capitalising on some of
the company’s traditional strengths in search.
Following the conventional web model, the
platform is fully open. As usual, Google will be
looking to monetise the opportunity via
advertising (clearly it has its eyes on the
enormous television advertising market).
Interestingly, though, Google has chosen to
include some relatively traditional partners: for
instance, Sony and DirecTV (indeed, working
alongside a conventional US satellite broadcaster
will undoubtedly raise some eyebrows). But
Google’s most powerful weapons remain its brand
and core search competence (giving users an easy
way to find programming amid the otherwise
confusing landscape of OTT).
But, lest it be supposed that the greatest threats to
media and telecoms companies seeking to
monetise the OTT opportunity originate entirely
out of technology companies based on the west
coast of the US, the intentions of various
supermarkets also merit mention. In the US,
Walmart has already entered the OTT field, while
in the UK, Tesco also has its eyes on this area.
Indeed, Tesco is actually looking to sell its own
internet connected set-top boxes, which will have
video-on-demand functionality. Any ambitions
held by Tesco in the OTT field are highly relevant
to the UK market because of the enormous power
and clout of its brand and retail presence.
What operators can do What should operators do to confront the
challenges that beset their IPTV businesses? Most
lack a brand that would naturally be associated
with entertainment; nor do they own exclusive
content, or enjoy the benefits of having (say) a
powerful internet brand.
Indeed, many telecoms operators do seem to be
retreating from the idea that they can muscle in on
the traditional broadcast space. For instance,
PCCW in Hong Kong decided that it was simply
too expensive to renew its English Premier
League rights exclusivity. Meanwhile, the
intervention of the regulator has persuaded FT
that it should re-evaluate how to go forward with
its Orange Cinema and Sport channels (following
complaints from Vivendi concerning their
exclusivity). It made sense to acquire exclusive
rights when it was possible to use these as a
mechanism to attract customers to a given
distribution platform. But with regulators
increasingly intolerant of such exclusive
arrangements (and not just with respect to the
telecoms operators), this is no longer such an
appealing strategic option. The content rights
business model is, instead, moving in the more
open direction implied by OTT.
But at least the regulators are looking at
exclusivity arrangements established by all parties
(and not just at those put in place by telecoms
players). This should limit the ability of dominant
payTV players to draw viewers onto their
proprietary distribution platforms (eg DTTV or
satellite) via exclusive content. In turn, this should
leave telecoms networks (including cable) as the
most natural and flexible content delivery solution
– a fact that operators should benefit from through
their connectivity revenues. As an example of this
process, note that Ofcom has referred BSkyB to
the UK Competition Commission on the grounds
that it might be necessary “to reduce Sky’s ability
to act on incentives to exploit market power, by
requiring it to provide wholesale access to linear
and S[ubscription] VoD premium movie content
on regulated terms.”
What makes this so important is that the
availability of a wide range of video content via
OTT platforms is very likely to prove one of the
66
Telecoms, Media & Technology – Equity 16 February 2011
abc
most powerful drivers of uptake for telecoms
NGA fibre services. Regulators will be aware of
this, and given that the deployment of such
platforms is in many places regarded as a priority
for national competitiveness, may view
sympathetically the need for there to be attractive
video content available over NGA connections, in
order to improve the economics of the roll out.
Alas, the matter of winning payTV customers
involves more than just assembling the right
programming. For example, BT had long been
looking to obtain access to some of BSkyB’s
sports content in order to boost the appeal of its
Vision service. Having at long last (thanks to
regulatory intervention) secured this
programming, it undertook a substantial
advertising campaign, highlighting the cheap
availability via its offering of Sky Sports 1 at just
GBP6.99 per month. Admittedly, the new content
did enable BT to improve its Vision net adds for
the quarter (to 24k from 14k in the previous three
months), but this is hardly an impressive
acceleration, especially given the marketing
undertaken.
Perhaps, then, the issue is really one of brand:
operators are simply not seen as credible suppliers
of video entertainment. Another alternative for the
telecoms companies would be to extend their
remit into elements of the applications layer other
than IPTV that are perceived as being more
functional in nature (and thus closer to the
operator’s core competency of providing
connectivity).
DT is among those that have developed services
of this type. For instance, customers are offered a
network-based address book that can be used via
PCs as well as mobile phones, on-line storage
accessible by a variety of means, including
through TVs equipped with DT’s set-top box,
control of IPTV programme recording via PCs
and mobile handsets, and so on. But, while a
useful feature set, it will be apparent that many (if
not quite all) of these capabilities are available
from the big internet and technology brands, and
customers may well gravitate towards using these
providers rather than their telecoms supplier.
Another alternative would be to exploit one
unique selling point that telecoms operators do
possess – in the form of their extensive call centre
resources. Operators are often heard complaining
that they are generally on the receiving end of the
telephone call when something goes wrong with a
consumer’s set up, even if the problem is more
likely to be with a supplier of the electronics or
software. Since the technology companies
responsible for the latter components of the
service are usually much harder to reach, the
customer’s first port of call is to ring their
telecoms supplier.
While it might be frustrating for operators to have
to take a call about a problem that is not
necessarily in any way their responsibility, it is
perhaps worth considering whether – if this is
going to happen in any case – it is worth making a
virtue of the situation? Operators’ support
capabilities are an advantage that could be
leveraged with the suppliers of consumer
electronics to persuade them to enter into
partnership, and (at the very least) incorporate
pathways guiding users to the telecoms
companies’ OTT services.
67
Telecoms, Media & Technology – Equity 16 February 2011
abc
Introduction The mobile applications layer is now firmly in the
possession of companies from the technology
industry. Indeed, even the term ‘application’ has
effectively become synonymous with Apple and
its ‘app store’. Even established device vendors
are struggling, and Apple’s most powerful rival in
this space looks set to be Google, with its Android
platform. The investment markets have – not
unreasonably – long since written off the
operators chances in this arena, and hence the rise
of the likes of Apple and Google in this field has
not come at the expense of telecoms valuations.
But there is a risk that the operators find
themselves not only cut out of the upside from
applications, but also dis-intermediated from
services that have traditionally been their
preserve. For instance, applications may become
the gateway to communications services and
make no acknowledgement of the underlying
connectivity upon which they depend. In this
context it is disappointing not to see the operators
showing more commitment to platforms like the
Rich Communications Suite (RCS) initiative,
which might at least have helped them to contain
certain threats.
That said, though, the operators do continue to
need the applications ecosystem to drive
innovation and thus the take-up of data services
that will exploit the connectivity they provide. In
a country such as China, where there is a risk that
the ecosystem could become stunted (because the
like of Apple and Google are unlikely to have any
hands-on control), this might – in turn – actually
hamper the take off of the entire mobile data
market segment.
The operators, then, do need the applications
ecosystem; but the reverse is also true: the
technology players need the operators, which foot
most of the bill for the mobile device upgrade
cycle. Consequently, we think it unlikely that
vendors such as Apple will either launch as
mobile virtual network operators (MVNOs) or
introduce soft SIM functionality (which makes
phones re-configurable to other networks) as such
moves would risk jeopardising their relationship
with the very companies that provide the bulk of
their revenues.
RCS: Relegated to Connectivity Service? We have long warned of the potential danger to
the operators of leaving the technology sector in
control of the smartphone software and
applications layer (for instance, see Avoid
Android, 9 November 2007). However, it is now
abundantly clear that the operators have almost
entirely ceded this space – and, as a result, it will
Mobile applications
Operators may regret failure to push RCS as a defensive measure
Connectivity revenues at risk in markets lacking app ecosystem
Soft SIM threat overstated, as not in vendors’ own best interests

68
Telecoms, Media & Technology – Equity 16 February 2011
abc
be technology companies like Apple and Google
that harvest the potentially rich pickings here.
The financial markets have essentially accepted
this state of affairs as a fait accompli, and there
has been little noticeable effect on operators'
valuations as a result – chiefly because investors
had long-since given up on their ability to
monetise the more sophisticated elements of the
data opportunity (anything much, that is, beyond
connectivity). However, it is worth asking
whether the markets currently fully appreciate the
extent of the territory sacrificed to the technology
sector.
The point here is that, once the applications layer
is outside of the operators’ control, everything
other than connectivity potentially becomes a
service that is delivered OTT, rather than by the
network operator. This applies not only to new
services like IPTV, but also to the most traditional
of telecoms fare, such as voice telephony.
Not surprisingly, the operators are making some
(late) attempts to at least regain a measure of
influence – given that to retake control looks well-
nigh impossible at this stage. One such initiative
is the Wholesale Applications Community, an
effort by a broad swathe of operators to provide a
common platform for developers (over both
different handsets and networks), potentially
streamlining development processes and
multiplying the addressable market. However,
such initiatives are almost certainly a case of too
little, too late, in our view – particularly given the
long-standing hostility felt between the developer
community and the telecoms industry due to the
latter’s historic inflexibility as regards the design
and revenue-sharing models for mobile
applications.
Another telecoms initiative is the GSM
Association’s (GSMA) Rich Communications
Suite (RCS), an effort to produce a set of
standards enabling mobile networks to provide the
type of functionality otherwise associated with
software-led platforms. For example, RCS has a
‘presence’ capability, able to inform users
whether their contacts are available for
communication, in the same type of way that
instant messaging systems work today. This is
plainly a very useful capability if users are to be
persuaded to continue to rely on switched mobile
Number of applications available by platform
150,000
20,0006,000 4,500
300,000
130,000
25,000 18,0005,000
0
50,000
100,000
150,000
200,000
250,000
300,000
350,000
Apple Android Nokia Ov i BlackBerry Window s 7
0%
100%
200%
300%
400%
500%
600%
end-2009 end-2010 Grow th y -o-y
Source: Distimo, HSBC estimates

69
Telecoms, Media & Technology – Equity 16 February 2011
abc
calls for their voice communications needs, rather
than electing instead to use OTT VoIP
applications.
However, RCS has attracted limited support from
the industry, with most operators non-committal.
There have been initial trials, for instance in the
South Korean market, but a typical complaint
relates to the fact that it has proven difficult to
monetise the services in question. The situation
bears comparison with the lack of enthusiasm
shown for the IP multimedia subsystem (IMS) or
the GSMA’s OneAPI initiative: two other
platforms that have inspired little enthusiasm,
likely as a result of the opaque nature of the
perceived business case. Naturally, this state of
affairs has a knock-on effect with the handset
vendors, creating something of a ‘chicken and
egg’ problem (ie without RCS-enabled handsets,
why push the services, but without the services,
why produce RCS-enabled handsets?).
Alas, a clear revenue upside opportunity may
prove to be a luxury: the battle is arguably rather
to retain ownership of the customer in relation to
their communications needs – in particular, given
the way in which social networking sites like
Facebook could become their users’ embarkation
point for all their communications needs. For the
telecoms operator to be dis-intermediated in this
way might not actually cost much revenue in the
short-term (as the customer’s communications
still rely on its connectivity), but very likely
entails longer-term risks.
The API wars
Facebook already provides a series of APIs for
third-party applications to hook into, and most
developers (given their IT background) are more
at home co-operating with another technology
player rather than a telecoms operator. Moreover,
the greater the popularity of social networking
sites (and their associated applications), the more
likely it becomes that mobile users will look to
them for innovative new services. Indeed, it is
difficult to see how mobile operators can keep up,
given that telecoms is an industry composed of
large (and therefore generally slower moving)
organisations where standardisation is regarded as
fundamental. Hence their very nature means that
they lack the flexibility of technology companies
to invest in new services without any clear picture
of how the revenue model will develop.
APIs offer web developers access to key operator network functions to add greater value to applications
Source: HSBC
The above said, operators do retain certain
advantages. They are likely more trusted than
internet names in terms of security, have
extensive customer support facilities (an area
where many technology players have almost no
capability whatever), and should – if the
necessary resources are committed to the relevant
development work – be able to leverage their
control of the underlying connectivity (for
instance, by providing QoS-related functionality).
Note that much of the effort with RCS is to
provide developers with APIs (essentially
software interfaces) enabling developers to access
and leverage the capabilities of the mobile
network, for instance to initiate a call or a text
message. Arguably, there are now just too many
APIs competing for the attention of developers –
and (as mentioned above) this will likely leave
developers graduating by default towards those
70
Telecoms, Media & Technology – Equity 16 February 2011
abc
provided by fellow technology companies, rather
than to those provided by the telecoms industry.
But even if developers can be attracted to exploit
this platform, given the operators are no longer in
control of the applications layer, there is no
guarantee that the application will in any way
signal to the user that they are utilising the
telecoms network’s connectivity – in just the same
way that Skype draws no attention to the fact that
it relies on telecoms bandwidth. So, from a
branding perspective, even were RCS to be
readily adopted, the operator may still lose out as
a result of its having ceded control of the
applications layer.
It is worth pointing out at this stage, though, that
we do not regard VoIP as a practical technology
for mass market voice communications over
mobile at present. As detailed in greater depth in
our thematic reports Frequonomics and
SuperFrequonomics (March and September 2010
respectively), 3G platforms are intrinsically
unsuited to the quality of service that is demanded
by VoIP. However, VoIP should work better with
4G/LTE, where it is the only means of carrying
voice (given the new technology’s lack of circuit
switched capability). It will, though, in our view,
take a number of years for 4G/LTE platforms to
mature, and for handsets using this technology to
become mass market. Moreover, most operators
have every incentive to retain lucrative voice
traffic on their circuit-switched, metered 3G (and
2G) infrastructure, which will also tend to limit
the pace of transition towards VoIP.
Hence, over the next few years, the threat looks
limited from either VoIP or the fact that the
operators may no longer exercise control over
how users initiate their voice calls. But, looking
out rather longer term (which, admittedly, could
mean 5 years plus), losing control of this
important interface could spell real problems with
regard to branding. After all, even if the reality of
the situation is that operators are best advised to
stick to what they know – that is, essentially,
providing the proverbial ‘dumb pipe’ – it would
perhaps be best if they could retain greater
engagement with the customer, so as to limit
churn and avoid being perceived merely as a
commodity supplier (albeit one owning and
operating an intrinsically scarce resource).
Flourishing ecosystems best Had the operators displayed real aptitude and
enthusiasm for the applications layer, then the
capture of this segment by players from the
technology sector might have been perceived as
more of a distinct negative. However, the reality
of the situation has been that, although some
extravagant claims were made for the scope of the
operators’ opportunity during the internet bubble,
most investors have long-since written this off.
So, while we might decry the mobile players’
failure in the application space, in a scenario
where there is no associated value being ascribed
to them, arguably the most important
consideration is that someone pursues the
opportunity – whatever their identity. In other
words, if there are no good reasons to suppose the
telecoms companies will get applications right,
then it is better that the challenge be taken up by
those fit for the task (ie the likes of Apple and
Google) rather than the whole field be neglected.
Provided the applications layer is properly served,
customers are likely to want to take advantage of
the exciting services on offer, and therefore to
take out data plans – and thus the operators
benefit via the resulting connectivity revenues. If,
on the other hand, the applications layer remains
rudimentary, the incentive for customers to adopt
data connectivity services will simply not be
present. To summarise: if operators have not the
aptitude to take the whole pie (ie applications +
connectivity), better that a rival provide the
applications so that the operator can take the

71
Telecoms, Media & Technology – Equity 16 February 2011
abc
connectivity half of the pie, rather than the
absence of applications mean there is no
associated demand for connectivity (ie no pie at
all!).
The global nature of brands like Apple and
Google might lead one initially to suppose that
their involvement in the applications layer would
ensure that this field could develop rapidly in
every important market. However, there may well
be at least one substantial exception to this: China.
It seems most unlikely that Apple or Google will
be left in charge of running the applications layer
in China, a responsibility that is more likely to be
given to the telecoms operators. However – as
elsewhere on the planet – there is little reason to
suppose that these companies have the right skill
set to make a success of this enterprise. This
might not dim the appeal of iconic devices such as
the iPhone, which possess clear status appeal, but
sales of high-status devices need not translate
through into data connectivity revenues. The risk
is, therefore, that without the proven track record
of innovation of the global technology leaders,
data connectivity could be a damp squib in China.
Softly softly on Soft SIMs Given the tremendous success that technology
players like Apple have had in terms of building
their presence in the mobile applications layer, it
is hardly surprising that concerns have been raised
as to the possibility of their attempting to extend
this power base further. For instance, consider the
scenario where they decided to push into the
connectivity space itself – the mobile operators'
heartland – or, alternatively, where they chose to
disrupt this space by introducing innovations such
as 'soft SIMs' (of which more below).
How might technology players like Apple (or
Google) go about making a move into the
connectivity layer? One route would be for them
to launch as MVNOs, leveraging their powerful
branding and reputation to attract customers.
Operators would know from experience the power
of these brands, and the stronger operators would
also be aware that their weaker rivals might find it
difficult to resist such an opportunity. Although
the technology player in question would own the
retail customer, they would still be paying the
mobile network operator a wholesale fee. This
could be perceived by smaller network operators
as a short cut to gain market share; and the
knowledge that the smaller players would find
such a proposition compelling might force the
hand of a larger operator into itself accepting the
proposal (with the justification that, if it were to
refuse, one of its rivals would get the business
instead).
But, in our view, there are good reasons to
suppose that the technology players will not in
fact take this route. The first of these revolves
around returns. We certainly believe that telecoms
in general (including mobile) generates an
attractive return profile, but we would not claim
the ROIs are as high as those seen from successful
technology companies. So the first question is,
why would the technology players want to dilute
their returns by becoming, in effect, mobile
operators?
This is arguably particularly the case given that,
as a MVNO, they would be perceived as
responsible for something that would not actually
be under their direct control: the quality of the
mobile network that they were reselling. Mobile
coverage will always be patchy, given issues of
interference, in-building penetration difficulties,
and so on. At present, it is the telecoms operators'
brands that take the hit for the inevitable problems
of mobile reception. It seems unlikely, in our
view, that the technology players would want to
be on the receiving end of the blame for this type
of issue, especially when they do not directly
control the infrastructure in question.

72
Telecoms, Media & Technology – Equity 16 February 2011
abc
There is also the problem that any move into the
MVNO space by the technology players would
effectively involve competing against their own
customers. It might – wrongly – be supposed that
the customers of a company like Apple are the
people who emerge from shops having purchased
an iPhone. But this would be a simplification,
because most of those 'buying' an iPhone pay
nothing like its full list price, instead taking a
handset subsidised by a mobile operator. So, if the
identity of the 'customer' is defined as the party
paying the largest element of the list price, then
this is usually likely to be a mobile network.
Clearly, if (for example) Apple was to decide to
launch as a MVNO, it would thus become a direct
competitor at a retail level to all the mobile
networks in the country in question. This would
doubtless leave the operators much less keen to
subsidise Apple's devices. Thus Apple might lose
out to its handset rivals, in particular to those
producing equipment powered by Google's
Android platform. Apple might (not
unreasonably) argue that its devices have such a
hold on the popular imagination, that operators
would simply have to continue subsidising its
devices; but, nonetheless, they would surely
become more wary of doing so, as well as keener
to find alternatives. It seems unlikely that this risk
is worth running simply in order to gain the
relatively thin margins of a wholesale operator,
particularly given the associated risks around
brand/network quality outlined above.
Soft SIMs counter-productive
What, then, of the risk of technology players
introducing so-called soft SIMs? (News reports in
November 2010, for example, suggested that
Apple was planning to integrate a soft SIM into
the iPhone, before the firm beat a hasty retreat
following the vocal concerns of several mobile
operators). At this stage, the phrase “soft SIM”
may require some explanation. Traditionally, a
mobile customer deciding to churn between two
networks would have to remove the SIM card of
their previous operator, and replace it with one
provided by their new operator. Not only is this
process fiddly, but there is also the strong
possibility that the original operator will have
'locked' the mobile phone such that it will only
work with one of that operator's SIM cards.
Mobile networks do this in order to ensure that,
once they have subsidised a handset's retail price,
the customer does not simply churn to a
competitor (after all, they need to earn a return on
the handset subsidy). Note that handsets can be
unlocked by those with the requisite know-how,
and while this is a service that is widely available,
it is also somewhat disreputable.
Soft SIMs make the process of switching mobile
operator much simpler by enabling the user via
on-screen software to re-configure the device to
work on different mobile operators’ specific
frequency bands as well to be recognized by their
AAA (authentication, authorization and
accounting) servers. For instance, there need be
no fiddling around removing casings and
manipulating diminutive slivers of plastic. But,
from a business model perspective, there is a
clearly a major potential headache here. Just as
with regard to the risk vis-a-vis technology
players becoming MVNOs, the problem is that to
introduce soft SIMs would be to work very clearly
against the operators' interests. And, in a business
model where the operator (via the subsidy) is, in
effect, the real customer (since it is responsible for
paying the bulk of the handset list price), this is
plainly highly risky.
Operators subsidise handsets in the hope that they
will attract customers to their network. If customers
are able to churn as soon as they have their handset
(courtesy of soft SIM functionality), then there is
little incentive for the operator to subsidise the
device at all. This would leave the customer having

73
Telecoms, Media & Technology – Equity 16 February 2011
abc
to pay up front the full list price for the handset. In
such circumstances, there is little doubt but that
customers would upgrade their handsets much less
frequently, and thus that the handset vendor would
take a considerable revenue hit.
It would therefore be surprising, in our view, if the
technology companies were prepared to risk the
arrangement in which they currently find
themselves. It is perhaps worth reviewing again in
outline the present business model. A handset
vendor like Apple develops expensive, premium
devices with a very substantial list price that, were it
to be reflected in the retail price, would surely deter
many would-be users. But the retail price is then
substantially reduced through the subsidy of the
operator, enabling the likes of Apple to sell far more
devices than they would otherwise do – and yet
Apple still receives the full list price. This is clearly
an advantageous state of affairs for the vendor:
Apple in effect gets to sell far more of its devices
than it would if its retail price was its list price.
Why jeopardise such a beneficial business model?
One set of circumstances in which this might be
justified would be in the scenario where the
operators looked intent on moving into Apple's
territory. Given the operators' poor showing in
terms of developing the applications layer, and the
tremendously successful entry into this space of
the Apple App Store in particular, the technology
players could be forgiven for thinking that this
now represents their own home territory. As such,
belated efforts by the operators to get involved,
such as the Wholesale Application Community
(WAC), would likely appear threatening
(notwithstanding the low chances of success that
we would ascribe to this particular initiative). So,
one possible explanation for the sudden interest in
soft SIMs is that Apple was well aware of the
counterproductive nature of this functionality, but
wanted to send a warning shot across the
operators' bows in view of developments such as
WAC.
In summary, therefore, we are sceptical about the
concept of technology companies either becoming
MVNOs or introducing soft SIMs. Neither
innovation would seem to make sense from a
business model perspective, although both might
make for useful threats in order to persuade the
operators that the mobile applications layer is no
longer a suitable goal for them.

74
Telecoms, Media & Technology – Equity 16 February 2011
abc
Introduction The emergence of pricing power in both fixed-line
and mobile telecoms should be a powerful positive
right across the industry, particularly after having
been absent for so long. We would stress,
however, that because pricing power is being
driven by the connectivity layer, the benefits are
by no means evenly distributed. In terms of the
fixed-line subsector, we believe that the best-
placed operators are those who are investing in
fibre-based next generation access (NGA)
infrastructure, which – by dint of the high capital
intensity of such projects – is ensuring scarcity in
the market for super-fast broadband provision.
Incumbents furthest ahead deploying NGA will be
the first to benefit; among the Europeans this
includes smaller incumbents like Swisscom and
KPN of the Netherlands, which are generally
further ahead than their peers in larger markets. In
the CEEMEA region, Israeli incumbent Bezeq
looks best-placed, while in the US, Verizon, which
has deployed FTTP to nearly 16m homes, stands
to benefit most, we believe. However, even ahead
of the best-placed telecoms operators, we think
that the greatest benefits will actually accrue to the
cable companies (Germany’s KDG, multinational
Liberty Global, Belgium’s Telenet, Virgin
Media in the UK and ZON in Portugal, as well as
recently re-floated Danish incumbent TDC which
also has cable assets). This is because digital cable
platforms can take advantage of a rapid and
relatively low cost upgrade to NGA via
DOCSIS3.0 modem technology.
In the mobile subsector, we favour larger operators
with the necessary scale to out-invest their smaller
rivals. Here again the application of capital should
be a positive differentiator, enabling operators with
deep resources to deploy a more densely-built
mobile network. This should mean shorter average
distances between their customers and their base
stations, which in turn should result in a faster and
more robust data connection – clearly a significant
source of competitive advantage. As a
consequence, we prefer the mobile exposure of
scale players like Vodafone, Telenor, NTT
DoCoMo and KT.
We believe that the tremendous growth in mobile
data volumes will mean that operators will need
(and want) to invest more in capex. The mobile
equipment vendors ought to benefit from this, with
our favourite being market-leader Ericsson, which
has the highest exposure to the mobile sector.
In the emerging markets, the dynamics are
somewhat different. There should still be the
opportunity to monetise scarcity in terms of
connectivity, and hence we would suggest stocks
like TIM Part in Brazil. However, additionally,
there may still be some scope for operators to
Winners and Losers
The scarcity is in the connectivity, so network investment vital
Fixed-line winners: cable plus telecoms operators investing in fibre
Mobile winners: scale players to enjoy quality of service advantage

75
Telecoms, Media & Technology – Equity 16 February 2011
abc
capture a portion of the applications layer: we
would advocate STC and MTN on this basis.
We see the losers on the themes discussed in this
report as being those companies that have been slow
to invest in their core connectivity capabilities, like
Telecom Italia and TPSA in Poland.
Developed world: winners and losers on all themes The specific theme examined in this report – the
emergence of scarcity and its ramifications in
terms of bestowing a measure of pricing power
upon the operators – is certainly topical, and
merits special focus, in our view. However, this
theme is only one of many that are relevant to our
overall evaluation of the companies in the
telecoms sector. The accompanying chart
therefore summarises our assessment of
developed telecoms stocks on all the various
themes considered in this and previous
documents, set against a basket of valuation
measures.
We highlight stocks that screen well on the topics
discussed in the current report, but which also do
well on our broader analysis of thematic issues. In
Europe, this applies to Vodafone (obviously a key
beneficiary of this particular report’s central
theme too) as well as to KPN and Telefonica.
CEEMEA: winners and losers on this theme We believe that there is an opportunity for
telecoms operators in the connectivity layer in
both developed and emerging markets. However,
emerging markets are somewhat distinct from
their developed counterparts, in that there may
still also be some scope for operators to monetise
the applications layer as well. In view of the
Stocks assessed in terms of full range of strategic themes (x-axis) vs valuation on a basket of measures (y-axis)
AT&T
Belga
Bouy
BT
CT
DT
Elisa
FWB
FTKDDI
KPN
MOBI
NTT
OTE
PT
SNX
Swiss
Tele2
TI
Tef
TA
Tnet
Tnor
TLSN
VZ
Vod
1.00
1.50
2.00
2.50
3.00
3.50
4.00
4.50
5.00
1.00 1.50 2.00 2.50 3.00 3.50 4.00 4.50 5.00
Thematic relative
Valu
atio
n re
lativ
e
Key:O/W =N/W =U/W =(size = mkt cap)
Source: HSBC
76
Telecoms, Media & Technology – Equity 16 February 2011
abc
different scope of their opportunities, below we
set out winners and losers in the CEEMEA region
as an example of emerging market operators’
prospects.
Fixed-line connectivity
In the CEEMEA region, there has been a
relatively slow transition to next generation access
(NGA) superfast broadband at the fixed-line
operators. Ultimately, this shift could potentially
move the competitive landscape away from
unbundling and towards wholesale in the most
mature telecom markets in CEEMEA, like in
CE3. The slow speed of deployment is mostly due
to the desire on the part of the telecoms
incumbents to negotiate first with the regulator
some guarantee for a minimum return or a more
accommodating regulatory environment. Typical
examples of this approach have been seen at
TPSA in Poland and Bezeq in Israel. In 2009,
TPSA entered into an agreement with the
regulator that requires the company to provide
1.2m high-speed broadband lines. This will
require an investment of cPLN3bn over three
years, but has helped to ease regulatory pressure
somewhat.
Due to the delays in NGA roll-outs, we have not
yet seen signs of a migration from unbundling to
wholesale. And note that in some countries, like
Russia and in Africa, ULL has not even been
implemented. However, increased investment in
NGA has precipitated a degree of consolidation
between small cable operators in CE3, as well as
triggering the acquisition of smaller cable TV
operators by CEE incumbents. Recent
acquisitions of regional cable operators by
Magyar Telekom in Hungary and by MTS in
Russia are examples.
In most CEEMEA telecoms markets, regulation is
not particularly stringent as regards net neutrality.
In fact, this issue has only really become a topic
of discussion for countries like CE3 that are
converging towards European telecoms
regulation. The absence of net neutrality
regulation is clearly a positive for emerging
market telecom operators, since it will enable
them to manage their resource (and available
capacity) more efficiently, and even to charge a
premium for prioritisation. Another recent
positive regulatory trend is for the media and
cable companies tends to be increasingly
compared with the telecoms operators, and
included within the remit of new regulation.
Hence, the regulatory advantage previously
enjoyed by cable operators is gradually eroding.
A similar conclusion could be drawn vis-à-vis
taxation: for example, the new communications
tax in Hungary applied to both telecoms and cable
operators.
The monetisation of fixed-line connectivity varies
greatly between countries in CEEMEA. Key
factors to consider are affordability, levels of
income disparity within the population and also
the level of availability of substitutes. For instance,
Polish subscribers spend a relatively modest
amount on broadband compared with customers in
Czech or Saudi. In 2010, TPSA reduced fixed-line
broadband pricing, through which it intends to re-
engage with the core market. However, broadband
competition is fierce in Poland, mainly thanks to
the cable operators, which are upgrading their
networks to DOCSIS3.0. Overall, we therefore
believe that TPSA should be seen as vulnerable to
the cable threat.
The Saudi environment is much more supportive
when it comes to the monetisation of broadband
connectivity. There are cable or altnets
competitors offering fixed-line broadband; mobile
broadband (via dongles) are the only alternative.
Currently VoIP is banned in Saudi Arabia, with
the consequence that broadband is not a direct
substitute for voice services. There is also likely
to be a healthy demand for broadband in the long

77
Telecoms, Media & Technology – Equity 16 February 2011
abc
term, given Saudi’s attractive demographics,
favourable regulatory environment, lack of
entertainment options and the absence of
alternative technologies.
In Turkey, the main inhibitor of fixed-line
broadband growth in Turkey is PC penetration.
Note that there is only a small difference between
PC penetration and broadband penetration (ie
households with a PC but no broadband). The
attempt to increase prices for unlimited packages
in 2011 to adjust for sharply rising inflation and to
impose fair usage quotas could negatively impact
subscriber and ARPL growth in the near term.
Furthermore, the nominal price increase does not
represent pricing power in real terms, given the
c7% inflation in Turkey that is expected by HSBC
economists in 2011. However, positives for Turk
Telekom include the absence of regulation
promoting net neutrality and the fact that local
loop unbundling remains unattractive for altnets.
Mobile connectivity
As discussed in our SuperFrequonomics report
(September 2010), data is not a story confined to
the developed world – indeed, in many ways, it is
actually operators in emerging markets that are
better placed on this theme. Emerging markets
are, naturally enough, further behind in data
adoption, but as a result should have more of the
growth ahead of them. Affordability issues will do
much to dictate the speed at which data services
penetrate the customer base, but the pace at which
smartphones and PCs are falling in price is
remarkable: it should not be long before USD100
smartphones make their appearance.
The provision of mobile broadband services in
many emerging markets is also inherently less
competitive, by simple virtue of the fact that
fixed-line platforms (the obvious alternative
supplier of broadband) are often limited in their
geographic reach. And there is arguably some
prospect that emerging market players may be
able to learn from developed-world operators’
missteps. For instance, it is interesting that
comparatively few have launched all-you-can-eat
data tariffs, with most instead (very sensibly)
opting for plans with usage caps. Another mistake
(in our view) committed by the developed-world
players was to cede the phenomenally important
applications layer to the technology sector.
In the CEEMEA region, MTS and some of the
African operators like MTN look well positioned.
All have introduced capped data tariffs, face
relatively little competition from fixed-line
broadband and have upside via content and/or
VAS. MTN is well placed in terms of pricing
power on mobile data. All the mobile operators in
Africa currently offer tiered data plans – there is
no ‘all you can eat’ data plan currently. Data
usage in South Africa has increased 49% since
December 2009, with MTN’s data revenues
growing 42% year-on-year in H1 2010.
Even more impressive is the 58% year-on-year
growth seen in non-SMS data revenues, which
accounted for 11% of MTN’s South African
service revenue. Among its larger operations,
Nigeria currently has the lowest proportion of
revenue (4.2%) coming from data services, the
key reason for this being simply a lack of required
bandwidth. However, with the landing of various
submarine cables in Africa, we expect the
capacity bottleneck issues to be removed soon.
This should, in our view, allow MTN to capture
the vast growth potential for data usage in
Nigeria. However, there are risks relating to the
entry of a credible new entrant (Bharti).
In Russia, growing demand for data is providing
mobile connectivity with momentum. 3G USB
modem numbers have now overtaken fixed-line
broadband subscribers. In Q3 2010, VAS (SMS
included) amounted to 20.5% of revenue in
Russia (a 2.1 ppt year-on-year increase), boosted
by the expansion of the 3G network and the fast

78
Telecoms, Media & Technology – Equity 16 February 2011
abc
growth seen in data traffic. We believe that
pricing power is unlikely to be undermined
significantly in the medium term, as the
competitive environment has remained quite
rational in Russia. However, there have been also
cases of private reselling of connectivity and the
illegal sharing of capacity. While the impact of
this could potentially be significant, it should be
mitigated as long as data tariffs remain tiered. We
would also expect the potential issues with illegal
sharing of capacity to gradually fade, as the
demand for higher speeds takes hold.
Fixed-line applications
There has been limited success in the
monetisation of fixed-line data applications by
operators in emerging markets. IPTV is one of the
most obvious potential services, but is chiefly
considered as a bolt-on tool for retaining
subscribers and competing at par against cable
operators. For example, in Poland, where cable
penetration is high, users are reluctant to pay for
IPTV unless real premium content is provided –
something that the incumbent is now making
progress in. TPSA signed a 10-year content
agreement with TVN group to cross-sell each
other’s services, with a special focus on multi-
play bundles.
Telecoms operators have had a degree of success
with their portals. TPSA’s Wirtualna Polska is
one of the most frequently visited websites in
Poland, but monetisation remains elusive. The
hope is that TPSA will be able to venture into
adjacent sectors like payment and e-commerce.
Meanwhile, competition in terms of content is
already pronounced – UPC has been providing
cable services in CE3 since the late 1990s. OTT is
not yet a threat, but inevitably is a looming risk for
the future.
As for the other CEEMEA countries, especially
Russia and MENA, factors like the complexities of
rights arrangements, power of existing brands and
absence of net neutrality regulation should provide
significant pricing power and advantage to the
incumbents. In Saudi, STC formally launched IPTV
services in August 2010 under the ‘InVision’ brand
– and is bundling its services through triple-play
offerings of voice, broadband and IPTV. This should
now leave them well-placed to monetise the fixed-
line applications layer.
Mobile applications
By contrast with their developed peers, emerging
market operators should enjoy several advantages
when it comes to leveraging the application layer.
For example, they will benefit from a degree of
familiarity with their local culture and language
that global technology brands will find it difficult
to replicate. They should also have less cause for
concern over one application in particular that will
likely cause headaches for their developed-world
peers: VoIP. This service is blocked in many
emerging markets – and, not infrequently, with
the government’s approval.
Hence, we believe that Africa and MENA should
display good growth in the medium term. We
expect low-cost smartphones based on the
Android platform to drive internet usage in
Africa. However, language will present a barrier
to would-be developed world competitors. So, for
instance, we believe players like MTN should be
able to avoid the fate of being dis-intermediated
from the applications layer.
Some successful non-voice mobile applications
are already evident in the emerging markets. For
example, mobile payment could become a
significant revenue generator (and now provides
around 14% of revenues for SafariCom). The fact
that most countries in Africa have a large
unbanked population creates an appealing
opportunity in these countries especially. MTN’s
mobile payment service, Mobile Money, is
showing a good take-up. For instance, MTN
Uganda already has almost 16% of its subscriber

79
Telecoms, Media & Technology – Equity 16 February 2011
abc
base using the service. In total, MTN has c2.2m
mobile payment subscribers across its various
operations. We reiterate our view that, over the
medium term, mobile payments will contribute
approximately 6% of revenues at a margin of
around 20% for the African mobile operators.
In Saudi Arabia, services based on news,
entertainment and religious content offer good
growth prospects. The increase in network
coverage and online Arabic content should also
drive strong mobile broadband uptake over comin
years, in our view. Data volumes conveyed over
Mobily’s network have increased by 70% year-
on-year, reaching 85 terabytes per day. Mobily
remains the market leader in the mobile
broadband segment, with 60% market share, and
has been able to command a pricing premium,
reflected in its high data ARPU of cUSD55.
Pricing has remained stable in Saudi Arabia for
broadband services, unlike other – more
competitive – markets, such as Egypt.
Turning to CE3, we expect low-cost smartphones
based on the Android platform to drive mobile
data usage. However, language will likely
continue to present a modest barrier to would-be
developed world competitors eyeing these
markets. Hence operators like TPSA may not yet
be completely dis-intermediated from the mobile
applications layer.
Ratings, target price & risks Below we summarise our target prices, valuation
methodologies and highlight the main risks for
each of the incumbents analysed in this report.
Note that our ratings on these operators reflect our
work on numerous themes, and not only the issues
on which the present report focuses on.
America Movil: Maintain Neutral rating and USD64 target price
We have tweaked our estimates following the Q4
2010 results conference call. Most of the changes
stem from a slight increase in Brazil mobile
ARPU after adjusting for Q4 2010 equipment
sales. We summarise the main changes in the
table below.
America Movil: Change in estimates
(USDm) 2011e 2012e 2013e
Revenue 52,893 54,769 56,224
Previous 52,617 54,346 55,698 Difference % 0.5% 0.8% 0.9% EBITDA 21,844 22,948 23,928 Previous 21,755 22,805 23,744 Difference % 0.4% 0.6% 0.8% Net profit 9,171 9,793 10,415 Previous 9,124 9,710 10,301 Difference % 0.5% 0.9% 1.1%
Note: All figures on an adjusted basis. Source: HSBC estimates
We value America Movil using a DCF approach
employing a WACC of 8.2% with a risk-free rate
of 3.5%, equity risk premium of 5.0%, country
risk premium of 1.0%, beta of 1.0, and debt-to-
total capital ratio of 30%. Our AMX.N ADR
target price is USD64.
Under our research model, for stocks without a
volatility indicator, the Neutral band is 5ppts
above and below our hurdle rate for Mexican
stocks of 9.5%, or 4.5-14.5% around the current
share price. Our target price of USD64 per ADR
implies a potential return of 12.7% which is
within the Neutral band; thus, we maintain our
Neutral rating.
Key upside risks to our Neutral ratings, in our
view, include synergy delivery above our
expectations and greater success of converged
fixed-mobile service offerings than we anticipate.
Key downside risks, we believe, include merger
synergies falling below those of the market, and
deteriorating trends at Telmex, which represents
around one-fifth of group sales.
AT&T: Maintain Neutral rating and USD30 target price
We reduce our forecasts for AT&T following the
loss of iPhone exclusivity and its fourth quarter

80
Telecoms, Media & Technology – Equity 16 February 2011
abc
results. We summarise the main changes in the
table below.
AT&T: Change in estimates
(USDm) 2011e 2012e 2013e
Revenue 124,847 126,302 128,943 Previous 127,041 129,076 132,243 Difference % -1.7% -2.1% -2.5% EBITDA 43,676 44,817 46,297 Previous 45,164 46,151 47,643 Difference % -3.3% -2.9% -2.8% Net profit 13,983 14,987 15,654 Previous 14,843 15,812 16,575 Difference % -5.8% -5.2% -5.6%
Note: All figures on an adjusted basis. Source: HSBC estimates
We value AT&T using a DCF approach
employing a WACC of 6.3% (from 6.7%
previously) with a risk-free rate of 3.5% (4%
previously), equity risk premium of 3.5%, beta of
1.1, and debt-to-total capital ratio of 30%.
The impact of the decrease in our forecasts on our
DCF-based valuation is broadly offset by a
reduction in the WACC, and hence we maintain
our target price for AT&T at USD30.
Under our research model, for stocks without a
volatility indicator, the Neutral band is 5ppts
above and below our hurdle rate for US stocks of
7.0% or 2.0-12.0% around the current share price.
Our USD30 target price implies a potential return
of 5.4%, which is within the Neutral band; thus,
we reiterate our Neutral rating on AT&T shares.
Key downside risks, in our view, include
continued weakness in wireline revenues, and
AT&T taking longer than anticipated or being
unable to expand its wireless service margins
from current levels in absence of iPhone
exclusivity. Key upside risks, we believe, include
continued high share of net additions despite
Verizon’s iPhone launch and wireless ARPU
growth.
Belgacom: Maintain Neutral rating and EUR30 target price
We have a Neutral rating on Belgacom with a
DCF-based target price of EUR30. In our DCF-
based valuation, we use a risk-free rate of 3.5%
(from 4.0% earlier), a market risk premium of
5.0% (from 4.5% earlier) and a beta of 1.1 to
derive our target price. Under our research model,
for stocks without a volatility indicator, the
Neutral band is five percentage points above and
below our hurdle rate for Europe-ex-UK stocks of
8.5%, or 3.5-13.5% above the current share price.
Our 12-month target price implies a potential
return of 11%, which is within the Neutral band
and hence we reiterate our Neutral rating.
The key upside risk, in our view, is rapid
macroeconomic recovery leading to higher-than-
expected revenue and EBITDA growth; the key
downside risk is a price war in mobile triggered
by the introduction of handset subsidies, leading
to a higher-than-expected deterioration in
margins.
BT: Maintain Neutral rating, raise target price to 200p (from 153p)
We lift our target price to 200p (from 153p), driven
partly by the changes in our estimates post Q3
results and partly by the reduction in our contingent
liability assumption for pension deficit – an
intrinsically volatile number – to GBP3.0bn (from
GBP5.7bn earlier) to reflect the changes in the
pension indexation to CPI from RPI. The
accompanying table summarises the changes to our
forecasts. Our WACC assumption of 8.0% is
unchanged (cost of equity of 8.7%, cost of debt of
8.4% and a debt-to-capital ratio of 25%).

81
Telecoms, Media & Technology – Equity 16 February 2011
abc
BT: Change in estimates
GBPm FY 2011e FY 2012e FY 2013e
Revenue Old 20,284 20,090 20,112 New 20,173 20,067 20,083 % change -0.5% -0.1% -0.1% EBITDA reported
Old 5,433 5,645 5,791 New 5,620 5,813 5,974 % change 3.4% 3.0% 3.2% EPS reported (p) Old 14.7 17.9 20.2 New 18.2 20.6 23.1 % change 23.9% 15.2% 14.2%
Source: HSBC estimates
Under our research model, for stocks without a
volatility indicator, the Neutral band is five
percentage points above and below our hurdle rate
for UK stocks of 7.5%, or 2.5-12.5% around the
current share price. Our target price of 200p
implies a potential return of 7.9%, which is within
the Neutral band; therefore, we reiterate our
Neutral rating on the stock.
A primary risk – both upside and downside – to
our Neutral stance relates to the triennial pension
fund review. BT has agreed to payments of
GBP525m into the pension fund for the next three
years and committed to further payments
increasing at 3% CAGR for the next 17 years.
However, the Pensions Regulator has expressed
its disquiet at this approach, and is presumably
concerned that this time frame is simply overlong.
Additional risks to the upside include the potential
for BT to beat expectations on its cost savings.
Additional risks to the downside include any fresh
problems emerging within Global Services as a
result of the UK government’s austerity measures.
Bezeq: Maintain Overweight rating and target price of ILS11.6
We maintain our Overweight rating on Bezeq
with a target price of ILS 11.6 per share. Our DCF
valuation and target price are based on a cost of
equity of 11%, incorporating a risk-free rate of
5.5% (based on long-term bond yield) and equity
risk premium of 5.5% and a beta of 0.8.
Downside risks, in our view, include negative
regulation that will support alternative operators
but not provide similar relief to Bezeq; launch of a
new MNO with regulatory protection (ie sub
pricing for national roaming); IEC moving to
install fibre network in selected regions within
Israel, offering third parties an alternative to
Bezeq’s transmission services.
DT: Maintain Underweight rating and EUR9.5 target price
We use a DCF methodology to arrive at our one-
year forward target price of EUR9.5. We have
assumed a risk-free rate of 3.5%, an equity-risk
premium of 5.0%, a beta of 1.1 and terminal growth
rate of -1%). We have adjusted our numbers to
reflect the Q4 currency movements and rolled
forward the valuation to year-end 2011e, leading
overall to an unchanged target price of EUR9.5.
Our target price implies a potential return of
-4.4%, which falls below the HSBC Neutral band
of 3.5% to 13.5% for European non-volatile
stocks. Thus, we reiterate our Underweight rating
on the stock.
DT: Change in estimates
EURm Dec-10 Dec-11 Dec-12
New Revenue HSBC 62,317 60,787 60,630 EBITDA company 19,555 19,059 19,098 EBITDA HSBC 18,550 18,054 18,093 EPS HSBC (EUR) 0.69 0.68 0.75 Old Revenue HSBC 62,677 60,747 60,241 EBITDA company 19,892 19,429 19,388 EBITDA HSBC 18,887 18,424 18,383 EPS HSBC (EUR) 0.73 0.73 0.79 Change Revenue HSBC -0.6% 0.1% 0.6% EBITDA company -1.7% -1.9% -1.5% EBITDA HSBC -1.8% -2.0% -1.6% EPS HSBC -5.5% -7.0% -5.8%
Source: HSBC estimates

82
Telecoms, Media & Technology – Equity 16 February 2011
abc
Key upside risks include a quick and sustainable
turnaround of T-Mobile US, a strong USD and
macro recovery in Eastern Europe.
eAccess: Maintain Overweight (V) rating, cut target price to JPY79,000 (from JPY88,000)
We continue to apply a multiple of 9x to March
2012e EPS to derive our target price for eAccess,
based on average trading history. Applied to our
new March 2012 EPS estimate of JPY8,732, this
yields a new target price of JPY79,000, down
10% from JPY88,000 previously.
Under our research model, the Neutral band for
volatile Japanese stocks is defined as the hurdle
rate of 7% for Japan, plus or minus 10ppt, which
translates into -3% to 17% relative to the current
share price. Our new target price of JPY79,000
for eAccess shares implies a potential return of
54.9% (including prospective dividend yield of
1.2%). We therefore maintain our Overweight (V)
rating on eAccess stock.
The principal downside risks to our rating are as
follows:
Lower profitability than expected in the
wireless broadband business, driven by an
increase in SACs (we believe the company’s
current SAC guidance of JPY30,000 is
conservative)
Greater-than-expected churn in the ADSL
business, possibly caused by increased
discounting by fibre broadband suppliers
Increased competition in the wireless
broadband business – from UQ
Communications, in particular – causing
erosion of margins from cheaper pricing
Forecast changes
We reduce our FY March 2011 estimates
substantially, reflecting lower profitability in the
quarters ending September and December 2010.
This is a result of eMobile handsets and the
network upgrade to 42Mbps being delayed – we
expect strong sales in the final quarter, and in 2011
generally. Our estimates vs consensus and our
previous forecasts are outlined in the table below.
eAccess: Change to estimates
JPYbn Mar-11 Mar-12 Mar-13
Consensus Sales 189.8 228.4 252.0 EBITDA 57.4 76.8 88.4 EBIT 24.8 36.7 46.8 Net Income 9.5 20.7 27.4 EPS 2,949 5,880 8,227 HSBC new estimates Sales 183.5 219.0 253.5 EBITDA 57.4 83.2 91.2 EBIT 24.1 45.4 55.9 Net Income 8.5 30.2 41.0 EPS 2,856 8,732 11,846 HSBC old estimates Sales 186.1 228.6 252.0 EBITDA 58.5 83.7 99.7 EBIT 26.9 45.7 62.4 Net Income 11.1 33.8 51.0 EPS 3,756 9,757 14,743 HSBC vs Consensus Sales -3.3% -4.1% 0.6% EBITDA -0.1% 8.3% 3.2% EBIT -2.7% 23.7% 19.4% Net Income -10.6% 46.0% 49.6% HSBC vs previous estimates Sales -1.4% -4.2% 0.6% EBITDA -1.9% -0.6% -8.5% EBIT -10.4% -0.6% -10.4% Net Income -23.9% -10.5% -19.7% EPS -23.9% -10.5% -19.7%
Source: HSBC estimates Ericsson: Maintain Overweight rating and SEK95 target price
We value Ericsson using a DCF approach. We
employ a WACC of 9.1% based on a risk-free rate
of 3.5%, equity risk premium of 5.5%, beta of
1.25 and debt to capital ratio of 20%. Our target
price is SEK95, implying a 15.7% potential return
based on the SEK82.1 closing price of 11
February; we have an Overweight rating on the
stock. Ericsson’s current PE is 12.5x 2011
(HSBCe), which compares with a historical range
(2005-10) of 8.5-17.5x; our target price of SEK95
implies a PE of 14.5x.

83
Telecoms, Media & Technology – Equity 16 February 2011
abc
Downside risks to our Overweight rating in the
shorter term include continued softness in
network orders as these tend to lag the economic
cycle. Price pressure from Chinese rivals Huawei
and ZTE and a trend toward network sharing
among mobile operators may both adversely
affect Ericsson’s revenues.
France Telecom: Maintain Overweight rating and EUR21 target price
We have cut 2010 net profit forecasts by 16%
mainly due to the reclassification to net income of
the Orange JV in the UK. Other changes in our
estimates are immaterial.
France Telecom: Change in estimates
EURm 2010e 2011e 2012e
Revenue New 45341 45439 45165 Old 44839 44920 44585 difference % 1.1% 1.2% 1.3% EBITDA New 15608 15504 15460 Old 15524 15682 15392 difference % 0.5% -1.1% 0.4% Net profit New 4604 4725 4842 Old 5478 4696 4693 difference % -16.0% 0.6% 3.2%
Source: HSBC estimates
We value France Telecom using a DCF-based sum-
of-the-parts (SOTP) methodology to arrive at our
target price of EUR21. For our SOTP DCF, we
assume a discount rate of 8.5% for France, the UK,
Spain and the Enterprise business, 11% for Poland
and 9.2% for the Rest of the World division.
Under our research model, for French stocks
without a volatility indicator, the Neutral band is
five percentage points above and below our hurdle
rate of 8.5%, or 3.5-13.5% above the current share
price. Our France Telecom target price of EUR21
implies a potential return of 29.3%, which is
above the Neutral band; therefore, we reiterate our
Overweight rating on the stock.
Key downside risks in our view include:
Higher competition in the French market,
although Iliad’s entry into the mobile market
has been impacting the share price already, in
our view
A significant M&A transaction would
probably weigh on FT shares as investors
would fear dividend cuts and execution risks,
although this is not our view and the company
has not stated that it has any such plans
Execution risks in the UK during the
integration process
KPN: Maintain Overweight rating and target price of EUR15
After the Q4 2010 results, we have fine-tuned our
forecasts, cutting revenue forecasts by 2% to 3%
and EBITDA forecasts by 1% to 2% in the
medium term (see table below).
We have used a DCF valuation to derive our 12-
month forward target price of EUR15, which
implies a potential return of c27%. We have
assumed a risk-free rate of 3.5%, a market risk
premium of 5.0%, and asset beta of 1.1. Under our
research model, for stocks without a volatility
indicator, the Neutral band is five percentage
points above and below the hurdle rate for Europe
ex-UK stocks of 8.5% (3.5-13.5%). We reiterate
our Overweight rating.
KPN: Change in estimates
EURm 2011e 2012e 2013e
Revenues Old 13,633 13,938 14,254 New 13,423 13,579 13,782 % change -2% -3% -3% EBITDA Old 5,460 5,561 5,669 New 5,472 5,519 5,557 % change 0% -1% -2%
Source: HSBC estimates

84
Telecoms, Media & Technology – Equity 16 February 2011
abc
Key risks to our Overweight rating include:
E-Plus delivering lower EBITDA margin than
we expect or losing market share to competition
More aggressive price-based competition by
Dutch cable that could hit KPN’s broadband
recovery
KT Corp: Maintain Overweight rating and KRW60,000 target price
We maintain our Overweight rating on KT Corp
with a PE-based one-year forward target price of
KRW60,000. We continue to apply a multiple of
8x forward earnings, based on average trading
history.
Under our research model, for Korean stocks
without a volatility indicator, the Neutral band is
five percentage points above and below the hurdle
rate of 10% (ie 5-15%). Applying a multiple of 8x
to our 2011 EPS estimate of KRW7,441 yields an
unchanged target price of KRW60,000. This
implies a 52% potential return including the 6.3%
dividend yield in 2011e. We therefore maintain
our Overweight rating on KT stock.
The key downside risks include:
Action by the KCC that mandates the
provision of free voice minutes in smartphone
tariffs
More competition than anticipated in wireline
from LG U+ and SK Broadband and in the
wireless business from SKT
Mobily (Etihad Etisalat): Maintain Overweight rating, raise target price to SAR71 from SAR69
We continue to use a three-stage DCF model to
value Mobily. We have adjusted our WACC to
10.1% compared with 10% earlier. Our revised
WACC is a function of cost of equity of 13%
(risk-free rate of 3.5%, market risk premium of
9.5%, including inflation differential of 3.5% in
Saudi Arabia, equity beta of 1.0) and cost of debt
of 3.3% pre tax, using a debt-to-asset ratio of 30%
We have revised our earnings estimates upwards
by 11.9% in 2011 and 11.6% in 2012 to
incorporate strong pricing power for mobile
operators in Saudi Arabia in the lucrative
broadband business. Our base case estimates
suggest data as a percentage of total revenues
would go up from 18% in 2010 to around 29% by
2012, driven by strong subscriber growth along
with pricing power for telecom companies in
Saudi Arabia. Our capex estimates also go up to
incorporate increased network expenses on
account of high data usage.
Based on our revised WACC assumptions and
changes in estimates, our target price rises to
SAR71 from SAR69. Under our research model,
for Saudi Arabia stocks without a volatility
indicator, the Neutral band is 5ppt above/below
the hurdle rate of 9.5%. Our new target price
implies a potential return of 29.7% from the
current price. As this is above the Neutral band
for non-volatile Saudi stocks of 4.5-14.5% under
the HSBC research model, we maintain our
Overweight rating on the stock.
The key downside risks to our rating include:
(1) an aggressive price war with Zain KSA that
erodes the profitability of mobile operators in
Saudi Arabia; (2) STC’s aggressive build-up of
fixed network negatively affecting mobile
broadband growth in the Kingdom; and (3) a
deterioration in the broader Saudi market with an
adverse impact on the stock price, as Mobily is a
growth story.

85
Telecoms, Media & Technology – Equity 16 February 2011
abc
Mobily: Change to estimates
SARm 2011e 2012e 2013e
Old estimates Revenues 17,021 17,896 18,377 EBITDA 6,595 6,851 7,071 EBITDA margin 38.7% 38.3% 38.5% Capex -3,278 -3,221 -3,014 Net Profit 4,262 4,402 4,544 New estimates Revenues 17,930 18,645 19,116 EBITDA 7,148 7,420 7,599 EBITDA margin 39.9% 39.8% 39.7% Capex -3,454 -3,580 -3,319 Net Profit 4,768 4,912 4,986 Change Revenues 5.3% 4.2% 4.0% EBITDA 8.4% 8.3% 7.5% EBITDA Margin (bp) 112 151 127 Capex 5.4% 11.1% 10.1% Net Profit 11.9% 11.6% 9.7%
Source: HSBC estimates
MTN: Maintain Overweight rating and target price of ZAR148
We value MTN on a SOTP basis using country-
specific cost of capitals ranging from 14.2% to
20.2%. Our SOTP valuation and target price are
based on a cost of equity of 14.7%, incorporating
a risk-free rate of 9.2%, equity risk premium of
5.5% and a beta of 1.0.
Under our research model, for South African
stocks without a volatility indicator, the Neutral
band is 5ppt above/below the hurdle rate of 10%.
This translates into a Neutral band of 5-15%
around the current share price. Our target price
implies a potential return of c18%, which is above
the Neutral band; hence, we reiterate our
Overweight rating.
M&A activity is a significant risk to MTN’s
valuation, in our opinion. Other key potential
downside risks include political and economic
instability in MTN’s areas of operation,
particularly Iran, Syria and Sudan, and operational
and regulatory risks across its operations. A
recession in global commodity prices could
weaken demand from the economies where it
operates, most of which are commodity-driven.
The entry of new operators in many markets could
potentially threaten its ARPU and margins in
these markets, which can significantly affect its
valuation. Fluctuations in ZAR and local
currencies against USD and relative movements
against each other could have a significant impact
on the valuation.
MTS: Maintain Overweight rating and target price of USD29
Our DCF valuation and target price are based on
an unchanged cost of equity of 11.5%. We use the
one-year average US 10-year treasury bond yield
(currently 3.5%) as the risk-free rate (we
previously used 6.0%). We arrive at a market risk
premium of 8% (was 5.5%), calculated using the
relative USD volatility of the local equity market
to the US equity market (time-weighted average
over the past 10 years). We use a beta of 1.0
(unchanged). Currently we assume no goodwill
write-off and no synergies from the Comstar
merger in our estimates.
Under our research model, for stocks without a
volatility indicator, the Neutral band is 5% above
and below the hurdle rate for Russian stocks of
11.5%. This translates into a Neutral band of 6.5-
16.5% around the current share price. Our target
price implies a potential return of c47%, which is
above the Neutral band; hence, we reiterate our
Overweight rating.
Downside risks, in our view, are execution risks
with potential difficulties in the integration of
Comstar with MTS and an unsuccessful bid for a
3G licence in Ukraine. RUB fluctuation versus the
USD continues to have an impact on the ADR
price and is, in our view, a significant risk. A
collapse in crude oil prices would have a negative
impact on the Russian currency and
unemployment level as well as private
consumption demand.
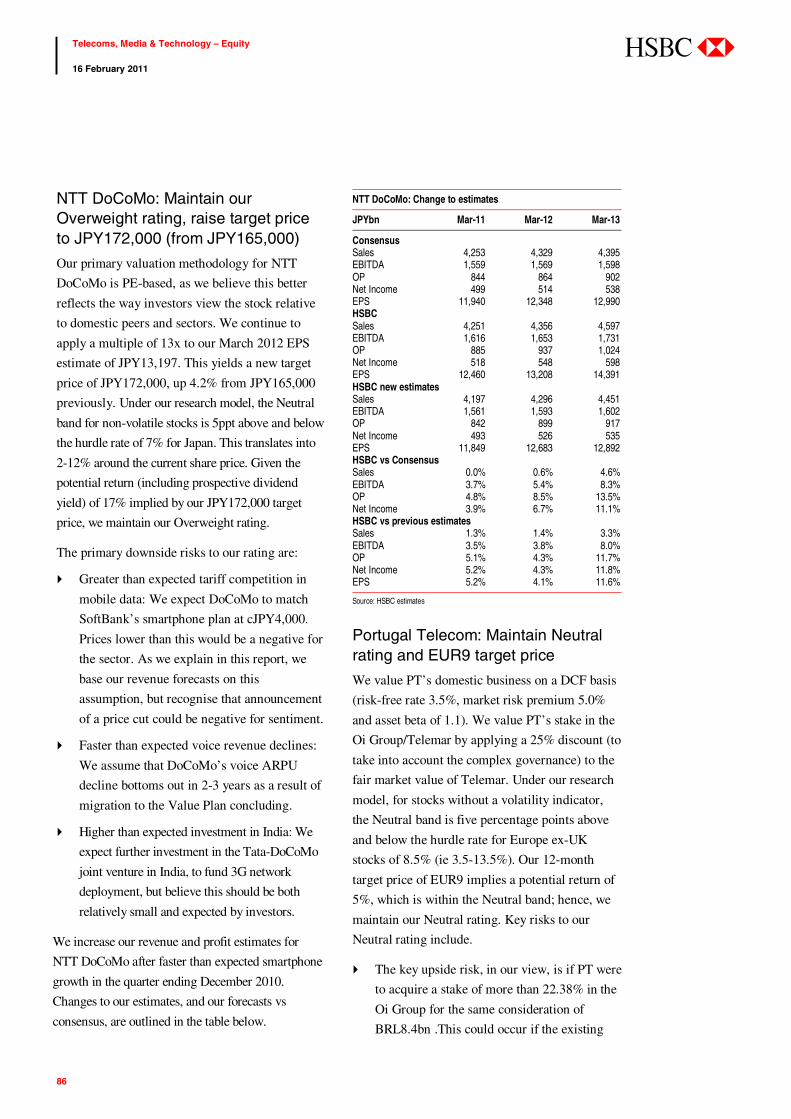
86
Telecoms, Media & Technology – Equity 16 February 2011
abc
NTT DoCoMo: Maintain our Overweight rating, raise target price to JPY172,000 (from JPY165,000)
Our primary valuation methodology for NTT
DoCoMo is PE-based, as we believe this better
reflects the way investors view the stock relative
to domestic peers and sectors. We continue to
apply a multiple of 13x to our March 2012 EPS
estimate of JPY13,197. This yields a new target
price of JPY172,000, up 4.2% from JPY165,000
previously. Under our research model, the Neutral
band for non-volatile stocks is 5ppt above and below
the hurdle rate of 7% for Japan. This translates into
2-12% around the current share price. Given the
potential return (including prospective dividend
yield) of 17% implied by our JPY172,000 target
price, we maintain our Overweight rating.
The primary downside risks to our rating are:
Greater than expected tariff competition in
mobile data: We expect DoCoMo to match
SoftBank’s smartphone plan at cJPY4,000.
Prices lower than this would be a negative for
the sector. As we explain in this report, we
base our revenue forecasts on this
assumption, but recognise that announcement
of a price cut could be negative for sentiment.
Faster than expected voice revenue declines:
We assume that DoCoMo’s voice ARPU
decline bottoms out in 2-3 years as a result of
migration to the Value Plan concluding.
Higher than expected investment in India: We
expect further investment in the Tata-DoCoMo
joint venture in India, to fund 3G network
deployment, but believe this should be both
relatively small and expected by investors.
We increase our revenue and profit estimates for
NTT DoCoMo after faster than expected smartphone
growth in the quarter ending December 2010.
Changes to our estimates, and our forecasts vs
consensus, are outlined in the table below.
NTT DoCoMo: Change to estimates
JPYbn Mar-11 Mar-12 Mar-13
Consensus Sales 4,253 4,329 4,395 EBITDA 1,559 1,569 1,598 OP 844 864 902 Net Income 499 514 538 EPS 11,940 12,348 12,990 HSBC Sales 4,251 4,356 4,597 EBITDA 1,616 1,653 1,731 OP 885 937 1,024 Net Income 518 548 598 EPS 12,460 13,208 14,391 HSBC new estimates Sales 4,197 4,296 4,451 EBITDA 1,561 1,593 1,602 OP 842 899 917 Net Income 493 526 535 EPS 11,849 12,683 12,892 HSBC vs Consensus Sales 0.0% 0.6% 4.6% EBITDA 3.7% 5.4% 8.3% OP 4.8% 8.5% 13.5% Net Income 3.9% 6.7% 11.1% HSBC vs previous estimates Sales 1.3% 1.4% 3.3% EBITDA 3.5% 3.8% 8.0% OP 5.1% 4.3% 11.7% Net Income 5.2% 4.3% 11.8% EPS 5.2% 4.1% 11.6%
Source: HSBC estimates
Portugal Telecom: Maintain Neutral rating and EUR9 target price
We value PT’s domestic business on a DCF basis
(risk-free rate 3.5%, market risk premium 5.0%
and asset beta of 1.1). We value PT’s stake in the
Oi Group/Telemar by applying a 25% discount (to
take into account the complex governance) to the
fair market value of Telemar. Under our research
model, for stocks without a volatility indicator,
the Neutral band is five percentage points above
and below the hurdle rate for Europe ex-UK
stocks of 8.5% (ie 3.5-13.5%). Our 12-month
target price of EUR9 implies a potential return of
5%, which is within the Neutral band; hence, we
maintain our Neutral rating. Key risks to our
Neutral rating include.
The key upside risk, in our view, is if PT were
to acquire a stake of more than 22.38% in the
Oi Group for the same consideration of
BRL8.4bn .This could occur if the existing

87
Telecoms, Media & Technology – Equity 16 February 2011
abc
shareholders of TNL and TMAR do not fully
subscribe to the rights issues
The key downside risk, in our view, is if the
macroeconomic condition were to become
tougher, affecting the domestic business more
than expected
Saudi Telecom Company (STC): Maintain Overweight rating, cut target price to SAR48 (from SAR49)
We continue to use a three-stage DCF model to
value STC. We now use a WACC of 10.7%
compared with 10.5% earlier. We use the long-
term EBITDA contribution of 60% from domestic
operations to calculate the weighted average cost
of equity for STC. International COE is taken to
be 15%. For domestic operations, we use a risk
free rate of 3.5%, market risk premium of 9.5%
including inflation differential of 3.5% in Saudi
Arabia and equity beta of 1.0. Our weighted cost
of equity for STC is 13.8%. Using a long-term
debt-to-equity ratio of 30%:70%, we obtain a
WACC of 10.7%. Cost of debt is unchanged at
3.8% for the group.
We have revised our earnings estimates upwards
by 5% in 2011 and 8.2% in 2012 to incorporate
strong pricing power for mobile operators in
Saudi Arabia in the lucrative broadband business.
Our capex estimates also go up by 13.9% in 2011
and 16.7% in 2012 to incorporate increased
network expenses on account of high data usage
as the migration to NGN continues for STC.
Based on our revised WACC assumptions along
with changes in estimates, our target price falls to
SAR48 from SAR49. Under our research model,
for Saudi Arabia stocks without a volatility
indicator, the Neutral band is 5ppt above/below
the hurdle rate of 9.5%. Our new target price
implies a potential return of 19% from the current
price. As this is above the Neutral band for non-
volatile Saudi stocks of 4.5-14.5% under the
HSBC research model, we maintain our
Overweight rating on the stock.
The key downside risks to our rating include: 1)
increased FX losses from international operations;
2) Zain KSA getting into a price war in Saudi,
leading to erosion of ARPUs for all mobile
operators; 3) overpayment for international
acquisitions; 4) delay in NGN implementation,
and 5) higher-than-expected capex in international
operations such as those in India and Indonesia. Sprint Nextel: Maintain Neutral (V) rating and USD5 target price
We reduce our profit estimates for Sprint Nextel
following its fourth quarter results. We summarise
the main changes in the table below.
We value Sprint Nextel using a DCF approach
employing a WACC of 8.1% (down from 8.4%
previously) with a risk-free rate of 3.5% (4%
previously), equity risk premium of 3.5%, beta of
1.5, and debt-to-total capital ratio of 30%.
STC: Change in estimates
SARm 2011e 2012e 2013e
Old estimates Total Revenue 52,026 52,582 53,700 EBITDA 19,872 20,099 20,530 EBITDA margin 38.2% 38.2% 38.2% Capex -9,478 -8,607 -8,124 Net Profit 8,723 8,767 9,154
New Estimates
Total Revenue 54,477 54,975 55,796 EBITDA 20,631 21,104 21,479 EBITDA margin 37.9% 38.4% 38.5% Capex -10,791 -10,043 -9,178 Net Profit 9,157 9,484 9,626
Variation
Total Revenue 4.7% 4.6% 3.9% EBITDA 3.8% 5.0% 4.6% EBITDA margin (bp) -33 16 26 Capex 13.9% 16.7% 13.0% Net Profit 5.0% 8.2% 5.1%
Source: HSBC estimates

88
Telecoms, Media & Technology – Equity 16 February 2011
abc
Sprint Nextel: Change in estimates
USDm 2011e 2012e 2013e
Revenue 32,348 32,822 33,553 Previous 32,250 32,363 32,725 Difference % 0.3% 1.4% 2.5% EBITDA 5,917 6,188 6,367 Previous 6,140 6,327 6,482 Difference % -3.6% -2.2% -1.8% Net profit -1,069 -14 492 Previous -335 572 1,180 Difference % NM NM -58.3%
Note: All figures on an adjusted basis. Source: HSBC estimates The impact of a decrease in our profit forecasts on
our DCF valuation of Sprint Nextel is broadly
offset by a reduction in the WACC. Accordingly,
we maintain our target price for Sprint Nextel at
USD5.
Under our research model, for stocks with a
volatility indicator, the Neutral band is 10ppts
above and below our hurdle rate for US stocks
of7.0% or -3% to 17.0% around the current share
price. Our target price of USD5 indicates a
potential return of 8.7%, which is within the
Neutral band; thus, we reiterate our Neutral (V)
rating on Sprint Nextel shares.
Downside risks, we believe, include operational
performance below consensus expectations.
Upside risks that we see include potential
consolidation the US wireless sub-sector.
Swisscom: Maintain Overweight rating and CHF470 target price
We have marginally revised our forecasts,
although this has no material impact on valuation.
We have an Overweight rating on Swisscom with
a DCF-based target price of CHF470. In our DCF,
we assume a risk-free rate of 3.5% (from 4.0%
earlier), a market risk premium of 4.0% (from
4.5% earlier) and beta of 1.1.
Swisscom: Change to estimates
CHFm 2010e 2011e 2012e
Revenue New 12,008 11,951 12,243 Old 11,994 11,987 12,254 change 0% 0% 0% EBITDA New 4,696 4,741 4,840 Old 4,692 4,771 4,858 change 0% -1% 0% Net profit New 1,898 2,018 2,093 Old 1,897 2,044 2,116 change 0% -1% -1%
Source: HSBC estimates
The key downside risks to our Overweight rating
on Swisscom are: a worsening in competition
conditions in Switzerland for both fixed line and
mobile owing to lower tariffs in either retail or
wholesale (ULL pricing); Swisscom continuing to
be conservative with its dividend payout in FY
2010; and a worse-than-expected tax investigation
outcome for Fastweb.
TDC: Maintain Overweight rating and DKK58 target price TDC: Change to estimates
FY 2011e FY2012e FY2013e
New DKKm DKKm DKKm Revenue reported 26,143 26,200 26,307EBITDA reported 9,794 9,873 9,945Operating profit reported 4,572 4,796 5,000Old Revenue reported 26,220 26,393 26,594EBITDA reported 9,925 10,082 10,184Operating profit reported 4,624 4,923 5,152Change Revenue reported -0.3% -0.7% -1.1%EBITDA reported -1.3% -2.1% -2.3%Operating profit reported -1.1% -2.6% -2.9%
Source: HSBC estimates
We have slightly revised down our estimates to
reflect Q4 2010 reported numbers. We use two
separate methods to calculate an equity valuation
range for TDC: first, a DCF approach; and
second, a comparison to peer group EV/EBITDA
multiples and dividend yields. Our target is the
mid point of both approaches. We believe long-
term a pure DCF-based approach is legitimate.
However, as TDC just recently returned to the

89
Telecoms, Media & Technology – Equity 16 February 2011
abc
market, it will take time for investors to
reacquaint themselves with the stock. During that
process, a balanced approach of DCF and peer
multiple valuation seems appropriate to us.
We calculate a target price of DKK58 as the mid
point of our DCF and peer multiple valuations.
Our DCF assumes a WACC of 7.2% (RFR 3.5%,
MRP 4.5%, beta 1.1) and a (cautious) 0% terminal
growth rate.
Under our research model, for Danish stocks
without a volatility indicator, the Neutral band is
five percentage points above and below the hurdle
rate of 8.0% (3.0-13.0%). Our target price implies
a potential return of 25%; we maintain our
Overweight rating.
As for all incumbents, regulation is a significant
source of downside risk for TDC, and there is
specific concern that the introduction of a
wholesale bitstream broadband product over
TDC’s cable network could undermine the
incumbent’s access network advantage. The
utility companies’ fibre ambitions also represent a
continued threat. Price erosion in traditional
products could more than offset growth from
newer areas such as quad-play.
Tele2: Maintain Neutral rating, raise target price to SEK160 (from SEK155)
We value Tele2 based on HSBC’s DCF
methodology (assumptions: risk-free rate 3.5%,
market premium 5.5%, debt-to-capital ratio 25%
and a beta of 1). The upward revision of our target
price to SEK160 from SEK155 reflects a slight
increase to our revenue estimates (primarily due
to higher growth expectations for Swedish mobile
and a small increase to subscriber numbers for
Russian mobile) and a reduction to our WACC
assumption to 8.3% from 8.6%. On a DCF basis
we arrive at one-year forward target price of
SEK160.
In our current valuation methodology we assume
a debt-to-capital ratio of about 25%. Please note
our target price of SEK160 includes the
extraordinary dividend of SEK27 proposed by
Tele2 for FY 2010e; post adjusting for this, our
implied target price would be SEK137.
The potential return from the current price of
SEK148.7 implied by our SEK160 target price is
8%, which is within the 4% to 14% Neutral range
for non-volatile Swedish (ex-UK) stocks under
HSBC’s research model; thus we retain our
Neutral rating on Tele2.
Better than expected margin performance from
the Swedish mobile division, where Tele2 has
been focusing on gaining higher share of post paid
subscribers could be a potential positive driver for
the stock. Key downside risks include a failure to
maintain the Russian growth momentum given the
lack of 3G spectrum and a collapse of cash
generation of its arbitrage businesses, in our view.
Telecom Italia: Maintain Underweight rating and EUR1.05 target price
We are consolidating Telecom Argentina from Q4
2010 following the approvals by the Argentine
regulators that have resulted in some significant
changes in our forecasts. Considering that the
competition has worsened in the domestic fixed
and domestic mobile continues to underperform
the market, we are cutting our domestic forecasts
Tele2: Change to estimates
SEKm FY 2011e FY2012e FY2013e
New Revenue reported 40,769 42,043 42,700 EBITDA reported 10,672 11,653 12,321 Operating profit reported 7,054 7,799 8,263 Old Revenue reported 39,774 40,246 40,687 EBITDA reported 11,046 11,725 12,401 Operating profit reported 7,662 7,906 8,358 Change Revenue reported 3% 4% 5% EBITDA reported -3% -1% -1% Operating profit reported -8% -1% -1%
Source: HSBC estimates

90
Telecoms, Media & Technology – Equity 16 February 2011
abc
downwards and this is also reflected in the cutting
of our EPS forecasts.
We have used a DCF valuation to derive our one-
year forward target price. We assume a risk-free
rate of 3.5%, a market risk premium of 5.0% and
asset beta of 1.1 to arrive at an unchanged
EUR1.05 per share.
Under our research model, for stocks without a
volatility indicator, the Neutral band is five
percentage points above and below the hurdle rate
for Europe ex-UK stocks of 8.5% (3.5-13.5%).
The potential return implied in our valuation of
0% is below the Neutral band; we therefore
reiterate our Underweight rating .
Telecom Italia: Change to estimates
EURm 2011e 2012e 2013e
Revenues Old 26,803 26,732 26,690 New 29,695 29,927 30,067 % change 11% 12% 13% EBITDA Old 11,335 11,233 11,180 New 12,221 12,159 12,142 % change 8% 8% 9% EBIT Old 5,934 6,132 6,367 New 6,371 6,661 6,921 % change 7% 9% 9% EPS Old 0.12 0.13 0.14 New 0.11 0.13 0.14 % change -4% -1% 0%
Source: HSBC estimates The key upside risk to our rating is a rebound in the
economy, which could lead to lower revenue
pressure in Italy. We estimate a 1-3% domestic
revenue decline in 2011 and 2012 after a 7%
revenue decline in 2010; an improvement in the top
line would also be an upside risk to our rating.
We are factoring in aggressive MTR cuts beyond
2011 to reach EUR4c in 2012e and EUR2c in
2013e. More benign MTR cuts would represent
upside to our rating.
Telefonica: Maintain Overweight rating and target price of EUR22
We maintain our Overweight rating on TEF and
our DCF-based one-year forward target price of
EUR22. We have assumed a risk-free rate of
3.5%, an equity risk premium of 5.0% and asset
beta of 1.1. Under our research model, for stocks
without a volatility indicator, the Neutral band is
five percentage points above and below the hurdle
rate for Europe ex-UK stocks of 8.5% (ie 3.5-
13.5%). Our 12-month target price of EUR22
implies a potential return of 20%, which is above
the Neutral band; hence we maintain our
Overweight rating. Key risks to our Overweight
rating include:
A delayed recovery of the Spanish economy
(HSBC economist Madhur Jha forecasts GDP
growth of -0.4% in 2010 and +0.6% in 2011)
A currency crisis in LatAm that would hurt
the growth momentum
Telefonica or competitors introducing
irrational mobile data pricing in Spain, UK or
Germany, limiting the potential for restoring
revenue growth in Telefonica’s developed
markets
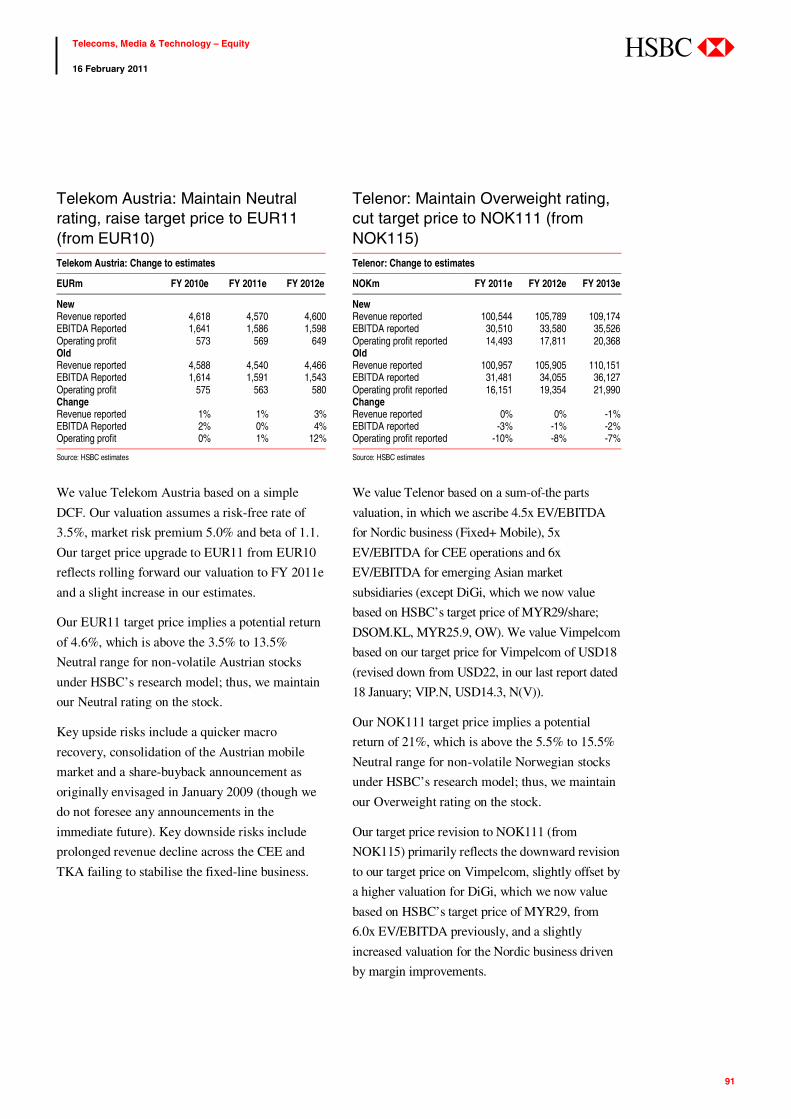
91
Telecoms, Media & Technology – Equity 16 February 2011
abc
Telekom Austria: Maintain Neutral rating, raise target price to EUR11 (from EUR10) Telekom Austria: Change to estimates
EURm FY 2010e FY 2011e FY 2012e
New Revenue reported 4,618 4,570 4,600EBITDA Reported 1,641 1,586 1,598Operating profit 573 569 649Old Revenue reported 4,588 4,540 4,466EBITDA Reported 1,614 1,591 1,543Operating profit 575 563 580Change Revenue reported 1% 1% 3%EBITDA Reported 2% 0% 4%Operating profit 0% 1% 12%
Source: HSBC estimates
We value Telekom Austria based on a simple
DCF. Our valuation assumes a risk-free rate of
3.5%, market risk premium 5.0% and beta of 1.1.
Our target price upgrade to EUR11 from EUR10
reflects rolling forward our valuation to FY 2011e
and a slight increase in our estimates.
Our EUR11 target price implies a potential return
of 4.6%, which is above the 3.5% to 13.5%
Neutral range for non-volatile Austrian stocks
under HSBC’s research model; thus, we maintain
our Neutral rating on the stock.
Key upside risks include a quicker macro
recovery, consolidation of the Austrian mobile
market and a share-buyback announcement as
originally envisaged in January 2009 (though we
do not foresee any announcements in the
immediate future). Key downside risks include
prolonged revenue decline across the CEE and
TKA failing to stabilise the fixed-line business.
Telenor: Maintain Overweight rating, cut target price to NOK111 (from NOK115) Telenor: Change to estimates
NOKm FY 2011e FY 2012e FY 2013e
New Revenue reported 100,544 105,789 109,174 EBITDA reported 30,510 33,580 35,526 Operating profit reported 14,493 17,811 20,368 Old Revenue reported 100,957 105,905 110,151 EBITDA reported 31,481 34,055 36,127 Operating profit reported 16,151 19,354 21,990 Change Revenue reported 0% 0% -1% EBITDA reported -3% -1% -2% Operating profit reported -10% -8% -7%
Source: HSBC estimates
We value Telenor based on a sum-of-the parts
valuation, in which we ascribe 4.5x EV/EBITDA
for Nordic business (Fixed+ Mobile), 5x
EV/EBITDA for CEE operations and 6x
EV/EBITDA for emerging Asian market
subsidiaries (except DiGi, which we now value
based on HSBC’s target price of MYR29/share;
DSOM.KL, MYR25.9, OW). We value Vimpelcom
based on our target price for Vimpelcom of USD18
(revised down from USD22, in our last report dated
18 January; VIP.N, USD14.3, N(V)).
Our NOK111 target price implies a potential
return of 21%, which is above the 5.5% to 15.5%
Neutral range for non-volatile Norwegian stocks
under HSBC’s research model; thus, we maintain
our Overweight rating on the stock.
Our target price revision to NOK111 (from
NOK115) primarily reflects the downward revision
to our target price on Vimpelcom, slightly offset by
a higher valuation for DiGi, which we now value
based on HSBC’s target price of MYR29, from
6.0x EV/EBITDA previously, and a slightly
increased valuation for the Nordic business driven
by margin improvements.

92
Telecoms, Media & Technology – Equity 16 February 2011
abc
The key downside risks to our valuation and
estimates, in our view, are: 1) higher than
expected cash outflow in the Indian operations
following the 2G licence debate; 2) failure to
maintain competitive shareholder remuneration;
and 3) loss of influence in Vimpelcom.
TeliaSonera: Maintain Neutral rating and SEK58 target price TeliaSonera: Change to estimates
SEKm FY 2011e FY 2012e FY 2013e
New Revenue reported 106,041 109,481 110,850 EBITDA reported 37,242 38,409 38,941 Operating profit reported 24,644 25,766 25,873 Old Revenue reported 107,473 108,740 109,814 EBITDA reported 37,625 38,604 39,120 Operating profit reported 25,443 26,111 26,396 Change Revenue reported -1% 1% 1% EBITDA reported -1% -1% 0% Operating profit reported -3% -1% -2%
Source: HSBC estimates
We use HSBC’s standard three-stage DCF to
value the core business and a peer multiples
approach to value the associates and minorities
not under our coverage. We assume a risk-free
rate of 3.5%, market risk premium of 5.5%, debt-
to-capital ratio of 25% and beta of 1.1. Our
valuation methodology yields an unchanged target
price of SEK58.
We have slightly revised our estimates to reflect
the currency movements. The potential return
from the current price of SEK54.5 implied by our
SEK58 target price is 6.4%, which is within the
4% to 14% Neutral range for non-volatile
Swedish stocks under HSBC’s research model;
thus, we retain our Neutral rating on TeliaSonera.
The key downside risks would be a significant fall
in domestic business margins or any obstacles to
an agreement with Alfa group to combine their
Telenor: Sum-of-the-parts valuation (NOKm)
Business Stake 2011e Sales
2011e EBITDA
Multiple(x)
Valuation method and ratio Valuation Val / share
% of EV OLD Val/share
Telenor Norway (fixed+mobile) 100.0% 25,816 10,311 4.5 EV/EBITDA 46,399 28 23% 28Telenor Denmark (fixed + mobile) 100.0% 7,268 1,840 4.5 EV/EBITDA 8,279 5 4% 5Telenor Sweden (fixed + mobile) 100.0% 9,978 2,534 4.5 EV/EBITDA 11,404 7 6% 7Nordic Operations 66,082 41 32% 39Pannon GSM - Hungary 100.0% 4,565 1,650 5.0 EV/EBITDA 8,249 5 4% 7ProMonte - Montenegro 100.0% 631 275 5.0 EV/EBITDA 1,373 1 1% 1Telenor Mobile-Serbia 100.0% 2,678 1,068 5.0 EV/EBITDA 5,341 3 3% 4Eastern European Operations 14,963 9 7% 12Telenor Pakistan 100.0% 4,946 1,519 6.0 EV/EBITDA 9,117 6 4% 6DTAC - Thailand 65.5% 14,852 5,173 6.0 EV/EBITDA 31,037 19 15% 19GrameenPhone 55.8% 7,027 3,432 6.0 EV/EBITDA 20,590 13 10% 13DiGi.Com - Malaysia 49.0% 10,808 4,744 9.1 HSBC TP of MYR29 42,981 26 21% 17Asian Operations 103,724 64 51% 50Broadcast 100.0% 9,083 2,322 7.2 EV/EBITDA 16,720 10 8% 10Value of core businesses 201,489 124 99% 117EDB-Ergo 27.2% Market Cap 765 0 0% 0Vimpelcom 39.6% 70,003 33,396 4.2 HSBC TP of USD18 54,127 33 26% 40Others Book value 844 1 0% 1Value of associates 55,735 34 27% 41Indian venture market value Cash burn until breakeven in 2014 -10,279 -6 -5% -6Value of minorities -42,656 -26 -21% -21Appraised EV 204,289 125 100% 131Net debt -19,276 -12 -13Pension deficit ( 2010a) -1,381 -1 -1Contingent liabilities (anticipated licences in Bangladesh and Thailand)
-3,000 -2 -2
Appraised equity value 180,632 111 115Number of shares 1,631 Appraised share price 111.0
Source: HSBC estimates
93
Telecoms, Media & Technology – Equity 16 February 2011
abc
holdings in Turkcell and MegaFon, and value
destructive acquisitions.
The main upside risks would be a decision that
could lead to higher shareholder returns,
stabilisation of the Swedish fixed business and
dividends from Megafon (which we believe has
limited visibility in the short term).
Telstra: Maintain Overweight rating and AUD3.40 target price
Given depressed earnings in FY 2011 and a lack
of medium-term visibility, we continue to use a
dividend discount methodology (DDM) to value
Telstra stock. We apply a cost of equity of 8.5%,
a beta of 1.1, and a terminal growth rate of 0%.
This yields our unchanged target price of
AUD3.40.
For stocks without a volatility indicator, the
Neutral band is five percentage points above and
below the hurdle rate for Australian stocks of
8.5%, or 3.5-13.5% around the current share
price. Our target price of AUD3.40 implies a
potential return of 16.8%. Therefore we maintain
our Overweight rating for Telstra stock.
The key downside risks to our rating are
NBN risk. With the passage of the June 2010
Heads of Agreement deal not finalised and
subject to change, regulatory risk remains.
A more hostile attitude to Telstra (including
more threats of break-up) would result in a
likely rejection of a deal by Telstra
shareholders, and further regulatory
uncertainty.
Operational risk. Our forecasts are in line
with consensus for FY June 2011, but
substantially ahead of consensus for FY June
2012 – based on our view of Telstra’s
sustainable competitive advantage in both its
wireline and wireless networks. A further
deterioration in the Australian competitive
environment may put this recovery at risk.
TIM Participações: Maintain Overweight rating and BRL7.50 target price
We value TIM Participações using a DCF
approach, employing a WACC of 10.1% with a
risk free rate of 3.5%, equity risk premium of 5.0%,
country risk premium of 3.0%, beta of 1.0, and
debt-to-total capital ratio of 30%. Our DCF-based
target price for TIM common shares (TCSL3.SA)
is BRL10.00.
To value the preference shares (TCSL4.SA), we
apply a 25% discount to our core valuation of TIM
common shares based on the historical trading
relationship. This results in a target price of
BRL7.50 for the preference shares.
We attain our TSU.N ADR target price of USD45
by converting our TCSL4.SA target price to USD
using HSBC’s 2011 average BRL/USD forecast of
1.67 at the time we last updated our target price on
16 November 2010. Under our research model, for stocks without a
volatility indicator, the Neutral band is 5ppts
above and below our hurdle rate for Brazilian
stocks of 11.5%, or 6.5-16.5% around the share
price.
Since our target prices imply potential returns
above the Neutral band (TCSL4.SA 24.6%,
TCSL3.SA 37.0%, TSU.N 22.0%), we rate all
TIM share classes Overweight.
Downside risks, we believe, include execution risks
surrounding the company’s turnaround plan.
Competition in the Brazilian mobile market remains
high, and although we believe that it has moderated
somewhat, an uptick remains a risk to TIM.
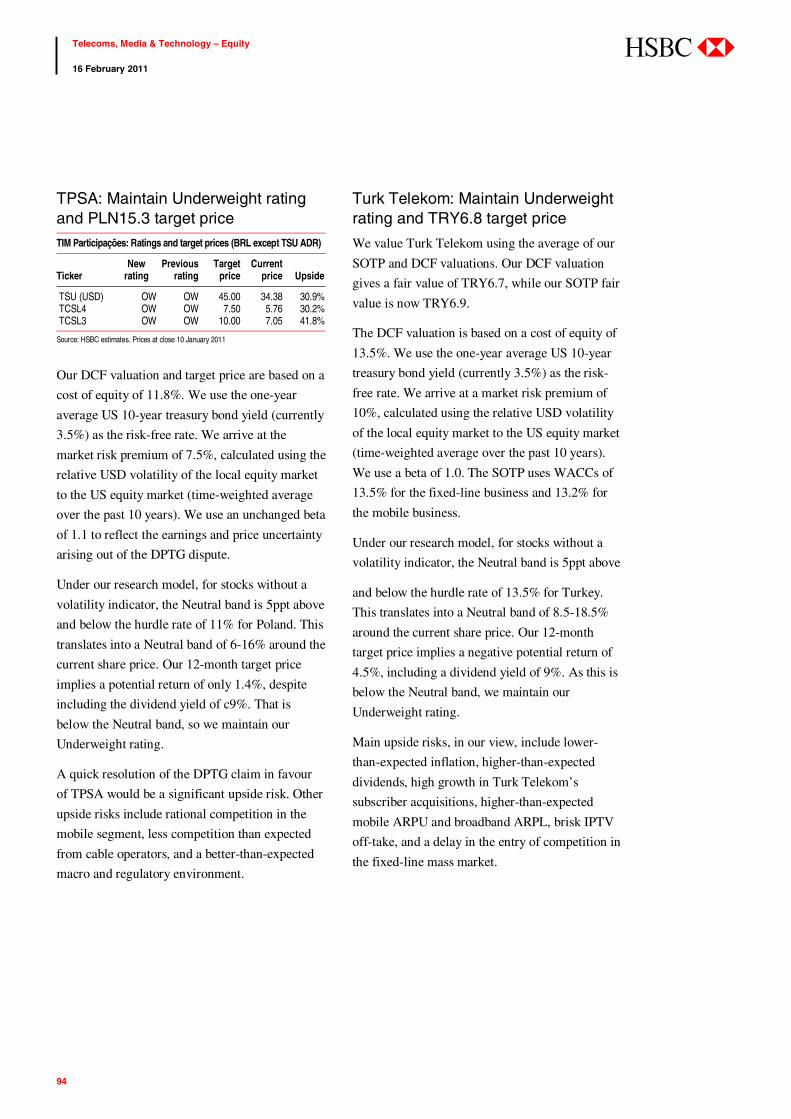
94
Telecoms, Media & Technology – Equity 16 February 2011
abc
TPSA: Maintain Underweight rating and PLN15.3 target price TIM Participações: Ratings and target prices (BRL except TSU ADR)
Ticker
New rating
Previous rating
Target price
Current price
Upside
TSU (USD) OW OW 45.00 34.38 30.9% TCSL4 OW OW 7.50 5.76 30.2% TCSL3 OW OW 10.00 7.05 41.8%
Source: HSBC estimates. Prices at close 10 January 2011
Our DCF valuation and target price are based on a
cost of equity of 11.8%. We use the one-year
average US 10-year treasury bond yield (currently
3.5%) as the risk-free rate. We arrive at the
market risk premium of 7.5%, calculated using the
relative USD volatility of the local equity market
to the US equity market (time-weighted average
over the past 10 years). We use an unchanged beta
of 1.1 to reflect the earnings and price uncertainty
arising out of the DPTG dispute.
Under our research model, for stocks without a
volatility indicator, the Neutral band is 5ppt above
and below the hurdle rate of 11% for Poland. This
translates into a Neutral band of 6-16% around the
current share price. Our 12-month target price
implies a potential return of only 1.4%, despite
including the dividend yield of c9%. That is
below the Neutral band, so we maintain our
Underweight rating.
A quick resolution of the DPTG claim in favour
of TPSA would be a significant upside risk. Other
upside risks include rational competition in the
mobile segment, less competition than expected
from cable operators, and a better-than-expected
macro and regulatory environment.
Turk Telekom: Maintain Underweight rating and TRY6.8 target price
We value Turk Telekom using the average of our
SOTP and DCF valuations. Our DCF valuation
gives a fair value of TRY6.7, while our SOTP fair
value is now TRY6.9.
The DCF valuation is based on a cost of equity of
13.5%. We use the one-year average US 10-year
treasury bond yield (currently 3.5%) as the risk-
free rate. We arrive at a market risk premium of
10%, calculated using the relative USD volatility
of the local equity market to the US equity market
(time-weighted average over the past 10 years).
We use a beta of 1.0. The SOTP uses WACCs of
13.5% for the fixed-line business and 13.2% for
the mobile business.
Under our research model, for stocks without a
volatility indicator, the Neutral band is 5ppt above
and below the hurdle rate of 13.5% for Turkey.
This translates into a Neutral band of 8.5-18.5%
around the current share price. Our 12-month
target price implies a negative potential return of
4.5%, including a dividend yield of 9%. As this is
below the Neutral band, we maintain our
Underweight rating.
Main upside risks, in our view, include lower-
than-expected inflation, higher-than-expected
dividends, high growth in Turk Telekom’s
subscriber acquisitions, higher-than-expected
mobile ARPU and broadband ARPL, brisk IPTV
off-take, and a delay in the entry of competition in
the fixed-line mass market.
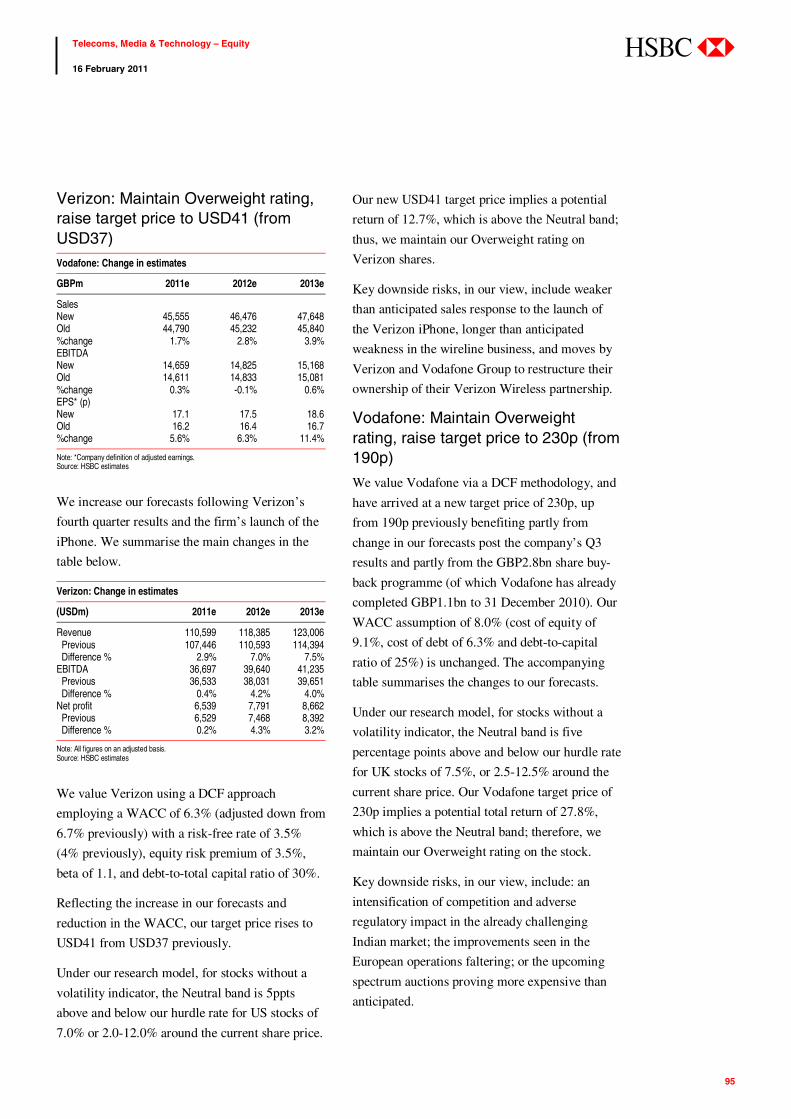
95
Telecoms, Media & Technology – Equity 16 February 2011
abc
Verizon: Maintain Overweight rating, raise target price to USD41 (from USD37) Vodafone: Change in estimates
GBPm 2011e 2012e 2013e
Sales New 45,555 46,476 47,648 Old 44,790 45,232 45,840 %change 1.7% 2.8% 3.9% EBITDA New 14,659 14,825 15,168 Old 14,611 14,833 15,081 %change 0.3% -0.1% 0.6% EPS* (p) New 17.1 17.5 18.6 Old 16.2 16.4 16.7 %change 5.6% 6.3% 11.4%
Note: *Company definition of adjusted earnings. Source: HSBC estimates
We increase our forecasts following Verizon’s
fourth quarter results and the firm’s launch of the
iPhone. We summarise the main changes in the
table below.
Verizon: Change in estimates
(USDm) 2011e 2012e 2013e
Revenue 110,599 118,385 123,006 Previous 107,446 110,593 114,394 Difference % 2.9% 7.0% 7.5% EBITDA 36,697 39,640 41,235 Previous 36,533 38,031 39,651 Difference % 0.4% 4.2% 4.0% Net profit 6,539 7,791 8,662 Previous 6,529 7,468 8,392 Difference % 0.2% 4.3% 3.2%
Note: All figures on an adjusted basis. Source: HSBC estimates
We value Verizon using a DCF approach
employing a WACC of 6.3% (adjusted down from
6.7% previously) with a risk-free rate of 3.5%
(4% previously), equity risk premium of 3.5%,
beta of 1.1, and debt-to-total capital ratio of 30%.
Reflecting the increase in our forecasts and
reduction in the WACC, our target price rises to
USD41 from USD37 previously.
Under our research model, for stocks without a
volatility indicator, the Neutral band is 5ppts
above and below our hurdle rate for US stocks of
7.0% or 2.0-12.0% around the current share price.
Our new USD41 target price implies a potential
return of 12.7%, which is above the Neutral band;
thus, we maintain our Overweight rating on
Verizon shares.
Key downside risks, in our view, include weaker
than anticipated sales response to the launch of
the Verizon iPhone, longer than anticipated
weakness in the wireline business, and moves by
Verizon and Vodafone Group to restructure their
ownership of their Verizon Wireless partnership.
Vodafone: Maintain Overweight rating, raise target price to 230p (from 190p)
We value Vodafone via a DCF methodology, and
have arrived at a new target price of 230p, up
from 190p previously benefiting partly from
change in our forecasts post the company’s Q3
results and partly from the GBP2.8bn share buy-
back programme (of which Vodafone has already
completed GBP1.1bn to 31 December 2010). Our
WACC assumption of 8.0% (cost of equity of
9.1%, cost of debt of 6.3% and debt-to-capital
ratio of 25%) is unchanged. The accompanying
table summarises the changes to our forecasts.
Under our research model, for stocks without a
volatility indicator, the Neutral band is five
percentage points above and below our hurdle rate
for UK stocks of 7.5%, or 2.5-12.5% around the
current share price. Our Vodafone target price of
230p implies a potential total return of 27.8%,
which is above the Neutral band; therefore, we
maintain our Overweight rating on the stock.
Key downside risks, in our view, include: an
intensification of competition and adverse
regulatory impact in the already challenging
Indian market; the improvements seen in the
European operations faltering; or the upcoming
spectrum auctions proving more expensive than
anticipated.

96
Telecoms, Media & Technology – Equity 16 February 2011
abc
This page has been left intentionally blank

97
Telecoms, Media & Technology – Equity 16 February 2011
abc
Company profiles

98
Telecoms, Media & Technology – Equity 16 February 2011
abc
America Movil (Neutral, TP USD64) Fixed line connectivity
America Movil (AMX) is now a diversified player
having merged its mobile assets with the Mexican
incumbent Telmex as well as Telmex Internacional’s
roster of South American cable and altnet properties.
To the benefit of fixed incumbents (although less so
altnets), unbundling of the local loop either does not
exist or is not actively supported by the region’s
regulators. Generally speaking, regulators in Latin
America often lack the necessary experience,
resources or political clout to pursue radical agendas
like unbundling or net neutrality. The only exception
so far in is Chile where a law upholding net
neutrality principles was passed in July 2010.
Mobile connectivity
Smartphone penetration is low in Latin America
(excluding QWERTY devices like BlackBerrys, we
estimate penetration of true smartphones across the
region is in the low single digits). America Movil
however has a strong focus on data which is paying
dividends with Q4 2010 group mobile data revenues
growing c37% year-on-year in constant currency
terms. Mobile data now represents typically c20-
25% of service revenues in most countries. We
expect continued steep price erosion of Android-
based smartphones, primarily from Asian
manufacturers to continue expanding the addressable
market for mobile data in Latin America.
Towards the end of Q4 2009, America Movil’s
Brazilian unit, Claro, experienced some isolated
pressure from data users on its 3G network before
it was comprehensively built out. Having watched
the difficulties created by unlimited mobile data
plans in developed markets, operators in the region
have adopted sensible tariff structures: tiered
pricing, data caps with overage or speed throttling
are normal practises in the region. Additionally,
America Movil, and most of its competitors are
careful to differentiate between pure smartphone
use and tethering (using a smartphone as a laptop
modem) which attracts a 20% premium in markets
like Mexico for example. In Mexico, America
Movil’s c73% market share and 3G leadership
afford it a certain degree of pricing power in data.
In Brazil, although voice price competition
remains fierce (America Movil has noted the price
of a voice minute fell by 20% in 2010), there is
greater price discipline in data between the data
market leaders, Claro and Telefonica’s Vivo.
Fixed line applications
In Mexico, regulatory challenges continue to prevent
Telmex from offering pay TV. Meanwhile, in Brazil,
America Movil’s has cable (NET Serviços, Brazil’s
leading cable player) as well as rapidly growing
satellite operations (Embratel’s satellite TV
customer base quintupled in 2010). It is widely
expected that Brazil’s media law which currently
prohibits telcos from offering IPTV will be changed
this year; the regulator Anatel has already started
removing this restriction from telco licence renewals
as it seeks to foster more payTV competition.
Mobile applications
Although operators in emerging markets with local
knowledge and powerful domestic content allies
(America Movil joint-owns Net Serviços with
powerful Brazilian media group Globo), we still
believe it will be difficult for mobile operators to
capture a significant portion of the applications value
chain (ie above any revenue share under the Android
Market model).
Investment thesis
We rate America Movil Neutral. Although well-
positioned to benefit from mobile capacity scarcity,
we expect consolidation of Mexican fixed-line
(Telmex) to drag significantly on group growth. In
fixed line, the scarcity opportunity is not being fully
exploited with little NGA investment and little or no
unbundling to flush out anyway.

99
Telecoms, Media & Technology – Equity 16 February 2011
abc
Financials & valuation: America Movil Neutral Financial statements
Year to 12/2010a 12/2011e 12/2012e 12/2013e
Profit & loss summary (USDm)
Revenue 48,130 52,893 54,769 56,224EBITDA 19,553 21,844 22,948 23,928Depreciation & amortisation -7,216 -7,286 -7,438 -7,622Operating profit/EBIT 12,337 14,558 15,510 16,306Net interest -989 -1,077 -1,026 -973PBT 10,982 13,823 14,740 15,619HSBC PBT 12,200 13,823 14,740 15,619Taxation -3,179 -4,147 -4,422 -4,686Net profit 7,195 9,171 9,793 10,415HSBC net profit 7,853 9,171 9,793 10,415
Cash flow summary (USDm)
Cash flow from operations 14,832 17,216 17,633 18,413Capex -6,508 -8,573 -8,793 -8,683Cash flow from investment -11,757 -8,573 -8,793 -8,683Dividends -1,034 -1,275 -1,431 -1,609Change in net debt 100 -5,092 -4,925 -5,645FCF equity 8,747 8,003 8,565 9,467
Balance sheet summary (USDm)
Intangible fixed assets 9,150 9,150 9,150 9,150Tangible fixed assets 33,319 34,606 35,961 37,022Current assets 20,595 16,379 20,484 23,356Cash & others 9,229 4,863 8,687 11,341Total assets 72,188 69,602 75,317 79,537Operating liabilities 15,976 16,721 17,135 17,497Gross debt 25,981 16,522 15,421 12,430Net debt 16,752 11,659 6,734 1,089Shareholders funds 26,787 32,599 38,477 44,807Invested capital 37,860 38,552 39,774 40,691
Ratio, growth and per share analysis
Year to 12/2010a 12/2011e 12/2012e 12/2013e
Y-o-y % change
Revenue 14.3 9.9 3.5 2.7EBITDA 13.5 11.7 5.1 4.3Operating profit 9.9 18.0 6.5 5.1PBT 1.5 25.9 6.6 6.0HSBC EPS -3.9 18.7 9.2 8.8
Ratios (%)
Revenue/IC (x) 1.3 1.4 1.4 1.4ROIC 23.5 26.7 27.7 28.4ROE 31.1 30.9 27.6 25.0ROA 12.9 14.9 15.5 15.2EBITDA margin 40.6 41.3 41.9 42.6Operating profit margin 25.6 27.5 28.3 29.0EBITDA/net interest (x) 19.8 20.3 22.4 24.6Net debt/equity 62.5 35.2 17.0 2.3Net debt/EBITDA (x) 0.9 0.5 0.3 0.0CF from operations/net debt 88.5 147.7 261.8 1690.5
Per share data (USD)
EPS Rep (fully diluted) 3.34 4.59 5.01 5.46HSBC EPS (fully diluted) 3.87 4.59 5.01 5.46DPS 0.51 0.64 0.73 0.84Book value 13.34 16.33 19.70 23.47
Key forecast drivers
Year to 12/2010a 12/2011e 12/2012e 12/2013e
Mexico Revenues 19,865 21,489 21,760 22,114Brazil Revenues 11,939 13,172 13,461 13,499Group Revenues 48,130 52,893 54,769 56,224Group EBITDA 19,553 21,844 22,948 23,928Group mobile subscribers (000) 225,025 239,801 251,741 261,340
Valuation data
Year to 12/2010a 12/2011e 12/2012e 12/2013e
EV/sales 2.6 2.3 2.1 2.0EV/EBITDA 6.5 5.6 5.1 4.6EV/IC 3.3 3.2 2.9 2.7PE* 14.7 12.4 11.3 10.4P/Book value 4.3 3.5 2.9 2.4FCF yield (%) 8.0 7.3 7.8 8.6Dividend yield (%) 0.9 1.1 1.3 1.5
Note: * = Based on HSBC EPS (fully diluted)
Issuer information
Share price (USD) 56.78 Target price (USD) 64.00 Potent'l return (%) 12.7
Reuters (Equity) AMX.N Bloomberg (Equity) AMX USMarket cap (USDm) 114,501 Market cap (USDm) 114,501Free float (%) 59 Enterprise value (USDm) 121,468Country Mexico Sector Wireless TelecomsAnalyst Richard Dineen Contact 1 212 525 6707
Price relative
19242934394449545964
2009 2010 2011 2012
19242934394449545964
America Movil Rel to MEXICAN I.P.C. IDX
Source: HSBC Note: price at close of 11 Feb 2011
100
Telecoms, Media & Technology – Equity 16 February 2011
abc
AT&T (Neutral, TP USD30) Fixed line connectivity
The FCC’s 2003 Triennial Review effectively
withdrew support for unbundling (known in the US
as UNE-P, Unbundled Network Elements –
Platform) of incumbent local access fibre. The shift
in regulation encouraged incumbents like AT&T and
Verizon to then embark on extensive fiber
investments. Unbundled access providers in fibred
areas of the US have since all but disappeared.
While unbundling regulation has favored
incumbents, the FCC has taken a hard line on net
neutrality. This is understandable given the
strategic importance of US Internet companies
(whose products and services may be exported,
unlike those of domestic-focused telcos). In a
December 2010 decision, the FCC passed a new
policy that maintains strict net neutrality rules for
fixed-line networks while acknowledging the
unique scarcity of wireless capacity by permitting
some shaping of mobile traffic by operators based
on reasonable network management criteria.
Mobile connectivity
The US mobile data market is highly developed.
Over 60% of AT&T’s postpaid base has an
integrated device (including QWERTY devices
such as BlackBerrys); we estimate 35-40% of its
base has a “true” smartphone. Following the rapid
adoption of smartphones due mainly to the firm’s
exclusive carriage of the Apple iPhone June 2007-
February 2011, AT&T’s mobile network came
under intense pressure with widely publicized
network problems in San Francisco and New
York from mid-2009. This prompted a substantial
increase in AT&T’s wireless capex with 2010
spend increasing over 50% versus the prior year.
A major focus was the addition of a further c2,000
3G base stations during 2010 as well as boosting
backhaul capacity.
AT&T was among the first operators globally to
shift from flat-rate unlimited plans to tiered data
bundles – either USD15 for 200MB or USD25 for
2GB (overage charges apply above these limits).
Although other US operators are for the moment
sticking with unlimited plans, we believe there is
longer-term consensus that tiered plans represent
the future. AT&T and Verizon are the price-
setters in the US market, having several
advantages that their rivals lack (iPhone carriage
and broader and/or higher quality network
coverage, larger marketing budgets and so forth).
Given the pressure on its network it is
unsurprising that AT&T has been among the first
to exploit public WiFi to offload traffic where
possible. AT&T has 23,000 hotspots in the US,
including expanded hotzones in places like New
York City’s Times Square. The firm is also
offering femtocell products under the “Microcell”
brand which retail for cUSD150.
Fixed line applications
AT&T’s U-verse IPTV service had nearly 3m
customers by end-2010, penetration of around
14% in areas available for sale. As with Verizon,
AT&T competes directly against cable and
selectively against satellite (AT&T also re-sells
DirecTV satellite payTV outside U-verse markets).
Mobile applications
In our view AT&T, like Verizon, has been
decisively outflanked by Apple and Google in the
mobile applications space. We see little prospect
that any US carrier can successfully re-take this
ground from arguably the two most powerful
technology companies in the world.
Investment thesis
We are Neutral on AT&T. Although it should
benefit from growing mobile scarcity, trends in
wireless may weaken, we believe, following loss of
iPhone exclusivity which ended February 2011.

101
Telecoms, Media & Technology – Equity 16 February 2011
abc
Financials & valuation: AT&T Neutral Financial statements
Year to 12/2010a 12/2011e 12/2012e 12/2013e
Profit & loss summary (USDm)
Revenue 124,399 124,847 126,302 128,943EBITDA 40,080 43,676 44,817 46,297Depreciation & amortisation -19,462 -19,454 -19,153 -19,505Operating profit/EBIT 20,618 24,223 25,664 26,792Net interest -2,996 -3,175 -3,087 -3,214PBT 18,384 21,848 23,417 24,460HSBC PBT 20,905 21,848 23,417 24,460Taxation 1,123 -7,865 -8,430 -8,806Net profit 19,507 13,983 14,987 15,654HSBC net profit 13,379 13,983 14,987 15,654
Cash flow summary (USDm)
Cash flow from operations 32,010 32,653 32,936 33,617Capex -20,302 -19,257 -19,204 -19,101Cash flow from investment -21,449 -21,607 -19,204 -19,101Dividends -9,916 -10,120 -10,580 -10,897Change in net debt -3,549 -2,050 -3,152 -3,618FCF equity 17,779 13,396 13,732 14,515
Balance sheet summary (USDm)
Intangible fixed assets 134,121 132,231 131,001 130,331Tangible fixed assets 103,963 105,656 106,937 107,204Current assets 19,951 22,507 22,653 22,917Cash & others 1,437 4,000 4,000 4,000Total assets 275,958 279,118 280,154 280,897Operating liabilities 26,755 25,965 25,824 25,508Gross debt 66,167 66,680 63,528 59,910Net debt 64,730 62,680 59,528 55,910Shareholders funds 112,122 115,559 119,888 124,565Invested capital 229,843 230,429 230,767 230,944
Ratio, growth and per share analysis
Year to 12/2010a 12/2011e 12/2012e 12/2013e
Y-o-y % change
Revenue 1.1 0.4 1.2 2.1EBITDA -2.7 9.0 2.6 3.3Operating profit -4.1 17.5 5.9 4.4PBT -1.6 18.8 7.2 4.5HSBC EPS 10.7 3.8 7.2 4.5
Ratios (%)
Revenue/IC (x) 0.5 0.5 0.5 0.6ROIC 6.6 7.3 7.5 7.6ROE 12.5 12.3 12.7 12.8ROA 7.8 5.8 6.1 6.4EBITDA margin 32.2 35.0 35.5 35.9Operating profit margin 16.6 19.4 20.3 20.8EBITDA/net interest (x) 13.4 13.8 14.5 14.4Net debt/equity 57.6 54.1 49.5 44.8Net debt/EBITDA (x) 1.6 1.4 1.3 1.2CF from operations/net debt 49.5 52.1 55.3 60.1
Per share data (USD)
EPS Rep (fully diluted) 3.28 2.34 2.51 2.62HSBC EPS (fully diluted) 2.25 2.34 2.51 2.62DPS 1.69 1.73 1.78 1.84Book value 18.87 19.32 20.04 20.83
Key forecast drivers
Year to 12/2010a 12/2011e 12/2012e 12/2013e
AT&T revenues 124,399 124,847 126,302 128,943AT&T EBITDA adjusted 41,659 43,676 44,817 46,297AT&T EBIT adjusted 22,959 25,023 26,504 27,674AT&T PBT adjusted 19,963 21,848 23,417 24,460AT&T EPS adjusted 2.25 2.34 2.51 2.62
Valuation data
Year to 12/2010a 12/2011e 12/2012e 12/2013e
EV/sales 1.8 1.8 1.7 1.7EV/EBITDA 5.5 5.0 4.8 4.6EV/IC 1.0 1.0 0.9 0.9PE* 12.6 12.2 11.4 10.9P/Book value 1.5 1.5 1.4 1.4FCF yield (%) 11.3 8.5 8.7 9.2Dividend yield (%) 5.9 6.1 6.3 6.4
Note: * = Based on HSBC EPS (fully diluted)
Issuer information
Share price (USD) 28.47 Target price (USD) 30.00 Potent'l return (%) 5.4
Reuters (Equity) T.N Bloomberg (Equity) T USMarket cap (USDm) 168,286 Market cap (USDm) 168,286Free float (%) 100 Enterprise value (USDm) 219787Country United States Sector Diversified TelecomsAnalyst Richard Dineen Contact 1 212 525 6707
Price relative
18
20
22
24
26
28
30
32
2009 2010 2011 2012
18
20
22
24
26
28
30
32
AT&T Rel to S&P 500
Source: HSBC Note: price at close of 11 Feb 2011
102
Telecoms, Media & Technology – Equity 16 February 2011
abc
Belgacom (Neutral, TP EUR30) Fixed line connectivity
Belgacom has one of the most advanced NGA
roll-outs in Europe, with 76% VDSL coverage at
end Q3 2010. As a result, we expect Belgacom to
close 10% to 15% of its local exchanges by 2013,
switching off around 40% of the unbundled lines.
This will force alternative operators such as
Mobistar to replace cheap ADSL (EUR7.5 per
month) with expensive VDSL bistream wholesale
offers (EUR13.9 per month). In determining the
VDSL wholesale price, the regulator has applied a
15% mark-up to the cost incurred by Belgacom.
Hence, though regulated, we believe the move of
competitors to wholesale VDSL from unbundling
will be beneficial for Belgacom.
There is no active discussion on net neutrality in
Belgium. We believe the Belgian regulation on
net neutrality is likely to be in line with EU
recommendations, which currently appear
pragmatic (authorising prioritisation in the event
of congestion).
Mobile connectivity
Mobile data demand is picking up in Belgium,
with Belgacom’s advanced data services revenues
growing by 11% y-o-y in 9M 2010. Given there
are no handset subsidies in Belgium, smartphone
penetration here is behind most of Europe, but,
with smartphone prices falling, we expect
penetration to increase rapidly. The mobile
networks in Belgium do not seem to be under any
strain as yet. Belgacom commented in its Q3 2010
conference call that it still had a huge amount of
capacity to fill on its 3G networks.
Belgacom has adopted tiered data plans. It has
four mobile data plans catering to various
categories of users, starting with a package of
50MB for EUR5 and with a high-end package of
1GB for EUR25. Additional usage is charged at
EUR0.03 per MB. We see pricing power as
Belgacom’s main competitor, Mobistar, is also
experiencing strong demand for data (+117%
volume and 63% revenue growth in 2010) and
also has (low) caps of 50MB and 100MB.
Fixed line applications
Belgacom was among the earliest to launch IPTV
services in Europe, and now has around 20%
market share of the national TV market as at the
end of Q3 2010 – with the rest belonging to cable
operators (predominantly Telenet). IPTV
penetration had reached 60% of Belgacom’s
broadband connections by Q3 2010. Indeed, IPTV
has become a relatively material item for the
incumbent, and now provides 16% of its
consumer revenues (growing at 43% y-o-y year-
to-date Q3 2010).
Mobile applications
Belgacom has joined the Rich communication
suite initiative to help develop more data services
which we see as a positive. But, although we see
the soft SIM threat as overstated in most
European countries, the situation may be different
in Belgium. There are no handset subsidies (apart
from Telenet’s MVNO) and a vendor such as
Apple would not take a big risk by taking the soft
SIM route. But Belgium is more an exception in
Europe and it may not be worth vendors adopting
a very different strategy in a small market.
Investment thesis
We believe the company has the right network
assets (fixed and mobile) and strategy (quad-play
offers) to monetise fixed connectivity, but it still
faces stiff competition from cables Telenet and
VOO. On the mobile data front, Mobistar, which
has exclusivity for iPhone, has been ahead of
Belgacom in monetising the opportunity so far,
but we see a good potential here for Belgacom
too. We maintain our Neutral rating and EUR30
target price on Belgacom.

103
Telecoms, Media & Technology – Equity 16 February 2011
abc
Financials & valuation: Belgacom Neutral Financial statements
Year to 12/2009a 12/2010e 12/2011e 12/2012e
Profit & loss summary (EURm)
Revenue 5,990 6,589 6,622 6,693EBITDA 1,967 2,398 1,933 1,951Depreciation & amortisation -706 -802 -776 -728Operating profit/EBIT 1,261 1,596 1,157 1,223Net interest -117 -106 -102 -98PBT 1,144 1,489 1,055 1,125HSBC PBT 1,134 1,052 1,055 1,125Taxation -241 -256 -264 -337Net profit 904 1,218 768 762HSBC net profit 749 679 673 717
Cash flow summary (EURm)
Cash flow from operations 1,406 1,578 1,546 1,549Capex -597 -730 -671 -678Cash flow from investment -631 -683 -683 -690Dividends -684 -702 -701 -714Change in net debt -119 -180 -162 -145FCF equity 1,037 1,413 896 827
Balance sheet summary (EURm)
Intangible fixed assets 2,711 3,548 3,560 3,571Tangible fixed assets 2,420 2,351 2,246 2,196Current assets 1,945 2,135 2,277 2,432Cash & others 471 500 637 782Total assets 7,450 8,334 8,382 8,500Operating liabilities 1,771 2,481 2,507 2,579Gross debt 2,187 2,036 2,011 2,011Net debt 1,716 1,536 1,374 1,229Shareholders funds 2,521 2,679 2,733 2,784Invested capital 4,834 5,053 4,938 4,839
Ratio, growth and per share analysis
Year to 12/2009a 12/2010e 12/2011e 12/2012e
Y-o-y % change
Revenue 0.1 10.0 0.5 1.1EBITDA 3.3 21.9 -19.4 0.9Operating profit 8.5 26.5 -27.5 5.7PBT 8.5 30.2 -29.2 6.6HSBC EPS 0.3 -9.6 -0.9 6.6
Ratios (%)
Revenue/IC (x) 1.2 1.3 1.3 1.4ROIC 20.2 21.3 15.3 16.5ROE 31.3 26.1 24.9 26.0ROA 13.0 16.6 10.3 10.2EBITDA margin 32.8 36.4 29.2 29.1Operating profit margin 21.1 24.2 17.5 18.3EBITDA/net interest (x) 16.8 22.6 19.0 19.9Net debt/equity 67.9 52.7 46.4 40.9Net debt/EBITDA (x) 0.9 0.6 0.7 0.6CF from operations/net debt 81.9 102.7 112.5 126.1
Per share data (EUR)
EPS Rep (fully diluted) 2.82 3.79 2.39 2.37HSBC EPS (fully diluted) 2.34 2.12 2.10 2.23DPS 2.08 2.18 2.23 2.22Book value 7.87 8.35 8.51 8.67
Key forecast drivers
Year to 12/2009a 12/2010e 12/2011e 12/2012e
Belgacom Revenues 5,990 6,589 6,622 6,693Belgacom EBITDA adjusted 1,957 1,961 1,933 1,951Belgacom EBIT adjusted 1,261 1,596 1,157 1,223Belgacom Net income adjusted 904 1,218 768 762Belgacom FCF definition 798 900 893 889
Valuation data
Year to 12/2009a 12/2010e 12/2011e 12/2012e
EV/sales 1.9 1.7 1.7 1.6EV/EBITDA 5.8 4.7 5.7 5.6EV/IC 2.4 2.2 2.2 2.3PE* 11.6 12.8 12.9 12.1P/Book value 3.4 3.2 3.2 3.1FCF yield (%) 10.7 14.6 9.3 8.5Dividend yield (%) 7.7 8.1 8.2 8.2
Note: * = Based on HSBC EPS (fully diluted)
Issuer information
Share price (EUR) 27.02 Target price (EUR) 30.00 Potent'l return (%) 11.0
Reuters (Equity) BCOM.BR Bloomberg (Equity) BELG BBMarket cap (USDm) 12,380 Market cap (EURm) 9,135Free float (%) 42 Enterprise value (EURm) 11211Country Belgium Sector Diversified TelecomsAnalyst Nicolas Cote-Colisson Contact 44 20 7991 6826
Price relative
171921232527293133
2009 2010 2011 2012
171921232527293133
Belgacom Rel to BEL-20
Source: HSBC Note: price at close of 11 Feb 2011

104
Telecoms, Media & Technology – Equity 16 February 2011
abc
BT Group (Neutral, TP 200p) Fixed line connectivity
BT is now well underway with its NGA upgrade
deployment, and ultimately targets passing two-
thirds of the country’s premises with either
FTTN/VDSL or FTTP. In our view, Ofcom’s
regulation is not as sympathetic as is warranted by
a project of this scale, but BT has nonetheless
been given a good degree of flexibility on setting
its pricing. And although the regulator’s armoury
will include techniques like unbundling of the
sub-loop, we believe this is uneconomic in the
majority of the country (although it will doubtless
be in the interests of BT’s retail competitors to
express continuing interest in this approach).
There is already good evidence that the prospect
of fibre-based, superfast broadband is causing
some BT competitors to rethink their strategies.
For instance, Orange (thought of primarily as a
mobile operator, but also a provider of ADSL
services) has chosen not to invest in upgrading its
platform, and is shifting instead to taking a
wholesale product from BT. Presumably it
reasoned there was little point in lavishing
expenditure on ADSL ULL infrastructure, just as
fibre is becoming widely available.
Since BT’s Openreach division must make
available its fibre product to all-comers on equal
terms, there is every possibility that BT’s retail
market share will come under ongoing pressure:
some of its competitors may prove more adept at
selling the connectivity than BT itself. But the key
point is that, whereas the company is paid only
GBP7.4 per month for an unbundled copper line,
it could receive double this for wholesale fibre.
Moreover, what constitute additional revenues for
BT are extra costs for those rivals that rely on the
incumbent’s access infrastructure. Their need to
be able to digest these cost hikes should result in a
more price-disciplined market in general.
Ofcom’s views on net neutrality look sensible and
pragmatic. While insisting on due transparency,
the regulator argues that business models
incorporating charges for prioritisation could in
fact bring certain benefits. Meanwhile, BT is
moving to address the opportunities available in
the OTT video market by launching its own CDN
specifically targeting those with video content. BT
Vision, the incumbent’s IPTV service, will
doubtless be an early customer, but the CDN’s
capabilities will be sold to third parties as well.
Fixed line applications
To date, BT Vision has struggled. This is perhaps
not surprising given the intense competition from
BSkyB in particular. Ofcom has recently
intervened to give BT and others access to
BSkyB’s sports content, and this has now been
incorporated into the Vision line-up. However,
despite heavy advertising, customer net adds have
responded only slowly. We think the YouView
OTT platform (previously Project Canvas) should
provide a boost to the whole concept of IPTV, but
its set-top boxes are now delayed until early next
year. Even then, we are more confident of BT’s
ability to monetise this type of service through
selling the underlying connectivity rather than by
acting as a payTV retailer.
Investment thesis
BT has made progress in tackling its various
operational challenges (for instance, in its Global
Services division), and management has now been
able to move on to address m strategic issues – in
particular with regard to the upgrade to a fibre
access platform. However, that said, the pension
overhang remains an issue and the key factor that
underpins our Neutral stance. While the financial
markets have improved since the time of the
triennial review, we would caution that the
Pensions Regulator will want reassurance that the
scheme’s obligations can be met if economic
conditions deteriorate once more.
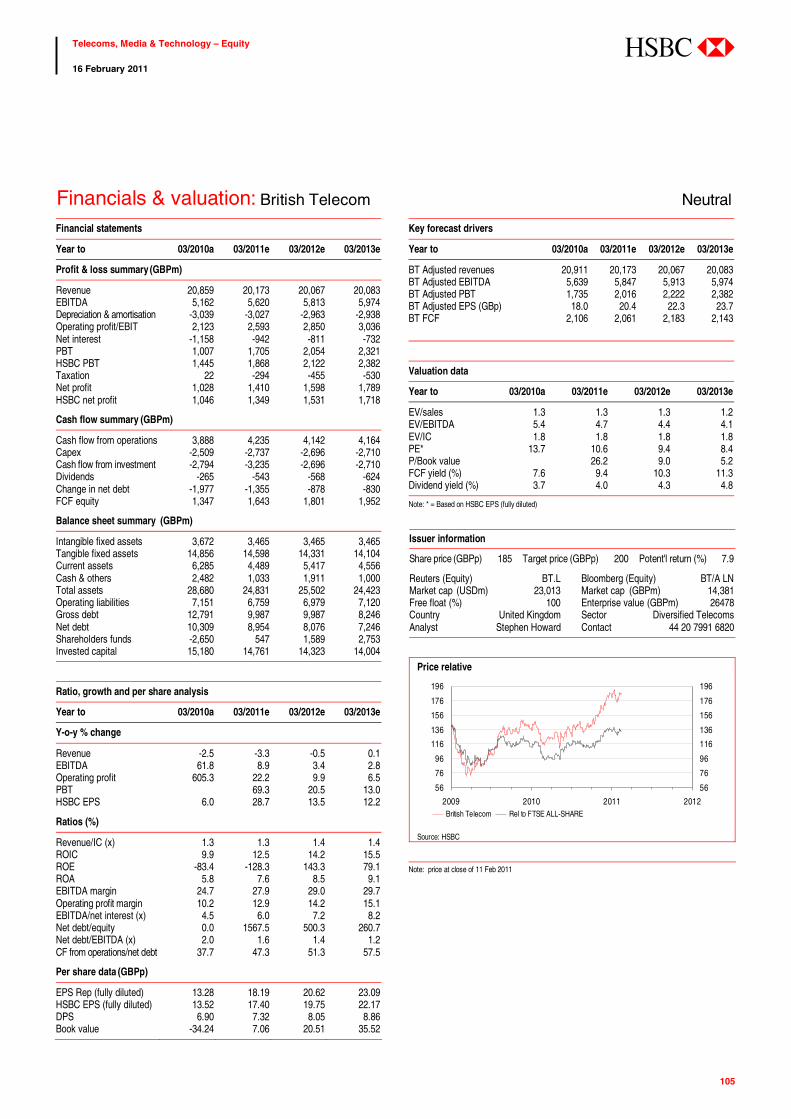
105
Telecoms, Media & Technology – Equity 16 February 2011
abc
Financials & valuation: British Telecom Neutral Financial statements
Year to 03/2010a 03/2011e 03/2012e 03/2013e
Profit & loss summary (GBPm)
Revenue 20,859 20,173 20,067 20,083EBITDA 5,162 5,620 5,813 5,974Depreciation & amortisation -3,039 -3,027 -2,963 -2,938Operating profit/EBIT 2,123 2,593 2,850 3,036Net interest -1,158 -942 -811 -732PBT 1,007 1,705 2,054 2,321HSBC PBT 1,445 1,868 2,122 2,382Taxation 22 -294 -455 -530Net profit 1,028 1,410 1,598 1,789HSBC net profit 1,046 1,349 1,531 1,718
Cash flow summary (GBPm)
Cash flow from operations 3,888 4,235 4,142 4,164Capex -2,509 -2,737 -2,696 -2,710Cash flow from investment -2,794 -3,235 -2,696 -2,710Dividends -265 -543 -568 -624Change in net debt -1,977 -1,355 -878 -830FCF equity 1,347 1,643 1,801 1,952
Balance sheet summary (GBPm)
Intangible fixed assets 3,672 3,465 3,465 3,465Tangible fixed assets 14,856 14,598 14,331 14,104Current assets 6,285 4,489 5,417 4,556Cash & others 2,482 1,033 1,911 1,000Total assets 28,680 24,831 25,502 24,423Operating liabilities 7,151 6,759 6,979 7,120Gross debt 12,791 9,987 9,987 8,246Net debt 10,309 8,954 8,076 7,246Shareholders funds -2,650 547 1,589 2,753Invested capital 15,180 14,761 14,323 14,004
Ratio, growth and per share analysis
Year to 03/2010a 03/2011e 03/2012e 03/2013e
Y-o-y % change
Revenue -2.5 -3.3 -0.5 0.1EBITDA 61.8 8.9 3.4 2.8Operating profit 605.3 22.2 9.9 6.5PBT 69.3 20.5 13.0HSBC EPS 6.0 28.7 13.5 12.2
Ratios (%)
Revenue/IC (x) 1.3 1.3 1.4 1.4ROIC 9.9 12.5 14.2 15.5ROE -83.4 -128.3 143.3 79.1ROA 5.8 7.6 8.5 9.1EBITDA margin 24.7 27.9 29.0 29.7Operating profit margin 10.2 12.9 14.2 15.1EBITDA/net interest (x) 4.5 6.0 7.2 8.2Net debt/equity 0.0 1567.5 500.3 260.7Net debt/EBITDA (x) 2.0 1.6 1.4 1.2CF from operations/net debt 37.7 47.3 51.3 57.5
Per share data (GBPp)
EPS Rep (fully diluted) 13.28 18.19 20.62 23.09HSBC EPS (fully diluted) 13.52 17.40 19.75 22.17DPS 6.90 7.32 8.05 8.86Book value -34.24 7.06 20.51 35.52
Key forecast drivers
Year to 03/2010a 03/2011e 03/2012e 03/2013e
BT Adjusted revenues 20,911 20,173 20,067 20,083BT Adjusted EBITDA 5,639 5,847 5,913 5,974BT Adjusted PBT 1,735 2,016 2,222 2,382BT Adjusted EPS (GBp) 18.0 20.4 22.3 23.7 BT FCF 2,106 2,061 2,183 2,143
Valuation data
Year to 03/2010a 03/2011e 03/2012e 03/2013e
EV/sales 1.3 1.3 1.3 1.2EV/EBITDA 5.4 4.7 4.4 4.1EV/IC 1.8 1.8 1.8 1.8PE* 13.7 10.6 9.4 8.4P/Book value 26.2 9.0 5.2FCF yield (%) 7.6 9.4 10.3 11.3Dividend yield (%) 3.7 4.0 4.3 4.8
Note: * = Based on HSBC EPS (fully diluted)
Issuer information
Share price (GBPp) 185 Target price (GBPp) 200 Potent'l return (%) 7.9
Reuters (Equity) BT.L Bloomberg (Equity) BT/A LNMarket cap (USDm) 23,013 Market cap (GBPm) 14,381Free float (%) 100 Enterprise value (GBPm) 26478Country United Kingdom Sector Diversified TelecomsAnalyst Stephen Howard Contact 44 20 7991 6820
Price relative
56
76
96
116
136
156
176
196
2009 2010 2011 2012
56
76
96
116
136
156
176
196
British Telecom Rel to FTSE ALL-SHARE
Source: HSBC Note: price at close of 11 Feb 2011
106
Telecoms, Media & Technology – Equity 16 February 2011
abc
Bezeq (Overweight, TP ILS11.6) Fixed line connectivity
Fixed line business in Israel remains a duopoly
with HOT (cable operator, NR) being the only
other alternative to the incumbent Bezeq with
c70%+ market share. Bezeq’s roll-out of NGN
means an unmatched broadband offering that could
possibly arrest the rate of fixed line erosion. HOT’s
broadband offering is hampered by service and last
mile connectivity reach. Bezeq’s 100% last mile
connectivity means that competitors use the “naked
ADSL” pipes to offer services to their customers.
Absence of regulations on net neutrality is positive
for incumbents. Local loop unbundling by altnets is
yet to be allowed in Israel.
Bezeq’s market share in the commercial market has
fallen below the 80% threshold (regulatory
requirement), meaning that it is eligible for
regulatory relief measures such as allowing Bezeq
to bundle services; these measures should provide
Bezeq with better tools to cope with the expected
competition.
Mobile connectivity
Bezeq (via Pelephone) launched its HSPA
network (previously CDMA) in January 2009,
giving a major push to data applications. Its 3G
subscriber base increased from 46% of the total
subscriber base in Q1 2009 to 63% of the total
subscriber base in Q3 2010. Data revenues as a
percentage of total service revenues for Pelephone
reached 25%. There are no signs of capacity
constraints on the network (given the late
introduction of the iPhone in Israel), despite the
ongoing move from “walled garden” to “open
garden”. Israel is fast moving from “all you can
eat” plans to tiered data pricing; which pushes the
capacity crunch thesis further away for the
present. Cellcom has recently launched speed
tiered pricing (rather than capacity related).
We expect Pelephone to follow with a similar data
pricing structure. Given the rational pricing
environment in Israel, with these tiered-data
pricing systems, risks of capacity constraints seem
low to us.
Fixed line applications
OTT players are less likely to pose a threat to the
incumbent given the firm access control of Bezeq.
Naked DSL pricing (regulated) ensures that Bezeq
collects its toll, in the case of alternative VoB
operators, taking voice minutes share from Bezeq.
Its strong brand name in Israel as the “preferred
operator at home” should help Bezeq offer
advanced NGN based services to its large
subscriber base in the future.
Mobile applications
Pelephone has been able to maintain a good grip
on content, data applications and VAS thanks to a
relatively close garden approach, presented by all
mobile operators. The ability of Pelephone to
successfully charge for VAS/application offerings
should be supported by its domestic customisation
offering. Still we expect data revenues in the
future to gradually move towards tiered pricing
for mobile connectivity, maximising data network
resources.
Investment thesis
We are bullish on the ability of Bezeq to grow its
cash flow by implementing further efficiencies
post ownership change (ie new retirement
agreement with its union); material cost savings
on the back of NGN implementation (ie reducing
national switches from c140 to only 30); capex
drop following NGN project completion; mobile
HSPA network grabbing all new roaming
revenues and corporate clients to better handle
MTR cut/MVNO threats. A strong macro outlook
for Israel should also help Bezeq maximise its
ongoing real estate asset sales.

107
Telecoms, Media & Technology – Equity 16 February 2011
abc
Financials & valuation: Bezeq Overweight Financial statements
Year to 12/2009a 12/2010e 12/2011e 12/2012e
Profit & loss summary (ILSm)
Revenue 11,519 11,605 11,663 11,808EBITDA 4,457 4,722 4,741 4,844Depreciation & amortisation -1,485 -1,414 -1,357 -1,303Operating profit/EBIT 2,972 3,308 3,384 3,541Net interest 31 -94 -62 -41PBT 2,969 3,127 3,265 3,468HSBC PBT 2,969 3,127 3,265 3,468Taxation -807 -795 -783 -798Net profit 2,162 2,332 2,481 2,670HSBC net profit 2,162 2,332 2,481 2,670
Cash flow summary (ILSm)
Cash flow from operations 3,622 3,806 3,916 3,997Capex -1,622 -1,398 -1,082 -928Cash flow from investment -1,663 -1,183 -1,012 -858Dividends -1,941 -3,646 -2,407 -2,576Change in net debt -1,704 832 -498 -563FCF equity 1,789 2,345 2,834 3,069
Balance sheet summary (ILSm)
Intangible fixed assets 1,885 1,856 1,851 1,855Tangible fixed assets 5,303 5,374 5,034 4,584Current assets 3,659 3,567 3,676 4,223Cash & others 580 660 768 1,279Total assets 13,941 13,516 13,222 13,291Operating liabilities 3,196 3,149 3,170 3,197Gross debt 4,136 5,048 4,658 4,606Net debt 3,556 4,388 3,890 3,327Shareholders funds 6,544 5,252 5,326 5,421Invested capital 8,361 8,134 6,622 6,186
Ratio, growth and per share analysis
Year to 12/2009a 12/2010e 12/2011e 12/2012e
Y-o-y % change
Revenue 4.6 0.8 0.5 1.2EBITDA 8.7 5.9 0.4 2.2Operating profit 12.6 11.3 2.3 4.6PBT 18.5 5.3 4.4 6.2HSBC EPS 27.4 8.9 5.6 6.9
Ratios (%)
Revenue/IC (x) 1.3 1.4 1.6 1.8ROIC 24.3 29.9 34.9 42.6ROE 38.4 39.5 46.9 49.7ROA 17.4 18.0 19.8 21.5EBITDA margin 38.7 40.7 40.7 41.0Operating profit margin 25.8 28.5 29.0 30.0EBITDA/net interest (x) 50.5 76.3 118.3Net debt/equity 54.4 83.6 73.1 61.4Net debt/EBITDA (x) 0.8 0.9 0.8 0.7CF from operations/net debt 101.9 86.7 100.7 120.1
Per share data (ILS)
EPS Rep (fully diluted) 1.34 0.87 0.92 0.98HSBC EPS (fully diluted) 0.80 0.87 0.92 0.98DPS 1.33 0.87 0.92 0.98Book value 2.46 1.96 1.97 1.99
Key forecast drivers
Year to 12/2009a 12/2010e 12/2011e 12/2012e
Wireline revenues 5,303 5,175 4,983 4,903Pelephone revenues 5,376 5,638 5,804 6,076Bezeq International Revenues 1,316 1,355 1,382 1,401Wireline EBITDA margin 44 47 46 46Pelephone EBITDA margin 33 35 36 36
Valuation data
Year to 12/2009a 12/2010e 12/2011e 12/2012e
EV/sales 2.5 2.6 2.6 2.5EV/EBITDA 6.5 6.4 6.3 6.0EV/IC 3.5 3.7 4.5 4.7PE* 12.6 11.6 11.0 10.3P/Book value 4.1 5.1 5.1 5.0FCF yield (%) 7.0 9.1 11.0 11.8Dividend yield (%) 13.3 8.7 9.2 9.8
Note: * = Based on HSBC EPS (fully diluted)
Issuer information
Share price (ILS) 10.03 Target price (ILS) 11.60 Potent'l return (%) 16
Reuters (Equity) BEZQ.TA Bloomberg (Equity) BEZQ ITMarket cap (USDm) 7,360 Market cap (ILSm) 26,958Country Israel Sector Diversified TelecomsAnalyst Avshalom Shimei Contact 972 3 710 1197
Price relative
3456789
101112
2009 2010 2011 2012
3456789101112
Bezeq Rel to TA-100 INDEX
Source: HSBC Note: price at close of 13 Feb 2011

108
Telecoms, Media & Technology – Equity 16 February 2011
abc
Deutsche Telekom (Underweight, TP EUR9.5) Fixed line connectivity
Deutsche Telekom (DT) announced its NGA
programme as early as 2006, initially deploying
solely VDSL/FTTC. At its 2010 capital markets
day, DT announced a further roll-out of NGA,
targeting 31% of German homes to be passed with
VDSL/FTTC and up to another 10% with FTTH by
the end of 2012. Altnets have either been
consolidated or are struggling to keep their
subscriber bases stable. Even big pocket players like
Vodafone and Telefonica are not growing their
fixed businesses in Germany and are hesitant about
building their own NGA networks. Cable operators,
having upgraded faster than DT, are gaining share
strongly in an increasingly saturated market.
BNetzA, the German regulator, has obliged DT to
open its NGA network on a wholesale as well as
on an unbundling basis, but conditions are such
that even Telefonica and Vodafone find it
uneconomical to unbundle at the street cabinet
level. Wholesale price points for NGA are at least
double the copper ULL fee. On net neutrality in
Germany, BNetzA are committed to net neutrality
principles but leave themselves a big backdoor by
accepting that differentiation of service can be
beneficial to society and economically sensible as
long as it does not discriminate and limit
competition. We view the political climate around
net neutrality as sensible overall.
Deutsche Telekom entered the CDN market in
early 2009, partnering with California-based
Edgecast.
Mobile connectivity
Historically DT has not had tiered data pricing,
but has had fairly generous usage policies. With
the new tariff scheme introduced before the 2010
Christmas sales season, DT changed its small
print, capping the data at a volume as low as
300MB for cheaper smartphone tariffs; only price
points from around EUR60 include 1GB of data
volume and more. In February 2011, DT
announced a new initiative with France Telecom
to explore areas of cooperation, including radio
access network sharing in Europe and improving
WiFi user experience while roaming.
Fixed line applications
DT Triple Play product is slowly gaining traction.
With 1m subscribers, DT’s market share remains
well below 4% of the German TV market, despite
featuring Bundesliga and an increasingly wide
VideoOnDemand library. OTT platforms have yet
to gain traction in Germany and cable operators
are just about to introduce VideoOnDemand. It’s
very early days for OTT in Germany, but DT is
sensibly positioning itself in this market.
Mobile applications
DT has attempted to develop a broad service set,
going well beyond connectivity into the
applications layer. Capabilities include a network-
based address book. But, while a useful feature
set, many (though not all) of these capabilities are
available via the big internet and technology
brands, and customers may well gravitate towards
using these providers rather than their telecoms
supplier. DT is part of WAC, the Wholesale
Application community, but to date little tangible
results have come out of this alliance.
Investment thesis
We believe Deutsche Telekom is at risk of
continuing to underinvest in what is an above-
average competitive domestic fixed and mobile
market. We also see no easy solution to the
subscale issues of its former growth engine T-
Mobile US. We, thus, remain Underweight on
Deutsche Telekom given its unattractive organic
growth profile versus peers.
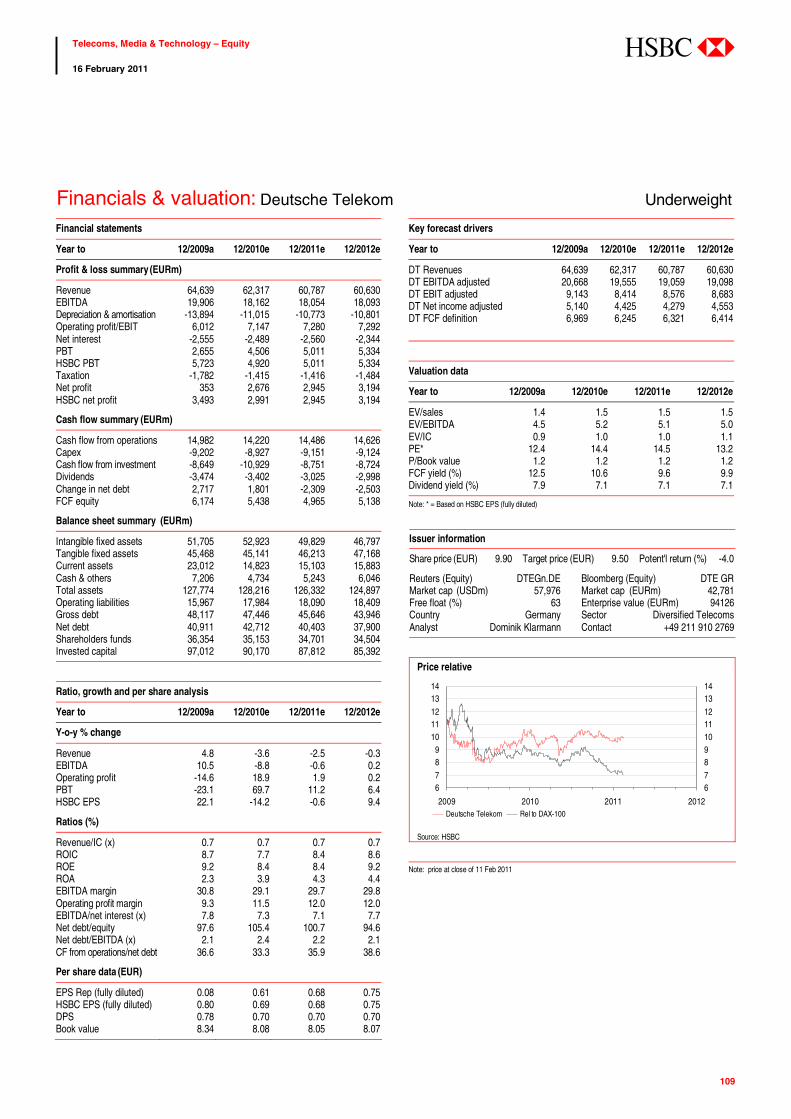
109
Telecoms, Media & Technology – Equity 16 February 2011
abc
Financials & valuation: Deutsche Telekom Underweight Financial statements
Year to 12/2009a 12/2010e 12/2011e 12/2012e
Profit & loss summary (EURm)
Revenue 64,639 62,317 60,787 60,630EBITDA 19,906 18,162 18,054 18,093Depreciation & amortisation -13,894 -11,015 -10,773 -10,801Operating profit/EBIT 6,012 7,147 7,280 7,292Net interest -2,555 -2,489 -2,560 -2,344PBT 2,655 4,506 5,011 5,334HSBC PBT 5,723 4,920 5,011 5,334Taxation -1,782 -1,415 -1,416 -1,484Net profit 353 2,676 2,945 3,194HSBC net profit 3,493 2,991 2,945 3,194
Cash flow summary (EURm)
Cash flow from operations 14,982 14,220 14,486 14,626Capex -9,202 -8,927 -9,151 -9,124Cash flow from investment -8,649 -10,929 -8,751 -8,724Dividends -3,474 -3,402 -3,025 -2,998Change in net debt 2,717 1,801 -2,309 -2,503FCF equity 6,174 5,438 4,965 5,138
Balance sheet summary (EURm)
Intangible fixed assets 51,705 52,923 49,829 46,797Tangible fixed assets 45,468 45,141 46,213 47,168Current assets 23,012 14,823 15,103 15,883Cash & others 7,206 4,734 5,243 6,046Total assets 127,774 128,216 126,332 124,897Operating liabilities 15,967 17,984 18,090 18,409Gross debt 48,117 47,446 45,646 43,946Net debt 40,911 42,712 40,403 37,900Shareholders funds 36,354 35,153 34,701 34,504Invested capital 97,012 90,170 87,812 85,392
Ratio, growth and per share analysis
Year to 12/2009a 12/2010e 12/2011e 12/2012e
Y-o-y % change
Revenue 4.8 -3.6 -2.5 -0.3EBITDA 10.5 -8.8 -0.6 0.2Operating profit -14.6 18.9 1.9 0.2PBT -23.1 69.7 11.2 6.4HSBC EPS 22.1 -14.2 -0.6 9.4
Ratios (%)
Revenue/IC (x) 0.7 0.7 0.7 0.7ROIC 8.7 7.7 8.4 8.6ROE 9.2 8.4 8.4 9.2ROA 2.3 3.9 4.3 4.4EBITDA margin 30.8 29.1 29.7 29.8Operating profit margin 9.3 11.5 12.0 12.0EBITDA/net interest (x) 7.8 7.3 7.1 7.7Net debt/equity 97.6 105.4 100.7 94.6Net debt/EBITDA (x) 2.1 2.4 2.2 2.1CF from operations/net debt 36.6 33.3 35.9 38.6
Per share data (EUR)
EPS Rep (fully diluted) 0.08 0.61 0.68 0.75HSBC EPS (fully diluted) 0.80 0.69 0.68 0.75DPS 0.78 0.70 0.70 0.70Book value 8.34 8.08 8.05 8.07
Key forecast drivers
Year to 12/2009a 12/2010e 12/2011e 12/2012e
DT Revenues 64,639 62,317 60,787 60,630DT EBITDA adjusted 20,668 19,555 19,059 19,098DT EBIT adjusted 9,143 8,414 8,576 8,683DT Net income adjusted 5,140 4,425 4,279 4,553DT FCF definition 6,969 6,245 6,321 6,414
Valuation data
Year to 12/2009a 12/2010e 12/2011e 12/2012e
EV/sales 1.4 1.5 1.5 1.5EV/EBITDA 4.5 5.2 5.1 5.0EV/IC 0.9 1.0 1.0 1.1PE* 12.4 14.4 14.5 13.2P/Book value 1.2 1.2 1.2 1.2FCF yield (%) 12.5 10.6 9.6 9.9Dividend yield (%) 7.9 7.1 7.1 7.1
Note: * = Based on HSBC EPS (fully diluted)
Issuer information
Share price (EUR) 9.90 Target price (EUR) 9.50 Potent'l return (%) -4.0
Reuters (Equity) DTEGn.DE Bloomberg (Equity) DTE GRMarket cap (USDm) 57,976 Market cap (EURm) 42,781Free float (%) 63 Enterprise value (EURm) 94126Country Germany Sector Diversified TelecomsAnalyst Dominik Klarmann Contact +49 211 910 2769
Price relative
6789
1011121314
2009 2010 2011 2012
67891011121314
Deutsche Telekom Rel to DAX-100
Source: HSBC Note: price at close of 11 Feb 2011

110
Telecoms, Media & Technology – Equity 16 February 2011
abc
eAccess (Overweight (V), TP 79,000) Fixed line connectivity
Following the ‘business combination’ of July
2010, the fixed-assets of eAccess were
incorporated into eMobile in a reverse acquisition.
The DSL business comprises 42% of overall
revenues, but mobile is the growth driver. eAccess
primarily provides DSL connectivity on a
wholesale basis to ISPs, but also offers bundled
wireline products with eMobile wireless
broadband packages. We expect DSL revenues
and subscribers to decline gradually, as a result of
increasing competition (and lower prices) from
fibre providers.
Mobile connectivity
eMobile has been at the vanguard of wireless
broadband service provision in Japan. Launched
in March 2007, it took advantage of capacity
constraints at the larger operators, and slower
speeds at PHS operator Willcom, to corner the
market in wireless broadband. It reached
operating profitability after just 2.5yrs in June
2009, and reached 3m accounts in January 2011.
eMobile ARPU has declined as a result of
increased competition (from WiMAX operator UQ
Communications) and an increasing proportion of
MVNO sales (at lower ARPU and acquisition
costs). However, we expect it to benefit from the
growth in demand for Android smartphones (it
offers models from HTC and Huawei) and also
mobile WiFi: its Pocket WiFi product remains
very popular at c50% of gross additions, fuelled by
growing demand for tablet PCs.
With its late launch of HSPA services, it was able
to take advantage of lower-priced equipment from
Ericsson and Huawei, and built out a high-speed
network at a fraction of the cost of NTT
DoCoMo, which launched services six years
earlier. In December 2010, it launched the first
42Mbps service in Japan, enabling it to compete
with DoCoMo’s ‘Xi’ LTE service.
Fixed line applications
eAccess, as a mostly wholesale DSL supplier, is
less involved in fixed line applications. This is
largely the preserve of its ISP clients – its primary
focus is on maintaining EBITDA trends given
higher levels of customer churn.
Mobile applications
eMobile has refocused its smartphone strategy,
which was initially based around Windows
Mobile. It launched HTC’s Aria Android
smartphone on 17 December 2010, and the Pocket
WiFi S from Huawei in January 2011 – both
feature Android 2.2, and allow full ‘tethering’, or
portable WiFi service. In conjunction with a flat-
rate voice promotion, we believe these initiatives
will help restore sales that suffered in the second
quarter from a lack of new products.
Investment thesis
We believe eMobile’s competitiveness has
improved considerably as a result of the product
launches in the quarter ending December 2010.
The upgrade to 42Mbps, and the launch of both
high and low-end Android smartphones (Aria and
Pocket WiFi S) should enable it to capitalise on
growing consumer demand. We also see upside
for the company as a result of the growth in
demand for tablet PCs: it is the only provider
currently to offer ‘tethering’ or mobile WiFi
services without restriction.
For the eMobile business on a stand-alone basis,
we forecast an EBITDA margin of 28% in FY
March 2011 and 30% in March 2012. In our view,
this business is a case study in the potential
profitability of the stand-alone mobile data
business model.

111
Telecoms, Media & Technology – Equity 16 February 2011
abc
Financials & valuation: eAccess Ltd Overweight (V) Financial statements
Year to 03/2010a 03/2011e 03/2012e 03/2013e
Profit & loss summary (JPYbn)
Revenue 83 184 219 254EBITDA 27 57 83 91Depreciation & amortisation -7 -34 -38 -35Operating profit/EBIT 19 24 45 56Net interest -2 -8 -7 -5PBT 11 13 36 49HSBC PBT 11 16 39 51Taxation -7 -6 -6 -8Net profit 4 7 30 41HSBC net profit 6 9 23 30
Cash flow summary (JPYbn)
Cash flow from operations 15 53 71 78Capex -3 -53 -51 -42Cash flow from investment -4 -53 -51 -42Dividends -4 -4 -3 -3Change in net debt -5 150 -17 -33FCF equity 14 -9 19 36
Balance sheet summary (JPYbn)
Intangible fixed assets 3 10 9 9Tangible fixed assets 16 200 214 221Current assets 46 178 179 181Cash & others 26 100 100 100Total assets 87 409 423 432Operating liabilities 17 43 46 51Gross debt 55 279 262 229Net debt 29 179 162 129Shareholders funds 13 75 103 141Invested capital 21 245 255 260
Ratio, growth and per share analysis
Year to 03/2010a 03/2011e 03/2012e 03/2013e
Y-o-y % change
Revenue -12.1 120.9 19.4 15.7EBITDA 10.6 116.0 45.0 9.7Operating profit 14.1 21.0 96.9 23.0PBT 19.8 176.5 36.2HSBC EPS -47.9 186.6 29.6
Ratios (%)
Revenue/IC (x) 3.4 1.4 0.9 1.0ROIC 46.5 10.6 11.0 12.8ROE 57.4 21.3 26.1 24.7ROA 5.0 4.8 8.4 10.4EBITDA margin 32.0 31.3 38.0 36.0Operating profit margin 22.9 12.6 20.7 22.0EBITDA/net interest (x) 12.5 7.0 11.2 18.6Net debt/equity 220.0 238.1 157.6 91.2Net debt/EBITDA (x) 1.1 3.1 1.9 1.4CF from operations/net debt 51.2 29.3 43.8 60.8
Per share data (JPY)
EPS Rep (fully diluted) 2,864 2,343 8,732 11,846HSBC EPS (fully diluted) 4,496 2,343 6,714 8,704DPS 2,400 600 800 800Book value 8,929 25,428 29,702 40,748
Key forecast drivers
Year to 03/2010a 03/2011e 03/2012e 03/2013e
ADSL Revenue (JPY bn) 71 61 56 55Mobile Revenue (JPY bn) 113 144 172 211ADSL EBITDA (JPY bn) 26 23 21 20Mobile EBITDA (JPY bn) 18 44 63 71Total Operating Profit (JPY bn 19 24 45 56Total Capex (JPY bn) 3 39 51 42
Valuation data
Year to 03/2010a 03/2011e 03/2012e 03/2013e
EV/sales 2.5 1.9 1.5 1.2EV/EBITDA 7.7 6.2 4.1 3.3EV/IC 9.6 1.4 1.3 1.2PE* 11.4 21.9 7.7 5.9P/Book value 5.8 2.0 1.7 1.3FCF yield (%) 8.1 -5.2 10.6 20.6Dividend yield (%) 4.7 1.2 1.6 1.6
Note: * = Based on HSBC EPS (fully diluted)
Issuer information
Share price (JPY) 51400 Target price (JPY) 79000 Potent'l return (%) 54.9
Reuters (Equity) 9427.T Bloomberg (Equity) 9427 JPMarket cap (USDm) 2,135 Market cap (JPYbn) 178Free float (%) 54 Enterprise value (JPYbn) 355Country Japan Sector Diversified TelecomsAnalyst Neale Anderson Contact +852 2996 6716
Price relative
406344563450634556346063465634706347563480634
2009 2010 2011 2012
406344563450634556346063465634706347563480634
eAccess Ltd Rel to TOPIX INDEX
Source: HSBC Note: price at close of 11 Feb 2011

112
Telecoms, Media & Technology – Equity 16 February 2011
abc
France Telecom (Overweight, TP EUR21 Fixed line connectivity
France is the exception rather than the rule in
Europe. Regulation has been effective from the
beginning of 2000: unbundling of the local loop,
together with an ADSL bistream provided by FT
gave Iliad and SFR (after consolidating the
market) enough scale to afford to build their own
access network (FTTH). As a consequence, FT
cannot force altnets to migrate from cheap ULL to
expensive wholesale offers and regain EBITDA
market share as we see in other European
countries. On the other hand, FT does not face a
strong cable (6% broadband market share). We
expect operators to start pushing mass market
distribution of FTTH this year. FT plans to pass
10m homes in 2015 and 15m by 2020 (out of
28m) for a total cost of EUR2.5bn.
On the positive side for FT, the French regulator
(ARCEP) published a list of recommendations to
preserve the neutrality of the net, in September
2010. ARCEP insists on granting operators the
ability to market managed services due to scarcity
alongside internet access, which may create some
revenue opportunities with OTTs in particular. FT
CEO Stephane Richard has been calling for a fair
split of value (and costs) between content
providers and telcos (Les Echos, 18 November
2010). This can be achieved by forcing traffic
generators to pay for the use of the networks. It is
too early to see tangible signs of pricing power in
the business to business area, but we are seeing
some on the retail side: In Q1, Iliad and SFR
increased their pricing for triple play by more than
the VAT increase (we estimate that two-thirds
was not tax related) thanks to new set-top boxes
and new services (unlimited calls to mobile now
included). FT still commands a small premium,
but we think the trend has been favourable for FT.
Mobile connectivity
FT has been introducing caps in France and in
other European countries (UK, Spain) “to
preserve the quality of the network”. Stephane
Richard already warned that FT will move
towards yield management (pricing depending on
the load on the network). We do not believe
Iliad’s entry in the mobile market in 2012 should
disrupt this data pricing trend: Iliad still has to
secure a data roaming agreement first (time to
build its 3G network) and the available wholesale
pricing may reflect the congestion issues.
Fixed line applications
36% of FT’s broadband customer base takes IPTV
services. IPTV’s success was not triggered by
troublesome cable competition but by Iliad’s early
and innovative move into IPTV. FT controls its
box and offer premium content (Orange own TV
channel, but also proposes Canal+ packs). FT
bought 49% of the OTT Dailymotion (second
largest video sharing site behind YouTube) to
build its franchise in aggregation and content
broadcasting.
Mobile applications
Orange is promoting its own mobile applications
such as Orange TV, map services or music
streaming through its partnership with Deezer.
These services are part of the largest contracts but
can also be added as paid options for smaller packs.
Investment thesis
Despite strong domestic competitors, we think FT
has the right network and application strategy. We
think FT may benefit from its large scale (43%
broadband market share in France) to monetise its
network against OTT traffic, but also in mobile,
with the strong data growth across its geography.
FT is also offering a high level of applications in
fixed and mobile. We are Overweight FT, target
price EUR21.

113
Telecoms, Media & Technology – Equity 16 February 2011
abc
Financials & valuation: France Telecom Overweight Financial statements
Year to 12/2009a 12/2010e 12/2011e 12/2012e
Profit & loss summary (EURm)
Revenue 45,944 45,341 45,439 45,165EBITDA 14,794 15,608 15,504 15,460Depreciation & amortisation -6,935 -7,132 -6,807 -6,736Operating profit/EBIT 7,859 8,476 8,697 8,724Net interest -2,299 -1,828 -1,681 -1,518PBT 5,560 6,903 7,475 7,789HSBC PBT 7,161 7,640 7,945 8,159Taxation -2,295 -1,858 -2,242 -2,337Net profit 2,997 5,659 4,634 4,828HSBC net profit 4,537 4,604 4,725 4,842
Cash flow summary (EURm)
Cash flow from operations 13,775 11,727 12,581 11,909Capex -5,659 -5,378 -5,725 -5,967Cash flow from investment -7,031 -5,898 -6,693 -6,379Dividends -3,141 -3,706 -3,708 -3,708Change in net debt -1,918 -3,113 -2,179 -1,822FCF equity 5,316 6,521 5,855 5,639
Balance sheet summary (EURm)
Intangible fixed assets 38,549 39,912 40,780 41,192Tangible fixed assets 24,321 23,153 22,627 22,451Current assets 21,956 10,930 11,765 13,587Cash & others 3,949 2,000 2,835 4,657Total assets 92,044 88,975 90,095 92,165Operating liabilities 20,517 20,670 22,213 23,150Gross debt 37,890 32,828 31,484 31,484Net debt 33,941 30,828 28,649 26,827Shareholders funds 26,021 28,782 29,708 30,827Invested capital 60,360 51,325 50,124 49,423
Ratio, growth and per share analysis
Year to 12/2009a 12/2010e 12/2011e 12/2012e
Y-o-y % change
Revenue -14.1 -1.3 0.2 -0.6EBITDA -19.3 5.5 -0.7 -0.3Operating profit -23.5 7.8 2.6 0.3PBT -23.7 24.2 8.3 4.2HSBC EPS -2.5 1.4 2.6 2.5
Ratios (%)
Revenue/IC (x) 0.8 0.8 0.9 0.9ROIC 9.2 11.1 12.2 12.5ROE 16.9 16.8 16.2 16.0ROA 5.0 7.0 7.1 7.1EBITDA margin 32.2 34.4 34.1 34.2Operating profit margin 17.1 18.7 19.1 19.3EBITDA/net interest (x) 6.4 8.5 9.2 10.2Net debt/equity 118.1 98.1 87.8 78.9Net debt/EBITDA (x) 2.3 2.0 1.8 1.7CF from operations/net debt 40.6 38.0 43.9 44.4
Per share data (EUR)
EPS Rep (fully diluted) 1.13 2.14 1.75 1.82HSBC EPS (fully diluted) 1.71 1.74 1.78 1.83DPS 1.40 1.40 1.40 1.40Book value 9.77 10.87 11.22 11.64
Key forecast drivers
Year to 12/2009a 12/2010e 12/2011e 12/2012e
FT revenue 45,944 45,341 45,439 45,165FT EBITDA 14,794 14,867 14,968 14,867FT EBIT 7,859 8,476 8,697 8,724FT Net Income 2,997 5,659 4,634 4,828FT FCF 8,443 8,055 7,734 6,889
Valuation data
Year to 12/2009a 12/2010e 12/2011e 12/2012e
EV/sales 1.6 1.6 1.5 1.5EV/EBITDA 5.0 4.6 4.5 4.5EV/IC 1.2 1.4 1.4 1.4PE* 9.5 9.3 9.1 8.9P/Book value 1.7 1.5 1.4 1.4FCF yield (%) 13.2 16.0 14.1 13.3Dividend yield (%) 8.6 8.6 8.6 8.6
Note: * = Based on HSBC EPS (fully diluted)
Issuer information
Share price (EUR) 16.24 Target price (EUR) 21.00 Potent'l return (%) 29.3
Reuters (Equity) FTE.PA Bloomberg (Equity) FTE FPMarket cap (USDm) 58,293 Market cap (EURm) 43,015Free float (%) 73 Enterprise value (EURm) 71521Country France Sector Diversified TelecomsAnalyst Nicolas Cote-Colisson Contact 44 20 7991 6826
Price relative
11
13
15
17
19
21
23
25
2009 2010 2011 2012
11
13
15
17
19
21
23
25
France Telecom Rel to SBF-120
Source: HSBC Note: price at close of 11 Feb 2011

114
Telecoms, Media & Technology – Equity 16 February 2011
abc
KPN (OW, TP EUR15) Fixed line connectivity
KPN‘s current fibre households coverage stands at
c15%; it is targeting c60% in the medium term. In
the meantime, KPN is relying on VDSL2 (currently
80% IPTV coverage and 70% HDTV coverage) as
an interim solution to compete with the cable
DOCSIS3.0 alternative. NGA regulation is
favourable in the Netherlands: the Dutch regulator
OPTA is of the view that NGA investments entail an
element of risk and hence regulation should provide
room for the incumbent to earn a return adequate to
the risk inherent in such investment. OPTA has
issued detailed regulation on NGA and laid down
clear tariffs regulation for unbundled fibre access,
therefore removing most of the regulatory risk on
such investment. On the net neutrality side, OPTA
has not expressed any views in public, but we
generally expect it to follow the European
Commission recommendations, which so far have
been pragmatic and in general positive for operators.
Mobile connectivity
KPN has been investing in its networks (fixed and
mobile) with domestic capex/sales ratio of c15% in
the past two years. Even with rapid growth in data
traffic at +130% y-o-y (non-voice revenue as a % of
ARPU was c35% in Q4 2010 and 45% of post-paid
customers have a data product), KPN’s network has
not shown sign of congestion. KPN has proactively
invested in upgrading the network to HSDPA (speed
up to 14.4 Mb/sec), also conducting trials on high
speed LTE (up to 100Mbps). Anticipating the
pressure on the mobile networks, KPN has already
connected close to 60% of its UMTS base station
with fibre.
On mobile data pricing, management has now
delivered on the undertaking that it would migrate to
tiered data plans in the Netherlands by the end of
2010. All iPhone plans come with a data bundle of
either 500MB or 1GB per month. The 1GB per
month data plans cost between EUR45 to EUR110,
depending on the chosen allocation of voice minutes
and texts. KPN’s German operation, E-Plus, has also
announced data plans, with initial caps as low as
50MB; beyond this point, customers have the option
of either accepting a reduced speed or topping up. It
is particularly encouraging to witness a ‘teenager’
(market share in the teens) operator like E-Plus
displaying such a rational stance with tiered pricing
plans.
Fixed line applications
KPN has rapidly expanded its market share to c15%
in cable dominated TV market from 10% two years
ago. KPN provides TV services through a mix of
DVB-T and an IPTV based platform. FTTH, in
combination with the VDSL2 upgrade, have enabled
KPN to make its IPTV offer a real success, which
can be gauged from the fact that IPTV net adds in
2010 have been +155k vs only 17k Digitenne net
adds; now IPTV subs constitute one-quarter of TV
subscribers, up from 10% a year ago.
Mobile applications
KPN has introduced a few mobile applications
and also formed collaboration with some of the
key M2M service providers (machine to machine
communication) to provide a cost effective
comprehensive machine to machine solution.
KPN has also reached an agreement with some
Dutch banks (Rabobank, ING and ABN Amro) to
launch mobile payment services by 2012e.
Investment thesis
Our Overweight rating on KPN is primarily
driven by its strong FCF generation as well as its
policy of 100% distribution of FCF. KPN’s FTTH
strategy with VDSL as an a interim solution and
its transition to tiered data plans from flat rate
plans are steps in the right direction, in our view,
to command pricing power and monetise scarcity.

115
Telecoms, Media & Technology – Equity 16 February 2011
abc
Financials & valuation: KPN Overweight Financial statements
Year to 12/2010a 12/2011e 12/2012e 12/2013e
Profit & loss summary (EURm)
Revenue 13,398 13,423 13,579 13,782EBITDA 5,476 5,472 5,519 5,557Depreciation & amortisation -2,226 -2,229 -2,245 -2,253Operating profit/EBIT 3,250 3,244 3,274 3,304Net interest -903 -763 -726 -726PBT 2,316 2,457 2,531 2,567HSBC PBT 2,299 2,457 2,531 2,567Taxation -516 -595 -612 -619Net profit 1,799 1,861 1,920 1,948HSBC net profit 1,703 1,824 1,882 1,909
Cash flow summary (EURm)
Cash flow from operations 3,808 3,902 4,077 4,133Capex -1,809 -1,846 -1,887 -1,932Cash flow from investment -2,149 -1,746 -1,787 -1,882Dividends -1,152 -1,277 -1,322 -1,363Change in net debt 722 121 0 0FCF equity 2,470 2,256 2,290 2,276
Balance sheet summary (EURm)
Intangible fixed assets 9,755 9,332 8,949 8,570Tangible fixed assets 7,514 7,454 7,379 7,388Current assets 2,870 3,047 3,071 3,101Cash & others 823 1,000 1,000 1,000Total assets 22,737 22,407 21,956 21,604Operating liabilities 4,240 4,302 4,362 4,408Gross debt 12,788 13,086 13,086 13,086Net debt 11,965 12,086 12,086 12,086Shareholders funds 3,500 3,010 2,599 2,276Invested capital 15,076 14,531 14,036 13,650
Ratio, growth and per share analysis
Year to 12/2010a 12/2011e 12/2012e 12/2013e
Y-o-y % change
Revenue -0.8 0.2 1.2 1.5EBITDA 5.5 -0.1 0.9 0.7Operating profit 14.0 -0.2 0.9 0.9PBT 13.8 6.1 3.0 1.4HSBC EPS 10.3 13.2 12.2 7.3
Ratios (%)
Revenue/IC (x) 0.9 0.9 1.0 1.0ROIC 20.0 20.2 21.2 22.0ROE 46.4 56.0 67.1 78.3ROA 10.4 10.8 11.2 11.5EBITDA margin 40.9 40.8 40.6 40.3Operating profit margin 24.3 24.2 24.1 24.0EBITDA/net interest (x) 6.1 7.2 7.6 7.7Net debt/equity 341.9 401.5 465.0 531.0Net debt/EBITDA (x) 2.2 2.2 2.2 2.2CF from operations/net debt 31.8 32.3 33.7 34.2
Per share data (EUR)
EPS Rep (fully diluted) 1.15 1.26 1.41 1.51HSBC EPS (fully diluted) 1.09 1.23 1.38 1.48DPS 0.80 0.89 1.00 1.07Book value 2.24 2.03 1.91 1.77
Key forecast drivers
Year to 12/2010a 12/2011e 12/2012e 12/2013e
Netherland 9,274 9,275 9,339 9,436International mobile 4,181 4,265 4,358 4,467Others -120 -117 -119 -120Group revenues 13,335 13,423 13,579 13,782KPN FCF definition 2,428 2,446 2,635 2,501
Valuation data
Year to 12/2010a 12/2011e 12/2012e 12/2013e
EV/sales 2.3 2.3 2.3 2.2EV/EBITDA 5.6 5.6 5.5 5.5EV/IC 2.0 2.1 2.2 2.2PE* 10.9 9.6 8.6 8.0P/Book value 5.3 5.8 6.2 6.7FCF yield (%) 13.4 12.2 12.4 12.3Dividend yield (%) 6.8 7.5 8.5 9.1
Note: * = Based on HSBC EPS (fully diluted)
Issuer information
Share price (EUR) 11.84 Target price (EUR) 15.00 Potent'l return (%) 26.7
Reuters (Equity) KPN.AS Bloomberg (Equity) KPN NAMarket cap (USDm) 25,233 Market cap (EURm) 18,620Free float (%) 100 Enterprise value (EURm) 30568Country Netherlands Sector Diversified TelecomsAnalyst Luigi Minerva Contact 44 20 7991 6928
Price relative
6789
1011121314
2009 2010 2011 2012
67891011121314
KPN Rel to AEX
Source: HSBC Note: price at close of 11 Feb 2011

116
Telecoms, Media & Technology – Equity 16 February 2011
abc
KT Corp (Overweight, TP KRW60,000) Fixed line connectivity
KT Corp is unusual in that regulatory risk to its
wireline business is relatively low. The
government has no stake in KT (having sold its
final 28% holding in May 2008), and facilities-
based competition is very strong. Total broadband
penetration is approaching 100%, and KT has
c43% of this market. The prevalence of high-
speed broadband infrastructure from the three
main operators means there is little need for KT to
offer unbundled services.
Each operator has deployed a blend of FTTH and
FTTx technology, with KT tending towards fibre
to the home. A blend of FTTx and LAN/VDSL
within the user premises is also common.
Mobile connectivity
Like SoftBank in Japan, KT was the first operator
in Korea to tap into nascent demand for
smartphones when it launched the iPhone in late
November 2009. Since then, 2.7m subscribers, or
17.5% of its subscriber base, have migrated to a
smartphone.
In July 2010, it announced it would replicate the
‘All-in-One’ tariffs offering unlimited data from
SK Telecom. KT has done this reluctantly, but
ultimately could not afford not to match this tariff
from the largest operator in the market. Despite our
preference for tiered data plans that link usage to
revenue, we see substantial upside in the migration
of users from cKRW36,000 ARPU levels to
smartphone tariffs of KRW50,000 and above.
KT continues to leverage the strength of its
network: we see greater upside in 2011 from its
under-utilised WiBro network, which can be used
to create mobile WiFi hotspots for tablet PC users.
The size and location of KT’s WiFi accesspoints
means that it is very advanced in ‘off-loading’
data from the wireless to the wireline network: in
September 2010, 67% of the its mobile data traffic
– around 2,500 Terabytes per month – was
offloaded on to WiFi.
Fixed line applications
KT has been the most aggressive telco operator
developing an IPTV product. It saw subscriptions
increase sharply after adding with satellite content
in 2010, and targets 3m subscribers by end 2011
(from 2m at end 2010). It currently offers 120,000
channels and 90,000 VoD files, and is in
negotiations with key content companies to
further improve its content.
Mobile applications
As for the other Korean and Japanese operators,
KT has focused mainly on creating a local app
store that offers users a familiar, Korean-language
portal to download mobile content. It is not as
aggressive as SK Telecom in sourcing or
developing its own in-house content.
Investment thesis
We believe KT Corp has one of the best mobile
networks in Asia. It is an integrated operator with
an extensive fibre deployment. It has both a
CDMA and WCDMA 3G network, and a largely
unused wireless broadband network (using
WiBro, the Korean variant of WiMAX).
Crucially, compared with SK Telecom, it has a
massive network of WiFi hotspots – KT targets
100,000 by end 2010. This is a legacy of its heavy
deployment in 2000-05, and means that it is able
to offload wireless network traffic in many public
places, relieving the capacity on its wide-area
cellular network.
Management has been active in seeking to
leverage this network, which has helped it gain
revenue market share with the iPhone. It targets
25-30 smartphone launches in 2011.

117
Telecoms, Media & Technology – Equity 16 February 2011
abc
Financials & valuation: KT Corp Overweight Financial statements
Year to 12/2010a 12/2011e 12/2012e 12/2013e
Profit & loss summary (KRWb)
Revenue 20,234 20,648 21,508 21,844EBITDA 4,968 5,429 6,043 6,513Depreciation & amortisation -2,915 -2,895 -2,966 -2,915Operating profit/EBIT 2,053 2,534 3,077 3,598Net interest -378 -362 -235 -108PBT 1,517 2,221 2,911 3,560HSBC PBT 1,742 2,261 2,931 3,580Taxation -345 -466 -625 -784Net profit 1,172 1,756 2,287 2,776HSBC net profit 1,396 1,796 2,307 2,796
Cash flow summary (KRWb)
Cash flow from operations 3,870 4,606 5,200 5,629Capex -3,057 -2,992 -3,068 -3,121Cash flow from investment -3,082 -3,092 -3,178 -3,121Dividends -298 -569 -613 -845Change in net debt 310 -946 -1,409 -1,663FCF equity 813 1,615 2,132 2,508
Balance sheet summary (KRWb)
Intangible fixed assets 1,138 1,138 1,138 1,138Tangible fixed assets 13,948 14,044 14,146 14,352Current assets 6,112 7,490 8,896 10,551Cash & others 935 2,324 3,733 5,396Total assets 24,101 25,575 27,083 28,945Operating liabilities 5,563 5,407 5,242 5,171Gross debt 7,497 7,940 7,940 7,940Net debt 6,562 5,616 4,207 2,544Shareholders funds 11,041 12,183 13,625 15,321Invested capital 14,700 14,941 15,205 15,474
Ratio, growth and per share analysis
Year to 12/2010a 12/2011e 12/2012e 12/2013e
Y-o-y % change
Revenue 6.2 2.0 4.2 1.6EBITDA 19.6 9.3 11.3 7.8Operating profit 98.7 23.4 21.4 16.9PBT 90.3 46.4 31.1 22.3HSBC EPS 136.9 28.6 28.5 21.2
Ratios (%)
Revenue/IC (x) 1.4 1.4 1.4 1.4ROIC 10.9 13.5 16.0 18.3ROE 13.0 15.5 17.9 19.3ROA 6.4 8.6 10.2 11.3EBITDA margin 24.6 26.3 28.1 29.8Operating profit margin 10.1 12.3 14.3 16.5EBITDA/net interest (x) 13.2 15.0 25.7 60.5Net debt/equity 59.4 46.1 30.9 16.6Net debt/EBITDA (x) 1.3 1.0 0.7 0.4CF from operations/net debt 59.0 82.0 123.6 221.3
Per share data (KRW)
EPS Rep (fully diluted) 4,966 7,441 9,692 11,768HSBC EPS (fully diluted) 5,918 7,611 9,776 11,852DPS 2,410 2,600 3,580 4,580Book value 46,795 51,636 57,747 64,935
Valuation data
Year to 12/2010a 12/2011e 12/2012e 12/2013e
EV/sales 0.9 0.8 0.7 0.6EV/EBITDA 3.5 3.0 2.5 2.0EV/IC 1.2 1.1 1.0 0.9PE* 7.0 5.4 4.2 3.5P/Book value 0.9 0.8 0.7 0.6FCF yield (%) 7.6 15.0 19.8 23.3Dividend yield (%) 5.8 6.3 8.7 11.1
Note: * = Based on HSBC EPS (fully diluted)
Issuer information
Share price (KRW) 41,200 Target price (KRW) 60,000 Potent'l return (%) 52
Reuters (Equity) 030200.KS Bloomberg (Equity) 030200 KSMarket cap (USDm) 9,545 Market cap (KRWb) 10,758Free float (%) 78 Enterprise value (KRWb) 16374Country Korea Sector Diversified TelecomsAnalyst Neale Anderson Contact +852 2996 6716
Price relative
18945
23945
28945
33945
38945
43945
48945
53945
2009 2010 2011 2012
18945
23945
28945
33945
38945
43945
48945
53945
KT Corp Rel to KOSPI INDEX
Source: HSBC Note: price at close of 11 Feb 2011

118
Telecoms, Media & Technology – Equity 16 February 2011
abc
Mobily (Overweight, TP SAR71) Mobile connectivity
We view Mobily as the best placed operator in the
MENA region in terms of pricing power for
mobile data. Mobily offers a range of tiered data
plans and an unlimited plan. Fixed line broadband
coverage in Saudi Arabia is limited to a few areas
in big cities like Riyadh, Jeddah and Makkah.
There are no cable operators in Saudi Arabia;
hence, we believe mobile operators will continue
to benefit from the uptake of broadband services.
There is not much price differentiation within
fixed and mobile broadband services, which
should continue to drive the demand for mobile
broadband services in the kingdom. Mobily is the
market leader in the mobile broadband segment
with 60% market share. Hence, it has been able to
command a pricing premium, which is reflected in
its high data ARPU of cUSD55. Pricing has
remained stable in Saudi Arabia for broadband
services unlike other markets like Egypt. Mobily’s
unlimited plan sells at SAR350 per month
(USD96); the 5GB plan sells at SAR 200 per
month (USD55), while 1GB plan sells at SAR100
per month (USD 27). This hasn’t changed since
late 2007 when broadband was introduced in
Saudi Arabia.
We expect the contribution of data to Mobily’s
revenue to grow from 18.3% in 2010 to c29% by
2012e, driven by strong subscriber growth along
with limited ARPU dilution due to its strong
pricing power. Net neutrality or any other form of
intrusive regulation is not a concern for Saudi
telcos. This situation is unlikely to change
significantly in the medium term, in our opinion.
Mobile applications
Services based on news, entertainment and
religious content offer good growth prospects in
Saudi Arabia if mobile operators can develop the
right products at the right price. Also, with the
increase in network coverage and online Arabic
content, wealthier nations like Saudi Arabia
should demonstrate strong broadband uptake in
the coming years, in our view. This has resulted in
high data transmitted over Mobily’s network,
which has increased by 70% y-o-y, registering 85
terabytes/day in 2010 (50TB in 2009 and 19TB in
2008). The growing sales of smart phones and
tablets along with falling PC prices and high
disposable income should play a significant role
in boosting data revenue. Mobily owns Bayanat
Al Oula, which has a licence to offer data services
in the kingdom over fixed line. We see this as an
important platform to offload some network
capacity in dense and high usage area like Riyadh.
Investment thesis
Mobily is a growth story and a good way to gain
exposure to MENA telcos’ growth profile, in our
view. We like Mobily for its broadband-focused
strategy: it is the market leader in this segment,
with a market share of 60% in 2010, despite a
market share of only 39% of overall subs.
Management’s focus is on growth via increases in
broadband utilisation rates and the achievement of
operational efficiency through infrastructure
sharing. We believe Mobily is best positioned to
capture the growing demand for broadband
services, given its growing 3.5G coverage
(currently at 92%). We believe there is a demand
supply gap in Saudi Arabia, which is being served
by Mobily with mobile data card offerings. We
expect the data contribution to revenue to increase
by 1100bp to 29% of revenue by 2012 as it
already has 2.3m broadband subscribers, a figure
we expect to grow to 4.1m by 2012e.
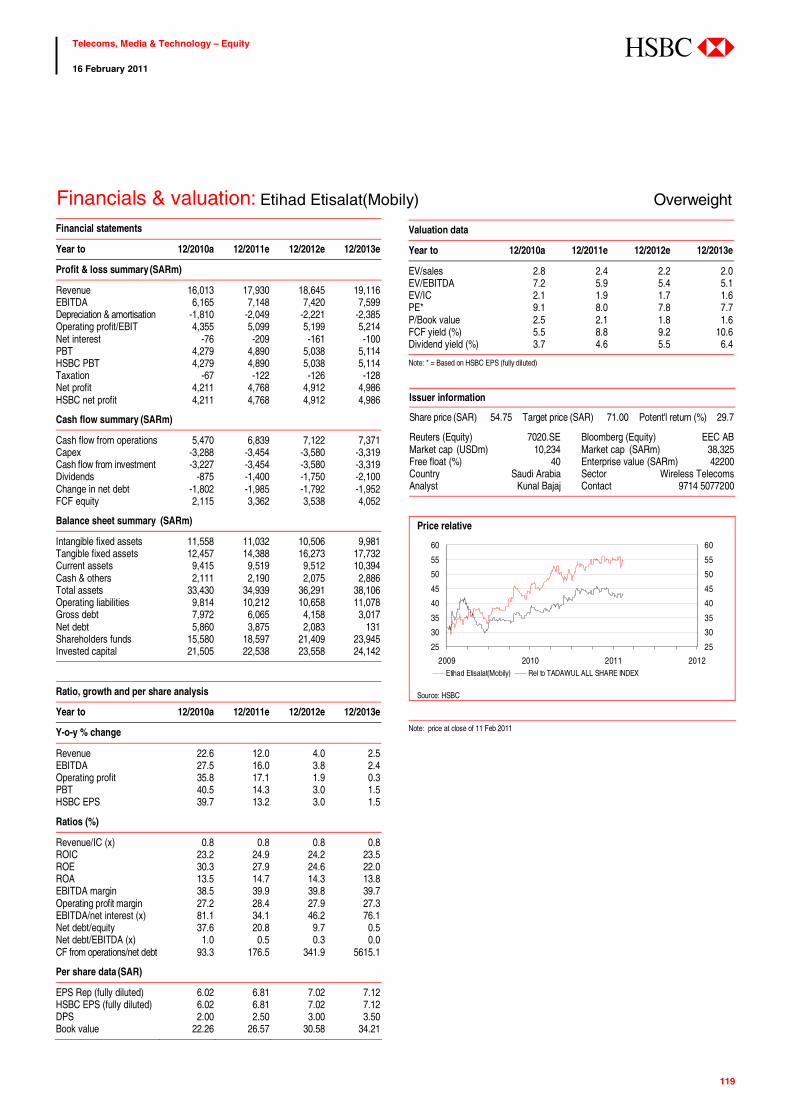
119
Telecoms, Media & Technology – Equity 16 February 2011
abc
Financials & valuation: Etihad Etisalat(Mobily) Overweight Financial statements
Year to 12/2010a 12/2011e 12/2012e 12/2013e
Profit & loss summary (SARm)
Revenue 16,013 17,930 18,645 19,116EBITDA 6,165 7,148 7,420 7,599Depreciation & amortisation -1,810 -2,049 -2,221 -2,385Operating profit/EBIT 4,355 5,099 5,199 5,214Net interest -76 -209 -161 -100PBT 4,279 4,890 5,038 5,114HSBC PBT 4,279 4,890 5,038 5,114Taxation -67 -122 -126 -128Net profit 4,211 4,768 4,912 4,986HSBC net profit 4,211 4,768 4,912 4,986
Cash flow summary (SARm)
Cash flow from operations 5,470 6,839 7,122 7,371Capex -3,288 -3,454 -3,580 -3,319Cash flow from investment -3,227 -3,454 -3,580 -3,319Dividends -875 -1,400 -1,750 -2,100Change in net debt -1,802 -1,985 -1,792 -1,952FCF equity 2,115 3,362 3,538 4,052
Balance sheet summary (SARm)
Intangible fixed assets 11,558 11,032 10,506 9,981Tangible fixed assets 12,457 14,388 16,273 17,732Current assets 9,415 9,519 9,512 10,394Cash & others 2,111 2,190 2,075 2,886Total assets 33,430 34,939 36,291 38,106Operating liabilities 9,814 10,212 10,658 11,078Gross debt 7,972 6,065 4,158 3,017Net debt 5,860 3,875 2,083 131Shareholders funds 15,580 18,597 21,409 23,945Invested capital 21,505 22,538 23,558 24,142
Ratio, growth and per share analysis
Year to 12/2010a 12/2011e 12/2012e 12/2013e
Y-o-y % change
Revenue 22.6 12.0 4.0 2.5EBITDA 27.5 16.0 3.8 2.4Operating profit 35.8 17.1 1.9 0.3PBT 40.5 14.3 3.0 1.5HSBC EPS 39.7 13.2 3.0 1.5
Ratios (%)
Revenue/IC (x) 0.8 0.8 0.8 0.8ROIC 23.2 24.9 24.2 23.5ROE 30.3 27.9 24.6 22.0ROA 13.5 14.7 14.3 13.8EBITDA margin 38.5 39.9 39.8 39.7Operating profit margin 27.2 28.4 27.9 27.3EBITDA/net interest (x) 81.1 34.1 46.2 76.1Net debt/equity 37.6 20.8 9.7 0.5Net debt/EBITDA (x) 1.0 0.5 0.3 0.0CF from operations/net debt 93.3 176.5 341.9 5615.1
Per share data (SAR)
EPS Rep (fully diluted) 6.02 6.81 7.02 7.12HSBC EPS (fully diluted) 6.02 6.81 7.02 7.12DPS 2.00 2.50 3.00 3.50Book value 22.26 26.57 30.58 34.21
Valuation data
Year to 12/2010a 12/2011e 12/2012e 12/2013e
EV/sales 2.8 2.4 2.2 2.0EV/EBITDA 7.2 5.9 5.4 5.1EV/IC 2.1 1.9 1.7 1.6PE* 9.1 8.0 7.8 7.7P/Book value 2.5 2.1 1.8 1.6FCF yield (%) 5.5 8.8 9.2 10.6Dividend yield (%) 3.7 4.6 5.5 6.4
Note: * = Based on HSBC EPS (fully diluted)
Issuer information
Share price (SAR) 54.75 Target price (SAR) 71.00 Potent'l return (%) 29.7
Reuters (Equity) 7020.SE Bloomberg (Equity) EEC ABMarket cap (USDm) 10,234 Market cap (SARm) 38,325Free float (%) 40 Enterprise value (SARm) 42200Country Saudi Arabia Sector Wireless TelecomsAnalyst Kunal Bajaj Contact 9714 5077200
Price relative
25
30
35
40
45
50
55
60
2009 2010 2011 2012
25
30
35
40
45
50
55
60
Etihad Etisalat(Mobily) Rel to TADAWUL ALL SHARE INDEX
Source: HSBC Note: price at close of 11 Feb 2011

120
Telecoms, Media & Technology – Equity 16 February 2011
abc
MTN (Overweight, TP ZAR148) Mobile connectivity
MTN is well placed in terms of pricing power on
mobile data. All the mobile operators in Africa
currently offer tiered data plans. Even if a data
plan is marketed as an “unlimited” plan, in reality
the plan is not truly unlimited. There is no “all
you can eat” data plan currently, which gives
significant pricing power to the mobile operators.
The lack of fixed line alternatives necessitates the
use of mobile phones and USB modems to access
data. Satellite-based broadband is very expensive
and is unlikely to be a threat in the African
markets. Competition from fixed line operators is
limited as these suffer from a lack of network
coverage and proper distribution systems.
MTN is making attempts to monetise the data
growth potential in Africa. Data usage in South
Africa has increased 49% since December 2009,
with its data revenue increasing 42% y-o-y in H1
2010. Even more impressive is the 58% y-o-y
growth in non-SMS data revenue, which accounted
for 11% of its South African service revenue.
Data usage is increasing across most of its
operations and has started contributing to top-line
growth. Among its larger operations, Nigeria
currently has the lowest proportion of revenue
(4.2%) coming from data services, because of a
lack of required bandwidth. With the landing of
various submarine cables in Africa, we expect the
capacity bottleneck to be removed soon. This
should, in our view, allow MTN to begin to capture
the vast growth potential for data usage in Nigeria.
We believe the risks to MTN’s pricing power are
quite limited and unlikely to be significant in the
near to medium term. However, the risks from the
entry of a credible new entrant (particularly
Bharti) cannot be ignored. As we have witnessed
in the Kenyan voice market, Bharti can be quite
aggressive in pricing. If a similar sort of risk
materialises in the data services, it would hurt
MTN. This is, however, unlikely in the near term,
particularly in data segment, as Bharti will need
large capex to build sufficient capacity to meet the
growing demand.
Mobile applications
So far, MTN has been able to maintain a relatively
good grip on content, data applications and VAS
thanks to its advantages in terms of familiarity with
the local culture. We expect low-cost smartphones
based on the Android platform to drive internet
usage in Africa. However, language could present a
barrier to would-be developed world competitors.
Hence, we believe MTN would not be dis-
intermediated from the applications layer.
Mobile payment services have achieved
considerable success in Africa as most of the
countries here have a large unbanked population.
MTN’s mobile payment service, Mobile Money,
is showing a good take-up in countries where it
has been launched. For instance, MTN Uganda
has almost 16% of its subscriber base already
using the service. MTN has c2.2m mobile
payment subs across its operations. We reiterate
our thematic view (Assessing new growth
opportunities, 25 January 2010) that, over the
medium term, mobile payments will contribute
approximately 6% of revenue at a margin of
around 20% for African mobile operators.
Investment thesis
MTN’s is a strong growth story in the CEEMEA
telecoms universe, as one of the fastest-growing
telcos in the region, in our view. We are also
bullish on the data usage growth potential in Africa
as the affordability barrier and capacity bottlenecks
are removed. Despite the increasing competition
across its markets, we find it well positioned to
compete within the changing competitive
environment with a focus on cost management.
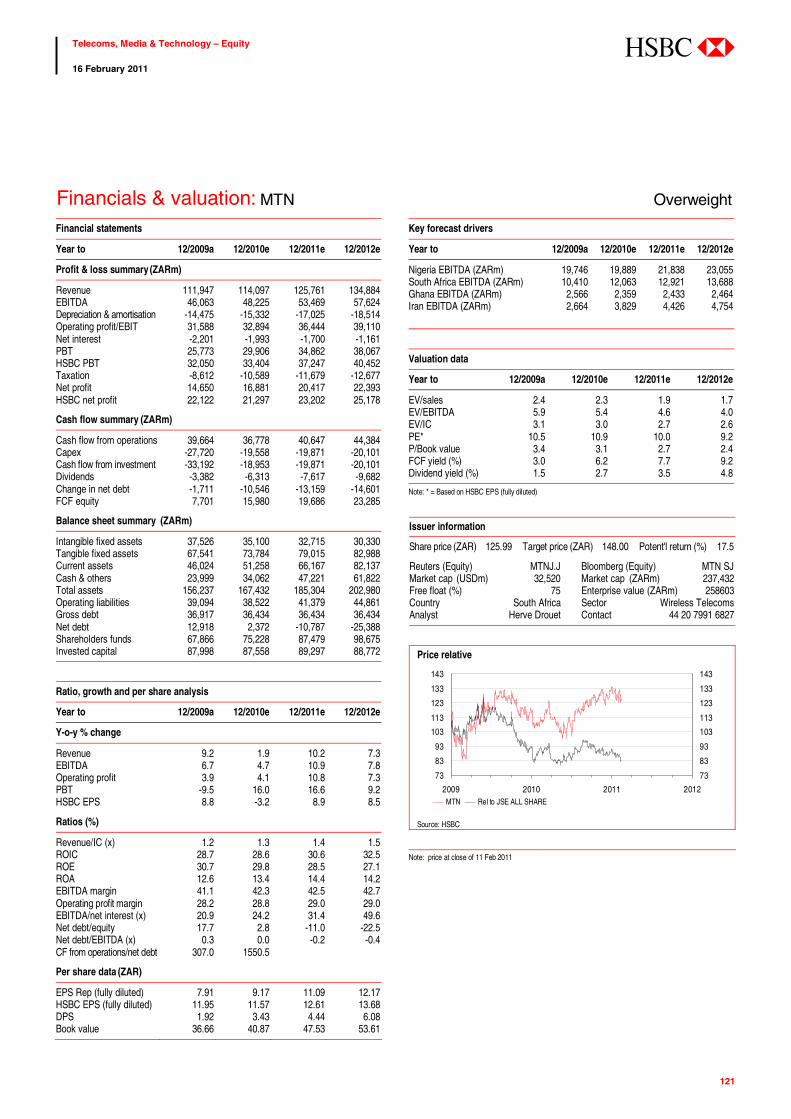
121
Telecoms, Media & Technology – Equity 16 February 2011
abc
Financials & valuation: MTN Overweight Financial statements
Year to 12/2009a 12/2010e 12/2011e 12/2012e
Profit & loss summary (ZARm)
Revenue 111,947 114,097 125,761 134,884EBITDA 46,063 48,225 53,469 57,624Depreciation & amortisation -14,475 -15,332 -17,025 -18,514Operating profit/EBIT 31,588 32,894 36,444 39,110Net interest -2,201 -1,993 -1,700 -1,161PBT 25,773 29,906 34,862 38,067HSBC PBT 32,050 33,404 37,247 40,452Taxation -8,612 -10,589 -11,679 -12,677Net profit 14,650 16,881 20,417 22,393HSBC net profit 22,122 21,297 23,202 25,178
Cash flow summary (ZARm)
Cash flow from operations 39,664 36,778 40,647 44,384Capex -27,720 -19,558 -19,871 -20,101Cash flow from investment -33,192 -18,953 -19,871 -20,101Dividends -3,382 -6,313 -7,617 -9,682Change in net debt -1,711 -10,546 -13,159 -14,601FCF equity 7,701 15,980 19,686 23,285
Balance sheet summary (ZARm)
Intangible fixed assets 37,526 35,100 32,715 30,330Tangible fixed assets 67,541 73,784 79,015 82,988Current assets 46,024 51,258 66,167 82,137Cash & others 23,999 34,062 47,221 61,822Total assets 156,237 167,432 185,304 202,980Operating liabilities 39,094 38,522 41,379 44,861Gross debt 36,917 36,434 36,434 36,434Net debt 12,918 2,372 -10,787 -25,388Shareholders funds 67,866 75,228 87,479 98,675Invested capital 87,998 87,558 89,297 88,772
Ratio, growth and per share analysis
Year to 12/2009a 12/2010e 12/2011e 12/2012e
Y-o-y % change
Revenue 9.2 1.9 10.2 7.3EBITDA 6.7 4.7 10.9 7.8Operating profit 3.9 4.1 10.8 7.3PBT -9.5 16.0 16.6 9.2HSBC EPS 8.8 -3.2 8.9 8.5
Ratios (%)
Revenue/IC (x) 1.2 1.3 1.4 1.5ROIC 28.7 28.6 30.6 32.5ROE 30.7 29.8 28.5 27.1ROA 12.6 13.4 14.4 14.2EBITDA margin 41.1 42.3 42.5 42.7Operating profit margin 28.2 28.8 29.0 29.0EBITDA/net interest (x) 20.9 24.2 31.4 49.6Net debt/equity 17.7 2.8 -11.0 -22.5Net debt/EBITDA (x) 0.3 0.0 -0.2 -0.4CF from operations/net debt 307.0 1550.5
Per share data (ZAR)
EPS Rep (fully diluted) 7.91 9.17 11.09 12.17HSBC EPS (fully diluted) 11.95 11.57 12.61 13.68DPS 1.92 3.43 4.44 6.08Book value 36.66 40.87 47.53 53.61
Key forecast drivers
Year to 12/2009a 12/2010e 12/2011e 12/2012e
Nigeria EBITDA (ZARm) 19,746 19,889 21,838 23,055South Africa EBITDA (ZARm) 10,410 12,063 12,921 13,688Ghana EBITDA (ZARm) 2,566 2,359 2,433 2,464Iran EBITDA (ZARm) 2,664 3,829 4,426 4,754
Valuation data
Year to 12/2009a 12/2010e 12/2011e 12/2012e
EV/sales 2.4 2.3 1.9 1.7EV/EBITDA 5.9 5.4 4.6 4.0EV/IC 3.1 3.0 2.7 2.6PE* 10.5 10.9 10.0 9.2P/Book value 3.4 3.1 2.7 2.4FCF yield (%) 3.0 6.2 7.7 9.2Dividend yield (%) 1.5 2.7 3.5 4.8
Note: * = Based on HSBC EPS (fully diluted)
Issuer information
Share price (ZAR) 125.99 Target price (ZAR) 148.00 Potent'l return (%) 17.5
Reuters (Equity) MTNJ.J Bloomberg (Equity) MTN SJMarket cap (USDm) 32,520 Market cap (ZARm) 237,432Free float (%) 75 Enterprise value (ZARm) 258603Country South Africa Sector Wireless TelecomsAnalyst Herve Drouet Contact 44 20 7991 6827
Price relative
73
83
93
103
113
123
133
143
2009 2010 2011 2012
73
83
93
103
113
123
133
143
MTN Rel to JSE ALL SHARE
Source: HSBC Note: price at close of 11 Feb 2011
122
Telecoms, Media & Technology – Equity 16 February 2011
abc
Mobile Telesystems (Overweight, TP USD29) Fixed line connectivity
MTS’ recent acquisition of a controlling stake in
Comstar has opened up new horizons in the fixed
line space. Comstar has been seen historically as a
local player in Moscow, but MTS’s nationwide
presence gives access to the regions of Russia. We
expect Comstar to benefit from rolling out its
broadband offering to existing MTS mobile
subscribers. It is well positioned in terms of pricing
power on data services as tariffs are data tiered.
There are no “all you can eat” data packages.
There are some substitutes to deliver broadband but
those are relatively limited. There are some small
regional cable operators but these have limited scale
and financial power to upgrade their cable network.
Substitution from fixed regional operators is also
limited at the moment. Absence of regulations on
net neutrality is positive for incumbents. Local loop
unbundling by altnets is yet to be allowed in Russia.
There have also been cases of private reselling of
connectivity and illegal sharing. The impact, while
potentially significant, would be mitigated as long
as data tariffs remain tiered. Here we would expect
the potential issues with illegal sharing to gradually
fade as the demand for higher speed takes hold.
Mobile connectivity
Growing data demand is pushing mobile
connectivity with the number of 3G USB modems
having now overtaken fixed line broadband
subscribers. MTS is well positioned in terms of
pricing power on mobile data services. In Russia
and CIS countries, tariffs are data tiered. Some
packages are marketed as “unlimited” but in
reality are capacity-limited.
In local currency terms, data traffic revenue
jumped 69% y-o-y in 9M 2010, while total VAS
revenue increased c26% y-o-y (in local currency).
In Q3, VAS (SMS included) amounted to 20.5%
of revenue in Russia (increased 2.1ppt y-o-y),
helped by the expansion of its 3G network and
fast growing data traffic.
We believe pricing power is unlikely to be altered
significantly in the medium term as the
competitive environment has remained quite
rational in Russia.
Fixed line applications
It is plausible that certain OTT competitors will
pose a threat to incumbent IPTV services and
could also challenge well-established brands in
the pay-TV market. However, factors like the
complexities of rights arrangements, power of its
existing brands and absence of net neutrality
regulations would provide significant pricing
power and advantage to incumbents like MTS.
Mobile applications
MTS has been able to maintain a relatively good
grip on content, data applications and VAS thanks
to its advantages in terms of familiarity with the
local culture. Data content already represents c5%
of mobile revenue in Russia, almost matching the
revenue from data traffic excluding SMS. We
expect low-cost smartphones based on the
Android platform to drive internet usage in
Africa. However, language could present a barrier
to would-be developed world competitors. Hence,
we believe MTS would not be dis-intermediated
from the applications layer.
Investment thesis
We are bullish on the data usage growth potential
in Russia. Usage trends are reassuring, with
ARPU growth in local currency terms, driven by
higher voice and data usage. The mobile operators
in Ukraine have shifted their focus to profitability,
while making upward adjustments to tariffs. The
recent trends indicate an improving
macroeconomic outlook in Russia and CIS,
increased usage and recovery in Ukraine.

123
Telecoms, Media & Technology – Equity 16 February 2011
abc
Financials & valuation: Mobile Telesystems Overweight Financial statements
Year to 12/2009a 12/2010e 12/2011e 12/2012e
Profit & loss summary (USDm)
Revenue 9,867 11,170 12,155 13,109EBITDA 4,473 4,932 5,402 5,851Depreciation & amortisation -1,930 -1,964 -2,110 -2,201Operating profit/EBIT 2,543 2,968 3,292 3,650Net interest -467 -722 -572 -528PBT 1,486 2,312 2,720 3,122HSBC PBT 2,162 2,271 2,720 3,122Taxation -505 -517 -626 -718Net profit 1,001 1,627 1,981 2,312HSBC net profit 1,685 1,580 1,981 2,312
Cash flow summary (USDm)
Cash flow from operations 3,596 3,697 4,269 4,644Capex -1,942 -1,989 -2,674 -2,687Cash flow from investment -3,718 -2,042 -2,841 -2,687Dividends -1,262 -496 -958 -1,188Change in net debt 1,739 -622 -469 -768FCF equity 1,578 1,698 1,486 1,864
Balance sheet summary (USDm)
Intangible fixed assets 2,236 2,401 2,401 2,401Tangible fixed assets 7,749 8,441 9,172 9,658Current assets 4,390 3,055 3,243 3,386Cash & others 2,728 960 1,000 1,000Total assets 15,749 14,390 15,309 15,938Operating liabilities 2,256 3,011 3,452 3,833Gross debt 8,349 5,959 5,530 4,762Net debt 5,621 4,999 4,530 3,762Shareholders funds 3,330 3,601 4,394 5,318Invested capital 9,391 9,926 10,363 10,611
Ratio, growth and per share analysis
Year to 12/2009a 12/2010e 12/2011e 12/2012e
Y-o-y % change
Revenue -17.1 13.2 8.8 7.8EBITDA -23.5 10.3 9.5 8.3Operating profit -30.3 16.7 10.9 10.9PBT -49.3 55.6 17.6 14.8HSBC EPS -32.2 -7.7 25.4 16.7
Ratios (%)
Revenue/IC (x) 1.1 1.2 1.2 1.2ROIC 21.9 23.7 25.0 26.8ROE 40.9 45.6 49.6 47.6ROA 9.3 16.0 17.2 18.1EBITDA margin 45.3 44.2 44.4 44.6Operating profit margin 25.8 26.6 27.1 27.8EBITDA/net interest (x) 9.6 6.8 9.4 11.1Net debt/equity 129.2 108.3 82.1 57.5Net debt/EBITDA (x) 1.3 1.0 0.8 0.6CF from operations/net debt 64.0 74.0 94.2 123.5
Per share data (USD)
EPS Rep (fully diluted) 1.06 1.70 2.07 2.41HSBC EPS (fully diluted) 1.79 1.65 2.07 2.41DPS 1.00 1.00 1.24 1.45Book value 3.53 3.76 4.58 5.55
Key forecast drivers
Year to 12/2009a 12/2010e 12/2011e 12/2012e
Russia subscribers (000s) 69,342 70,192 72,214 73,982Russia ARPU (USD) 7.8 8.4 8.9 9.4Ukraine subscribers (000s) 17,564 18,313 19,206 19,979Ukraine ARPU (USD) 4.7 4.9 5.2 5.5
Valuation data
Year to 12/2009a 12/2010e 12/2011e 12/2012e
EV/sales 2.5 2.2 2.0 1.8EV/EBITDA 5.6 4.9 4.4 4.0EV/IC 2.7 2.5 2.3 2.2PE* 11.1 12.0 9.6 8.2P/Book value 5.6 5.3 4.3 3.6FCF yield (%) 8.2 8.8 7.7 9.6Dividend yield (%) 5.1 5.1 6.3 7.3
Note: * = Based on HSBC EPS (fully diluted)
Issuer information
Share price (USD) 19.77 Target price (USD) 29.00 Potent'l return (%) 46.7
Reuters (Equity) MBT.N Bloomberg (Equity) MBT USMarket cap (USDm) 19,704 Market cap (USDm) 19,704Free float (%) 44 Enterprise value (USDm) 24327Country Russian Federation Sector Diversified TelecomsAnalyst Herve Drouet Contact 44 20 7991 6827
Price relative
4
9
14
19
24
29
2009 2010 2011 2012
4
9
14
19
24
29
Mobile Telesystems Rel to RTS INDEX
Source: HSBC Note: price at close of 11 Feb 2011

124
Telecoms, Media & Technology – Equity 16 February 2011
abc
NTT DoCoMo (Overweight, TP JPY172,000) Mobile connectivity
We forecast smartphones as a proportion of
DoCoMo handset users to grow from 2.3% at end
2010 to 14% by end 2011, with these users
tending to spend more as they begin to measure
data usage in megabytes, rather than kilobytes.
A DoCoMo study of Sony Ericsson Xperia users
found they spent JPY2,100 more per month after
upgrading – while this amount will decline, the
trend is indicative.
A further positive for DoCoMo is its network
strength. It has invested consistently in its
network, and its strength here is in strong contrast
to SoftBank, which is struggling to manage strong
data demand from its iPhone users.
Expectations regarding data tariff levels are
ingrained: unlike in the US and Europe, c40% of
Japanese users already subscribe to some form of
tiered data plan. This makes it difficult for the
Japanese operators to shift to a pay-per-usage
model at the high-end – at least for 3G.
However, all operators have flagged the migration
to LTE as a chance to change this. Subscribers to
DoCoMo’s ‘Xi’ (pronounced ‘Crossy’) LTE
service launched in December 2010 will pay
JPY2,500 (USD30) for each 2GB of usage
beyond the 5GB tier (which costs a hefty
JPY8,700, or USD104).
Mobile applications
Each of the Japanese operators is focusing on
building a local suite of applications and services
that ensure continuity in the smartphone era with
services their customers were using before, on
more proprietary platforms such as DoCoMo’s
iMode. Within the ‘DoCoMo market’ subscribers
can choose between an app store, a music store
(with c1m titles) and a book store (which had
recorded 1.5m downloads by December 2010).
Part of the delay in launching Android-based
phones for both DoCoMo and KDDI has been a
result of their desire to integrate native Japanese
applications (such as e-wallet) services, with the
Android platform as shipped by the vendor.
Investment thesis
In our view, NTT DoCoMo is well-placed to
benefit from surging demand for smartphones in
Japan. This is coming from a very low base: just
c2.3% of DoCoMo users had smartphones at end
December 2010 – a result of the dominance of
domestic vendors, who (as in Korea) have been
late to produce smartphones. As a result,
DoCoMo performed poorly relative to SoftBank
in 2009 and 2010: as the sole supplier of the
iPhone this operator had c80% of market
smartphone subscribers at September 2010.
With the launch of Android-based smartphones in
the last quarter of 2010, NTT DoCoMo has seen
strong sales. It raised its smartphone sales target
to 2.5m for FY March 2011 (originally set at
1.3m), and saw ‘strong demand’ in December and
January. We see its network strength as a strong
positive: users are increasingly aware of the
disparity between different networks, a strong
benefit to DoCoMo as the breadth and depth of its
smartphone portfolio improves.
While we see little strategic benefit from
DoCoMo’s early launch of LTE, we see minimal
downside: unlike its early move to 3G, DoCoMo
will spend a relatively low proportion of its capex
on LTE. We project capex as a proportion of sales
to remain constant at c15%. NTT is our top pick
in the Japanese telecoms sector.

125
Telecoms, Media & Technology – Equity 16 February 2011
abc
Financials & valuation: NTT DoCoMo Inc. Overweight Financial statements
Year to 03/2010a 03/2011e 03/2012e 03/2013e
Profit & loss summary (JPYb)
Revenue 4,284 4,249 4,354 4,595EBITDA 1,573 1,614 1,652 1,730Depreciation & amortisation -735 -731 -716 -707Operating profit/EBIT 838 883 937 1,023Net interest -4 -4 -4 -3PBT 839 874 929 1,016HSBC PBT 863 931 969 1,056Taxation -338 -355 -379 -416Net profit 499 517 548 597HSBC net profit 507 548 570 621
Cash flow summary (JPYb)
Cash flow from operations 1,183 990 1,251 1,295Capex -726 -715 -665 -700Cash flow from investment -1,164 -722 -665 -700Dividends -209 -216 -220 -224Change in net debt -36 45 -354 -372FCF equity 488 539 601 598
Balance sheet summary (JPYb)
Intangible fixed assets 198 209 209 209Tangible fixed assets 3,236 3,214 3,204 3,237Current assets 2,061 2,220 2,597 3,005Cash & others 761 773 1,142 1,514Total assets 6,757 6,895 7,258 7,694Operating liabilities 1,007 944 969 1,036Gross debt 762 820 836 836Net debt 1 47 -307 -679Shareholders funds 4,636 4,801 5,113 5,477Invested capital 3,728 3,926 3,899 3,900
Ratio, growth and per share analysis
Year to 03/2010a 03/2011e 03/2012e 03/2013e
Y-o-y % change
Revenue -3.7 -0.8 2.5 5.5EBITDA -6.3 2.6 2.4 4.7Operating profit 0.9 5.4 6.1 9.2PBT 7.6 4.1 6.3 9.4HSBC EPS 7.2 4.0 6.2 9.0
Ratios (%)
Revenue/IC (x) 1.2 1.1 1.1 1.2ROIC 14.2 14.4 14.7 16.1ROE 11.3 11.6 11.5 11.7ROA 7.6 7.6 7.8 8.1EBITDA margin 36.7 38.0 38.0 37.7Operating profit margin 19.6 20.8 21.5 22.3EBITDA/net interest (x) 417.0 438.6 429.3 507.4Net debt/equity 0.0 1.0 -6.0 -12.3Net debt/EBITDA (x) 0.0 0.0 -0.2 -0.4CF from operations/net debt 94625.4 2121.9
Per share data (JPY)
EPS Rep (fully diluted) 11,947 12,422 13,197 14,383HSBC EPS (fully diluted) 11,947 12,422 13,197 14,383DPS 5,200 5,200 5,400 5,600Book value 111,063 115,404 123,118 131,902
Valuation data
Year to 03/2010a 03/2011e 03/2012e 03/2013e
EV/sales 1.4 1.4 1.3 1.2EV/EBITDA 3.9 3.8 3.5 3.1EV/IC 1.6 1.6 1.5 1.4PE* 12.6 12.2 11.4 10.5P/Book value 1.4 1.3 1.2 1.1FCF yield (%) 8.0 8.9 9.9 9.8Dividend yield (%) 3.4 3.4 3.6 3.7
Note: * = Based on HSBC EPS (fully diluted)
Issuer information
Share price (JPY) 151100 Target price (JPY) 172000 Potent'l return (%) 17.2
Reuters (Equity) 9437.T Bloomberg (Equity) 9437 JPMarket cap (USDm) 79,358 Market cap (JPYb) 6,617Free float (%) 35 Enterprise value (JPYb) 6121Country Japan Sector Wireless TelecomsAnalyst Neale Anderson Contact +852 2996 6716
Price relative
111668
121668
131668
141668
151668
161668
171668
181668
2009 2010 2011 2012
111668
121668
131668
141668
151668
161668
171668
181668
NTT DoCoMo Inc. Rel to TOPIX INDEX
Source: HSBC Note: price at close of 11 Feb 2011

126
Telecoms, Media & Technology – Equity 16 February 2011
abc
Portugal Telecom (Neutral, TP EUR9) Fixed line connectivity
PT currently covers 1m homes (c20%) with its
FTTH and has plans to raise this to 1.6m homes in
the medium term. In our view, the regulator’s
stance on fibre is beneficial for PT as it aims to
ensure transparent legislation that promotes
investment in NGA, while at the same time
safeguarding a return for operators and conditions
for sustainable competition. On the net neutrality
side, regulator Anacom has not expressed any
views in public, but we believe it is likely to
follow the European Union framework;
considering the EU’s pragmatic stance this should
be favourable for PT.
Mobile connectivity
PT has been investing in its networks with a
mobile capex/sales ratio of c12% over the past
four years and has the best 3G coverage of 93% in
Portugal vs 92% and 86% for the second and third
operators, respectively. TMN experienced a
relatively rapid take-up of data services, which can
be gauged from the fact that TMN’s mobile
broadband now has 3x the number of broadband
customers it had two years back. Anticipating the
rise of data traffic, PT is conducting trials on high
speed LTE and has connected 85% of its cell sites
with fibre.
On mobile data pricing, management has migrated
to tiered data plans. TMN has some basic data
plans with data cap at 600MB per month but it has
continued with its unlimited data plans priced at
EUR100/month (it comes with a voice and text
bundle with a fair usage policy of 5,000 voice
minutes, 5,000 text message, unlimited WiFi and
5GB internet). On the iPad it has an unlimited data
plan for a price of EUR29.9.
Fixed line applications
PT has rapidly expanded its market share to
currently c27% of the Portuguese pay-TV market
from a greenfield operation started in H2 2007. PT
provides TV services through a mix of IPTV and
DTH based platforms. PT’s TV customers
constitute almost 80% of its broadband subscriber
base, which is one of the highest among the
European incumbents. Success of its TV strategy
is also reflected in the top-line performance of its
fixed division; which is likely to post positive
revenue growth two years in a row.
Mobile applications
PT has made some attempts to enter the
application space. First, TMN has launched Meo
mobile, which makes available 40 TV channels
with innovative features such as wireless remote
recording and sms alerts. Second, TMN has
launched its own application store with sports,
news, entertainment, games, books and utility
applications available to its customers. This
application store leverages on PT’s portal Sapo,
the most popular portal in Portugal. Third, PT has
introduced an aggregation service that enables
access to multiple personal accounts, aggregation
of social network accounts in a single place,
simultaneous posts in multiple accounts and
sharing of photos and videos.
Investment thesis
PT’s investment in FTTH, investment in fibre
backhaul to support mobile traffic and its
successful IPTV strategy remain the key positives,
but, in our opinion, are fully priced in at the
current trading price. PT is currently trading at a
10% premium to the 2011e sector EV/EBITDA
multiple. Hence, we are Neutral on Portugal
Telecom with a EUR9 price target (including
EUR0.65 of expected special dividend).

127
Telecoms, Media & Technology – Equity 16 February 2011
abc
Financials & valuation: Portugal Telecom Neutral Financial statements
Year to 12/2009a 12/2010e 12/2011e 12/2012e
Profit & loss summary (EURm)
Revenue 6,785 5,585 5,933 6,766EBITDA 2,502 2,051 2,275 2,559Depreciation & amortisation -1,527 -1,254 -1,071 -1,128Operating profit/EBIT 975 797 1,204 1,431Net interest -302 -245 -186 -244PBT 1,021 5,993 1,175 1,353HSBC PBT 951 797 1,267 1,431Taxation -233 -148 -299 -343Net profit 685 5,699 750 865HSBC net profit 624 480 842 942
Cash flow summary (EURm)
Cash flow from operations 1,612 1,548 1,719 1,678Capex -1,268 -967 -989 -1,051Cash flow from investment -871 4,462 -2,664 -1,051Dividends -504 -1,380 -1,139 -569Change in net debt -25 -5,157 4,132 -58FCF equity 706 700 801 797
Balance sheet summary (EURm)
Intangible fixed assets 4,047 1,080 4,436 4,436Tangible fixed assets 4,862 3,635 5,641 5,624Current assets 3,699 4,896 4,043 4,168Cash & others 1,500 1,500 1,500 1,500Total assets 14,831 11,103 16,393 16,556Operating liabilities 2,904 2,237 2,751 2,812Gross debt 7,046 1,890 6,022 5,964Net debt 5,547 390 4,522 4,464Shareholders funds 1,318 3,594 3,775 4,053Invested capital 8,204 5,874 9,869 9,916
Ratio, growth and per share analysis
Year to 12/2009a 12/2010e 12/2011e 12/2012e
Y-o-y % change
Revenue 1.0 -17.7 6.2 14.0EBITDA 0.9 -18.0 10.9 12.5Operating profit -16.5 -18.2 51.0 18.8PBT 10.0 487.2 -80.4 15.2HSBC EPS -7.3 -23.1 75.5 11.9
Ratios (%)
Revenue/IC (x) 0.9 0.8 0.8 0.7ROIC 10.8 9.7 12.4 11.5ROE 80.4 19.5 22.9 24.1ROA 7.3 47.1 7.7 7.5EBITDA margin 36.9 36.7 38.4 37.8Operating profit margin 14.4 14.3 20.3 21.2EBITDA/net interest (x) 8.3 8.4 12.2 10.5Net debt/equity 232.6 10.4 113.2 103.1Net debt/EBITDA (x) 2.2 0.2 2.0 1.7CF from operations/net debt 29.1 397.2 38.0 37.6
Per share data (EUR)
EPS Rep (fully diluted) 0.78 6.51 0.86 0.99HSBC EPS (fully diluted) 0.71 0.55 0.96 1.08DPS 0.57 2.30 0.65 0.67Book value 1.50 4.10 4.31 4.63
Key forecast drivers
Year to 12/2009a 12/2010e 12/2011e 12/2012e
Domestic fixed 1,948 1,949 1,969 1,979Domestic mobile 1,518 1,399 1,337 1,316Vivo 3,138 1,885 0 0Telemar 0 0 2,234 3,067Others 181 352 392 404Group revenues 6,785 5,585 5,933 6,766
Valuation data
Year to 12/2009a 12/2010e 12/2011e 12/2012e
EV/sales 2.3 1.9 2.5 2.1EV/EBITDA 6.3 5.1 6.4 5.6EV/IC 1.9 1.8 1.5 1.5PE* 12.0 15.7 8.9 8.0P/Book value 5.7 2.1 2.0 1.9FCF yield (%) 7.0 7.0 8.0 8.0Dividend yield (%) 6.7 26.8 7.6 7.8
Note: * = Based on HSBC EPS (fully diluted)
Issuer information
Share price (EUR) 8.58 Target price (EUR) 9.00 Potent'l return (%) 4.9
Reuters (Equity) PTC.LS Bloomberg (Equity) PTC PLMarket cap (USDm) 10,423 Market cap (EURm) 7,691Free float (%) 90 Enterprise value (EURm) 10464Country Portugal Sector Diversified TelecomsAnalyst Luigi Minerva Contact 44 20 7991 6928
Price relative
4
5
6
7
8
9
10
11
2009 2010 2011 2012
4
5
6
7
8
9
10
11
Portugal Telecom Rel to PSI 20
Source: HSBC Note: price at close of 11 Feb 2011
128
Telecoms, Media & Technology – Equity 16 February 2011
abc
Saudi Telecom Company (Overweight, TP SAR48) Fixed line connectivity
STC is the incumbent telecom service provider in
Saudi Arabia, currently operating in a duopoly
environment in the fixed line space. However,
while the second fixed line operator, Etihad
Etheeb, has recently started operations, it has not
invested in its network because of balance sheet
constraints, giving STC still 98% market share in
fixed voice. There are no substitutes to deliver
broadband in Saudi Arabia on fixed line ( no cable,
altnets etc) and mobile broadband (dongles, USBs)
are the only alternative to fixed line broadband for
the customers. VOIP is banned in Saudi Arabia,
meaning internet is not a direct substitute for voice
services. Absence of regulations on net neutrality is
positive for incumbents. Local loop unbundling by
altnets is yet to be allowed in Saudi Arabia. STC
currently has around 85,000 km of fibre cable in the
country and the DSL penetration is only 32% of
households. Pricing is not a differentiating factor,
with a 2Mbps fixed broadband for unlimited data
plan cost of around SAR221, which is 10% higher
than mobile broadband for 2GB usage cap.
Mobile connectivity
There are around 4m mobile broadband users in
Saudi Arabia compared with 1.5m fixed
broadband users. STC is well positioned in terms
of pricing power on mobile data services, as is
Mobily. Pricing has remained stable in Saudi
Arabia for broadband services, unlike other
markets like Egypt.
Fixed line applications
The Saudi Arabian media market is unregulated
and the mass medium of content distribution is
satellite. Around 52% of households in Saudi with
a television are on the satellite platform, with the
rest on terrestrial DTT. STC formally launched
IPTV in August 2010 as “InVision” and has
already started to bundle its services through triple
play offerings of landline, DSL and IPTV.
Mobile applications
STC has been able to maintain a relatively good
grip on content, data applications and VAS thanks
to its advantages in terms of familiarity with the
local culture .While there has been no separate
disclosures from Saudi companies on data content
revenues, STC has started to invest in contents
and applications for its 3.5G services on mobile.
In October 2008, STC, in association with Astro
All Asia Networks of Malaysia and Saudi
Research and Marketing Group (SRMG), set up a
new mobile content services company with capital
of USD74.8m, with 51% ownership by STC.
Investment thesis
We are bullish on broadband prospects in Saudi
Arabia as long-term healthy demand for
broadband services is be supported by Saudi’s
attractive demographics, favourable regulatory
environment, lack of entertainment options and
absence of alternative technologies (like cable).
We expect STC’s data revenue as a percentage of
domestic revenues to grow from 14.8% currently
to 19.4% within the next 5 years. We have little
doubt that the NGN will create new growth
opportunities for STC from about 2011 onwards.
Fixed-line technology is much better suited than
mobile technology for the transmission of data at
very high speeds, and hence it will always be
superior to mobile for high-bandwidth
applications such as video streaming and
television. STC is the only integrated operator in
Saudi Arabia and thus should be able to offer such
applications in bulk; this is one reason why STC
should remain the telecoms provider of choice for
large business and public-sector customers and for
very high end consumers.

129
Telecoms, Media & Technology – Equity 16 February 2011
abc
Financials & valuation: Saudi Telecom Company Overweight Financial statements
Year to 12/2010a 12/2011e 12/2012e 12/2013e
Profit & loss summary (SARm)
Revenue 51,787 54,477 54,975 55,796EBITDA 19,625 20,631 21,104 21,479Depreciation & amortisation -8,645 -9,137 -9,239 -9,510Operating profit/EBIT 10,981 11,494 11,865 11,969Net interest -1,789 -1,009 -954 -892PBT 10,983 10,486 10,911 11,077HSBC PBT 9,708 10,486 10,911 11,077Taxation -884 -844 -941 -966Net profit 9,496 9,157 9,484 9,626HSBC net profit 8,323 9,157 9,484 9,626
Cash flow summary (SARm)
Cash flow from operations 18,780 18,757 19,260 19,630Capex -10,674 -10,791 -10,043 -9,178Cash flow from investment -13,046 -10,791 -10,043 -9,178Dividends -6,109 -6,000 -7,587 -7,701Change in net debt 704 -1,966 -1,629 -2,752FCF equity 6,185 7,976 9,119 10,427
Balance sheet summary (SARm)
Intangible fixed assets 31,806 30,676 29,546 28,416Tangible fixed assets 55,135 57,919 59,854 60,652Current assets 18,666 18,716 18,766 18,848Cash & others 5,904 5,904 5,904 5,904Total assets 110,709 112,412 113,267 113,017Operating liabilities 18,190 18,218 18,319 18,411Gross debt 30,188 28,222 26,593 23,841Net debt 24,284 22,318 20,688 17,937Shareholders funds 44,998 48,156 50,052 51,978Invested capital 81,513 83,189 83,942 83,601
Ratio, growth and per share analysis
Year to 12/2010a 12/2011e 12/2012e 12/2013e
Y-o-y % change
Revenue 2.0 5.2 0.9 1.5EBITDA -4.8 5.1 2.3 1.8Operating profit -14.3 4.7 3.2 0.9PBT -10.2 -4.5 4.1 1.5HSBC EPS -20.6 10.0 3.6 1.5
Ratios (%)
Revenue/IC (x) 0.7 0.7 0.7 0.7ROIC 14.1 14.1 14.2 14.3ROE 19.1 19.7 19.3 18.9ROA 10.1 9.6 9.7 9.8EBITDA margin 37.9 37.9 38.4 38.5Operating profit margin 21.2 21.1 21.6 21.5EBITDA/net interest (x) 11.0 20.5 22.1 24.1Net debt/equity 45.4 39.1 34.8 29.0Net debt/EBITDA (x) 1.2 1.1 1.0 0.8CF from operations/net debt 77.3 84.0 93.1 109.4
Per share data (SAR)
EPS Rep (fully diluted) 4.75 4.58 4.74 4.81HSBC EPS (fully diluted) 4.16 4.58 4.74 4.81DPS 3.00 3.00 3.79 3.85Book value 22.50 24.08 25.03 25.99
Valuation data
Year to 12/2010a 12/2011e 12/2012e 12/2013e
EV/sales 2.1 2.0 1.9 1.8EV/EBITDA 5.5 5.2 5.0 4.7EV/IC 1.3 1.3 1.3 1.2PE* 9.7 8.8 8.5 8.4P/Book value 1.8 1.7 1.6 1.6FCF yield (%) 7.3 9.4 10.8 12.4Dividend yield (%) 7.4 7.4 9.4 9.6
Note: * = Based on HSBC EPS (fully diluted)
Issuer information
Share price (SAR) 40.30 Target price (SAR) 48.00 Potent'l return (%) 19.1
Reuters (Equity) 7010.SE Bloomberg (Equity) STC ABMarket cap (USDm) 21,523 Market cap (SARm) 80,600Free float (%) 30 Enterprise value (SARm) 106771Country Saudi Arabia Sector DIVERSIFIED TELECOMSAnalyst Kunal Bajaj Contact 9714 5077200
Price relative
26
31
36
41
46
51
56
61
2009 2010 2011 2012
26
31
36
41
46
51
56
61
Saudi Telecom Company Rel to TADAWUL ALL SHARE INDEX
Source: HSBC Note: price at close of 11 Feb 2011
130
Telecoms, Media & Technology – Equity 16 February 2011
abc
Sprint Nextel (Neutral (V), TP USD5) Fixed-line connectivity
Sprint Nextel’s only fixed-line asset is its long-
distance network, having spun off its local access
division in 2006 (as “Embarq”) which is now
owned by CenturyLink. Understandably therefore
Sprint Nextel has not been particularly vocal on
the issue of net neutrality, releasing only a brief
statement regarding the FCC’s new policy agreed
in December 2010 which maintained strict net
neutrality principles for fixed networks while
permitting “reasonable traffic management” on
mobile networks. Sprint Nextel commented that
the FCC had recognized “the differences between
fixed and mobile networks” and had resolved “a
fair and balanced approach to a difficult issue”.
Mobile connectivity
Sprint Nextel’s network is under considerably less
pressure than that of AT&T, and potentially that
of Verizon Wireless too (as the latter expects to
roughly double its smartphone base this year on
the back of new CDMA iPhone sales). The reason
for Sprint’s greater breathing room is hardly
positive though as the company has been losing
mobile subscribers consistently for more than four
years now: Q4 2010 saw the first positive direct
postpaid net additions (+58,000) since Q2 2006.
A dwindling subscriber base has enabled the
company to reduce mobile capex to very low
levels – this averaged 5% of divisional sales
2008-2010. Part of the company’s problems may
be ascribed, we believe, to its running multiple
network technologies – CDMA, iDEN and (via
Clearwire) WiMAX in parallel. Although
questions still remain on further funding of
Clearwire, Sprint Nextel has announced Network
Vision, a network modernization frame agreement
with Alcatel-Lucent, Ericsson and Samsung to
rationalise the company’s technology roadmap.
We expect the 3GPP’s LTE technology to form
the core of Network Vision.
As a challenger for market share and with few
capacity pressures on a series of relatively under-
occupied networks, Sprint Nextel does not have the
same imperative as AT&T to ration consumption
through tiered data pricing although periodically the
firm notes that it does not rule out this option in
future. Sprint Nextel does not have a public WiFi
network (indeed some might quip this is one of the
few network technologies it doesn’t operate),
although via its 54% stake in Clearwire, Sprint does
have substantial amounts of spare WiMAX
capacity: Clearwire has nearly 100MHz of spectrum
in its major markets and only around one million
customers. Such abundance of capacity does not
encourage pricing power, we believe. Indeed, Sprint
Nextel, having ample capacity as well as a desire to
regain market share lost over the past four years,
makes for a potentially disruptive combination,
which detracts from the appeal of the US wireless
market, in our view.
Fixed line applications
As Sprint Nextel lacks a fixed-line local access
presence the firm does not have plans for IPTV.
Mobile applications
We see little prospect of Sprint Nextel forcing
change to the status quo in the mobile applications
value chain (given we believe even its greatly
more powerful rivals, Verizon Wireless and
AT&T, are equally unable to resist the dominance
in this space from Apple and Google).
Investment thesis
We have a Neutral (V) rating on Sprint Nextel.
Although the company has reported improving
metrics over the past couple of quarters, we
believe it still remains vulnerable to increased
competitive intensity from larger rivals, which
underpins our cautious stance on the stock.

131
Telecoms, Media & Technology – Equity 16 February 2011
abc
Financials & valuation: Sprint Nextel Corp Neutral (V) Financial statements
Year to 12/2010a 12/2011e 12/2012e 12/2013e
Profit & loss summary (USDm)
Revenue 32,563 32,348 32,822 33,553EBITDA 5,633 5,917 6,188 6,367Depreciation & amortisation -6,537 -5,548 -4,842 -4,365Operating profit/EBIT -904 370 1,347 2,002Net interest -1,367 -1,439 -1,360 -1,209PBT -2,271 -1,069 -14 793HSBC PBT -2,276 -1,069 -14 793Taxation -166 99 5 -301Net profit -2,437 -970 -8 492HSBC net profit -2,276 -1,069 -14 492
Cash flow summary (USDm)
Cash flow from operations 4,815 5,035 4,781 5,064Capex -1,935 -2,927 -3,221 -3,332Cash flow from investment -2,556 -2,927 -3,221 -3,332Dividends 0 0 0 0Change in net debt 2,237 -2,157 -1,559 -1,732FCF equity 2,145 1,591 1,465 1,426
Balance sheet summary (USDm)
Intangible fixed assets 22,704 22,465 22,182 21,937Tangible fixed assets 15,214 13,121 11,784 10,997Current assets 9,880 13,488 12,369 12,737Cash & others 817 4,432 3,241 3,500Total assets 51,654 52,931 50,191 49,527Operating liabilities 6,235 6,095 6,113 6,431Gross debt 20,191 21,649 18,899 17,426Net debt 19,374 17,217 15,658 13,926Shareholders funds 14,546 14,384 14,376 14,867Invested capital 40,746 38,548 36,981 35,740
Ratio, growth and per share analysis
Year to 12/2010a 12/2011e 12/2012e 12/2013e
Y-o-y % change
Revenue 0.9 -0.7 1.5 2.2EBITDA -6.4 5.0 4.6 2.9Operating profit NA NA 264.2 48.7PBT NA NA NA NAHSBC EPS NA NA NA NA
Ratios (%)
Revenue/IC (x) 0.8 0.8 0.9 0.9ROIC 1.4 2.0 4.3 3.8ROE -13.9 -7.4 -0.1 3.4ROA -1.7 1.0 2.9 2.6EBITDA margin 17.3 18.3 18.9 19.0Operating profit margin -2.8 1.1 4.1 6.0EBITDA/net interest (x) 4.1 4.1 4.5 5.3Net debt/equity 133.2 119.7 108.9 93.7Net debt/EBITDA (x) 3.4 2.9 2.5 2.2CF from operations/net debt 24.9 29.2 30.5 36.4
Per share data (USD)
EPS Rep (fully diluted) -0.85 -0.34 0.00 0.17HSBC EPS (fully diluted) -0.80 -0.37 0.00 0.17DPS 0.00 0.00 0.00 0.00Book value 5.10 5.04 5.04 5.21
Key forecast drivers
Year to 12/2010a 12/2011e 12/2012e 12/2013e
Reported revenues 32,563 32,348 32,822 33,553Reported EBITDA 5,633 5,917 6,188 6,367Reported EBIT -821 370 1,347 2,002Reported PBT -2,188 -1,069 -14 793Reported EPS -1 0 0 0
Valuation data
Year to 12/2010a 12/2011e 12/2012e 12/2013e
EV/sales 1.0 0.9 0.9 0.8EV/EBITDA 5.8 5.2 4.7 4.3EV/IC 0.8 0.8 0.8 0.8PE* NA NA NA 26.7P/Book value 0.9 0.9 0.9 0.9FCF yield (%) 16.0 11.8 10.9 10.6Dividend yield (%) 0.0 0.0 0.0 0.0
Note: * = Based on HSBC EPS (fully diluted)
Issuer information
Share price (USD) 4.60 Target price (USD) 5.00 Potent'l return (%) 8.7
Reuters (Equity) S.N Bloomberg (Equity) S USMarket cap (USDm) 13,579 Market cap (USDm) 13,579Free float (%) 100 Enterprise value (USDm) 30661Country United States Sector Diversified TelecomsAnalyst Richard Dineen Contact 1 212 525 6707
Price relative
1
2
3
4
5
6
7
2009 2010 2011 2012
1
2
3
4
5
6
7
Sprint Nextel Corp Rel to S&P 500
Source: HSBC Note: price at close of 11 Feb 2011
132
Telecoms, Media & Technology – Equity 16 February 2011
abc
Swisscom (Overweight, TP CHF470) Fixed line connectivity
Swissscom, with VDSL coverage of 78% and
ongoing investments in FTTH, has a strong
domestic position in fixed-line services. That
means alternative operators competing on ULL
are at a disadvantage. The regulatory environment
in Switzerland is favourable to Swisscom, because
fibre networks (VDSL or FTTH) are not included
in the current regulatory network and are not
expected to be regulated anytime soon. In 2009,
the Swiss Parliament asked the Federal Council to
assess the level of competition in the telecom
market. In a report published on 17 September
2010, the Council answered that there was no
urgent need to change the current telecoms law as
it would discourage ongoing investments. Also,
Swisscom is laying multi-fibre rather than single
fibre, which reduces the chances of regulation.
Mobile connectivity
Swisscom has been continually investing in its
networks (fixed and mobile) with average
domestic capex/sales ratio of 14% over 2006-10e.
Hence, even with rapid growth in data revenues in
2010 (in 9M 2010 non-messaging data revenues
grew by 36% y-o-y), Swisscom’s networks do not
face congestion. Swisscom has proactively
upgraded its network to HSDPA and has
complementary WiFi coverage that helps to
offload traffic in high-density areas. In its Q2
2010 conference call, the company said it would
ensure that all Apple devices log in automatically
to wireless hotspots when in they’re in a WiFi
zone. Swisscom has three sets of data plans
catering to the different class of data users – its
basic plan is 250MB for CHF35, then it has a
1GB plan for CHF55 and an unlimited voice and
data plan (speeds reduced after 2GB of usage) for
CHF169.
Fixed line applications
Swisscom started providing IPTV services in
2007 to fight back against Cablecom. It had
secured around 10% of the TV market by the end
of Q3 2010 – by which point, 23% of its
broadband lines were taking an IPTV service.
Swisscom’s triple-play package starts at CHF99
per month and includes line rental, free voice calls
to the Swisscom fixed-line and mobile networks,
10Mbps broadband and a TV service with over
160 channels. The incumbent is competing against
cable operator Cablecom’s triple-play package
(CHF75 per month for fixed-line calls, 20Mbps
broadband and more than 120 TV channels).
Swisscom has an agreement with OTT provider
Zattoo that lets subscribers of Swisscom VDSL
watch some extra channels in the player. Those
channels have a high-quality signal that shows a
sharp picture even if one enlarges the player
window. The benefit to Swisscom is that it
encourages people to upgrade to fibre-based
broadband.
Mobile applications
Swisscom promotes the use of apps with its
Swiscom Appvisor to help clients select
applications. Swisscom also offers live TV
(Swisscom TV air), news (Swisscom’s own
portal) and location services. As the application
layer is properly served, clients are encouraged to
use their mobile more, enabling Swisscom to
monetise it.
Investment thesis
Our Overweight rating on Swisscom is primarily
driven by its strong domestic position in both
fixed and mobile services, which we believe the
company can maintain over the long term as it is
continually investing in its networks. The
regulatory environment is also favourable for
Swisscom. On the mobile side, Swisscom has the
right connectivity and application strategy to
monetise the capacity scarcity.

133
Telecoms, Media & Technology – Equity 16 February 2011
abc
Financials & valuation: Swisscom Overweight Financial statements
Year to 12/2009a 12/2010e 12/2011e 12/2012e
Profit & loss summary (CHFm)
Revenue 12,001 12,008 11,951 12,243EBITDA 4,666 4,696 4,741 4,840Depreciation & amortisation -1,988 -1,977 -1,949 -1,972Operating profit/EBIT 2,678 2,719 2,792 2,867Net interest -336 -346 -272 -255PBT 2,385 2,407 2,553 2,646HSBC PBT 2,385 2,509 2,557 2,646Taxation -460 -519 -530 -549Net profit 1,928 1,898 2,018 2,093HSBC net profit 1,896 1,999 2,022 2,093
Cash flow summary (CHFm)
Cash flow from operations 4,195 3,737 3,935 4,034Capex -1,987 -1,876 -1,834 -1,849Cash flow from investment -1,189 -2,148 -1,834 -1,849Dividends -984 -1,036 -1,243 -1,347Change in net debt -928 -230 -857 -838FCF equity 1,892 1,946 2,110 2,183
Balance sheet summary (CHFm)
Intangible fixed assets 8,979 8,581 8,429 8,277Tangible fixed assets 8,044 8,035 8,072 8,101Current assets 4,154 4,361 5,216 4,057Cash & others 1,078 1,116 1,974 800Total assets 21,960 21,856 22,578 21,279Operating liabilities 3,371 4,587 4,698 4,830Gross debt 10,010 9,818 9,818 7,807Net debt 8,932 8,702 7,844 7,007Shareholders funds 6,409 5,270 5,945 6,588Invested capital 16,728 15,274 15,045 14,804
Ratio, growth and per share analysis
Year to 12/2009a 12/2010e 12/2011e 12/2012e
Y-o-y % change
Revenue -1.6 0.1 -0.5 2.4EBITDA -2.6 0.7 1.0 2.1Operating profit 1.4 1.5 2.7 2.7PBT 8.5 0.9 6.1 3.7HSBC EPS -1.3 5.4 1.1 3.5
Ratios (%)
Revenue/IC (x) 0.7 0.8 0.8 0.8ROIC 13.7 14.2 15.4 16.0ROE 32.1 34.2 36.1 33.4ROA 10.3 10.0 10.2 10.6EBITDA margin 38.9 39.1 39.7 39.5Operating profit margin 22.3 22.6 23.4 23.4EBITDA/net interest (x) 13.9 13.6 17.4 19.0Net debt/equity 132.8 162.9 130.5 105.3Net debt/EBITDA (x) 1.9 1.9 1.7 1.4CF from operations/net debt 47.0 43.0 50.2 57.6
Per share data (CHF)
EPS Rep (fully diluted) 37.22 36.65 38.96 40.40HSBC EPS (fully diluted) 36.61 38.60 39.04 40.40DPS 20.00 24.00 26.00 28.00Book value 123.74 101.75 114.78 127.19
Key forecast drivers
Year to 12/2009a 12/2010e 12/2011e 12/2012e
Swisscom Revenues 12,001 12,008 11,951 12,243Swisscom EBITDA adjusted 4,666 4,696 4,741 4,840Swisscom EBIT adjusted 2,678 2,719 2,792 2,867Swisscom Net income adjusted 1,928 1,898 2,022 2,093Swisscom FCF definition (OpFCF) 2,669 2,611 2,844 2,919
Valuation data
Year to 12/2009a 12/2010e 12/2011e 12/2012e
EV/sales 2.6 2.6 2.5 2.4EV/EBITDA 6.7 6.6 6.3 6.0EV/IC 1.9 2.0 2.0 2.0PE* 11.8 11.2 11.0 10.7P/Book value 3.5 4.2 3.8 3.4FCF yield (%) 8.5 8.8 9.5 9.9Dividend yield (%) 4.6 5.6 6.0 6.5
Note: * = Based on HSBC EPS (fully diluted)
Issuer information
Share price (CHF) 430.90 Target price (CHF) 470.00 Potent'l return (%) 9.1
Reuters (Equity) SCMN.VX Bloomberg (Equity) SCMN VXMarket cap (USDm) 22,966 Market cap (CHFm) 22,321Free float (%) 42 Enterprise value (CHFm) 30837Country Switzerland Sector Diversified TelecomsAnalyst Nicolas Cote-Colisson Contact 44 20 7991 6826
Price relative
276296316336356376396416436
2009 2010 2011 2012
276296316336356376396416436
Swisscom Rel to SMI
Source: HSBC Note: price at close of 11 Feb 2011

134
Telecoms, Media & Technology – Equity 16 February 2011
abc
TDC (Overweight, TP DKK58) Fixed line connectivity
TDC owns Denmark’s biggest cable network,
covering about 57% of Danish homes under the
YouSee brand. It has invested substantially in
recent years in NGA infrastructure (14%
capex/sales on average in 2007-10) both on the
cable as well as on the telecom side. It also
acquired fibre network operator DONG in the
Copenhagen area.
Its main competition arises from utilities building
fibre networks, which currently cover almost a
quarter of Danish homes. Those utility fibre
networks are technologically competitive but
typically lack scale and knowhow in increasingly
complex multi-play telco products.
The Danish regulator’s key line of action at the
moment is to force TDC to open its YouSee cable
network on a wholesale bitstream basis to
competitors.
Mobile connectivity
We see TDC as well-positioned in data pricing
strategy with tiered data tariffs in place, albeit in
an especially challenging market with contract
periods limited to six months, which stimulates
churn, and aggressive MVNO activity.
TDC is well-advanced in rolling out HSPA+
covering 15% of its network. After securing
2.5GHz of spectrum, TDC in April 2010 started to
roll out LTE, with Ericsson as primary vendor.
TDC offers mobile data in tiered tariffs with 1GB
priced at DKK99 (EUR14) and 1GB at DKK199
(EUR28).
Fixed line applications
Given its cable ownership, TDC is the leading
pay-TV operator in Denmark. Sales of triple-play
to its telecom subscriber base have been modest.
It is primarily used as a retention tool under the
pre-requisite not to cannibalise its YouSee cable
subscriber base. Video on demand is offered on
both platforms, and only towards the end of 2010
started to gain momentum, with VoD sessions
doubling in Q4 sequentially.
Mobile applications
TDC is not part of WAC, the Wholesale
Application Community. Given the small size if
the Danish market, it appears sensible not to try
and compete in the application market with global
internet giants, but rather to focus on providing
and monetising quality connectivity.
Investment thesis
We like TDC as a pure play on the stable Danish
market with no M&A risk, high visibility on cash
generation and use. We believe TDC has invested
sensibly in past years. TDC also enjoys the
advantage of owning an upgraded cable network.
TDC compares favourably to its peers in
diversifying its brand portfolio, having acquired
and established several no-frill, discount and
premium brands around its core TDC brand. TDC
has also reorganised into segments grouped by
customers rather than products.
We have an Overweight rating on TDC, with a
target price of DKK58. A policy of 80% to 85%
payout of FCFE leaves little room for value-
destructive use of cash and the historically high
capex/sales ratio provides flexibility to protect
short-term FCF should the economy slow.

135
Telecoms, Media & Technology – Equity 16 February 2011
abc
Financials & valuation: TDC Overweight Financial statements
Year to 12/2010a 12/2011e 12/2012e 12/2013e
Profit & loss summary (DKKm)
Revenue 26,167 26,143 26,200 26,307EBITDA 9,425 9,794 9,873 9,945Depreciation & amortisation -5,356 -5,222 -5,077 -4,945Operating profit/EBIT 4,069 4,572 4,796 5,000Net interest -1,591 -1,040 -1,035 -1,033PBT 2,586 3,539 3,767 3,973HSBC PBT 2,759 3,632 3,860 4,066Taxation -782 -885 -942 -993Net profit 1,804 2,654 2,825 2,980HSBC net profit 2,069 2,724 2,895 3,049
Cash flow summary (DKKm)
Cash flow from operations 7,265 7,408 7,445 7,475Capex -3,646 -3,464 -3,485 -3,509Cash flow from investment -3,923 -3,464 -3,485 -3,509Dividends -70 -1,882 -3,771 -3,786Change in net debt -10,822 -2,063 -189 -183FCF equity 3,977 4,500 4,486 4,410
Balance sheet summary (DKKm)
Intangible fixed assets 34,799 33,239 31,808 30,501Tangible fixed assets 15,531 15,426 15,358 15,322Current assets 6,248 8,316 8,531 5,996Cash & others 831 2,894 3,083 500Total assets 64,786 65,195 63,917 60,045Operating liabilities 11,783 9,383 8,904 8,449Gross debt 23,644 23,644 23,644 20,879Net debt 22,813 20,750 20,561 20,379Shareholders funds 20,855 23,509 22,555 21,748Invested capital 43,964 44,704 43,710 42,870
Ratio, growth and per share analysis
Year to 12/2010a 12/2011e 12/2012e 12/2013e
Y-o-y % change
Revenue 0.3 -0.1 0.2 0.4EBITDA 0.1 3.9 0.8 0.7Operating profit -14.5 12.4 4.9 4.2PBT -6.6 36.8 6.5 5.5HSBC EPS -21.6 31.6 6.3 5.3
Ratios (%)
Revenue/IC (x) 0.5 0.6 0.6 0.6ROIC 5.9 7.9 8.3 8.8ROE 8.6 12.3 12.6 13.8ROA 4.1 5.3 5.6 6.1EBITDA margin 36.0 37.5 37.7 37.8Operating profit margin 15.6 17.5 18.3 19.0EBITDA/net interest (x) 5.9 9.4 9.5 9.6Net debt/equity 109.4 88.3 91.2 93.7Net debt/EBITDA (x) 2.4 2.1 2.1 2.0CF from operations/net debt 31.8 35.7 36.2 36.7
Per share data (DKK)
EPS Rep (fully diluted) 2.22 3.26 3.47 3.66HSBC EPS (fully diluted) 2.54 3.35 3.56 3.75DPS 0.00 4.62 4.64 4.65Book value 25.62 28.88 27.71 26.72
Key forecast drivers
Year to 12/2010a 12/2011e 12/2012e 12/2013e
EBITDA company 10,772 10,966 11,045 11,117EBITDA HSBC 9,600 9,794 9,873 9,945EBITDA reported 9,425 9,794 9,873 9,945FCF HSBC TMT 2,897 3,787 4,389 4,386FCFE HSBC 3,977 4,500 4,486 4,462FCFE company 4,515 4,562 4,581 4,590
Valuation data
Year to 12/2010a 12/2011e 12/2012e 12/2013e
EV/sales 2.1 2.0 2.0 2.0EV/EBITDA 5.8 5.4 5.3 5.3EV/IC 1.2 1.2 1.2 1.2PE* 18.2 13.8 13.0 12.4P/Book value 1.8 1.6 1.7 1.7FCF yield (%) 12.4 14.0 14.0 13.7Dividend yield (%) 0.0 10.0 10.0 10.0
Note: * = Based on HSBC EPS (fully diluted)
Issuer information
Share price (DKK) 46.31 Target price (DKK) 58.00 Potent'l return (%) 25.2
Reuters (Equity) TDC.CO Bloomberg (Equity) TDC DCMarket cap (USDm) 6,851 Market cap (DKKm) 37,698Free float (%) 33 Enterprise value (DKKm) 52850Country Denmark Sector Diversified TelecomsAnalyst Stephen Howard Contact 44 20 7991 6820
Price relative
202530354045505560
2009 2010 2011 2012
202530354045505560
TDC Rel to KFX
Source: HSBC Note: price at close of 11 Feb 2011

136
Telecoms, Media & Technology – Equity 16 February 2011
abc
Tele2 (Neutral, TP SEK160) Fixed line connectivity
Tele2’s focus is its mobile business; it has limited
fixed-line presence. Tele2’s cable TV network in
Sweden passes through about 210k households, or
c5% of total Swedish households. Although Tele2 is
currently building out a fibre backhaul network in
Sweden to support its mobile broadband business, it
has not disclosed its coverage plans.
Mobile connectivity
Tele2 has predominantly been a price challenger in
the Swedish market and has continued to be
aggressive in its offering. But with the rapid growth
in smartphone penetration, the company has been
increasing its focus on the post-paid segment of the
market to take advantage of data growth. Tele2
launched 4G services in five cities in Sweden late
last year. It plans to cover 100 cities by the end of
FY 2011e and 99% of the population by the end of
FY 2012e.
The Swedish market still has high end flat-fee offers.
Telenor, Tele2 and Three continue to have some of
their plans under flat-fee offers. Telenor, which has
about 18% market share, falls under our ‘teenage
operator’ definition and could disrupt the market in
its effort to gain share and scale. Encouragingly,
Telenor’s management recently commented that it
sees flat-rate data tariffs as unsustainable. We note
that even though flat-rate tariffs still exist in Sweden,
the market already enjoys high single-digit mobile
revenue growth rates.
On net neutrality, the current thinking of the
Swedish telecom regulator, PTS, is that: “Traffic
prioritisation does not need to be socio-economically
inefficient as long as it takes place on a market
where there is competition; rather it may often
promote consumer benefits instead. Charging for
better performance or access to desirable content
services is a completely natural phenomenon in a
market subject to competition.” In other words, the
regulator seems to feel charging for packet
prioritisation is perfectly reasonable. The regulatory
view on net neutrality certainly is more relaxed at an
EU level than is the case in the US. But it is plainly
helpful that the national regulator has clear and
sensible views on the subject as well.
Fixed line applications
Tele2 serves about 5% of Swedish homes with its
cable TV network, competing against ComHem
(cable), ViaSat (satellite) and other TV players.
Mobile applications
Tele2 is not part of WAC (Wholesale Application
Community) or OMA (Open Mobile Alliance).
Investment thesis
Tele2’s focus continues to be infrastructure-led
mobile businesses in Sweden, Russia, the Baltic
countries and Kazakhstan. Tele2’s operations in
Russia and Sweden have continued to deliver good
results and we expect positive growth momentum to
continue.
However, we have been sceptical on Tele2 arbitrage
(ULL/MVNO) businesses, which contribute c25%
to revenues. We expect these businesses to face
significant pressure as incumbents (through fibre)
and cable operators (through DOCSIS) upgrade their
network capabilities, which in our view will put
them in a strong position to take away market share
from ULL operators. We also believe Tele2’s lack of
3G spectrum could impede its growth prospects in
Russia.
We have a Neutral rating on the stock with a target
price of SEK160 (increased from SEK155, post
change to our WACC assumption) and believe
Tele2’s low debt levels (1.1x FY 2011e net
debt/EBITDA post accounting for FY 2010e
dividends) should continue to provide support for
competitive yields.

137
Telecoms, Media & Technology – Equity 16 February 2011
abc
Financials & valuation: Tele2 Neutral Financial statements
Year to 12/2010a 12/2011e 12/2012e 12/2013e
Profit & loss summary (SEKm)
Revenue 40,197 40,769 42,043 42,700EBITDA 10,284 10,672 11,653 12,321Depreciation & amortisation -3,596 -3,618 -3,855 -4,058Operating profit/EBIT 6,688 7,054 7,799 8,263Net interest -497 -439 -536 -500PBT 6,412 6,693 7,340 7,840HSBC PBT 6,268 6,693 7,340 7,840Taxation -283 -1,720 -1,888 -2,018Net profit 6,574 4,965 5,444 5,822HSBC net profit 4,656 4,965 5,444 5,814
Cash flow summary (SEKm)
Cash flow from operations 9,610 9,178 9,286 9,863Capex -3,603 -5,247 -4,816 -4,202Cash flow from investment -5,260 -5,247 -4,816 -4,294Dividends -2,580 -11,944 -3,760 -4,123Change in net debt -203 8,013 -710 -1,446FCF equity 5,801 3,211 4,302 5,531
Balance sheet summary (SEKm)
Intangible fixed assets 13,201 13,201 13,201 13,293Tangible fixed assets 15,130 16,760 17,721 17,865Current assets 7,697 7,837 8,028 8,126Cash & others 946 1,000 1,000 1,000Total assets 40,369 42,216 43,445 43,857Operating liabilities 7,695 262 873 1,312Gross debt 2,948 11,015 10,305 8,859Net debt 2,002 10,015 9,305 7,859Shareholders funds 28,872 30,077 31,398 32,808Invested capital 27,387 36,535 37,077 36,973
Ratio, growth and per share analysis
Year to 12/2010a 12/2011e 12/2012e 12/2013e
Y-o-y % change
Revenue 0.7 1.4 3.1 1.6EBITDA 11.3 3.8 9.2 5.7Operating profit 17.8 5.5 10.6 6.0PBT 27.7 4.4 9.7 6.8HSBC EPS 23.7 6.6 9.6 6.8
Ratios (%)
Revenue/IC (x) 1.5 1.3 1.1 1.2ROIC 18.6 16.4 15.7 16.6ROE 16.3 16.8 17.7 18.1ROA 16.1 12.9 13.7 14.2EBITDA margin 25.6 26.2 27.7 28.9Operating profit margin 16.6 17.3 18.5 19.4EBITDA/net interest (x) 20.7 24.3 21.8 24.6Net debt/equity 6.9 33.3 29.6 23.9Net debt/EBITDA (x) 0.2 0.9 0.8 0.6CF from operations/net debt 480.0 91.7 99.8 125.5
Per share data (SEK)
EPS Rep (fully diluted) 14.86 11.22 12.31 13.16HSBC EPS (fully diluted) 10.53 11.22 12.31 13.14DPS 27.00 8.50 9.32 9.95Book value 65.27 67.99 70.98 74.17
Key forecast drivers
Year to 12/2010a 12/2011e 12/2012e 12/2013e
Tele2 Revenues 40,197 40,769 42,043 42,700Tele2 EBITDA adjusted 10,284 10,672 11,653 12,321Tele2 PBT reported 6,735 6,693 7,340 7,840Tele2 Net income reported 6,926 4,965 5,444 5,814
Valuation data
Year to 12/2010a 12/2011e 12/2012e 12/2013e
EV/sales 1.5 1.7 1.6 1.6EV/EBITDA 6.0 6.5 5.9 5.4EV/IC 2.2 1.9 1.9 1.8PE* 14.1 13.2 12.1 11.3P/Book value 2.3 2.2 2.1 2.0FCF yield (%) 9.7 5.4 7.2 9.3Dividend yield (%) 18.2 5.7 6.3 6.7
Note: * = Based on HSBC EPS (fully diluted)
Issuer information
Share price (SEK) 148.70 Target price (SEK) 160.00 Potent'l return (%) 7.6
Reuters (Equity) TEL2b.ST Bloomberg (Equity) TEL2B SSMarket cap (USDm) 9,638 Market cap (SEKm) 62,449Free float (%) 72 Enterprise value (SEKm) 69438Country Sweden Sector Diversified TelecomsAnalyst Dominik Klarmann Contact +49 211 910 2769
Price relative
50
70
90
110
130
150
170
2009 2010 2011 2012
50
70
90
110
130
150
170
Tele2 Rel to OMX
Source: HSBC Note: price at close of 11 Feb 2011
138
Telecoms, Media & Technology – Equity 16 February 2011
abc
Telecom Italia (Underweight, TP EUR1.05) Fixed line connectivity
Telecom Italia is lagging behind other European
incumbents in terms of NGA deployment,
currently running trials in Milan and Rome. The
company has a target of reaching 1.3m
households (about 5.5% of total) covered with
FTTN/VDSL by the end of 2012 and a longer-
term goal of 10m households (about 42% of total).
Despite such unambitious plans, the lack of a
cable infrastructure in Italy has in part preserved
TI’s position. However, it has not protected it
from pricing pressure from altnets on an
undifferentiated voice and broadband product.
The national regulator AGCOM has granted TI an
increase in ULL copper fees, which will gradually
rise from EUR8.49 in early 2010 to EUR9.28 in
2012. While this has brought TI’s ULL fees closer
to the EU average, it is in counter trend with the
other European markets. This, together with
wholesale broadband access fees that most likely
will be determined on a LRIC basis, does not
create strong regulatory incentives for TI to
accelerate its NGA deployment. AGCOM’s
position on net neutrality is no different from the
other European regulators and is likely, in our
view, to follow the EU recommendations, which
currently appear pragmatic.
Mobile connectivity
TI’s approach to tiered data pricing continues to
make it quite an exception among peers. While
most peers have shifted to tiered data plans, TI
continues to stick to flat rate tariffs up to 2GB per
month. As a comparison, Vodafone Italy has
reduced its cap to 1GB per month. However, we
do not think TI’s case is any different from other
operators: mobile capacity is an intrinsically
scarce resource also for the company. We would
not be surprised if TI decided to adopt tiered data
plans during the course of 2011.
Fixed line applications
Given the limited NGA deployment and the
inferior contents available compared with the
satellite alternative Sky Italia, IPTV has not so far
had a significant impact: as of 2010, TI’s IPTV
customers are equivalent to only 5% of its
broadband lines. Moreover, Fastweb and Sky
have recently strengthened their commercial
relationship: customers can now choose services
from either within a joint plan and then receive a
unified bill with dedicated call centre support.
This represents an additional challenge to TI.
Mobile applications
TI’s efforts in the applications space have so far
had a limited impact: Tim store has around 1,000
applications available, grouped in categories such
as social network, sport, games, travels and
others. TI has reached an agreement with the main
Italian publishers to offer a virtual bookshop;
however, this is available on TI’s dedicated
device (the biblet) rather than as an app available
on iPads or Android tablets. Although we see the
soft SIM threat as overstated in most European
markets, in Italy, given the history of traditionally
low or no subsidies, a vendor like Apple would
take a lower risk by taking the soft SIM route.
Investment thesis
We expect domestic mobile to continue its
underperformance in Q4 2010 (results due on 24
February 2011) with double-digit service revenue
decline. Increasingly tough competition in fixed
line is a source of concern and may put additional
pressure on the Q4 results. However, Brazil
should outperform and dividend growth should
resume. We are Underweight Telecom Italia with
a target price of EUR1.05.

139
Telecoms, Media & Technology – Equity 16 February 2011
abc
Financials & valuation: Telecom Italia Underweight Financial statements
Year to 12/2009a 12/2010e 12/2011e 12/2012e
Profit & loss summary (EURm)
Revenue 26,894 27,462 29,695 29,927EBITDA 11,115 11,391 12,221 12,159Depreciation & amortisation -5,852 -5,685 -5,850 -5,498Operating profit/EBIT 5,263 5,706 6,371 6,661Net interest -2,227 -2,071 -2,078 -1,979PBT 2,481 3,684 4,308 4,696HSBC PBT 3,622 4,109 4,308 4,696Taxation -1,121 -1,291 -1,632 -1,779Net profit 1,345 2,193 2,227 2,433HSBC net profit 2,256 2,368 2,227 2,433
Cash flow summary (EURm)
Cash flow from operations 6,094 6,326 7,596 7,960Capex -4,543 -4,593 -4,751 -4,988Cash flow from investment -5,188 -4,411 -4,751 -4,988Dividends -1,050 -1,033 -1,134 -1,231Change in net debt -90 -2,020 -1,712 -1,741FCF equity 2,535 2,417 3,725 3,369
Balance sheet summary (EURm)
Intangible fixed assets 49,909 49,837 49,754 49,933Tangible fixed assets 14,902 15,808 14,792 14,103Current assets 17,683 16,573 16,562 16,597Cash & others 6,619 6,346 6,000 6,000Total assets 86,181 86,886 85,779 85,308Operating liabilities 11,302 11,108 11,503 11,592Gross debt 43,738 42,790 40,733 38,992Net debt 33,949 31,929 30,217 28,476Shareholders funds 25,952 26,754 27,750 28,856Invested capital 64,573 64,764 63,604 63,040
Ratio, growth and per share analysis
Year to 12/2009a 12/2010e 12/2011e 12/2012e
Y-o-y % change
Revenue -7.3 2.1 8.1 0.8EBITDA 0.2 2.5 7.3 -0.5Operating profit 1.1 8.4 11.7 4.5PBT -4.7 48.5 16.9 9.0HSBC EPS 12.4 4.9 -6.0 9.3
Ratios (%)
Revenue/IC (x) 0.4 0.4 0.5 0.5ROIC 7.6 7.7 8.3 8.6ROE 8.7 9.0 8.2 8.6ROA 4.8 4.4 4.7 5.0EBITDA margin 41.3 41.5 41.2 40.6Operating profit margin 19.6 20.8 21.5 22.3EBITDA/net interest (x) 5.0 5.5 5.9 6.1Net debt/equity 125.2 109.5 99.5 89.8Net debt/EBITDA (x) 3.1 2.8 2.5 2.3CF from operations/net debt 18.0 19.8 25.1 28.0
Per share data (EUR)
EPS Rep (fully diluted) 0.07 0.11 0.12 0.13HSBC EPS (fully diluted) 0.12 0.12 0.12 0.13DPS 0.05 0.06 0.06 0.07Book value 1.35 1.39 1.44 1.50
Key forecast drivers
Year to 12/2009a 12/2010e 12/2011e 12/2012e
Domestic business 21,663 20,073 19,494 19,213Brazilian mobile 4,753 6,181 6,824 7,223TI Media 230 246 251 256Olivetti 350 377 377 377Others/Elimination -102 585 2,748 2,857Group Revenues 26,894 27,462 29,695 29,927
Valuation data
Year to 12/2009a 12/2010e 12/2011e 12/2012e
EV/sales 2.1 1.9 1.7 1.7EV/EBITDA 5.0 4.7 4.2 4.1EV/IC 0.9 0.8 0.8 0.8PE* 9.0 8.6 9.1 8.3P/Book value 0.8 0.8 0.7 0.7FCF yield (%) 11.8 11.3 17.2 15.4Dividend yield (%) 4.8 5.2 5.7 6.2
Note: * = Based on HSBC EPS (fully diluted)
Issuer information
Share price (EUR) 1.05 Target price (EUR) 1.05 Potent'l return (%) -0.1
Reuters (Equity) TLIT.MI Bloomberg (Equity) TIT IMMarket cap (USDm) 26,218 Market cap (EURm) 19,347Free float (%) 81 Enterprise value (EURm) 53344Country Italy Sector Diversified TelecomsAnalyst Luigi Minerva Contact 44 20 7991 6928
Price relative
0
0.5
1
1.5
2
2.5
2009 2010 2011 2012
0
0.5
1
1.5
2
2.5
Telecom Italia Rel to BCI ALL-SHARE INDEX
Source: HSBC Note: price at close of 11 Feb 2011
140
Telecoms, Media & Technology – Equity 16 February 2011
abc
Telefonica (Overweight, TP EUR22) Fixed line connectivity
The economic recession and the consequent
slowdown of the broadband market have led
Telefonica to shelve its NGA plans announced in
October 2007 (aim of achieving 25% FTTH
coverage). Now TEF targets a more focused VDSL
in those areas where cable operator ONO is already
present with a DOCSIS3.0 offer.
The regulatory environment remains benign in Spain
and this is likely to benefit Telefonica. First, national
regulator CMT in October 2008 said that Telefonica
would have to share its infrastructure as well as
provide a wholesale service – but only up to speeds
of 30Mbps. Clearly, if this regulation were
implemented, TEF would have an upper edge in
competition considering that most of the fibre
products would have speed greater than 30Mbps.
Second, the CMT has indicated that in-building fibre
should be shared, but the terms should be established
by commercial negotiations (based on “reasonable
requests”).
On the net neutrality side, we believe that in Europe
the regulators (both at the EC and national level) are
likely to adopt a pragmatic approach that is unlikely
to hurt operators. CMT has stated that traffic
prioritisation could be allowed as long as it does not
have a negative impact on competition.
Mobile connectivity
TEF has good 3G coverage of +90% in Europe and
has proactively invested in HSDPA and currently
has almost 80% coverage. TEF has faced some
network outrage due to the exponential data traffic
growth. For instance, O2 UK has faced some well-
publicised strains to its network in London and
Bristol. TEF has consequently deployed additional
3G cell sites in major towns and cities, has moved to
tiered data plans, has been conducting LTE trials in
all of its key markets, promoting WiFi usage and has
been deploying selective femtocells.
Telefonica has already departed from unsustainable
‘all-you-can-eat’ tariffs by introducing tiering
pricing. O2 UK is offering a maximum monthly
allowance of 1GB and customers exceeding this are
required to purchase an additional allowance, at
GBP5 for 500MB and GBP10 for 1GB. In Spain,
TEF has introduced a milder form of tiering plans. A
data package of 1GB is 2.5x more expensive than a
data package of 100MB; however, customers
exceeding their data limit would see the download
speed reduced significantly to 128Kbps.
Fixed line applications
Telefonica launched its IPTV service in Spain under
the brand name Imagenio in 2004 and has now 773k
customers with 18% market share of the pay-TV
market. Telefonica’s current IPTV offer is based on
ADSL2+, which provides limited options. Despite
the relatively early launch; Spain has an IPTV
household penetration of only 5% (as of Q3 2010).
Mobile applications
Telefonica is one of the key promoters of the
Wholesale Application Community (WAC)
initiative, which in our view comes as too little, too
late given the strong position that Apple and Google
have built in this space. In February 2011,
Telefonica announced a new multi-platform service
(to be launched by Q3 2011 in among others Brazil,
Mexico, Spain, UK and Germany) that allows
customers to use applications on mobile, tablets,
netbooks, and set-top-box TV.
Investment thesis
Telefonica offers a strong combination of value
(with growing DPS visibility until 2012 and a
very attractive 2010e yield of 7.6%) and growth
(thanks to LatAm exposure and a strong mobile
performance in the UK, which should offset a
slower than we expected recovery in Spain.

141
Telecoms, Media & Technology – Equity 16 February 2011
abc
Financials & valuation: Telefonica Overweight Financial statements
Year to 12/2009a 12/2010e 12/2011e 12/2012e
Profit & loss summary (EURm)
Revenue 56,731 61,425 65,342 66,575EBITDA 22,603 26,765 24,353 25,031Depreciation & amortisation -8,956 -9,282 -10,159 -9,825Operating profit/EBIT 13,647 17,484 14,194 15,206Net interest -3,307 -2,734 -3,086 -3,221PBT 10,387 14,836 11,199 12,079HSBC PBT 9,949 11,114 11,199 12,079Taxation -2,450 -3,550 -3,055 -3,296Net profit 7,776 11,074 7,718 8,297HSBC net profit 6,818 7,896 7,718 8,297
Cash flow summary (EURm)
Cash flow from operations 15,897 16,325 16,240 17,542Capex -7,592 -8,208 -9,053 -9,589Cash flow from investment -8,770 -15,009 -10,559 -9,589Dividends -4,557 -5,877 -6,326 -7,074Change in net debt 778 12,236 2,449 -879FCF equity 8,873 11,871 8,550 8,689
Balance sheet summary (EURm)
Intangible fixed assets 35,412 54,495 56,001 56,001Tangible fixed assets 32,003 35,077 33,971 33,735Current assets 23,830 19,870 21,073 23,124Cash & others 9,122 2,276 2,696 4,500Total assets 108,141 128,540 130,234 132,142Operating liabilities 17,752 26,504 27,285 28,506Gross debt 56,791 60,078 62,947 63,871Net debt 43,551 55,787 58,235 57,356Shareholders funds 21,734 21,445 20,285 20,845Invested capital 64,371 80,662 81,064 79,854
Ratio, growth and per share analysis
Year to 12/2009a 12/2010e 12/2011e 12/2012e
Y-o-y % change
Revenue -2.1 8.3 6.4 1.9EBITDA -1.4 18.4 -9.0 2.8Operating profit -1.6 28.1 -18.8 7.1PBT -4.8 42.8 -24.5 7.9HSBC EPS -3.9 16.7 -0.1 7.5
Ratios (%)
Revenue/IC (x) 0.9 0.8 0.8 0.8ROIC 15.2 17.6 12.8 13.7ROE 35.0 36.6 37.0 40.3ROA 10.0 11.4 8.1 8.5EBITDA margin 39.8 43.6 37.3 37.6Operating profit margin 24.1 28.5 21.7 22.8EBITDA/net interest (x) 6.8 9.8 7.9 7.8Net debt/equity 179.4 181.3 196.7 190.1Net debt/EBITDA (x) 1.9 2.1 2.4 2.3CF from operations/net debt 36.5 29.3 27.9 30.6
Per share data (EUR)
EPS Rep (fully diluted) 1.71 2.45 1.75 1.88HSBC EPS (fully diluted) 1.50 1.75 1.75 1.88DPS 1.15 1.40 1.60 1.75Book value 4.77 4.75 4.59 4.71
Key forecast drivers
Year to 12/2009a 12/2010e 12/2011e 12/2012e
Spain 19,432 18,775 18,539 18,368LatAm 22,984 26,336 30,357 31,715O2 13,532 15,320 15,327 15,219Others 783 994 1,118 1,273Group revenues 56,731 61,425 65,342 66,575TEF FCF definition 9,098 7,283 7,984 8,750
Valuation data
Year to 12/2009a 12/2010e 12/2011e 12/2012e
EV/sales 2.4 2.4 2.3 2.2EV/EBITDA 6.0 5.5 6.2 5.9EV/IC 2.1 1.8 1.8 1.9PE* 12.2 10.5 10.5 9.8P/Book value 3.8 3.9 4.0 3.9FCF yield (%) 9.7 12.8 9.3 9.5Dividend yield (%) 6.3 7.6 8.7 9.5
Note: * = Based on HSBC EPS (fully diluted)
Issuer information
Share price (EUR) 18.32 Target price (EUR) 22.00 Potent'l return (%) 20.1
Reuters (Equity) TEF.MC Bloomberg (Equity) TEF SMMarket cap (USDm) 113,341 Market cap (EURm) 83,635Free float (%) 100 Enterprise value (EURm) 148181Country Spain Sector Diversified TelecomsAnalyst Luigi Minerva Contact 44 20 7991 6928
Price relative
12131415161718192021
2009 2010 2011 2012
12131415161718192021
Telefonica Rel to MADRID SE
Source: HSBC Note: price at close of 11 Feb 2011

142
Telecoms, Media & Technology – Equity 16 February 2011
abc
Telekom Austria (Neutral, TP EUR11) Fixed line connectivity
Telekom Austria’s update on its NGA strategy at its
capital markets day on 17 December 2010 is
encouraging. At the end of December 2010 the
company’s VDSL/ Fibre to the Exchange network
reached 38% of households, and it plans to have
45% of Austrian households by the end of 2011.
Additionally, 5% of homes will be covered with
either FTTB/FTTC or FTTH by end of 2011. While
TA has long been the laggard in Europe in terms of
NGA roll-out, the new management team seems to
be much more aware of the fixed line opportunity;
the fibre to the exchange technology combined with
relatively short local loop length should allow TA a
relatively cheap and fast NGA roll-out and TA’s
guidance of fixed access line growth is both
exceptional in Europe and encouraging.
Mobile connectivity
The Austrian market remains highly competitive in
mobile broadband and the migration from fixed to
mobile broadband has been quite high. Telekom
Austria has been continually upgrading its mobile
network, and now more than 1,000 base stations
have been connected via fibre backbone. The
company is also adopting dual cell roll-out, where in
a second carrier per cell is installed. 25% of base
stations were dual-cell by the end of 2010. Telekom
Austria also became the first Austrian mobile
operator to launch LTE services and has already
upgraded 50 base stations.
The Austrian market has largely moved away
from all-you-can-use offers. Telekom Austria,
T-mobile and Orange all offer data packages with
download caps, except Three Austria, which
continues to offer flat fee packages albeit at a
higher monthly commitment.
There is no active discussion about net neutrality
in Austria at the moment, which we generally
consider a positive for the incumbent.
Historically, the Austrian regulator has closely
followed EU recommendations, which appear
much more relaxed on the issue than the US. We
therefore consider this aspect as neutral to slightly
positive for TA.
Fixed line applications
Telekom Austria offers IPTV service with 90-plus
channels. It had 134,000 subscribers at the end of Q3
2010. It also offers 1,000 video-on-demand films
and series.
Mobile applications
Telekom Austria is a member of the Open Mobile
alliance and Wholesale Applications Community but
to date little tangible results have come out of this
initiative.
Investment thesis
Recent improvements in fixed-line trends and the
progress in NGA roll-out have been encouraging, in
our view, but we believe it is too early to call an
economic recovery in the CEE markets (37% of
group EBITDA). The company has set a floor of
EUR0.76 dividend per share over 2011-12, which
translates into a yield of 7% currently. During the
capital markets day in December 2010, the company
revised its payout ratio to 55% of free cash flow
from 65% of net income earlier and increased its
leverage target from 1.8-2.0x to 2.0-2.5x also
flagging general interest in inorganic expansion
within its region.
We have a Neutral rating on the stock with a target
price of EUR11 (increased from EUR10; we have
raised slightly our revenue and EBITDA estimates to
reflect stabilisation in fixed-line losses and
stabilisation in CEE. Our target-price revision
reflects the positive revision to our estimates and
rolling forward of our valuation to year-end 2011.

143
Telecoms, Media & Technology – Equity 16 February 2011
abc
Financials & valuation: Telekom Austria Neutral Financial statements
Year to 12/2009a 12/2010e 12/2011e 12/2012e
Profit & loss summary (EURm)
Revenue 4,802 4,618 4,570 4,600EBITDA 1,794 1,641 1,586 1,598Depreciation & amortisation -1,450 -1,068 -1,016 -949Operating profit/EBIT 344 573 569 649Net interest -220 -205 -223 -226PBT 106 365 346 424HSBC PBT 530 408 346 424Taxation -11 -82 -87 -106Net profit 95 283 260 318HSBC net profit 398 307 260 318
Cash flow summary (EURm)
Cash flow from operations 1,385 1,355 1,279 1,244Capex -711 -699 -784 -770Cash flow from investment -930 -728 -784 -835Dividends -332 -332 -332 -336Change in net debt -378 -81 -163 -72FCF equity 667 557 488 474
Balance sheet summary (EURm)
Intangible fixed assets 3,393 3,185 3,069 2,979Tangible fixed assets 2,675 2,501 2,385 2,296Current assets 2,024 1,522 1,574 1,340Cash & others 1,122 622 676 431Total assets 8,499 7,836 7,656 7,309Operating liabilities 1,178 1,484 1,489 1,479Gross debt 4,736 4,155 4,047 3,729Net debt 3,615 3,534 3,371 3,298Shareholders funds 1,611 1,209 1,132 1,113Invested capital 5,793 5,102 4,863 4,706
Ratio, growth and per share analysis
Year to 12/2009a 12/2010e 12/2011e 12/2012e
Y-o-y % change
Revenue -7.1 -3.8 -1.0 0.7EBITDA 38.5 -8.5 -3.4 0.8Operating profit 153.8 66.6 -0.6 14.1PBT 243.5 -5.2 22.4HSBC EPS -9.1 -23.0 -15.3 22.4
Ratios (%)
Revenue/IC (x) 0.8 0.8 0.9 1.0ROIC 9.6 9.5 10.3 11.6ROE 21.1 21.7 22.2 28.3ROA 3.2 5.5 5.7 6.6EBITDA margin 37.4 35.5 34.7 34.7Operating profit margin 7.2 12.4 12.5 14.1EBITDA/net interest (x) 8.2 8.0 7.1 7.1Net debt/equity 224.0 291.6 297.0 295.5Net debt/EBITDA (x) 2.0 2.2 2.1 2.1CF from operations/net debt 38.3 38.3 37.9 37.7
Per share data (EUR)
EPS Rep (fully diluted) 0.21 0.64 0.59 0.72HSBC EPS (fully diluted) 0.90 0.69 0.59 0.72DPS 0.75 0.75 0.76 0.76Book value 3.64 2.73 2.56 2.52
Key forecast drivers
Year to 12/2009a 12/2010e 12/2011e 12/2012e
TA Revenues (EURm) 4,802 4,618 4,570 4,600TA EBITDA Adj.(EURm) 1,794 1,680 1,586 1,598TA EBIT Adj.(EURm) 696 611 569 649TA Net Income Adj.(EURm) 358 307 260 318TA FCF Definition (EURm) 674 655 495 474
Valuation data
Year to 12/2009a 12/2010e 12/2011e 12/2012e
EV/sales 1.7 1.8 1.8 1.7EV/EBITDA 4.7 5.0 5.1 5.0EV/IC 1.4 1.6 1.7 1.7PE* 11.7 15.2 17.9 14.7P/Book value 2.9 3.9 4.1 4.2FCF yield (%) 14.1 11.8 10.3 10.0Dividend yield (%) 7.1 7.1 7.2 7.2
Note: * = Based on HSBC EPS (fully diluted)
Issuer information
Share price (EUR) 10.52 Target price (EUR) 11.00 Potent'l return (%) 4.6
Reuters (Equity) TELA.VI Bloomberg (Equity) TKA AVMarket cap (USDm) 6,316 Market cap (EURm) 4,660Free float (%) 73 Enterprise value (EURm) 8273Country Austria Sector Diversified TelecomsAnalyst Dominik Klarmann Contact +49 211 910 2769
Price relative
56789
101112131415
2009 2010 2011 2012
56789101112131415
Telekom Austria Rel to ATX
Source: HSBC Note: price at close of 11 Feb 2011

144
Telecoms, Media & Technology – Equity 16 February 2011
abc
Telenor (Overweight, TP NOK111) Fixed line connectivity
Telenor enjoys the advantage of owning the cable
network covering about a third of Norwegian
homes. Its main competition arises from utilities
building fibre networks that are technologically
competitive but typically lack scale and knowhow
in increasingly complex multi-play telco products.
The Norwegian regulator laid out its position on
net neutrality in consultation with operators in
February 2009. On the issue of traffic
management, the view is that “internet users are
entitled to an internet connection that is free of
discrimination with regard to type of application,
service or content or based on the sender or
receiver address”. However, it does not prohibit
traffic management measures on an operator’s
network if they are intended to ensure the quality
of service for specific applications that require
this, or to deal with situations of temporary
network overload. We believe this could leave the
door open to prioritising data streams of time-
sensitive material, such as voice and video. It
would appear that Norway is at the tougher end of
the spectrum in Europe.
Telenor has some low-profile CDN activities in
Norway competing with independent CDN players.
Mobile connectivity
We see Telenor as well-positioned in its data-plan
structure; the company has introduced speed caps
beyond a usage limit of 5GB per month and in its
offer states that this policy is to ensure good
service to all customers.
Telenor management, during its capital-markets
day presentation held in September 2010,
highlighted that flat-rate data plans are not
sustainable. Telenor is working on a new pricing
structure for individual customer segments by
tiering volumes, speeds and time. In Norway, all
the operators across the various subscription plans
have usage caps, which range from 200MB to
6GB. In Sweden, Telenor maintains unlimited
volume tariffs but rationalises usage by speed
caps rather than volume caps. That has not
harmed the Swedish mobile market, which is
growing in high single digits.
Fixed line applications
Given its cable and satellite ownership, Telenor
only introduced IPTV in 2010 and it has yet to
gain traction. Overall, including satellite, cable
and IPTV, Telenor enjoys a TV market share of
48%. Video on demand is in its infancy in
Norway, a function of the small size of the market
and potentially the monopolistic market structure.
Mobile applications
Telenor is especially active in financial services
and mobile banking in emerging markets.
Easypais in Pakistan aims for 7m active users and
PKR10bn (USD120m) revenues in 2013. Telenor
is also part of WAC, the Wholesale Application
Community, but so far few tangible results have
come out of this alliance.
Investment thesis
We believe Telenor has an attractive portfolio of
assets that offer some of the best and most
sustainable growth potential among Western
European incumbents. In addition to the exposure
to high-growth, low-penetration emerging
economies, we believe Telenor’s multiple
platform holdings in Norway (mobile, cable,
satellite and DSL) make it well-placed as the
industries converge and limit competitive
pressures. We have an Overweight rating on
Telenor, with a target price of NOK111. Telenor
in our view is an attractive combination of
sustainable growth and a competitive and growing
distribution.

145
Telecoms, Media & Technology – Equity 16 February 2011
abc
Financials & valuation: Telenor Overweight Financial statements
Year to 12/2010a 12/2011e 12/2012e 12/2013e
Profit & loss summary (NOKm)
Revenue 98,083 100,544 105,789 109,174EBITDA 28,687 30,510 33,580 35,526Depreciation & amortisation -16,349 -16,017 -15,769 -15,158Operating profit/EBIT 12,338 14,493 17,811 20,368Net interest -1,140 -1,077 -1,050 -836PBT 19,960 17,851 22,723 26,487HSBC PBT 15,111 17,851 22,723 26,487Taxation -4,975 -5,058 -5,365 -5,830Net profit 14,332 11,952 16,113 18,988HSBC net profit 9,974 11,952 16,113 18,988
Cash flow summary (NOKm)
Cash flow from operations 24,381 24,626 27,870 30,433Capex -11,863 -11,860 -12,138 -12,127Cash flow from investment -15,588 -11,860 -12,138 -12,127Dividends -4,141 -6,198 -2,116 -8,862Change in net debt -6,621 -4,068 -13,616 -9,444FCF equity 10,728 12,401 14,528 16,350
Balance sheet summary (NOKm)
Intangible fixed assets 51,479 47,198 43,174 39,808Tangible fixed assets 52,963 53,087 53,481 53,815Current assets 32,209 29,596 43,999 53,951Cash & others 14,552 11,794 25,410 34,854Total assets 172,731 168,012 181,766 192,066Operating liabilities 34,212 34,811 42,154 44,324Gross debt 35,577 28,751 28,751 28,751Net debt 21,025 16,957 3,341 -6,103Shareholders funds 87,867 90,617 97,868 106,413Invested capital 87,887 83,276 73,088 68,395
Ratio, growth and per share analysis
Year to 12/2010a 12/2011e 12/2012e 12/2013e
Y-o-y % change
Revenue 0.3 2.5 5.2 3.2EBITDA -7.1 6.4 10.1 5.8Operating profit -7.0 17.5 22.9 14.4PBT 31.5 -10.6 27.3 16.6HSBC EPS -31.2 21.8 36.2 17.8
Ratios (%)
Revenue/IC (x) 1.1 1.2 1.4 1.5ROIC 9.2 12.1 17.4 22.5ROE 12.2 13.4 17.1 18.6ROA 9.6 8.1 10.5 11.6EBITDA margin 29.2 30.3 31.7 32.5Operating profit margin 12.6 14.4 16.8 18.7EBITDA/net interest (x) 25.2 28.3 32.0 42.5Net debt/equity 21.9 17.4 3.2 -5.4Net debt/EBITDA (x) 0.7 0.6 0.1 -0.2CF from operations/net debt 116.0 145.2 834.2
Per share data (NOK)
EPS Rep (fully diluted) 8.71 7.38 10.05 11.84HSBC EPS (fully diluted) 6.06 7.38 10.05 11.84DPS 3.80 4.18 5.53 6.51Book value 53.38 55.94 61.04 66.37
Key forecast drivers
Year to 12/2010a 12/2011e 12/2012e 12/2013e
Telenor revenue 98,083 100,544 105,789 109,174Telenor EBITDA adjusted 29,262 30,510 33,580 35,526Telenor PBT adjusted 15,111 17,851 22,723 26,487Telenor Net income adjusted 10,475 11,952 16,113 18,988Telenor OCF definition 17,732 18,650 21,441 23,400
Valuation data
Year to 12/2010a 12/2011e 12/2012e 12/2013e
EV/sales 1.8 1.7 1.4 1.3EV/EBITDA 6.1 5.5 4.5 3.9EV/IC 2.0 2.0 2.1 2.0PE* 15.1 12.4 9.1 7.7P/Book value 1.7 1.6 1.5 1.4FCF yield (%) 7.0 8.2 9.8 11.4Dividend yield (%) 4.2 4.6 6.0 7.1
Note: * = Based on HSBC EPS (fully diluted)
Issuer information
Share price (NOK) 91.45 Target price (NOK) 111.00 Potent'l return (%) 21.4
Reuters (Equity) TEL.OL Bloomberg (Equity) TEL NOMarket cap (USDm) 25,924 Market cap (NOKm) 151,614Free float (%) 46 Enterprise value (NOKm) 168311Country Norway Sector Diversified TelecomsAnalyst Dominik Klarmann Contact +49 211 910 2769
Price relative
2535455565758595
105
2009 2010 2011 2012
2535455565758595105
Telenor Rel to OBX INDEX
Source: HSBC Note: price at close of 11 Feb 2011

146
Telecoms, Media & Technology – Equity 16 February 2011
abc
TeliaSonera (Neutral, TP SEK58) Fixed line connectivity
In March 2008, TLSN announced it would upgrade
1.5m to 2.0m households, out of 4.4m Swedish
homes and enterprises, with a combination of FTTH
and VDSL technology over a period of five years.
Key competitors are Com Hem, the Swedish cable
operator covering roughly 40% of Swedish homes,
and fibre operator Bredbandbolaget. At the end of
2010, TeliaSonera covered 10% of Swedish homes
with NGA, with a take-up rate of c32%.
Uncertainty about regulation remains. The Swedish
regulator, PTS, has proposed forcing TLSN to
unbundle its fibre-optic broadband access network
and offer a full range of wholesale fibre services to
competitors, including fibre and ducts. PTS is
expected to announce its decision on fibre wholesale
prices sometime in Q2 2011.
Mobile connectivity
We see TeliaSonera’s management as frontrunners
in developing sophisticated pricing plans to monetise
the data growth opportunity. TeliaSonera introduced
tiered data pricing plans in mid 2009.
The Swedish market still has high flat-fee offers.
Telenor, Tele2 and Three provide some of their
plans under flat-fee offers. Telenor, which has about
18% market share, falls under our ‘teenage operator’
definition and could disrupt the market in its quest to
increase share and scale. Encouragingly, even
Telenor’s management recently commented that it
sees flat-rate data tariffs as unsustainable. We would
note that although flat-rate tariffs still exist in
Sweden, mobile revenue is already growing at
healthy high-single-digit rates.
On net neutrality, the current thinking of PTS is that
“Traffic prioritisation does not need to be socio-
economically inefficient as long as it takes place on a
market where there is competition; rather it may
often promote consumer benefits instead. Charging
for better performance or access to desirable content
services is a completely natural phenomenon in a
market subject to competition”. In other words, the
regulator seems to understand that charging for
packet prioritisation is perfectly reasonable. The
regulatory view on net neutrality certainly is more
relaxed at an EU level than it is in the US. But it is
plainly helpful that the national regulator has clear
and sensible views on the subject as well.
Fixed line applications
TeliaSonera serves about 15% of Swedish homes
with IPTV, including video on demand, competing
against ComHem (cable), ViaSat (satellite),
Tele2Vision (IPTV) and other TV players.
TeliaSonera has about 450,000 IPTV subscribers or
roughly 10% of Swedish homes.
Mobile applications
TeliaSonera’s management is a firm believer in
telecoms’ core strength being connectivity and
providing super-fast broadband rather than in
services and applications. Hence, TeliaSonera is not
part of WAC (Wholesale Application Community)
or OMA (Open Mobile Alliance).
Investment thesis
Our view is that TeliaSonera has been taking the
right steps by investing in mobile and fixed business
infrastructure and its reasonable exposure to
Eurasian markets should help to drive top-line
growth. However, uncertainty over its Russian and
Turkey assets, along with increased M&A risk and
competition expected in Kazakhstan, make us prefer
Telenor. We have a Neutral rating on the stock
with a target price of SEK58. TeliaSonera’s low
debt levels should provide support for competitive
dividend yields.

147
Telecoms, Media & Technology – Equity 16 February 2011
abc
Financials & valuation: TeliaSonera Neutral Financial statements
Year to 12/2010a 12/2011e 12/2012e 12/2013e
Profit & loss summary (SEKm)
Revenue 106,582 106,041 109,481 110,850EBITDA 37,741 37,242 38,409 38,941Depreciation & amortisation -13,479 -12,598 -12,643 -13,068Operating profit/EBIT 24,262 24,644 25,766 25,873Net interest -1,863 -1,728 -1,630 -1,716PBT 30,001 30,875 32,499 33,097HSBC PBT 30,217 30,900 32,499 33,097Taxation -6,374 -6,416 -6,758 -6,764Net profit 21,322 21,852 22,980 23,461HSBC net profit 22,040 21,877 22,980 23,461
Cash flow summary (SEKm)
Cash flow from operations 27,434 31,767 32,388 33,263Capex -14,934 -14,450 -14,666 -14,574Cash flow from investment -16,476 -14,450 -14,666 -14,574Dividends -10,104 -12,349 -12,828 -13,470Change in net debt -1,726 5,031 -4,894 -5,220FCF equity 14,570 14,634 15,187 15,871
Balance sheet summary (SEKm)
Intangible fixed assets 90,531 90,531 90,531 90,531Tangible fixed assets 58,353 60,205 62,228 63,734Current assets 39,209 24,916 29,432 29,637Cash & others 17,821 3,500 7,500 7,500Total assets 250,551 244,349 257,729 266,577Operating liabilities 27,627 29,084 31,087 32,964Gross debt 67,029 57,739 56,846 51,626Net debt 49,208 54,239 49,346 44,126Shareholders funds 125,907 124,931 134,441 143,759Invested capital 142,645 143,068 143,605 143,439
Ratio, growth and per share analysis
Year to 12/2010a 12/2011e 12/2012e 12/2013e
Y-o-y % change
Revenue -2.4 -0.5 3.2 1.3EBITDA 7.1 -1.3 3.1 1.4Operating profit 8.8 1.6 4.6 0.4PBT 8.6 2.9 5.3 1.8HSBC EPS 3.7 1.3 7.4 2.1
Ratios (%)
Revenue/IC (x) 0.7 0.7 0.8 0.8ROIC 13.4 13.7 14.2 14.3ROE 16.9 17.4 17.7 16.9ROA 9.7 10.4 10.8 10.6EBITDA margin 35.4 35.1 35.1 35.1Operating profit margin 22.8 23.2 23.5 23.3EBITDA/net interest (x) 20.3 21.6 23.6 22.7Net debt/equity 37.1 40.4 33.7 27.8Net debt/EBITDA (x) 1.3 1.5 1.3 1.1CF from operations/net debt 55.8 58.6 65.6 75.4
Per share data (SEK)
EPS Rep (fully diluted) 4.75 4.97 5.34 5.45HSBC EPS (fully diluted) 4.91 4.97 5.34 5.45DPS 2.75 2.98 3.13 3.29Book value 28.04 28.39 31.23 33.39
Key forecast drivers
Year to 12/2010a 12/2011e 12/2012e 12/2013e
TLSN Revenues 106,582 106,041 109,481 110,850TLSN EBITDA adjusted 36,977 37,242 38,409 38,941TLSN PBT adjusted 30,217 30,900 32,499 33,097TLSN Net income adjusted 21,538 21,877 22,980 23,461TLSN FCF definition 12,901 17,331 17,890 18,705
Valuation data
Year to 12/2010a 12/2011e 12/2012e 12/2013e
EV/sales 2.1 2.1 2.0 1.9EV/EBITDA 5.9 6.0 5.6 5.3EV/IC 1.6 1.6 1.5 1.4PE* 11.1 11.0 10.2 10.0P/Book value 1.9 1.9 1.7 1.6FCF yield (%) 8.5 8.6 9.1 9.8Dividend yield (%) 5.0 5.5 5.7 6.0
Note: * = Based on HSBC EPS (fully diluted)
Issuer information
Share price (SEK) 54.50 Target price (SEK) 58.00 Potent'l return (%) 6.4
Reuters (Equity) TLSN.ST Bloomberg (Equity) TLSN SSMarket cap (USDm) 37,772 Market cap (SEKm) 244,730Free float (%) 36 Enterprise value (SEKm) 224545Country Sweden Sector Diversified TelecomsAnalyst Dominik Klarmann Contact +49 211 910 2769
Price relative
28
33
38
43
48
53
58
2009 2010 2011 2012
28
33
38
43
48
53
58
TeliaSonera Rel to OMX
Source: HSBC Note: price at close of 11 Feb 2011

148
Telecoms, Media & Technology – Equity 16 February 2011
abc
Telstra (Overweight, TP AUD3.40) Fixed line connectivity
Telstra’s wireline outlook is dominated by the
current negotiations over the National Broadband
Network (NBN). If its deal with the government
and the NBN Co (with a post-tax NPV to Telstra
of AUD11bn) is approved, it will lease its fixed
network assets to the NBN Co, which will become
the sole wholesale supplier of high-speed
broadband to businesses and consumers in
Australia. The government-funded venture aims
to provide high-speed broadband to households
and businesses nationwide (using FTTH and
wireless), with a price tag of up to cAUD43bn.
Our scenario analysis indicates margin
compression over time as a result of Telstra’s
move away from vertical integration, but we
expect it to be able to port many of its existing
client relationships into the new structure.
Mobile connectivity
Telstra results for the half ending December 2010
indicated that its investment in opex (cAUD1bn
this FY) to rebuild market share is paying off. It
added over 1m accounts in the half (a record),
including 917,000 mobile accounts. The company
is benefiting from strong organic demand for
smartphones, in addition to network problems at
no.3 operator Vodafone Hutchison Australia
(VHA). We believe the company is growing
revenue market share as a result.
Telstra is increasing subsidy levels (particularly in
smartphones) to rebuild market share, rather than
cut prices. However, its shift to capped plans
(allowing larger amounts of usage for a specific
‘cap’) is limiting ARPU gains – postpaid handset
ARPU in the half ending Dec 2010 was down
0.9% y-o-y.
Telstra continues to leverage its Next G wireless
network. This has the best coverage in Australia,
but Telstra erred in allowing tariff premiums to
escalate as competitors cut prices in 2009 and
early 2010. It has now revised its tariffs and
allowances, increasing the appeal to users
frustrated by coverage and capacity shortcomings
at VHA. This operator faces a class action as a
result of a series of network problems over the
past year – the result of issues subsequent to the
Vodafone and Three Australia merger, as well as
network overloading.
The basic pricing model for mobile data is a tiered
structure, with Telstra more aggressive than peers
in charging for usage outside these caps.
Fixed line applications
Telstra’s recent fixed line application strategy has
centred on its T-Hub (VoIP) and T-Box (IPTV)
products – which had 128,000 and 107,000 users at
end December 2010, from launch in early 2010. It is
focused on adding bundled service customers (804k
at end 2010) to reduce customer churn. These are
powered by its Next IP backbone network.
Mobile applications
Telstra’s mobile application strategy remains a
mix: after a period of focusing on vendors such as
HTC for smartphones, it fully embraced the
iPhone 4. It is also working to integrate closer
with Sensis, its advertising business, as more
traffic and activity moves towards mobile.
Investment thesis
Our Overweight rating for Telstra is predicated on
its high dividend yield (c9.6%) and operational
improvement as a result of this year’s “strategic
investment” in EBITDA. We expect Telstra’s
NPV of AUD11bn from the NBN negotiations to
remain secure, and believe its early investment in
the Next G wireless and Next IP wireline
networks has created a durable competitive
advantage relative to its peers.

149
Telecoms, Media & Technology – Equity 16 February 2011
abc
Financials & valuation: Telstra Corp Overweight Financial statements
Year to 06/2010a 06/2011e 06/2012e 06/2013e
Profit & loss summary (AUDm)
Revenue 25,029 25,284 25,176 25,120EBITDA 10,847 10,093 10,532 10,584Depreciation & amortisation -4,346 -4,388 -4,232 -4,111Operating profit/EBIT 6,501 5,705 6,300 6,474Net interest -963 -938 -922 -842PBT 5,538 4,767 5,378 5,631HSBC PBT 5,538 4,193 5,378 5,631Taxation -1,598 -1,290 -1,645 -1,721Net profit 3,883 3,441 3,694 3,869HSBC net profit 3,877 2,935 3,765 3,942
Cash flow summary (AUDm)
Cash flow from operations 8,629 6,801 8,158 8,069Capex -3,595 -3,762 -3,450 -3,507Cash flow from investment -3,466 -3,643 -3,450 -3,507Dividends -3,474 -3,484 -3,484 -3,519Change in net debt -2,820 28 -1,224 -1,043FCF equity 5,434 4,186 4,352 4,486
Balance sheet summary (AUDm)
Intangible fixed assets 1,802 1,802 1,802 1,802Tangible fixed assets 29,120 28,109 27,327 26,723Current assets 7,419 6,561 6,548 6,541Cash & others 2,688 1,000 1,000 1,000Total assets 39,282 37,138 36,343 35,732Operating liabilities 5,807 5,614 5,829 5,905Gross debt 16,763 15,103 13,879 12,835Net debt 14,075 14,103 12,879 11,835Shareholders funds 12,696 11,916 12,092 12,407Invested capital 29,846 29,858 28,848 28,161
Ratio, growth and per share analysis
Year to 06/2010a 06/2011e 06/2012e 06/2013e
Y-o-y % change
Revenue -2.0 1.0 -0.4 -0.2EBITDA -0.1 -6.9 4.3 0.5Operating profit 0.5 -12.2 10.4 2.8PBT -0.6 -13.9 12.8 4.7HSBC EPS 0.1 -24.3 28.3 4.7
Ratios (%)
Revenue/IC (x) 0.8 0.8 0.9 0.9ROIC 14.8 13.4 15.0 15.9ROE 30.9 23.9 31.4 32.2ROA 11.8 11.1 12.0 12.6EBITDA margin 43.3 39.9 41.8 42.1Operating profit margin 26.0 22.6 25.0 25.8EBITDA/net interest (x) 11.3 10.8 11.4 12.6Net debt/equity 108.2 115.9 104.0 92.9Net debt/EBITDA (x) 1.3 1.4 1.2 1.1CF from operations/net debt 61.3 48.2 63.3 68.2
Per share data (AUD)
EPS Rep (fully diluted) 0.31 0.28 0.30 0.31HSBC EPS (fully diluted) 0.31 0.24 0.30 0.32DPS 0.28 0.28 0.28 0.29Book value 1.02 0.96 0.97 1.00
Valuation data
Year to 06/2010a 06/2011e 06/2012e 06/2013e
EV/sales 2.0 2.0 1.9 1.9EV/EBITDA 4.6 5.0 4.6 4.5EV/IC 1.7 1.7 1.7 1.7PE* 9.3 12.3 9.6 9.2P/Book value 2.9 3.0 3.0 2.9FCF yield (%) 15.1 11.7 12.1 12.5Dividend yield (%) 9.6 9.6 9.7 9.8
Note: * = Based on HSBC EPS (fully diluted)
Issuer information
Share price (AUD) 2.91 Target price (AUD) 3.40 Potent'l return (%) 16.8
Reuters (Equity) TLS.AX Bloomberg (Equity) TLS AUMarket cap (USDm) 36,284 Market cap (AUDm) 36,209Free float (%) 50 Enterprise value (AUDm) 50007Country Australia Sector Diversified TelecomsAnalyst Neale Anderson Contact +852 2996 6716
Price relative
11.5
22.5
33.5
44.5
55.5
2009 2010 2011 2012
11.522.533.544.555.5
Telstra Corp Rel to AUSTRALIAN ALL ORDINARIES
Source: HSBC Note: price at close of 11 Feb 2011

150
Telecoms, Media & Technology – Equity 16 February 2011
abc
TIM Participações (Overweight, TP BRL7.50) Fixed line connectivity
TIM Participações is effectively a mobile pure-play,
having relatively little revenue exposure to fixed line
via its 2009 acquisition of Brazilian long-distance
altnet Intelig. Unbundling is not a major problem for
fixed-line players in Brazil as most local access
competition is facilities-based (although players like
fibre-based altnet GVT and dominant cable player
NET Serviços offer enough competition for the
incumbents, we would argue). Neither is net
neutrality a hot issue for the Brazilian regulator
Anatel at the moment it seems, generating little
public comment on the matter thus far.
Mobile connectivity
Although smartphone penetration in Brazil is low –
excluding QWERTY devices like the BlackBerry,
we estimate penetration of true smartphones is in the
low single digits – we expect it to rise steadily in
coming years, driven by continued steep price
erosion of Android-based smartphones, primarily
produced by Asian vendors. TIM has thus far not
fully exploited the mobile data opportunity in Brazil
we would argue, having instead focused up to this
point mainly on voice services. This is changing
though as the firm re-vamped its data offering in H2
and placed greater emphasis on selling smartphones
in the fourth quarter, we believe. Data as a
percentage of mobile service revenues is in the low-
teens we estimate, which compares with more than
20% at data leader Vivo, highlighting the potential
growth upside.
Given relatively low levels of data traffic on its
network, TIM has not experienced capacity issues,
and continues to invest primarily in increasing its 3G
footprint, which is now around 60% of the urban
population. Although the data pricing environment
in Brazil is less aggressive than the voice market,
TIM is offering some of the more competitive tariffs
in the market at the moment, including a BRL0.50
per day flat rate for a 300kbps service (but crucially
with bandwidth throttled to a maximum of 50kbps
after a threshold of 10MB per day or 300MB per
month has been reached). Unlike Vivo and America
Movil’s Claro unit, which focus primarily on the
corporate and high-end consumer segments of the
mobile data market, TIM is focused firmly on the
large, but lower-income C-class (c60% of Brazil’s
population), targeting users who typically require
only email, instant messaging and social networking
rather than video or other high-bandwidth services.
We believe that lacking the massive capital
resources of its rivals (which are controlled by the
two dominant Latin American telecoms groups,
America Movil and Telefonica), it is sensible for
TIM to pursue a differentiated strategy rather than
try to compete head-to-head.
Fixed line applications
With no local access wireline presence TIM does not
have plans to enter the pay-TV market.
Mobile applications
TIM lacks the scale of regional giants America
Movil and Telefonica. As we do not expect these
players to stand much chance of securing a more
central role in the applications value chain, we see
even less chance for TIM. Note that unlike the
revenue share model for the Apple App Store
(whereby operators generally receive nothing),
Google’s Android Market often has provisions for
revenue shares with operators (with Google instead
taking little or no revenue itself).
Investment thesis
We rate TIM Participações Overweight. Following
the fixed-mobile merger of America Movil and
Telmex Internacional and the pending fixed-mobile
merger of Vivo and Telesp (the Sao Paulo wireline
incumbent), we believe TIM is the clearest way to
play the mobile data scarcity theme in Latin
America.

151
Telecoms, Media & Technology – Equity 16 February 2011
abc
Financials & valuation: TIM Participações Overweight Financial statements
Year to 12/2009a 12/2010e 12/2011e 12/2012e
Profit & loss summary (BRLm)
Revenue 13,744 14,404 15,907 16,836EBITDA 3,469 4,164 4,668 5,032Depreciation & amortisation -2,693 -2,701 -2,765 -2,882Operating profit/EBIT 776 1,464 1,903 2,150Net interest 253 -258 -174 -117PBT 1,030 1,205 1,729 2,033HSBC PBT 1,094 1,205 1,729 2,033Taxation -6 -255 -415 -488Net profit 1,024 951 1,314 1,545HSBC net profit 710 795 1,141 1,342
Cash flow summary (BRLm)
Cash flow from operations 2,331 3,400 4,075 4,402Capex -2,690 -2,935 -2,964 -3,620Cash flow from investment -2,690 -2,935 -2,964 -3,620Dividends 0 -201 -225 -409Change in net debt -394 -279 -886 -374FCF equity 1,015 712 1,110 783
Balance sheet summary (BRLm)
Intangible fixed assets 4,494 3,930 2,977 2,251Tangible fixed assets 5,323 5,866 7,018 8,482Current assets 6,767 5,621 6,538 7,005Cash & others 2,559 1,404 2,290 2,664Total assets 17,450 16,402 17,519 18,723Operating liabilities 4,320 3,307 3,519 3,931Gross debt 4,160 2,726 2,726 2,726Net debt 1,601 1,322 436 62Shareholders funds 8,323 8,678 9,583 10,376Invested capital 9,705 10,705 10,725 11,144
Ratio, growth and per share analysis
Year to 12/2009a 12/2010e 12/2011e 12/2012e
Y-o-y % change
Revenue 5.1 4.8 10.4 5.8EBITDA 19.6 20.0 12.1 7.8Operating profit 58.1 88.5 30.0 13.0PBT 788.5 17.0 43.4 17.6HSBC EPS 273.2 7.7 43.4 17.6
Ratios (%)
Revenue/IC (x) 1.4 1.4 1.5 1.5ROIC 5.2 9.5 11.7 13.0ROE 8.8 9.4 12.5 13.4ROA 8.3 9.0 9.0 9.6EBITDA margin 25.2 28.9 29.3 29.9Operating profit margin 5.6 10.2 12.0 12.8EBITDA/net interest (x) 16.1 26.8 43.1Net debt/equity 19.2 15.2 4.6 0.6Net debt/EBITDA (x) 0.5 0.3 0.1 0.0CF from operations/net debt 145.6 257.2 933.9 7047.8
Per share data (BRL)
EPS Rep (fully diluted) 0.43 0.38 0.53 0.62HSBC EPS (fully diluted) 0.30 0.32 0.46 0.54DPS 0.13 0.14 0.17 0.30Book value 3.50 3.51 3.87 4.19
Key forecast drivers
Year to 12/2009a 12/2010e 12/2011e 12/2012e
Subscribers 41,102 51,028 56,066 59,899ARPU 27 24 22 22Service revenues 12,806 13,652 15,117 16,098Handset revenue 938 752 789 739Total revenues 13,744 14,404 15,907 16,836
Valuation data
Year to 12/2009a 12/2010e 12/2011e 12/2012e
EV/sales 1.3 1.2 1.0 1.0EV/EBITDA 5.1 4.2 3.5 3.2EV/IC 1.8 1.6 1.5 1.4PE* 20.2 18.7 13.1 11.1P/Book value 1.7 1.7 1.6 1.4FCF yield (%) 6.3 4.5 6.9 4.9Dividend yield (%) 2.1 2.3 2.7 5.0
Note: * = Based on HSBC EPS (fully diluted)
Issuer information
Share price (BRL) 6.02 Target price (BRL) 7.50 Potent'l return (%) 24.6
Reuters (Equity) TCSL4.SA Bloomberg (Equity) TCSL4 BZMarket cap (USDm) 9,568 Market cap (BRLm) 15,983Free float (%) 30 Enterprise value (BRLm) 17,305Country Brazil Sector Wireless TelecomsAnalyst Richard Dineen Contact 1 212 525 6707
Price relative
1
2
3
4
5
6
7
8
2009 2010 2011 2012
1
2
3
4
5
6
7
8
TIM Participacoes Rel to BOVESPA INDEX
Source: HSBC Note: price at close of 11 Feb 2011

152
Telecoms, Media & Technology – Equity 16 February 2011
abc
TPSA (Underweight, TP PLN15.3) Fixed line connectivity
TPSA has an ADSL-based network to provide
high-speed broadband. In 2009, it entered into an
agreement with the regulator that requires TPSA
to provide high-speed broadband to 1.2m lines,
which will need an investment of cPLN3bn over
three years. That has helped to ease the regulatory
pressure somewhat. We expect the regulator to
intervene less as the network improvement
continues. However, convergence with European
regulations may increase net neutrality threat.
Polish subscribers spend relatively little on
broadband. TPSA is working to increase its
market share using triple-play services. In 2010, it
reduced fixed-line broadband pricing, through
which it intends to re-engage with the core
market. TPSA also continues to roll out TV
services to its broadband subscribers.
Competing offerings, however, are strong in
Poland, mainly from cable operators, which are
upgrading their networks to DOCSIS3.0. Overall,
we consider TPSA vulnerable to the cable threat.
Mobile connectivity
In Poland, tariffs are data tiered. Some packages
are marketed as unlimited, but in fact are
capacity-limited. There is no all-you-can-eat data
plan currently, which gives pricing power to the
mobile operators. However, new entrants like P4
look to undercut the larger operators on pricing,
thereby providing tough competition.
TPSA’s mobile broadband subscribers make up
less than 4% of its mobile subscribers, which
seems to reflect weaker demand for broadband
services and increased competition in mobile data
from P4. Non-voice revenue has not increased
significantly over the past two years, remaining
around 24% of revenue for TPSA. We believe
pricing power may change significantly if data
pricing becomes irrational, like the reductions in
voice tariffs after MTR cuts in 2009.
Fixed-line applications
IPTV is considered an add-on in Poland, with
users reluctant to pay unless real premium content
is provided. In October 2010, TPSA signed a 10-
year content agreement with TVN group to cross-
sell each other’s services, with a special focus on
multi-play bundles. TPSA’s own portal,
Wirtualna Polska, is one of the most frequently
visited websites in Poland. TPSA is also trying to
leverage its subsidiaries to venture into adjacent
sectors like payment and e-commerce.
Competing offerings on content are strong. UPC has
had experience providing media content in CE3 with
cable since the late 1990s. It is plausible that certain
OTT competitors may challenge IPTV services and
well-established brands in the pay-TV market.
Mobile applications
TPSA has no substantial advantage over global
players in content and data applications, despite
its familiarity with the local culture. We expect
low-cost smartphones based on the Android
platform to drive internet usage in Poland.
However, language may present a barrier to
would-be developed-world competitors, so TPSA
may not be completely dis-intermediated from the
applications layer.
Investment thesis
TPSA is trading at the top end of its five-year PE
band of 10x to 16x. We believe TPSA does not
warrant a premium over its CE3 peers, because of
the uncertainties involving DPTG claims. If the
recent claim by DPTG is taken into account, it
could almost halve EPS for 2011. Furthermore, its
dividend yield offers a much smaller spread over
the sovereign bond yield compared with
TelefonicaO2 CZ.

153
Telecoms, Media & Technology – Equity 16 February 2011
abc
Financials & valuation: TPSA Underweight Financial statements
Year to 12/2009a 12/2010e 12/2011e 12/2012e
Profit & loss summary (PLNm)
Revenue 16,560 15,631 15,375 15,095EBITDA 6,280 4,742 5,786 5,712Depreciation & amortisation -4,183 -3,801 -3,564 -3,364Operating profit/EBIT 2,097 941 2,222 2,348Net interest -363 -389 -327 -336PBT 1,598 508 1,895 2,012HSBC PBT 1,823 1,639 1,895 2,012Taxation -315 -321 -379 -402Net profit 1,281 184 1,514 1,608HSBC net profit 1,456 1,309 1,514 1,608
Cash flow summary (PLNm)
Cash flow from operations 5,541 4,720 5,070 4,931Capex -2,207 -2,516 -2,760 -2,717Cash flow from investment -2,281 -2,632 -2,760 -2,717Dividends -2,004 -2,004 -2,003 -2,003Change in net debt -1,268 -229 -307 -211FCF equity 3,337 1,508 2,299 2,191
Balance sheet summary (PLNm)
Intangible fixed assets 7,298 7,236 7,236 7,236Tangible fixed assets 17,743 16,456 15,652 15,005Current assets 4,189 3,610 3,902 4,057Cash & others 2,218 1,539 1,846 2,057Total assets 29,365 27,416 26,903 26,411Operating liabilities -4,756 -7,505 -7,480 -7,381Gross debt 6,499 5,591 5,591 5,591Net debt 4,281 4,052 3,745 3,534Shareholders funds 16,539 12,694 12,205 11,809Invested capital 31,768 33,268 32,424 31,622
Ratio, growth and per share analysis
Year to 12/2009a 12/2010e 12/2011e 12/2012e
Y-o-y % change
Revenue -8.8 -5.6 -1.6 -1.8EBITDA -16.5 -24.5 22.0 -1.3Operating profit -36.7 -55.1 136.1 5.7PBT -38.4 -68.2 273.5 6.2HSBC EPS -33.1 -10.1 15.7 6.2
Ratios (%)
Revenue/IC (x) 0.5 0.5 0.5 0.5ROIC 5.1 2.3 5.4 5.9ROE 8.6 9.0 12.2 13.4ROA 5.3 2.0 6.7 7.2EBITDA margin 37.9 30.3 37.6 37.8Operating profit margin 12.7 6.0 14.5 15.6EBITDA/net interest (x) 17.3 12.2 17.7 17.0Net debt/equity 25.9 31.9 30.6 29.9Net debt/EBITDA (x) 0.7 0.9 0.6 0.6CF from operations/net debt 129.4 116.5 135.4 139.5
Per share data (PLN)
EPS Rep (fully diluted) 0.96 0.14 1.13 1.20HSBC EPS (fully diluted) 1.09 0.98 1.13 1.20DPS 1.50 1.50 1.50 1.50Book value 12.38 9.50 9.14 8.84
Key forecast drivers
Year to 12/2009a 12/2010e 12/2011e 12/2012e
Reported revenue (PLNm) 16,560 15,631 15,375 15,095Reported EBITDA (PLNm) 6,280 4,742 5,786 5,712Reported EBIT (PLNm) 1,961 896 2,222 2,348Reported PBT (PLNm) 1,598 508 1,895 2,012Reported EPS (PLN) 0.96 0.14 1.13 1.20
Valuation data
Year to 12/2009a 12/2010e 12/2011e 12/2012e
EV/sales 1.6 1.7 1.7 1.7EV/EBITDA 4.2 5.5 4.5 4.5EV/IC 0.8 0.8 0.8 0.8PE* 15.2 16.9 14.6 13.8P/Book value 1.3 1.7 1.8 1.9FCF yield (%) 15.1 6.8 10.4 9.9Dividend yield (%) 9.1 9.1 9.1 9.1
Note: * = Based on HSBC EPS (fully diluted)
Issuer information
Share price (PLN) 16.57 Target price (PLN) 15.30 Potent'l return (%) -7.7
Reuters (Equity) TPSA.WA Bloomberg (Equity) TPS PWMarket cap (USDm) 7,657 Market cap (PLNm) 22,132Free float (%) 50 Enterprise value (PLNm) 26086Country Poland Sector Diversified TelecomsAnalyst Herve Drouet Contact 44 20 7991 6827
Price relative
8101214161820222426
2009 2010 2011 2012
8101214161820222426
TPSA Rel to WIG 20
Source: HSBC Note: price at close of 11 Feb 2011 Stated accounts as of 31 Dec 2005 are IFRS compliant
154
Telecoms, Media & Technology – Equity 16 February 2011
abc
Turk Telekom (Underweight, TP TRY6.80) Fixed line connectivity
Broadband is the growth driver for the Turkish
telecom market, but fixed broadband growth in
Turkey is hampered by low PC penetration.
Subscriber growth will be hard to come by in the
near future, and we are sceptical about the short-term
growth potential of fixed broadband. We believe it
will be constrained by the small gap between PC
penetration and broadband penetration (households
with PC but no broadband), as well as Turkcell’s
aggressive promotion of 3G.
Average revenue per line (ARPL) is increasing,
however, mainly owing to the company’s focus on
up-selling/upgrading services to existing clients.
With more than 70% of its users already subscribed
to its highest-speed package (up to 8Mbps), and
more than 50% using unlimited packages, the scope
for further increase in ARPL looks quite limited.
We believe that Turk Telekom’s attempt to increase
prices for unlimited packages in 2011 and impose
fair usage quotas could adversely affect its
subscriber and ARPL growth in the near term.
Furthermore, the nominal price increase would not
translate into pricing power, in real terms, owing to
the c7% inflation in Turkey in 2011 forecast by
HSBC economists. Positives for Turk Telekom
include the absence of regulations on net neutrality,
and the fact that local loop unbundling remains
unattractive for altnets.
Mobile connectivity
3G services, heavily promoted by Turkcell, are
driving broadband growth in Turkey. Tariffs in
Turkey are data tiered and there is currently no “all
you can eat” data plan, which gives mobile operators
the pricing power. Turkcell has recently launched
competitive tariff plans in the post-paid segment,
while Vodafone Turkey is increasingly pushing
wireless data with increased 3G coverage. We
believe pricing power may diminish significantly if
data pricing becomes irrational – similar to the
competition seen in the voice segment post
introduction of mobile number portability in
November 2008.
Fixed line applications
It is plausible that certain OTT competitors could
pose a threat to the established brands in the pay-TV
market in Turkey. However, factors such as the
complexities of rights arrangements, the power of
existing brands and the absence of net neutrality
regulations could give incumbents significant pricing
power and advantages.
Mobile applications
Mobile operators in Turkey – particularly Turkcell –
have focused on capturing the applications layer.
Even Avea (TurkTelekom mobile subsidiary) has
attempted to develop innovative applications aimed
at certain segments. We expect Turkish mobile
operators to keep their edge over the global players
on data content as they have the advantage of being
familiar with the local culture. We expect low-cost
smartphones based on the Android platform to drive
internet usage. However, language may present a
barrier to would-be developed world competitors. As
a result, Avea may not be completely
disintermediated from the applications layer.
Investment thesis
We forecast 2011 pro forma revenue growth of 4.8%
and an EBITDA margin of 45.3%. HSBC
economists expect 7% inflation in Turkey in 2011,
implying a revenue decline, in real terms, for Turk
Telekom. In our view, wage inflation could be a
serious threat to its EBITDA margin as personnel
costs still account for c20% of its fixed-line revenue.
There is also not much scope for a significant
reduction in the employee headcount. It is trading at
a premium to its peer group, which we believe is
unwarranted. Its dividend yield implies a negative
spread to the country’s long-term bond yield.

155
Telecoms, Media & Technology – Equity 16 February 2011
abc
Financials & valuation: Turk Telekom Underweight Financial statements
Year to 12/2010a 12/2011e 12/2012e 12/2013e
Profit & loss summary (TRYm)
Revenue 10,852 11,570 12,201 12,782EBITDA 4,835 5,245 5,542 5,707Depreciation & amortisation -1,524 -1,620 -1,640 -1,651Operating profit/EBIT 3,311 3,626 3,902 4,056Net interest -97 -259 -243 -334PBT 3,127 3,366 3,658 3,722HSBC PBT 2,750 3,366 3,658 3,722Taxation -799 -673 -732 -744Net profit 2,451 2,703 2,927 2,978HSBC net profit 2,107 2,703 2,927 2,978
Cash flow summary (TRYm)
Cash flow from operations 3,844 4,266 4,630 4,677Capex -1,733 -1,998 -1,931 -1,951Cash flow from investment -1,523 -1,998 -2,949 -1,951Dividends -1,590 -2,244 -2,459 -2,780Change in net debt -382 -24 778 55FCF equity 2,165 2,289 2,641 2,713
Balance sheet summary (TRYm)
Intangible fixed assets 3,570 3,570 4,071 4,071Tangible fixed assets 7,161 7,539 7,830 8,130Current assets 3,712 2,712 3,466 3,559Cash & others 1,875 847 1,500 1,500Total assets 15,100 14,478 16,023 16,416Operating liabilities -2,957 -3,153 -3,639 -3,828Gross debt 4,164 3,112 4,542 4,597Net debt 2,289 2,265 3,042 3,097Shareholders funds 6,175 6,418 6,564 6,713Invested capital 15,525 16,127 17,505 18,087
Ratio, growth and per share analysis
Year to 12/2010a 12/2011e 12/2012e 12/2013e
Y-o-y % change
Revenue 2.7 6.6 5.4 4.8EBITDA 11.0 8.5 5.7 3.0Operating profit 18.3 9.5 7.6 4.0PBT 32.5 7.7 8.7 1.7HSBC EPS 23.5 28.3 8.3 1.7
Ratios (%)
Revenue/IC (x) 0.7 0.7 0.7 0.7ROIC 16.2 18.3 18.6 18.2ROE 36.3 42.9 45.1 44.9ROA 18.0 20.0 20.8 20.6EBITDA margin 44.5 45.3 45.4 44.7Operating profit margin 30.5 31.3 32.0 31.7EBITDA/net interest (x) 50.1 20.2 22.8 17.1Net debt/equity 34.2 32.7 46.3 46.1Net debt/EBITDA (x) 0.5 0.4 0.5 0.5CF from operations/net debt 167.9 188.4 152.2 151.0
Per share data (TRY)
EPS Rep (fully diluted) 0.70 0.77 0.84 0.85HSBC EPS (fully diluted) 0.60 0.77 0.84 0.85DPS 0.64 0.70 0.79 0.81Book value 1.76 1.83 1.88 1.92
Key forecast drivers
Year to 12/2010a 12/2011e 12/2012e 12/2013e
Mobile penetration (%) 85.6 91.8 97.6 102.9Mobile revenue (TRYm) 2,646 2,958 3,453 3,949Mobile EBITDA (TRYm) 332 629 898 1,058Broadband HH penetration (%) 38.0 40.9 43.6 46.2Fixed line revenue (TRYm) 8,511 8,938 9,091 9,192Fixed line EBITDA (TRYm) 4,507 4,616 4,644 4,649
Valuation data
Year to 12/2010a 12/2011e 12/2012e 12/2013e
EV/sales 2.5 2.4 2.3 2.2EV/EBITDA 5.7 5.3 5.1 5.0EV/IC 1.8 1.7 1.6 1.6PE* 11.8 9.2 8.5 8.4P/Book value 4.0 3.9 3.8 3.7FCF yield (%) 8.6 9.1 10.4 10.7Dividend yield (%) 9.0 9.9 11.2 11.4
Note: * = Based on HSBC EPS (fully diluted)
Issuer information
Share price (TRY) 7.12 Target price (TRY) 6.80 Potent'l return (%) -4.5
Reuters (Equity) TTKOM.IS Bloomberg (Equity) TTKOM TIMarket cap (USDm) 15,702 Market cap (TRYm) 24,920Free float (%) 13 Enterprise value (TRYm) 27545Country Turkey Sector Diversified TelecomsAnalyst Herve Drouet Contact 44 20 7991 6827
Price relative
123456789
2009 2010 2011 2012
123456789
Turk Telekom Rel to ISTANBUL COMP
Source: HSBC Note: price at close of 11 Feb 2011 Stated accounts as of 31 Dec 2006 are IFRS compliant

156
Telecoms, Media & Technology – Equity 16 February 2011
abc
Verizon (Overweight, TP USD41) Fixed line connectivity
The FCC’s Triennial Review in 2003 largely
withdrew support for unbundling (known in the US
as UNE-P, Unbundled Network Elements –
Platform) of incumbent local access fibre
investments. This shift almost immediately
prompted Verizon and AT&T to initiate extensive
fibre projects: FiOS and U-verse respectively. Over
the past five years unbundled providers in fibred
areas in the US have all but disappeared.
While unbundling regulation has favoured the
incumbents, the FCC has taken a hard line on net
neutrality. This is understandable given the
strategic importance of US Internet companies
(whose products and services may be exported,
unlike those of the domestically-focused RBOCs).
In a December 2010 decision, the FCC agreed a
new policy that preserves strict net neutrality
principles for fixed-line services while permitting
some “traffic management” on mobile networks.
Mobile connectivity
The US is among the most advanced mobile data
markets in the world. Verizon reports that around
26% of its base currently has a smartphone – a
figure which it expects to double to around 50%
by end-2011, driven primarily by sales of the first
CDMA iPhone4, available since early February.
We expect a significant portion of Verizon’s
existing base to migrate to the iPhone and for it to
gain an increasing share of postpaid net additions
over the next two years as customers on other
networks switch as their contracts expire, attracted
by Verizon’s reputation for superior network
coverage and quality. Until this point Verizon has
not experienced any major network outages as a
result of smartphone demand, although this could
clearly change as smartphone penetration is
expected to double this year.
Verizon Wireless has resisted following AT&T in
moving to tiered data plans and still offers
smartphone customers a single USD30 flat-rate plan,
although it has not ruled out moving to tiers longer-
term. We believe that sticking with unlimited for the
time being is primarily a tactical move designed to
maximise initial sales of the iPhone. Verizon
Wireless generally enjoys stronger pricing power
than rivals, which stems from the broad customer
perception that it leads the market in terms of
network quality. Unlike AT&T, Verizon Wireless
does not currently or plan to use public WiFi as a
means of offloading traffic. However, we expect
Verizon’s attitude here to be flexible, particularly as
the impact of doubling its smartphone base on the
network is unknown at this stage.
Fixed line applications
Verizon’s FiOS TV competes head-to-head with
cable in areas where FiOS is deployed and
selectively against satellite players, as the firm
also re-sells DirecTV satellite services for
customers outside the FiOS footprint. FiOS TV
has garnered 3.5m customers thus far averaging
28% penetration in areas available for sale.
Mobile applications
Being the home of Apple and Google, the RBOCs
are strongly challenged in the mobile applications
space. Initial attempts by operators to promote the
LIMO Foundation (Linux Mobile) as a more
equitable partnership with application developers
have largely failed, crushed by the momentum of the
Apple App Store and Google’s Android Market. We
see little chance of operators re-gaining lost ground.
Investment thesis
We rate Verizon Overweight and increase our
target price to USD41 (from USD37). The firm is
well-placed to exploit mobile capacity scarcity,
we believe, and we expect particularly strong data
revenue momentum this year driven by the
iPhone.

157
Telecoms, Media & Technology – Equity 16 February 2011
abc
Financials & valuation: Verizon Communications Overweight Financial statements
Year to 12/2010a 12/2011e 12/2012e 12/2013e
Profit & loss summary (USDm)
Revenue 106,565 110,599 118,385 123,006EBITDA 33,154 36,422 39,640 41,235Depreciation & amortisation -16,349 -16,505 -16,487 -16,633Operating profit/EBIT 16,805 19,917 23,153 24,601Net interest -2,523 -2,681 -2,507 -2,051PBT 14,790 17,759 21,185 23,105HSBC PBT 17,343 18,034 21,185 23,105Taxation -3,189 -3,175 -4,079 -4,560Net profit 3,933 6,300 7,791 8,662HSBC net profit 6,479 6,539 7,791 8,662
Cash flow summary (USDm)
Cash flow from operations 34,767 30,595 33,514 34,887Capex -16,458 -16,792 -16,767 -17,074Cash flow from investment -11,971 -16,792 -16,767 -17,074Dividends -5,412 -5,395 -5,348 -6,029Change in net debt -14,179 -7,926 -11,398 -11,783FCF equity 10,953 13,645 15,843 17,549
Balance sheet summary (USDm)
Intangible fixed assets 100,814 99,359 97,947 97,007Tangible fixed assets 87,711 89,453 91,145 92,526Current assets 22,348 25,319 37,885 50,361Cash & others 7,216 9,890 21,288 33,071Total assets 220,005 223,786 237,171 250,643Operating liabilities 23,055 22,853 25,162 26,419Gross debt 52,794 47,542 47,542 47,542Net debt 45,578 37,652 26,254 14,471Shareholders funds 41,660 42,612 44,374 46,704Invested capital 180,602 181,388 180,527 180,403
Ratio, growth and per share analysis
Year to 12/2010a 12/2011e 12/2012e 12/2013e
Y-o-y % change
Revenue -1.2 3.8 7.0 3.9EBITDA 8.5 9.9 8.8 4.0Operating profit 16.8 18.5 16.2 6.3PBT 24.3 20.1 19.3 9.1HSBC EPS -4.4 0.9 19.1 11.2
Ratios (%)
Revenue/IC (x) 0.6 0.6 0.7 0.7ROIC 8.2 9.7 11.0 11.4ROE 15.6 15.5 17.9 19.0ROA 6.1 7.7 8.4 8.6EBITDA margin 31.1 32.9 33.5 33.5Operating profit margin 15.8 18.0 19.6 20.0EBITDA/net interest (x) 13.1 13.6 15.8 20.1Net debt/equity 52.4 39.2 24.5 12.1Net debt/EBITDA (x) 1.4 1.0 0.7 0.4CF from operations/net debt 76.3 81.3 127.7 241.1
Per share data (USD)
EPS Rep (fully diluted) 1.38 2.22 2.74 3.05HSBC EPS (fully diluted) 2.28 2.30 2.74 3.05DPS 1.93 2.02 2.12 2.23Book value 14.66 15.00 15.62 16.44
Key forecast drivers
Year to 12/2010a 12/2011e 12/2012e 12/2013e
Verizon revenues 106,565 110,599 118,385 123,006Verizon EBITDA adjusted 35,911 36,697 39,640 41,235Verizon EBIT adjusted 19,866 20,716 23,692 25,156Verizon PBT adjusted 17,343 18,034 21,185 23,105Verizon EPS adjusted 2.28 2.30 3.05 3.32
Valuation data
Year to 12/2010a 12/2011e 12/2012e 12/2013e
EV/sales 1.7 1.6 1.4 1.2EV/EBITDA 5.6 4.8 4.0 3.5EV/IC 1.0 1.0 0.9 0.8PE* 16.0 15.8 13.3 11.9P/Book value 2.5 2.4 2.3 2.2FCF yield (%) 7.9 10.0 11.8 13.5Dividend yield (%) 5.3 5.6 5.8 6.1
Note: * = Based on HSBC EPS (fully diluted)
Issuer information
Share price (USD) 36.39 Target price (USD) 41.00 Potent'l return (%) 12.7
Reuters (Equity) VZ.N Bloomberg (Equity) VZ USMarket cap (USDm) 101,892 Market cap (USDm) 101,892Free float (%) 100 Enterprise value (USDm) 174671Country United States Sector Diversified TelecomsAnalyst Richard Dineen Contact 1 212 525 6707
Price relative
18
23
28
33
38
43
2009 2010 2011 2012
18
23
28
33
38
43
Verizon Communications Rel to S&P 500
Source: HSBC Note: price at close of 11 Feb 2011

158
Telecoms, Media & Technology – Equity 16 February 2011
abc
Vodafone (Overweight, TP 230p) Mobile connectivity
Vodafone was one of the first operators globally to
push for more sophisticated data charging structures.
At the company’s Q3 2010/11 results, management
highlighted that tiered data tariffs had now been
introduced in eight of its European markets, and that
the remainder were to follow during the course of
the present quarter. Additionally, the UK network
had undertaken a successful experiment with what it
has termed, ‘smart notification’. This involves
contacting those customers whose data consumption
is approaching the top end of their data cap, and
either offering to sell them an incremental block of
usage or suggesting that they take a plan with a
greater allocation. This approach is shortly to be
extended to the Dutch and German markets, and
then rolled out across the rest of the company’s
European footprint.
However, we also remain of the view that the
tremendous growth in data volumes will require
capex to support. Indeed, it has always been one of
Vodafone’s strengths that it has generally out-
invested its rivals to maintain network quality
leadership. At Vodafone’s interim 2010/11 results in
November, management said that capex was likely
to rise, albeit modestly. We think that it will become
easier to justify the incremental investment to the
markets as the appeal of the data growth story
becomes progressively clearer. Meanwhile, though,
the experience of Vodafone’s Australian JV with
Three exposes the danger of running an
infrastructure inadequate to users’ demands. There is
even talk (see ABC News, 27 December 2010)
about the potential of a class action lawsuit from
disgruntled customers frustrated with the inadequate
coverage and bandwidth. (We should stress at this
point that the operation here is too small a part of the
overall group to undermine our positive stance on
the stock).
Mobile applications
Vodafone has made some efforts in the mobile
applications layer to counter the strides taken by
Apple and Google, but initiatives like its 360
platform and participation in the Wholesale
Application Community (WAC) look – at best –
more like bargaining chips aimed primarily at
keeping the technology giants as co-operative as
possible. Nor does Vodafone (in common with most
other operators) seem to have much enthusiasm for
the GSMA’s RCS initiative. It is therefore difficult
to avoid the conclusion that the applications layer is
moving beyond the company’s reach. Clearly,
though, it is in Vodafone’s interest to ensure that the
smartphone platform arena is as competitive as
possible. This may mean supporting players that
have lagged in this space, such as Nokia/Microsoft
and RIM. We remain of the view that operators’
provision of handset subsidies is actually a strategic
strength, as it makes it hazardous for vendors to
pursue wholesale or soft SIM strategies.
Investment thesis
We believe that Vodafone should be a substantial
beneficiary as capacity constraints bestow pricing
power on the operators. However, much of the
recent appreciation in the share price is simply due to
signs of a more pragmatic approach from
management on the group’s portfolio of assets.
Vodafone’s stake in China Mobile has now been
sold, and funds used to buy back shares. Following
statements from Verizon’s management, a
resumption of the dividend from the US now looks
very likely. In line with the company comments,
there is also the prospect that Vivendi may buy full
ownership of SFR. Potential triggers such as these in
combination with our strategic view relating to
mobile data pricing power underpin our Overweight
stance. We note that consensus revenue forecasts
remain well short of company guidance for growth
of up to 4%.

159
Telecoms, Media & Technology – Equity 16 February 2011
abc
Financials & valuation: Vodafone Group Overweight Financial statements
Year to 03/2010a 03/2011e 03/2012e 03/2013e
Profit & loss summary (GBPm)
Revenue 44,472 45,555 46,476 47,648EBITDA 14,735 14,659 14,825 15,168Depreciation & amortisation -9,997 -8,870 -8,118 -8,060Operating profit/EBIT 4,738 5,789 6,707 7,108Net interest -796 138 -929 -944PBT 8,674 13,776 11,531 12,348HSBC PBT 10,564 11,165 11,531 12,348Taxation -56 -1,962 -2,398 -2,632Net profit 8,645 11,858 8,954 9,513HSBC net profit 7,836 8,293 8,341 8,913
Cash flow summary (GBPm)
Cash flow from operations 13,179 12,212 12,483 15,456Capex -4,841 -4,684 -5,391 -5,956Cash flow from investment -9,209 -2,826 -8,391 -5,456Dividends -4,139 -4,476 -4,647 -4,894Change in net debt -1,511 -4,016 490 -5,781FCF equity 9,042 8,176 6,098 5,576
Balance sheet summary (GBPm)
Intangible fixed assets 74,258 72,987 73,489 71,991Tangible fixed assets 20,642 19,051 18,822 19,216Current assets 14,219 20,797 13,343 14,129Cash & others 4,811 11,157 3,565 4,175Total assets 156,985 158,960 155,675 155,358Operating liabilities 17,453 19,676 20,173 20,889Gross debt 39,795 42,125 35,023 29,852Net debt 34,984 30,968 31,458 25,677Shareholders funds 90,381 89,468 92,928 97,180Invested capital 86,855 82,002 81,916 80,271
Ratio, growth and per share analysis
Year to 03/2010a 03/2011e 03/2012e 03/2013e
Y-o-y % change
Revenue 8.4 2.4 2.0 2.5EBITDA 1.7 -0.5 1.1 2.3Operating profit 168.3 22.2 15.9 6.0PBT 107.1 58.8 -16.3 7.1HSBC EPS 2.3 6.5 2.6 6.9
Ratios (%)
Revenue/IC (x) 0.5 0.5 0.6 0.6ROIC 8.5 8.5 8.9 9.3ROE 8.9 9.2 9.1 9.4ROA 6.0 7.4 6.3 6.7EBITDA margin 33.1 32.2 31.9 31.8Operating profit margin 10.7 12.7 14.4 14.9EBITDA/net interest (x) 18.5 16.0 16.1Net debt/equity 38.5 34.6 33.9 26.5Net debt/EBITDA (x) 2.4 2.1 2.1 1.7CF from operations/net debt 37.7 39.4 39.7 60.2
Per share data (GBPp)
EPS Rep (fully diluted) 16.44 22.69 17.49 18.58HSBC EPS (fully diluted) 14.90 15.87 16.29 17.41DPS 8.31 8.89 9.56 10.28Book value 171.88 171.20 181.50 189.80
Key forecast drivers
Year to 03/2010a 03/2011e 03/2012e 03/2013e
Europe 32,833 31,693 31,555 31,871AMAP 11,089 13,331 14,380 15,221Other 550 531 542 555Revenue HSBC 44,472 45,555 46,476 47,648Adjusted operating profit 11,466 12,105 12,460 13,292
Valuation data
Year to 03/2010a 03/2011e 03/2012e 03/2013e
EV/sales 2.0 1.9 1.8 1.7EV/EBITDA 6.0 5.8 5.8 5.4EV/IC 1.0 1.0 1.0 1.0PE* 12.1 11.3 11.0 10.3P/Book value 1.0 1.1 1.0 0.9FCF yield (%) 17.0 15.0 11.2 9.9Dividend yield (%) 4.6 4.9 5.3 5.7
Note: * = Based on HSBC EPS (fully diluted)
Issuer information
Share price (GBPp) 180 Target price (GBPp) 230 Potent'l return (%) 27.8
Reuters (Equity) VOD.L Bloomberg (Equity) VOD LNMarket cap (USDm) 149,443 Market cap (GBPm) 93,390Free float (%) 100 Enterprise value (GBPm) 85413Country United Kingdom Sector Wireless TelecomsAnalyst Stephen Howard Contact 44 20 7991 6820
Price relative
97107117127137147157167177187
2009 2010 2011 2012
97107117127137147157167177187
Vodafone Group Rel to FTSE ALL-SHARE
Source: HSBC Note: price at close of 11 Feb 2011

160
Telecoms, Media & Technology – Equity 16 February 2011
abc
Notes

161
Telecoms, Media & Technology – Equity 16 February 2011
abc
Disclosure appendix Analyst Certification The following analyst(s), economist(s), and/or strategist(s) who is(are) primarily responsible for this report, certifies(y) that the opinion(s) on the subject security(ies) or issuer(s) and/or any other views or forecasts expressed herein accurately reflect their personal view(s) and that no part of their compensation was, is or will be directly or indirectly related to the specific recommendation(s) or views contained in this research report: Stephen Howard, Nicolas Cote-Colisson, Richard Dineen, Luigi Minerva, Herve Drouet, Dominik Klarmann, Neale Anderson, Tucker Grinnan, Kunal Bajaj, Luis Hilado and Steve Scruton.
Important disclosures
Stock ratings and basis for financial analysis HSBC believes that investors utilise various disciplines and investment horizons when making investment decisions, which depend largely on individual circumstances such as the investor's existing holdings, risk tolerance and other considerations. Given these differences, HSBC has two principal aims in its equity research: 1) to identify long-term investment opportunities based on particular themes or ideas that may affect the future earnings or cash flows of companies on a 12 month time horizon; and 2) from time to time to identify short-term investment opportunities that are derived from fundamental, quantitative, technical or event-driven techniques on a 0-3 month time horizon and which may differ from our long-term investment rating. HSBC has assigned ratings for its long-term investment opportunities as described below.
This report addresses only the long-term investment opportunities of the companies referred to in the report. As and when HSBC publishes a short-term trading idea the stocks to which these relate are identified on the website at www.hsbcnet.com/research. Details of these short-term investment opportunities can be found under the Reports section of this website.
HSBC believes an investor's decision to buy or sell a stock should depend on individual circumstances such as the investor's existing holdings and other considerations. Different securities firms use a variety of ratings terms as well as different rating systems to describe their recommendations. Investors should carefully read the definitions of the ratings used in each research report. In addition, because research reports contain more complete information concerning the analysts' views, investors should carefully read the entire research report and should not infer its contents from the rating. In any case, ratings should not be used or relied on in isolation as investment advice.
Rating definitions for long-term investment opportunities
Stock ratings HSBC assigns ratings to its stocks in this sector on the following basis:
For each stock we set a required rate of return calculated from the risk free rate for that stock's domestic, or as appropriate, regional market and the relevant equity risk premium established by our strategy team. The price target for a stock represents the value the analyst expects the stock to reach over our performance horizon. The performance horizon is 12 months. For a stock to be classified as Overweight, the implied return must exceed the required return by at least 5 percentage points over the next 12 months (or 10 percentage points for a stock classified as Volatile*). For a stock to be classified as Underweight, the stock must be expected to underperform its required return by at least 5 percentage points over the next 12 months (or 10 percentage points for a stock classified as Volatile*). Stocks between these bands are classified as Neutral.
Our ratings are re-calibrated against these bands at the time of any 'material change' (initiation of coverage, change of volatility status or change in price target). Notwithstanding this, and although ratings are subject to ongoing management review, expected returns will be permitted to move outside the bands as a result of normal share price fluctuations without necessarily triggering a rating change.
162
Telecoms, Media & Technology – Equity 16 February 2011
abc
*A stock will be classified as volatile if its historical volatility has exceeded 40%, if the stock has been listed for less than 12 months (unless it is in an industry or sector where volatility is low) or if the analyst expects significant volatility. However, stocks which we do not consider volatile may in fact also behave in such a way. Historical volatility is defined as the past month's average of the daily 365-day moving average volatilities. In order to avoid misleadingly frequent changes in rating, however, volatility has to move 2.5 percentage points past the 40% benchmark in either direction for a stock's status to change.
Rating distribution for long-term investment opportunities
As of 15 February 2011, the distribution of all ratings published is as follows: Overweight (Buy) 49% (23% of these provided with Investment Banking Services)
Neutral (Hold) 36% (20% of these provided with Investment Banking Services)
Underweight (Sell) 15% (21% of these provided with Investment Banking Services)
HSBC & Analyst disclosures Disclosure checklist
Company Ticker Recent price Price Date Disclosure
AMERICA MOVIL AMX.N 56.44 15-Feb-2011 1, 2, 5, 6, 7, 11AT&T T.N 28.46 15-Feb-2011 7, 11BELGACOM BCOM.BR 27.14 15-Feb-2011 7, 11BRITISH TELECOM BT.L 1.84 15-Feb-2011 2, 4, 6, 7, 11DEUTSCHE TELEKOM DTEGn.DE 9.89 15-Feb-2011 6, 7, 11ERICSSON ERICb.ST 81.55 15-Feb-2011 2, 7, 11ETIHAD ETISALAT (MOBILY) 7020.SE 54.00 15-Feb-2011 2, 5, 7FRANCE TELECOM FTE.PA 16.16 15-Feb-2011 1, 2, 4, 5, 6, 7, 11KPN KPN.AS 11.74 15-Feb-2011 6KT CORP 030200.KS 40750.00 15-Feb-2011 6, 7, 11MOBILE TELESYSTEMS MBT.N 19.90 15-Feb-2011 2, 5, 7, 11MTN GROUP MTNJ.J 127.10 15-Feb-2011 6, 7NTT DOCOMO INC. 9437.T 154200.00 15-Feb-2011 6PORTUGAL TELECOM PTC.LS 8.48 15-Feb-2011 6, 11SAUDI TELECOM COMPANY 7010.SE 40.20 15-Feb-2011 2, 6, 7SPRINT NEXTEL CORP S.N 4.55 15-Feb-2011 6SWISSCOM SCMN.VX 427.90 15-Feb-2011 6, 7TDC TDC.CO 46.25 15-Feb-2011 1, 5, 6, 11TELECOM ITALIA TLIT.MI 1.04 15-Feb-2011 6, 7, 11TELEFONICA TEF.MC 18.28 15-Feb-2011 1, 2, 4, 5, 6, 7, 11TELENOR TEL.OL 91.30 15-Feb-2011 6, 7, 11TELIASONERA TLSN.ST 54.40 15-Feb-2011 6, 11TELSTRA CORP TLS.AX 2.92 15-Feb-2011 1, 2, 5, 7VERIZON COMMUNICATIONS VZ.N 35.90 15-Feb-2011 6, 11VODAFONE GROUP VOD.L 1.80 15-Feb-2011 1, 2, 4, 5, 6, 7, 11
Source: HSBC
1 HSBC* has managed or co-managed a public offering of securities for this company within the past 12 months. 2 HSBC expects to receive or intends to seek compensation for investment banking services from this company in the next
3 months. 3 At the time of publication of this report, HSBC Securities (USA) Inc. is a Market Maker in securities issued by this company. 4 As of 31 January 2011 HSBC beneficially owned 1% or more of a class of common equity securities of this company. 5 As of 31 December 2010, this company was a client of HSBC or had during the preceding 12 month period been a client
of and/or paid compensation to HSBC in respect of investment banking services. 6 As of 31 December 2010, this company was a client of HSBC or had during the preceding 12 month period been a client
of and/or paid compensation to HSBC in respect of non-investment banking-securities related services. 7 As of 31 December 2010, this company was a client of HSBC or had during the preceding 12 month period been a client
of and/or paid compensation to HSBC in respect of non-securities services. 8 A covering analyst/s has received compensation from this company in the past 12 months. 9 A covering analyst/s or a member of his/her household has a financial interest in the securities of this company, as
detailed below.

163
Telecoms, Media & Technology – Equity 16 February 2011
abc
10 A covering analyst/s or a member of his/her household is an officer, director or supervisory board member of this company, as detailed below.
11 At the time of publication of this report, HSBC is a non-US Market Maker in securities issued by this company and/or in securities in respect of this company
Analysts, economists, and strategists are paid in part by reference to the profitability of HSBC which includes investment banking revenues.
For disclosures in respect of any company mentioned in this report, please see the most recently published report on that company available at www.hsbcnet.com/research.
* HSBC Legal Entities are listed in the Disclaimer below.
Additional disclosures 1 This report is dated as at 16 February 2011. 2 All market data included in this report are dated as at close 14 February 2011, unless otherwise indicated in the report. 3 HSBC has procedures in place to identify and manage any potential conflicts of interest that arise in connection with its
Research business. HSBC's analysts and its other staff who are involved in the preparation and dissemination of Research operate and have a management reporting line independent of HSBC's Investment Banking business. Information Barrier procedures are in place between the Investment Banking and Research businesses to ensure that any confidential and/or price sensitive information is handled in an appropriate manner.
4 As of 31 January 2011, HSBC and/or its affiliates (including the funds, portfolios and investment clubs in securities managed by such entities) either, directly or indirectly, own or are involved in the acquisition, sale or intermediation of, 1% or more of the total capital of the subject companies securities in the market for the following Company(ies): FRANCE TELECOM , BRITISH TELECOM , TELEFONICA , VODAFONE GROUP
5 As of 21 January 2011, HSBC owned a significant interest in the debt securities of the following company(ies): FRANCE TELECOM , TELEFONICA , KT CORP , TELECOM ITALIA , DEUTSCHE TELEKOM

164
Telecoms, Media & Technology – Equity 16 February 2011
abc
Disclaimer * Legal entities as at 31 January 2010 'UAE' HSBC Bank Middle East Limited, Dubai; 'HK' The Hongkong and Shanghai Banking Corporation Limited, Hong Kong; 'TW' HSBC Securities (Taiwan) Corporation Limited; 'CA' HSBC Securities (Canada) Inc, Toronto; HSBC Bank, Paris branch; HSBC France; 'DE' HSBC Trinkaus & Burkhardt AG, Dusseldorf; 000 HSBC Bank (RR), Moscow; 'IN' HSBC Securities and Capital Markets (India) Private Limited, Mumbai; 'JP' HSBC Securities (Japan) Limited, Tokyo; 'EG' HSBC Securities Egypt S.A.E., Cairo; 'CN' HSBC Investment Bank Asia Limited, Beijing Representative Office; The Hongkong and Shanghai Banking Corporation Limited, Singapore branch; The Hongkong and Shanghai Banking Corporation Limited, Seoul Securities Branch; The Hongkong and Shanghai Banking Corporation Limited, Seoul Branch; HSBC Securities (South Africa) (Pty) Ltd, Johannesburg; 'GR' HSBC Pantelakis Securities S.A., Athens; HSBC Bank plc, London, Madrid, Milan, Stockholm, Tel Aviv, 'US' HSBC Securities (USA) Inc, New York; HSBC Yatirim Menkul Degerler A.S., Istanbul; HSBC México, S.A., Institución de Banca Múltiple, Grupo Financiero HSBC, HSBC Bank Brasil S.A. - Banco Múltiplo, HSBC Bank Australia Limited, HSBC Bank Argentina S.A., HSBC Saudi Arabia Limited., The Hongkong and Shanghai Banking Corporation Limited, New Zealand Branch.
Issuer of report HSBC Bank plc 8 Canada Square London, E14 5HQ, United Kingdom Telephone: +44 20 7991 8888 Fax: +44 20 7992 4880 Website: www.research.hsbc.com
In the UK this document has been issued and approved by HSBC Bank plc (“HSBC”) for the information of its Clients (as defined in the Rules of FSA) and those of its affiliates only. It is not intended for Retail Clients in the UK. If this research is received by a customer of an affiliate of HSBC, its provision to the recipient is subject to the terms of business in place between the recipient and such affiliate. HSBC Securities (USA) Inc. accepts responsibility for the content of this research report prepared by its non-US foreign affiliate. All U.S. persons receiving and/or accessing this report and wishing to effect transactions in any security discussed herein should do so with HSBC Securities (USA) Inc. in the United States and not with its non-US foreign affiliate, the issuer of this report. In Singapore, this publication is distributed by The Hongkong and Shanghai Banking Corporation Limited, Singapore Branch for the general information of institutional investors or other persons specified in Sections 274 and 304 of the Securities and Futures Act (Chapter 289) (“SFA”) and accredited investors and other persons in accordance with the conditions specified in Sections 275 and 305 of the SFA. This publication is not a prospectus as defined in the SFA. It may not be further distributed in whole or in part for any purpose. The Hongkong and Shanghai Banking Corporation Limited Singapore Branch is regulated by the Monetary Authority of Singapore. Recipients in Singapore should contact a "Hongkong and Shanghai Banking Corporation Limited, Singapore Branch" representative in respect of any matters arising from, or in connection with this report. In Australia, this publication has been distributed by The Hongkong and Shanghai Banking Corporation Limited (ABN 65 117 925 970, AFSL 301737) for the general information of its “wholesale” customers (as defined in the Corporations Act 2001). Where distributed to retail customers, this research is distributed by HSBC Bank Australia Limited (AFSL No. 232595). These respective entities make no representations that the products or services mentioned in this document are available to persons in Australia or are necessarily suitable for any particular person or appropriate in accordance with local law. No consideration has been given to the particular investment objectives, financial situation or particular needs of any recipient. This publication has been distributed in Japan by HSBC Securities (Japan) Limited. It may not be further distributed, in whole or in part, for any purpose. In Hong Kong, this document has been distributed by The Hongkong and Shanghai Banking Corporation Limited in the conduct of its Hong Kong regulated business for the information of its institutional and professional customers; it is not intended for and should not be distributed to retail customers in Hong Kong. The Hongkong and Shanghai Banking Corporation Limited makes no representations that the products or services mentioned in this document are available to persons in Hong Kong or are necessarily suitable for any particular person or appropriate in accordance with local law. All inquiries by such recipients must be directed to The Hongkong and Shanghai Banking Corporation Limited. In Korea, this publication is distributed by The Hongkong and Shanghai Banking Corporation Limited, Seoul Securities Branch ("HBAP SLS") for the general information of professional investors specified in Article 9 of the Financial Investment Services and Capital Markets Act (“FSCMA”). This publication is not a prospectus as defined in the FSCMA. It may not be further distributed in whole or in part for any purpose. HBAP SLS is regulated by the Financial Services Commission and the Financial Supervisory Service of Korea. This publication is distributed in New Zealand by The Hongkong and Shanghai Banking Corporation Limited, New Zealand Branch. This document is not and should not be construed as an offer to sell or the solicitation of an offer to purchase or subscribe for any investment. HSBC has based this document on information obtained from sources it believes to be reliable but which it has not independently verified; HSBC makes no guarantee, representation or warranty and accepts no responsibility or liability as to its accuracy or completeness. The opinions contained within the report are based upon publicly available information at the time of publication and are subject to change without notice. Nothing herein excludes or restricts any duty or liability to a customer which HSBC has under the Financial Services and Markets Act 2000 or under the Rules of FSA. A recipient who chooses to deal with any person who is not a representative of HSBC in the UK will not enjoy the protections afforded by the UK regulatory regime. Past performance is not necessarily a guide to future performance. The value of any investment or income may go down as well as up and you may not get back the full amount invested. Where an investment is denominated in a currency other than the local currency of the recipient of the research report, changes in the exchange rates may have an adverse effect on the value, price or income of that investment. In case of investments for which there is no recognised market it may be difficult for investors to sell their investments or to obtain reliable information about its value or the extent of the risk to which it is exposed. HSBC Bank plc is registered in England No 14259, is authorised and regulated by the Financial Services Authority and is a member of the London Stock Exchange. © Copyright. HSBC Bank plc 2011, ALL RIGHTS RESERVED. No part of this publication may be reproduced, stored in a retrieval system, or transmitted, on any form or by any means, electronic, mechanical, photocopying, recording, or otherwise, without the prior written permission of HSBC Bank plc. MICA (P) 142/06/2010 and MICA (P) 193/04/2010
290898

*Employed by a non-US affiliate of HSBC Securities (USA) Inc, and is not registered/qualified pursuant to FINRA regulations.
Ab
un
dan
t Scarc
ity
The capital intensity of fibre is now improving fixed-line competitive dynamics and pricing conditions
Mobile capacity constraints are starting to make their effect felt, both in terms of capex and better tariffs
European cable operators, mobile players (Vodafone) and some vendors (Ericsson) are best placed
Disclosures and Disclaimer This report must be read with the disclosures and analyst
certifications in the Disclosure appendix, and with the Disclaimer, which forms part of it
Glo
bal T
ele
co
ms, M
ed
ia &
Tech
no
log
y –
Eq
uity
Feb
ruary
2011
Abundant ScarcityPricing power is returning to telecoms
Global Telecoms, Media & Technology – Equity
February 2011
Main Contributors
Luis A Hilado*Analyst, Global Telecoms, Media & Technology ResearchThe Hongkong and Shanghai Banking Corporation Limited, Singapore+65 6239 [email protected]
Luis Hilado joined HSBC in 2010 from a US investment bank, where he covered the SE Asia telecom sector. He has over 15 years of equity research experience primarily covering SE Asia telecoms. Luis held a number of positions on the sell-side including Head of Research, Philippines for a European stock brokerage. He holds a BA in Economics and a BS in Commerce and BusinessManagement from De La Salle University.
Dominik Klarmann*, CFAAnalyst, Global Telecoms, Media & Technology ResearchHSBC Trinkaus & Burkhardt AG, Dusseldorf+49 211 910 2769 [email protected]
Dominik Klarmann has worked as a telecoms analyst since 2007. He obtained a degree in management at Bamberg and Madrid Universityin 2004. He has been with HSBC since 2007, having previously worked in management consulting and investor relations at Deutsche TelekomAG. Dominik is a CFA charterholder.
Richard DineenAnalyst, Global Telecoms, Media & Technology ResearchHSBC Securities (USA) Inc, New York+1 212 525 [email protected]
Richard joined HSBC in 2004 to work on the Global Telecoms Research team, with a particular emphasis on technology strategy. Prior tothis, he was research director for Mobile Telecoms at Ovum, a highly respected industry analyst firm, where he spent seven years.
Hervé Drouet*Analyst, Global Telecoms, Media & Technology ResearchHSBC Bank plc+44 20 7991 [email protected]
Hervé has been covering GEMs/CEEMEA Telecoms research for more than 9 years and has been ranked highly and regularly acrossnumerous external surveys. Prior to this, he worked as a senior management consultant in the TMT practice at Deloitte Consulting. He has15 years experience in the Media, Telecoms and Technology sectors, having worked previously as a project manager for SchlumbergerTechnologies. He holds a Full time MBA from London Business School and graduated from Ecole Supérieure d'Ingénieurs enElectrotechnique et Electronique in France.
Tucker Grinnan*Analyst, Global Telecoms, Media & Technology ResearchThe Hongkong and Shanghai Banking Corporation Limited, Hong Kong+852 2822 [email protected]
Tucker joined HSBC in November 2005 and has 15 years of experience as an analyst in the telecommunications, media and technologyindustries. Prior to joining HSBC, he spent five years as a head of regional telecoms for Asia and Latin America. Tucker also spent five yearswith a management consulting firm servicing clients in telecommunications and media. He holds degrees from the University of Virginiaand George Washington University.
Neale Anderson*Analyst, Global Telecoms, Media & Technology ResearchThe Hongkong and Shanghai Banking Corporation Limited, Hong Kong+852 2996 [email protected]
Neale Anderson joined HSBC in March 2007. Previously he spent seven years at the specialist consultancy Ovum, where he was ResearchDirector for Asia-Pacific telecommunications markets. He holds a BA from Oxford University and an MA in Advanced Japanese Studiesfrom Sheffield University.
Nicolas Cote-Colisson*Head of European Telecoms, Media & Technology ResearchHSBC Bank plc+44 20 7991 [email protected]
Nicolas joined HSBC in 2000 as a telecoms analyst in the Global Telecoms research team. Prior to that, he worked as an economist with CCFin Paris for five years and also with the French Ministry of Finance. Nicolas holds a DEA in Econometrics from Paris la Sorbonne.
Kunal Bajaj*Analyst, Global Telecoms, Media & Technology ResearchHSBC Bank Middle East Limited, Dubai+9714 507 [email protected]
Kunal joined HSBC in 2005. Before covering Middle Eastern telecoms, he was a member of HSBC’s EMEA telcos team, working on Eastern European and South African telecoms companies. Kunal is a Chartered Accountant and has an MBA in Finance.
Stephen Howard*Head, Global Telecoms, Media & Technology ResearchHSBC Bank plc+44 20 7991 [email protected]
Stephen Howard is Head of the Global Telecoms, Media & Technology Research team. He has covered the telecoms sector since joiningHSBC in 1996. He also brings experience in the technology industry, having worked previously with IBM.
Luigi Minerva*Analyst, Global Telecoms, Media & Technology ResearchHSBC Bank plc+44 20 7991 [email protected]
Luigi joined HSBC in 2005 as a telecoms analyst in the Global Telecoms Research team. Before this, he was a buy-side analyst at a fundmanager, having previously worked in the Telecoms Practice of McKinsey & Co based in Milan. Luigi holds a Masters in Finance from theLondon Business School and an M.Sc. in Economics and Econometrics from the University of Southampton.
Steve Scruton*Head of Equity Research, CEEMEAHSBC Bank plc+44 20 7992 [email protected]
Steve Scruton is the Head of Equity Research, CEEMEA. He has been with HSBC since 1997, and was previously the co-head of Global TMTin London and Head of Research, Bangalore, a team that provides support to Global Research across countries, sectors, products andservices. Prior to joining HSBC, Steve worked with British Petroleum, Cable & Wireless and a banking house in London.
110214_28253 Telecoms thematic - Stephen Howard_R3:Layout 1 2/16/2011 1:09 AM Page 1