HPLC Method for Simultaneous Quantitative … Method for Simultaneous Quantitative Detection of...
14
HPLC Method for Simultaneous Quantitative Detection of Quercetin and Curcuminoids in Traditional Chinese Medicines Lee Fung Ang * , Mun Fei Yam, Yvonne Tan Tze Fung, Peh Kok Kiang, Yusrida Darwin Key Words curcuminoid, high-performance liquid chromatogra- phy (HPLC), international conference harmonisation (ICH), quercetin Abstract Objectives: Quercetin and curcuminoids are important bioactive compounds found in many herbs. Previous- ly reported high performance liquid chromatography ultraviolet (HPLC-UV) methods for the detection of quercetin and curcuminoids have several disadvantag- es, including unsatisfactory separation times and lack of validation according the standard guidelines of the In- ternational Conference on Harmonisation of Technical Requirements for Registration of Pharmaceuticals for Human Use. Methods: A rapid, specific, reversed phase, HPLC-UV method with an isocratic elution of acetonitrile and 2% v/v acetic acid (40% : 60% v/v) (pH 2.6) at a flow rate of 1.3 mL/minutes, a column temperature of 35°C, and ul- traviolet (UV) detection at 370 nm was developed. e method was validated and applied to the quantification of different types of market available Chinese medicine extracts, pills and tablets. Results: e method allowed simultaneous determina- tion of quercetin, bisdemethoxycurcumin, demethox- ycurcumin and curcumin in the concentration ranges of 0.00488 ─ 200 μg/mL, 0.625 ─ 320 μg/mL, 0.07813 ─ 320 μg/mL and 0.03906 ─ 320 μg/mL, respective- ly. e limits of detection and quantification, respec- tively, were 0.00488 and 0.03906 μg/mL for quercetin, 0.62500 and 2.50000 μg/mL for bisdemethoxycurcum- in, 0.07813 and 0.31250 μg/mL for demethoxycurcum- in, and 0.03906 and 0.07813 μg/mL for curcumin. e percent relative intra day standard deviation (% RSD) values were 0.432 ─ 0.806 μg/mL, 0.576 ─ 0.723 μg/ mL, 0.635 ─ 0.752 μg/mL and 0.655 ─ 0.732 μg/mL for quercetin, bisdemethoxycurcumin, demethoxy- curcumin and curcumin, respectively, and those for intra day precision were 0.323 ─ 0.968 μg/mL, 0.805 ─ 0.854 μg/mL, 0.078 ─ 0.844 μg/mL and 0.275 ─ 0.829 μg/mL, respectively. e intra day accuracies were 99.589% ─ 100.821%, 98.588% ─ 101.084%, 9.289% ─ 100.88%, and 98.292% ─ 101.022% for quercetin, bis- demethoxycurcumin, demethoxycurcumin and cur- cumin, respectively, and the inter day accuracy were 99.665% ─ 103.06%, 97.669% ─ 103.513%, 99.569% ─ 103.617%, and 97.929% ─ 103.606%, respectively. Conclusion: e method was found to be simple, ac- curate and precise and is recommended for routine quality control analysis of commercial Chinese med- icine products containing the flour flavonoids as their principle components in the extracts. 1. Introduction Quercetin is a category in the class of flavonoids, and Original article Received: Sep 12, 2014 Accepted: Oct 16, 2014 ISSN 2093-6966 [Print], ISSN 2234-6856 [Online] Journal of Pharmacopuncture 2014;17[4]:036-049 DOI: http://dx.doi.org/10.3831/KPI.2014.17.035 This is an Open-Access article distributed under the terms of the Creative Commons Attribution Non-Commercial License (http://creativecommons.org/licenses/by-nc/3.0/) which permits unrestricted noncommercial use, distribution, and reproduction in any medium, provided the original work is properly cited. This paper meets the requirements of KS X ISO 9706, ISO 9706-1994 and ANSI/NISO Z39.48-1992 (Permanence of Paper). *Corresponding Author Lee Fung Ang. School of Pharmaceutical Sciences, Universisti Sains Malaysia, 11800 Minden, Penang, Malaysia. Tel: +6016-4973020 Fax: +604-6570017 E-mail: [email protected] ⓒ 2014 Korean Pharmacopuncture Institute http://www.journal.ac School of Pharmaceutical Sciences, Universiti Sains Malaysia, 11800, Penang, Malaysia
Transcript of HPLC Method for Simultaneous Quantitative … Method for Simultaneous Quantitative Detection of...

HPLC Method for Simultaneous Quantitative Detection of Quercetin and Curcuminoids in Traditional Chinese Medicines Lee Fung Ang*, Mun Fei Yam, Yvonne Tan Tze Fung, Peh Kok Kiang, Yusrida Darwin
Key Wordscurcuminoid, high-performance liquid chromatogra-phy (HPLC), international conference harmonisation (ICH), quercetin
Abstract
Objectives: Quercetin and curcuminoids are important bioactive compounds found in many herbs. Previous-ly reported high performance liquid chromatography ultraviolet (HPLC-UV) methods for the detection of quercetin and curcuminoids have several disadvantag-es, including unsatisfactory separation times and lack of validation according the standard guidelines of the In-ternational Conference on Harmonisation of Technical Requirements for Registration of Pharmaceuticals for Human Use.
Methods: A rapid, specific, reversed phase, HPLC-UV method with an isocratic elution of acetonitrile and 2% v/v acetic acid (40% : 60% v/v) (pH 2.6) at a flow rate of 1.3 mL/minutes, a column temperature of 35°C, and ul-traviolet (UV) detection at 370 nm was developed. The method was validated and applied to the quantification of different types of market available Chinese medicine extracts, pills and tablets.
Results: The method allowed simultaneous determina-tion of quercetin, bisdemethoxycurcumin, demethox-ycurcumin and curcumin in the concentration ranges
of 0.00488 ─ 200 μg/mL, 0.625 ─ 320 μg/mL, 0.07813 ─ 320 μg/mL and 0.03906 ─ 320 μg/mL, respective-ly. The limits of detection and quantification, respec-tively, were 0.00488 and 0.03906 μg/mL for quercetin, 0.62500 and 2.50000 μg/mL for bisdemethoxycurcum-in, 0.07813 and 0.31250 μg/mL for demethoxycurcum-in, and 0.03906 and 0.07813 μg/mL for curcumin. The percent relative intra day standard deviation (% RSD) values were 0.432 ─ 0.806 μg/mL, 0.576 ─ 0.723 μg/mL, 0.635 ─ 0.752 μg/mL and 0.655 ─ 0.732 μg/mL for quercetin, bisdemethoxycurcumin, demethoxy-curcumin and curcumin, respectively, and those for intra day precision were 0.323 ─ 0.968 μg/mL, 0.805 ─ 0.854 μg/mL, 0.078 ─ 0.844 μg/mL and 0.275 ─ 0.829 μg/mL, respectively. The intra day accuracies were 99.589% ─ 100.821%, 98.588% ─ 101.084%, 9.289% ─ 100.88%, and 98.292% ─ 101.022% for quercetin, bis-demethoxycurcumin, demethoxycurcumin and cur-cumin, respectively, and the inter day accuracy were 99.665% ─ 103.06%, 97.669% ─ 103.513%, 99.569% ─ 103.617%, and 97.929% ─ 103.606%, respectively.
Conclusion: The method was found to be simple, ac-curate and precise and is recommended for routine quality control analysis of commercial Chinese med-icine products containing the flour flavonoids as their principle components in the extracts.
1. Introduction
Quercetin is a category in the class of flavonoids, and
Original article
Received: Sep 12, 2014 Accepted: Oct 16, 2014
ISSN 2093-6966 [Print], ISSN 2234-6856 [Online]Journal of Pharmacopuncture 2014;17[4]:036-049DOI: http://dx.doi.org/10.3831/KPI.2014.17.035
This is an Open-Access article distributed under the terms of the Creative CommonsAttribution Non-Commercial License (http://creativecommons.org/licenses/by-nc/3.0/)which permits unrestricted noncommercial use, distribution, and reproduction in anymedium, provided the original work is properly cited.
This paper meets the requirements of KS X ISO 9706, ISO 9706-1994 and ANSI/NISOZ39.48-1992 (Permanence of Paper).
*Corresponding AuthorLee Fung Ang. School of Pharmaceutical Sciences, Universisti Sains Malaysia, 11800 Minden, Penang, Malaysia.Tel: +6016-4973020 Fax: +604-6570017E-mail: [email protected]
ⓒ 2014 Korean Pharmacopuncture Institute http://www.journal.ac
School of Pharmaceutical Sciences, Universiti Sains Malaysia, 11800, Penang, Malaysia

http://www.journal.ac 037
a sub class of flavonol. Flavonoids are plant polypheno-lics found as pigments in fruits, vegetables, seeds, nuts, flowers, barks and leaves. It is also found in medicinal botanicals, such as Ginkgo biloba, Hypericum perforatum (St. John’s Wort), and Sambucum canadensis (El-der) [1]. The International Union of Pure and Applied Chemistry’s (IUPAC’s) name for quercetin is 3, 3’, 4’, 5, 7-pentahydrox-yflavone (or its synonym 3, 3’, 4’, 5, 7-pentahydroxy-2-phe-nylchromen-4-one). Fig.1 shows the chemical structure of quercetin. The hydroxyl (-OH) groups attached at positions 3, 5, 7, 3’, and 4’ and the catechol B-ring produce the anti-oxidant properties of quercetin [2, 3]. The antioxidant and the free radical scavenging properties of quercetin have been reported to contribute to anti carcinogenic and anti inflammatory effects, and haves been extensively studied by researchers around the world [2].
Extensive amounts of in vitro and in vivo animal research on quercetin’s pharmacological activities have been car-ried out, suggesting that quercetin might be used as a new therapeutic approach to decrease blood pressure [4], to in-hibit fibronectin production by keloid derived fibroblasts [5], to inhibit neointimal hyperplasia in the abdominal aorta of rats [6], to treat gout [7], to inhibit asthmatic syn-drome [8] and to promote dermal wound healing [9].
Curcumin, commercially available in a mixture of cur-cumins (curcuminoids), contains ─ 77% pure curcumin, ─ 17% demethoxycurcumin and ─ 3% bisdemethoxy-curcumin [10] (Fig. 1). Curcuminoids are derived from Curcuma longa Linn, one of the most popular medicinal herbs, and are a polyphenolic. These compounds are yel-low pigments and have been, commonly used as a dietary spices, natural coloring agents in foods, household medi-cines and insect repellents in South and Southeast Asia for thousands of years [11]. Curcumin and its synthetic deriv-atives (curcuminoids) show an array of pharmacological properties, such as antibacterial [12-14], antioxidant [13, 15-16], anti inflammatory [17, 18], anti tumor [19, 20] and anti proliferation [18, 21] properties. Curcumin/curcumi-noids also possess potency as medicines for the treatment of diseases, including Alzheimer’s disease [22, 23], cancer [24, 25, 26], diabetes, gastric ulcers [27], malaria [28, 29] and for the treatment of wounds [30-32].
A variety of methods for quantitatively detecting curcum-in and quercetin contents have been reported. Among these, spectrophotometric methods are the most com-monly used [33-36]. Thin layer chromatography (TLC) or column chromatography was usually used for separation of curcuminoids [37-39]. High performance liquid chroma-tography (HPLC) [40-45] and, high performance thin layer chromatography (HPTLC) [39, 46, 47] are the commonly used methods for quantitatively detecting the quercetin and curcuminoids contents. Some advanced methods have been developed for the analysis of curcuminoids contents, namely, ultra performance liquid chromatogra-phy quadrupole time of flight mass spectrometry (UPLC-qTOF-MS) [48], ultra performance liquid chromatography tandem mass spectrometry (UPLC-MS) [49], high perfor-mance liquid chromatography tandem mass spectrometry (HPLC-MS/MS) [50] and electrochemical-HPLC [51].
For the above techniques, spectrophotometric methods are not available to quantify the individual curcuminoids
due to the curcumin derivative’s being also absorbed at the same wavelength. Furthermore, LC-MS and/or qTOF are complicated and need expensive instrumentation. Even though HPTLC and TLC are widely used to study the fingerprints of plants, these methods are not suitable for analyzing compounds in combinations of herbs products like Chinese medicinal materials (because such products normally contain more than one herb). For simultane-ous determination of quercetin and curcuminoids, HPLC method is the recommended technique because it uses separation, identification and quantification of the ana-lytes from plant extracts, foods, pharmaceutical products, and body fluids.
In the present study, a simple isocratic reversed phase HPLC method was developed according to international conference harmonisation (ICH) guidelines [52] for the simultaneous quantitative detection of quercetin and cur-cuminoids. The method was also validated by using mar-ket available traditional Chinese medicine materials such as granules, pills and tablets.
2. Materials and Methods
Curcumin (mixture of curcumin, demethoxycurcumin, and bisdemethoxycurcumin) was obtained from Acros Or-ganics, USA. Quercetin anhydrous was obtained from Sig-ma, USA. The HPLC grade acetonitrile and methanol were purchased from J.T. Baker, USA. Analytical grade acetic acid was obtained from QRëC, Malaysia. Nylon membrane filters 0.45 µm were purchased from Whatman, England.
HPLC analysis was performed using a Shimadzu-LC system (Shimadzu, Japan) equipped with an CBM-20A controller, LC-20AT pump, DGU-20A5 prominence degas-ser, SIL-20A auto sampler, SPD-20AV detector and CTO-10ASvp column oven.
Chromatographic separations were achieved using a Thermo Hypersil Gold column (250 mm × 4.6 mm I.D.: 5 µm). A security guard column (Zorbax Eclipse Plus) packed with a replaceable C-18 cartridge (12.5 mm × 4.6 mm ID.: 5 mm) was used to protect the analytical column. A reverse phase HPLC assay was carried out using an iso-cratic elution with a flow rate of 1.3 mL/minutes, a column temperature of 35°C, a mobile phase of acetonitrile and 2% v/v acetic acid (pH 2.60) (40% : 60% v/v) and a detec-tion wavelength of 370 nm. The injection volume was 20 µL of each solutions. The total run time was 18.5 minutes for each injection. Data were acquired and processed with LC-Solution Software. Solvents and distilled water were prior filtered through a 0.45-µm nylon membrane by using a set of glass bottles with the aid of a vacuum pump (Fish-erbrand FB 70155, Fisher Scientific, UK).
Twenty mg of a mixture of curcumin (containing mainly curcumin, demethoxycurcumin and bisdemethoxycur-cumin) and 20 mg of quercetin were accurately weighed using a microbalance (Sartorius, MC5, Germany) and dis-solved in 20 mL of HPLC grade methanol in a 20 mL volu-metric flask. The mixtures were diluted to 320 µg/mL with HPLC grade methanol; and were then serially doubling di-luted to 1.22 ng/mL. These solutions were used as calibra-tion standards for the quantitative determinations of the
Journal of Pharmacopuncture 2014;17(4):036-049
038 http://www.journal.ac Journal of Pharmacopuncture 2014;17(4):036-049
Figure 1 Chemical structures of quercetin, and the curcuminoids: curcumin, demethoxycurcumin and bisdemethoxycurcumin.
limit of detection (LOD), the limit of quantification (LOQ) and yhe limit of linearity (LOL), and for the linear range analysis. Three quality control (QC) samples at concentra-tions of 3.75 µg/mL, 100 µg/mL and 160 µg/mL, respec-tively, were prepared from the stock solution. All solutions were stored in tightened screw cap bottles to avoid evap-oration and were protected from light, and were kept in a refrigerator (4°C) for not more than two weeks.
Standard solutions with concentrations in the range from of 1.22 ng/mL to 320 µg/mL were injected in duplicate into the HPLC unit. The LOD and LOQ of quercetin (QUE), bisdemethoxycurcumin (BDMC), demethoxycurcumin (DMC) and curcumin (CUR) were determined in a at the lower concentration range based on the signal to-noise ratio. According to The United Sates Pharmacopeia (USP), the LOD and the LOQ are in terms of 2 or 3 times, and 10 times the noise level respectively. The LOL was determined by plotting a calibration curve (mean value of the peak ar-eas against the concentrations) beginnings with the LOQ concentration and proceeding to the data point that devi-ated from the regression line. The coefficient of determi-nation (R2 ≥ 0.999) was used as a guideline to evaluate the model fit of a regression equation.
Linear ranges for quercetin, bisdemethoxycurcumin, demethoxycurcumin and curcumin included concentra-tions of 1.25, 5, 20, 40, 80, 140 and 200 µg/mL. Separate calibration curves were constructed for quercetin, bis-demethoxycurcumin demethoxycurcumin and curcumin by plotting the peak areas against the concentrations, and the methods were evaluated by determining the coeffi-cient of determination (R2). Unknown assay samples were quantified by referencing them to these calibration curves.
QC samples (3.75, 100 and 160 µg/mL) were used to val-idate intra day and inter day accuracies and precisions. Intra day precisions and accuracies were determined by using a replicate analysis (n = 6) of the QC samples on the same day under the same analytical conditions. Inter day
precisions and accuracies were tested by using a replicate analysis (n = 3) of the same QC samples on six consecutive days. The precision is calculated from the mean of the ac-curacy and the relative standard deviation (RSD). Accura-cy is a measure of how close the experimental value to the true value, and is expressed as a percent. The experimental value was calculated from the calibration curve by using the linear regression equation, y = mx + c. The constant m is the slope of the curve. The constant c is the y intercept and can be determined by extrapolating the straight line to the y axis.
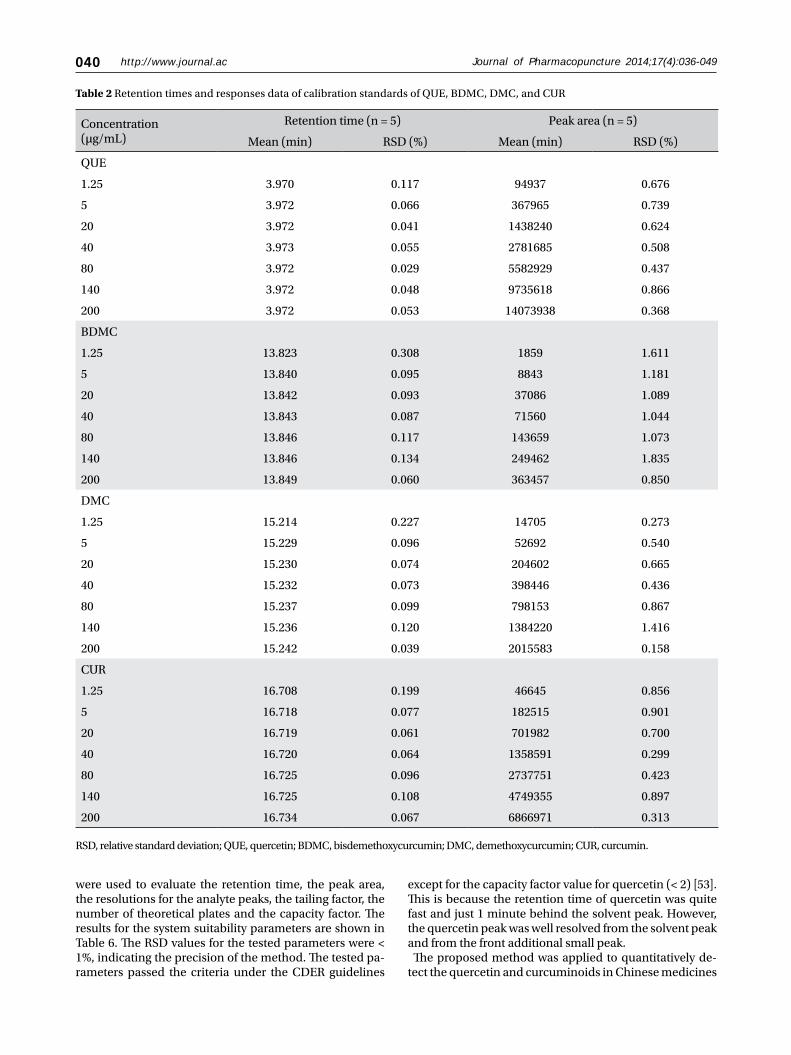
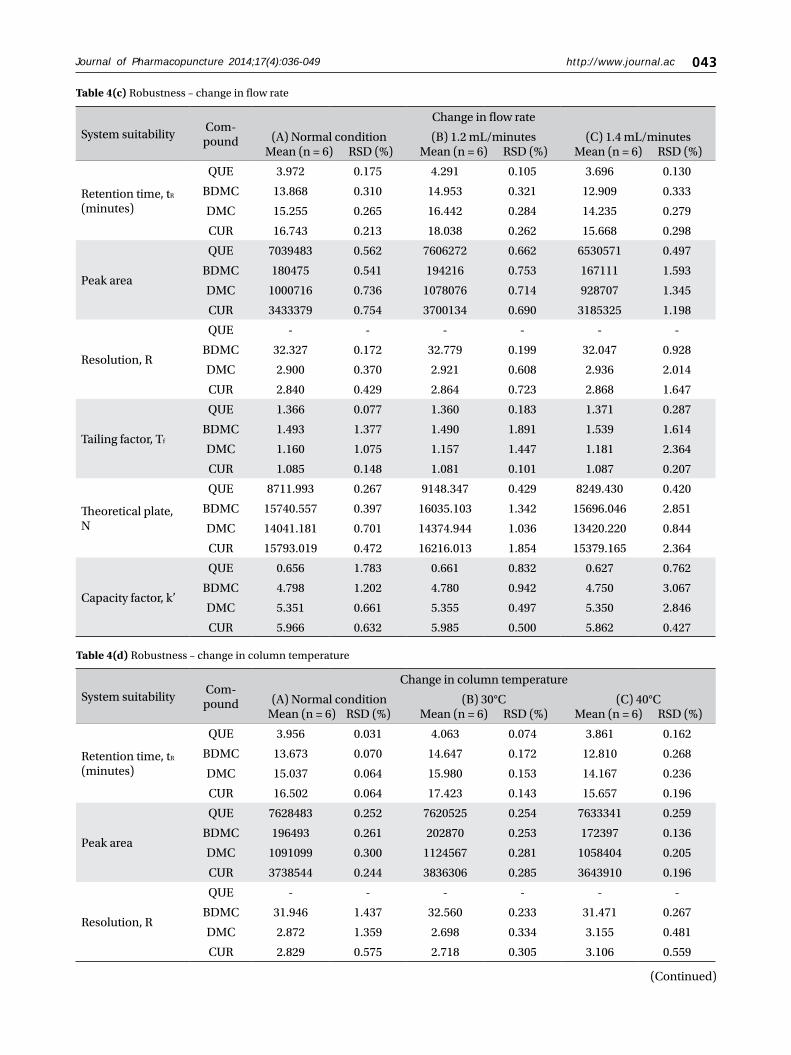
Four variation parameters of robustness were stud-ied: change in organic composition by ± 2.0% (Table 4a), change in acetic acid concentration by ± 1.0% v/v (effect of buffer pH) (Table 4b), change in the flow rate of ± 0.1 mL/min (Table 4c) and change in the column temperature of ± 5.0°C (Table 4d). The retention time, peak area, resolu-tion, tailing factor, theoretical plate number and capacity factor values obtained from the variation parameters were compared to those obtained for the normal method condi-tions. The differences were analyzed by using SPSS version 20, and a one way analysis of variance (ANOVA), followed by Tukey’s test. P-values < 0.05 were considered significant.
The system suitability parameters were assessed by using six replicate analysis of the QC sample at 160 µg/mL. The acceptance criteria were in accordance with the guidelines of the Centre for Drug Evaluation and Research [53].
The method developed in this study was used to quanti-tatively determination the quercetin and the curcuminoid contents of extracts, pills and tablets made from Chinese medicinal plants.
3. Results
The LOD and the LOQ were determined based on the signal to noise (S/N) ratio, with the S/N > 3 and the S/N
Quercetin
Demethoxycurcumin
CurcuminBis-demethoxycurcumin

http://www.journal.ac 039
> 10 for the LOD and the LOQ, respectively. The LODs of quercetin, bisdemethoxycurcumin, demethoxycurcumin and curcumin were 0.00488, 0.62500, 0.07813 and 0.03906 µg/mL, respectively. The LOQs of quercetin, bisdemeth-oxycurcumin, demethoxycurcumin and curcumin were 0.03906, 2.5000, 0.31250 and 0.07813 µg/mL, respectively (Table 1). The linearity for detecting quercetin, bisdemeth-oxycurcumin, demethoxycurcumin and curcumin was tested against a mixture of calibration standards with con-centration ranging from 1.22 ng/mL to 320 µg/mL. The LOL of each compound was determined from a separate calibration curve. Quercetin was linear up to 200 µg/mL, while bisdemethoxycurcumin, demethoxycurcumin and curcumin were linear up to 320 µg/mL.
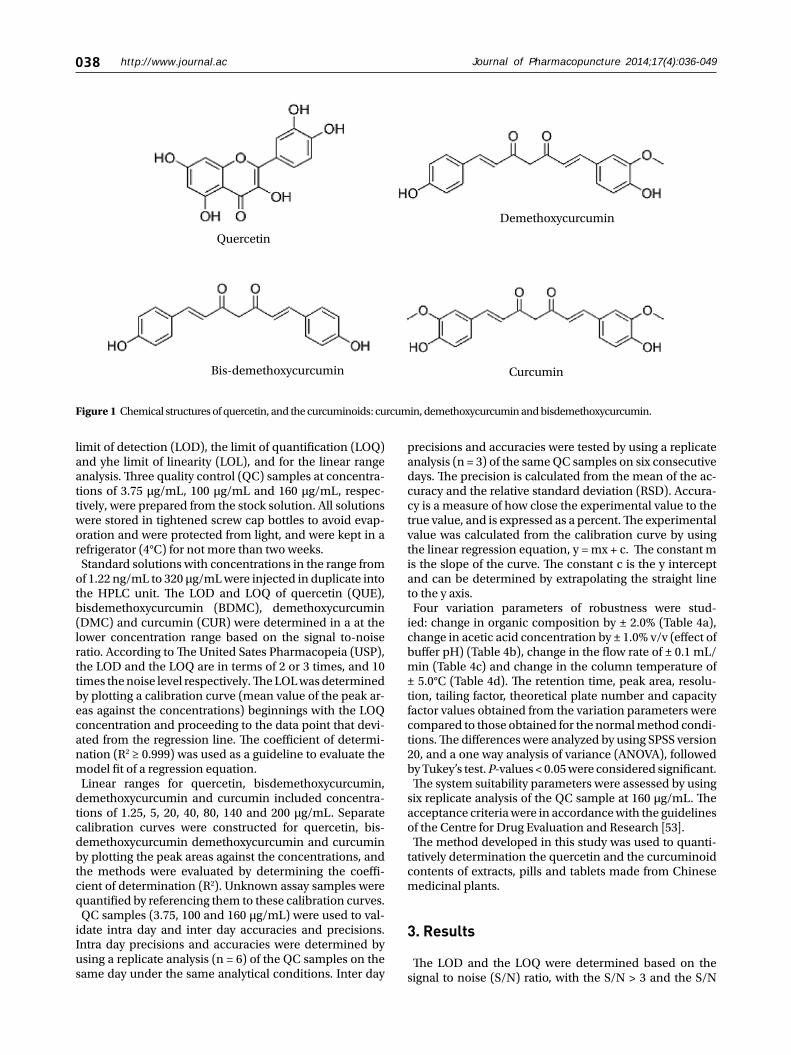
Linear calibration curves in the range from 1.25 to 200 µg/mL were constructed for each compound by plotting the peak area against the concentration. The retention times and the peak areas are tabulated in Table 2. The values of R2, the y-intercept and the slope for each compound’s calibration plot are shown in Table 1. A regression analysis of the data showed a linear relationship for quercetin, bis-demethoxycurcumin, demethoxycurcumin and curcum-in, with excellent R2 values of 0.99993, 0.99984, 0.99985 and 0.99993 μg/mL, respectively.
The peaks of quercetin, bisdemethoxycurcumin, demeth-oxycurcumin and curcumin were well separated at differ-ent retention times with resolutions of 32.195, 2.887 and
2.830 for quercetin-bisdemethoxycurcumin, bisdemeth-oxycurcumin-demethoxycurcumin and demethoxycur-cumin-curcumin, respectively. No interferences or ex-cipient peaks co eluted with the analytes were observed, indicating the method is selective and specific in relation to the medium and excipients used in this study (Fig. 2, Ta-ble 2).
Precision and accuracy data for the intraday and the in-ter-day variations for the three QC samples are summa-rized in Table 3. The RSD values for the intraday and the inter day precisions were < 1%. For the accuracy test, the intraday and the inter day accuracies ranges from 98.292% to 103.617%, confirming the accuracy of the method.
Robustness is a measure of the method’s capability to re-main unaffected by small, but deliberate, variations in the method parameters [52]. The robustness parameters test-ed were the mobile phase’s composition, the concentra-tion of acetic acid (pH effect), the flow rate and the column temperature. The results are tabulated in Table 4(a-d). The retention times for all four compounds due to variations in the parameters were significantly different compared to those for the normal parameters. The peak area for cur-cumin was not significantly different after changing the acetic acid concentration from 2% to 3%, but was signifi-cantly different after changing the concentration from 2% to 1%. Quercetin, bisdemethoxycurcumin and demethox-ycurcumin were shown to have significant differences in their peak area when the concentration of acetic acid was changed. Changes in the acetonitrile’s composition and temperature were shown not to cause significant differ-ences in quecetin’s peak areas, however significant differ-ences were seen in curcumin, bisdemethoxycurcumin and demethoxycurcumin peak areas. Increasing or decreasing the flow rate by 0.1 mL/min from normal conditions sig-nificantly raised or reduced the values of the peak areas of quercetin, bisdemethoxycurcumin, demethoxycurcumin and curcumin. Although changes in experimental condi-tions changed the retention time, the peak area and the values of the system’s suitability parameters, the four ana-lyzed peaks were still well resolved from each other and from additional small peaks and showed good resolution in the tested parameters (Fig. 3).
The system suitability criteria were in accordance with the Centre for Drug Evaluation and Research (CDER) guide-lines [53] and are summarized in Table 5. The mean values of the six replicate injections of 160 µg/mL QC standards
Figure 2 Chromatograms of quercetin and curcuminoids. QUE, quercetin; BDMC, bisdemethoxycurcumin; DMC, demethoxycur-cumin; CUR, curcumin.
LOD, limit of detection; LOQ, limit of quantification, LOL, limit of linearity; QUE, quercetin; BDMC, bisdemethoxycurcumin; DMC, demethox-ycurcumin; CUR, curcumin.
Compounds LOD (µg/mL) LOQ (µg/mL) LOL (µg/mL)Regression analysis (1.25 — 200 µg/mL)
slope y-interceptCoefficient of de-termination (R2)
QUE 0.00488 0.03906 200 70055.85913 1521.41433 0.99993
BDMC 0.62500 2.50000 320 1807.72930 — 440.28180 0.99984
DMC 0.07813 0.31250 320 10011.55795 40.13501 0.99985
CUR 0.03906 0.07813 320 34176.44088 3645.08890 0.99993
Table 1 LOD, LOQ, LOL and linear regression analysis parameters for QUE, BDMC, DMC and CUR
Journal of Pharmacopuncture 2014;17(4):036-049
040 http://www.journal.ac Journal of Pharmacopuncture 2014;17(4):036-049
RSD, relative standard deviation; QUE, quercetin; BDMC, bisdemethoxycurcumin; DMC, demethoxycurcumin; CUR, curcumin.
Concentration (µg/mL)
Retention time (n = 5) Peak area (n = 5)
Mean (min) RSD (%) Mean (min) RSD (%)
QUE
1.25 3.970 0.117 94937 0.676
5 3.972 0.066 367965 0.739
20 3.972 0.041 1438240 0.624
40 3.973 0.055 2781685 0.508
80 3.972 0.029 5582929 0.437
140 3.972 0.048 9735618 0.866
200 3.972 0.053 14073938 0.368
BDMC
1.25 13.823 0.308 1859 1.611
5 13.840 0.095 8843 1.181
20 13.842 0.093 37086 1.089
40 13.843 0.087 71560 1.044
80 13.846 0.117 143659 1.073
140 13.846 0.134 249462 1.835
200 13.849 0.060 363457 0.850
DMC
1.25 15.214 0.227 14705 0.273
5 15.229 0.096 52692 0.540
20 15.230 0.074 204602 0.665
40 15.232 0.073 398446 0.436
80 15.237 0.099 798153 0.867
140 15.236 0.120 1384220 1.416
200 15.242 0.039 2015583 0.158
CUR
1.25 16.708 0.199 46645 0.856
5 16.718 0.077 182515 0.901
20 16.719 0.061 701982 0.700
40 16.720 0.064 1358591 0.299
80 16.725 0.096 2737751 0.423
140 16.725 0.108 4749355 0.897
200 16.734 0.067 6866971 0.313
Table 2 Retention times and responses data of calibration standards of QUE, BDMC, DMC, and CUR
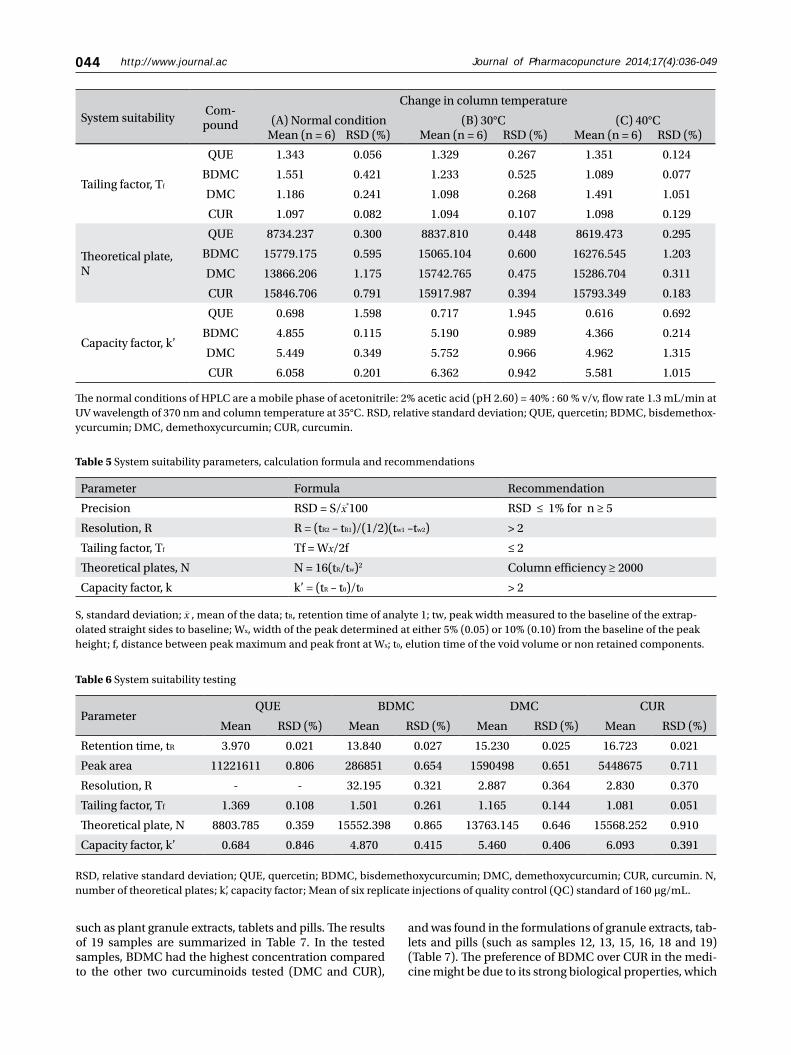
were used to evaluate the retention time, the peak area, the resolutions for the analyte peaks, the tailing factor, the number of theoretical plates and the capacity factor. The results for the system suitability parameters are shown in Table 6. The RSD values for the tested parameters were < 1%, indicating the precision of the method. The tested pa-rameters passed the criteria under the CDER guidelines
except for the capacity factor value for quercetin (< 2) [53]. This is because the retention time of quercetin was quite fast and just 1 minute behind the solvent peak. However, the quercetin peak was well resolved from the solvent peak and from the front additional small peak.
The proposed method was applied to quantitatively de-tect the quercetin and curcuminoids in Chinese medicines
http://www.journal.ac 041Journal of Pharmacopuncture 2014;17(4):036-049
Concentration (µg/mL)
Intra day* Inter day†
Peak Response
Precision (RSD, %)
Accuracy (%)Peak
ResponsePrecision (RSD, %)
Accuracy (%)
QUE
3.75 263151 0.432 99.589 263350 0.323 99.665
100 7064599 0.717 100.821 7221470 0.646 103.060
160 11221611 0.806 100.010 11218287 0.968 100.070
BDMC
3.75 6243 0.576 98.588 6181 0.854 97.669
100 182293 0.723 101.084 186683 0.878 103.513
160 286851 0.654 99.32746 288040 0.805 99.738
DMC
3.75 37700 0.635 100.310 37687 0.466 100.276
100 1010004 0.752 100.880 1037410 0.078 103.617
160 1590498 0.651 99.289 1594989 0.844 99.569
CUR
3.75 129618 0.655 98.292 129152 0.297 97.929
100 3456218 0.732 101.022 3544535 0.275 103.606
160 5448675 0.711 99.576 5454012 0.829 99.673
System suitabilityCom-pound
Change in the normal organic composition of acetonitrile: 2% acetic acid
(A) Normal conditionMean (n = 6) RSD (%)
(B) 38% : 62% v/vMean (n = 6) RSD (%)
(C) 42% : 58% v/vMean (n = 6) RSD (%)
Retention time, tR (minutes)
QUE 3.993 0.690 4.251 0.155 3.761 0.040
BDMC 13.951 0.342 17.645 0.374 11.280 0.084
DMC 15.340 0.291 19.543 0.285 12.330 0.084
CUR 16.829 0.245 21.617 0.296 13.464 0.082
Peak area
QUE 6853044 0.433 6836934 0.441 6867445 0.117
BDMC 167417 0.647 161504 0.801 146484 0.578
DMC 940836 0.404 903191 0.781 965307 0.071
CUR 3302593 0.236 3206134 0.555 3367309 0.114
Resolution, R
QUE - - - - - -
BDMC 32.498 0.379 36.449 0.471 29.120 0.063
DMC 2.908 0.208 3.272 2.369 2.736 0.181
CUR 2.850 0.237 3.243 1.648 2.666 0.124
Tailing factor, Tf
QUE 1.371 0.254 1.347 0.115 1.392 0.074
BDMC 1.533 0.364 1.283 2.314 1.080 0.200
DMC 1.160 0.484 1.083 0.151 1.431 0.082
CUR 1.094 0.094 1.076 0.284 1.114 0.037
Table 3 Precisions and accuracies for intraday and interday repetitions for the quantitative detection of QUE, BDMC, DMC and CUR
Table 4(a) Robustness – change in organic composition
*Intra day repetitions for each concentration were analyzed on the same day. †Inter day repetitions for each concentration, were analyzse on six consecutive days. RSD, relative standard deviation; QUE, quercetin; BDMC, bisdemethoxycurcumin; DMC, demethoxycurcumin; CUR, curcumin.
(Continued)

042 http://www.journal.ac Journal of Pharmacopuncture 2014;17(4):036-049
(Continued)
System suitabilityCom-pound
Change in the acetic acid concentration (% v/v )
(A) Normal conditionMean (n = 6) RSD (%)
(B) 1.0% (pH 2.73)Mean (n = 6) RSD (%)
(C) 3.0% (pH 2.48)Mean (n = 6) RSD (%)
Retention time, tR (minutes)
QUE 3.972 0.175 4.054 0.064 3.893 0.071
BDMC 13.868 0.310 14.549 0.086 13.177 0.167
DMC 15.255 0.265 16.017 0.085 14.542 0.153
CUR 16.743 0.213 17.590 0.084 16.028 0.141
Peak area
QUE 7039483 0.562 6966950 0.525 6952833 0.630
BDMC 180475 0.541 176885 0.575 152439 0.895
DMC 1000716 0.736 987128 0.551 956266 0.670
CUR 3433379 0.754 3428762 0.533 3428762 0.558
Resolution, R
QUE - - - - - -
BDMC 32.327 0.172 33.254 0.244 31.950 0.268
DMC 2.900 0.370 2.974 0.303 3.033 0.527
CUR 2.840 0.429 2.904 0.339 2.966 0.608
Tailing factor, Tf
QUE 1.366 0.077 1.364 0.215 1.370 0.110
BDMC 1.493 1.377 1.463 0.331 1.060 0.139
DMC 1.160 1.075 1.137 0.103 1.325 0.823
CUR 1.085 0.148 1.092 0.050 1.083 0.108
Theoretical plate, N
QUE 8711.993 0.267 8877.546 0.460 8548.948 0.269
BDMC 15740.557 0.397 16067.808 0.689 16308.146 0.664
DMC 14041.181 0.701 14691.580 0.675 14241.082 1.031
CUR 15793.019 0.472 16098.239 0.701 15531.342 0.811
Capacity factor, k’
QUE 0.656 1.783 0.680 1.484 0.610 0.803
BDMC 4.798 1.202 5.036 0.658 4.449 0.511
DMC 5.333 0.988 5.637 0.698 5.014 0.478
CUR 6.016 1.416 6.295 0.628 5.629 0.443
System suitabilityCom-pound
Change in the normal organic composition of acetonitrile: 2% acetic acid
(A) Normal conditionMean (n = 6) RSD (%)
(B) 38% : 62% v/vMean (n = 6) RSD (%)
(C) 42% : 58% v/vMean (n = 6) RSD (%)
Table 4(b) Robustness – change in acetic acid concentration
Theoretical plate, N
QUE 8752.133 1.463 8857.791 0.312 8520.171 0.238
BDMC 15931.889 1.147 16311.011 0.058 16303.130 0.103
DMC 14298.287 1.761 16569.474 1.029 14210.321 0.233
CUR 16008.049 1.202 16543.754 0.535 15157.508 0.340
Capacity factor, k’
QUE 0.680 0.344 0.777 0.906 0.601 0.327
BDMC 4.878 0.202 3.800 0.209 3.800 0.209
DMC 5.463 0.232 7.214 1.592 4.247 0.206
CUR 6.097 0.253 8.038 0.481 4.729 0.209
http://www.journal.ac 043Journal of Pharmacopuncture 2014;17(4):036-049
System suitabilityCom-pound
Change in flow rate
(A) Normal conditionMean (n = 6) RSD (%)
(B) 1.2 mL/minutesMean (n = 6) RSD (%)
(C) 1.4 mL/minutesMean (n = 6) RSD (%)
Retention time, tR (minutes)
QUE 3.972 0.175 4.291 0.105 3.696 0.130
BDMC 13.868 0.310 14.953 0.321 12.909 0.333
DMC 15.255 0.265 16.442 0.284 14.235 0.279
CUR 16.743 0.213 18.038 0.262 15.668 0.298
Peak area
QUE 7039483 0.562 7606272 0.662 6530571 0.497
BDMC 180475 0.541 194216 0.753 167111 1.593
DMC 1000716 0.736 1078076 0.714 928707 1.345
CUR 3433379 0.754 3700134 0.690 3185325 1.198
Resolution, R
QUE - - - - - -
BDMC 32.327 0.172 32.779 0.199 32.047 0.928
DMC 2.900 0.370 2.921 0.608 2.936 2.014
CUR 2.840 0.429 2.864 0.723 2.868 1.647
Tailing factor, Tf
QUE 1.366 0.077 1.360 0.183 1.371 0.287
BDMC 1.493 1.377 1.490 1.891 1.539 1.614
DMC 1.160 1.075 1.157 1.447 1.181 2.364
CUR 1.085 0.148 1.081 0.101 1.087 0.207
Theoretical plate, N
QUE 8711.993 0.267 9148.347 0.429 8249.430 0.420
BDMC 15740.557 0.397 16035.103 1.342 15696.046 2.851
DMC 14041.181 0.701 14374.944 1.036 13420.220 0.844
CUR 15793.019 0.472 16216.013 1.854 15379.165 2.364
Capacity factor, k’
QUE 0.656 1.783 0.661 0.832 0.627 0.762
BDMC 4.798 1.202 4.780 0.942 4.750 3.067
DMC 5.351 0.661 5.355 0.497 5.350 2.846
CUR 5.966 0.632 5.985 0.500 5.862 0.427
System suitabilityCom-pound
Change in column temperature
(A) Normal conditionMean (n = 6) RSD (%)
(B) 30°CMean (n = 6) RSD (%)
(C) 40°CMean (n = 6) RSD (%)
Retention time, tR (minutes)
QUE 3.956 0.031 4.063 0.074 3.861 0.162
BDMC 13.673 0.070 14.647 0.172 12.810 0.268
DMC 15.037 0.064 15.980 0.153 14.167 0.236
CUR 16.502 0.064 17.423 0.143 15.657 0.196
Peak area
QUE 7628483 0.252 7620525 0.254 7633341 0.259
BDMC 196493 0.261 202870 0.253 172397 0.136
DMC 1091099 0.300 1124567 0.281 1058404 0.205
CUR 3738544 0.244 3836306 0.285 3643910 0.196
Resolution, R
QUE - - - - - -
BDMC 31.946 1.437 32.560 0.233 31.471 0.267
DMC 2.872 1.359 2.698 0.334 3.155 0.481
CUR 2.829 0.575 2.718 0.305 3.106 0.559
Table 4(c) Robustness – change in flow rate
Table 4(d) Robustness – change in column temperature
(Continued)
044 http://www.journal.ac Journal of Pharmacopuncture 2014;17(4):036-049
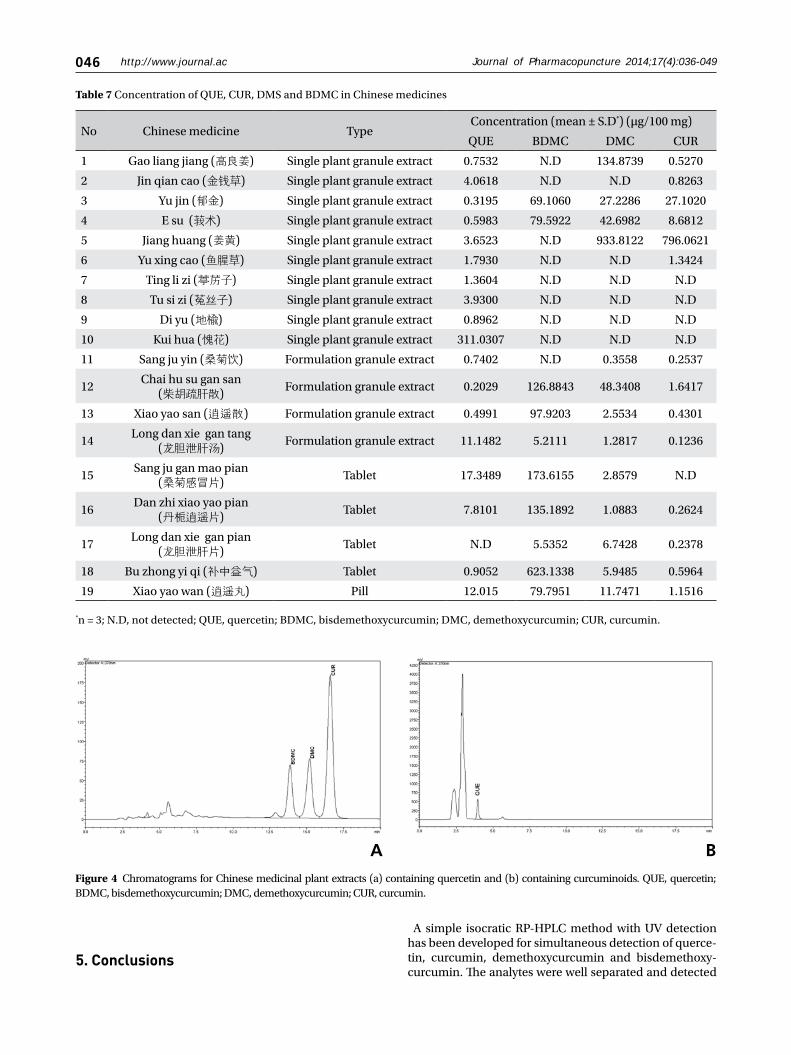
such as plant granule extracts, tablets and pills. The results of 19 samples are summarized in Table 7. In the tested samples, BDMC had the highest concentration compared to the other two curcuminoids tested (DMC and CUR),
and was found in the formulations of granule extracts, tab-lets and pills (such as samples 12, 13, 15, 16, 18 and 19) (Table 7). The preference of BDMC over CUR in the medi-cine might be due to its strong biological properties, which
System suitabilityCom-pound
Change in column temperature
(A) Normal conditionMean (n = 6) RSD (%)
(B) 30°CMean (n = 6) RSD (%)
(C) 40°CMean (n = 6) RSD (%)
The normal conditions of HPLC are a mobile phase of acetonitrile: 2% acetic acid (pH 2.60) = 40% : 60 % v/v, flow rate 1.3 mL/min at UV wavelength of 370 nm and column temperature at 35°C. RSD, relative standard deviation; QUE, quercetin; BDMC, bisdemethox-ycurcumin; DMC, demethoxycurcumin; CUR, curcumin.
S, standard deviation; x , mean of the data; tR, retention time of analyte 1; tw, peak width measured to the baseline of the extrap-olated straight sides to baseline; Wx, width of the peak determined at either 5% (0.05) or 10% (0.10) from the baseline of the peak height; f, distance between peak maximum and peak front at Wx; t0, elution time of the void volume or non retained components.
RSD, relative standard deviation; QUE, quercetin; BDMC, bisdemethoxycurcumin; DMC, demethoxycurcumin; CUR, curcumin. N, number of theoretical plates; k’, capacity factor; Mean of six replicate injections of quality control (QC) standard of 160 µg/mL.
Tailing factor, Tf
QUE 1.343 0.056 1.329 0.267 1.351 0.124
BDMC 1.551 0.421 1.233 0.525 1.089 0.077
DMC 1.186 0.241 1.098 0.268 1.491 1.051
CUR 1.097 0.082 1.094 0.107 1.098 0.129
Theoretical plate, N
QUE 8734.237 0.300 8837.810 0.448 8619.473 0.295
BDMC 15779.175 0.595 15065.104 0.600 16276.545 1.203
DMC 13866.206 1.175 15742.765 0.475 15286.704 0.311
CUR 15846.706 0.791 15917.987 0.394 15793.349 0.183
Capacity factor, k’
QUE 0.698 1.598 0.717 1.945 0.616 0.692
BDMC 4.855 0.115 5.190 0.989 4.366 0.214
DMC 5.449 0.349 5.752 0.966 4.962 1.315
CUR 6.058 0.201 6.362 0.942 5.581 1.015
Table 5 System suitability parameters, calculation formula and recommendations
Parameter Formula Recommendation
Precision RSD = S/x*100 RSD ≤ 1% for n ≥ 5
Resolution, R R = (tR2 – tR1)/(1/2)(tw1 –tw2) > 2
Tailing factor, Tf Tf = Wx/2f ≤ 2
Theoretical plates, N N = 16(tR/tw)2 Column efficiency ≥ 2000
Capacity factor, k k’ = (tR – t0)/t0 > 2
Table 6 System suitability testing
ParameterQUE BDMC DMC CUR
Mean RSD (%) Mean RSD (%) Mean RSD (%) Mean RSD (%)
Retention time, tR 3.970 0.021 13.840 0.027 15.230 0.025 16.723 0.021
Peak area 11221611 0.806 286851 0.654 1590498 0.651 5448675 0.711
Resolution, R - - 32.195 0.321 2.887 0.364 2.830 0.370
Tailing factor, Tf 1.369 0.108 1.501 0.261 1.165 0.144 1.081 0.051
Theoretical plate, N 8803.785 0.359 15552.398 0.865 13763.145 0.646 15568.252 0.910
Capacity factor, k’ 0.684 0.846 4.870 0.415 5.460 0.406 6.093 0.391

http://www.journal.ac 045Journal of Pharmacopuncture 2014;17(4):036-049
Figure 3 Combined chromatograms of quercetin (QUE), bisdemethoxycurcumin (BMDC), demethoxycurcumin (DMC), curcumin (CUR) ana-lyzed at different conditions: (a) acetonitrile: 2% acetic acid at a flow rate of 1.3 mL/minutes, 35°C (b) acetonitrile: different acetic acid concentra-tions (40% : 60% v/v) at a flow rate of 1.3 mL/min, 35°C (c) acetonitrile: 2% acetic acid (40% : 60% v/v) at different flow rates, 35°C (d) acetonitrile: 2% acetic acid (40% : 60% v/v) at a flow rate of 1.3 mL/min at different temperatures.
A
C
B
D
its use as a cure for diseases or as a supplement for cer-tain purposes. Quercetin was found in most of the tested samples, indicating that this compound is common and useful for treatment. Fig. 4 shows the chromatograms for the quercetin and the curcuminoids found in the tested samples.
4. Discussion
The HPLC method was developed by optimization of the mobile phase conditions so that quercetin, bisdemeth-oxycurcumin, demethoxycurcumin and curcumin peaks could be simultaneously detected by using the same sol-vent system and an isocratic method. The flow rate, acetic acid concentration and column temperature were varied to determine the chromatographic conditions giving the best separation and the shortest analysis time. UV visible sperctrophotometry in the wavelength from 200 to 500 nm was used for the detection of quercetin and curcuminoids; 370 nm was chosen as appropriate wavelength for the analysis of quercetin and curcumin derivatives.
The retention times for quercetin (3.97 minutes), bis-demethoxycurcumin (13.84 minutes), demethoxycurcum-in (15.23 minutes) and curcumin (16.72 minutes) were reasonable because the method is simple and general. The chromatograph peaks for mixtures of curcumin were iden-tified based on their percentages in the mixtures. Most of the commercially available curcumin/turmeric products
contain mixtures of curcumin, demethoxycurcumin and bisdemethoxycurcumin. Among these, curcumin (46% ─ 72%) is the major compound, followed by demethoxycur-cumin (11% ─ 28%) and bisdemethoxycurcumin (3% ─ 14%). All four analyte peaks were well separated from each other and from small additional peaks.
The linear ranges of quercetin (0.039 ─ 200 µg/mL), bis-demethoxycurcumin (2.500 ─ 320 μg/mL), demethoxy-curcumin (0.313 ─ 320 μg/mL) and curcumin (0.078 ─ 320 µg/mL) are suitable for the analysis of most the phar-maceutical products, containing the compounds and for the analysis of crude herbs. The low LOD and LOQ values indicate that the method provides adequate sensitivity. The R2 values > 0.999 for the regression model for the cali-bration curves confirm the good linearity of the method.
The accuracies ranged from 98.292% ─ 103.617%, and the precisions were less than 1% which indicate that the proposed method is well validated and suitable for quan-titatively detecting curcuminoids and quercetin simulta-neously in pharmaceutical products, herb materials and various turmeric and quercetin containing products.
System suitability testing is important to ensure the per-formance of the system before and during the analysis. As defined in the United States Pharmacopeia/National Formulary (USP/NF) [54] system suitability parameters were established as a direct result of the ruggedness and the robustness of the experiments. The system suitability testing proved that the proposed method will allow the separation of all four anaytes and will produce satisfactory peak shapes.
046 http://www.journal.ac Journal of Pharmacopuncture 2014;17(4):036-049
Figure 4 Chromatograms for Chinese medicinal plant extracts (a) containing quercetin and (b) containing curcuminoids. QUE, quercetin; BDMC, bisdemethoxycurcumin; DMC, demethoxycurcumin; CUR, curcumin.
A B
*n = 3; N.D, not detected; QUE, quercetin; BDMC, bisdemethoxycurcumin; DMC, demethoxycurcumin; CUR, curcumin.
Table 7 Concentration of QUE, CUR, DMS and BDMC in Chinese medicines
No Chinese medicine TypeConcentration (mean ± S.D*) (µg/100 mg)
QUE BDMC DMC CUR
1 Gao liang jiang (高良姜) Single plant granule extract 0.7532 N.D 134.8739 0.5270
2 Jin qian cao (金钱草) Single plant granule extract 4.0618 N.D N.D 0.8263
3 Yu jin (郁金) Single plant granule extract 0.3195 69.1060 27.2286 27.1020
4 E su (莪术) Single plant granule extract 0.5983 79.5922 42.6982 8.6812
5 Jiang huang (姜黄) Single plant granule extract 3.6523 N.D 933.8122 796.0621
6 Yu xing cao (鱼腥草) Single plant granule extract 1.7930 N.D N.D 1.3424
7 Ting li zi (葶苈子) Single plant granule extract 1.3604 N.D N.D N.D
8 Tu si zi (菟丝子) Single plant granule extract 3.9300 N.D N.D N.D
9 Di yu (地榆) Single plant granule extract 0.8962 N.D N.D N.D
10 Kui hua (愧花) Single plant granule extract 311.0307 N.D N.D N.D
11 Sang ju yin (桑菊饮) Formulation granule extract 0.7402 N.D 0.3558 0.2537
12Chai hu su gan san
(柴胡疏肝散)Formulation granule extract 0.2029 126.8843 48.3408 1.6417
13 Xiao yao san (逍遥散) Formulation granule extract 0.4991 97.9203 2.5534 0.4301
14Long dan xie gan tang
(龙胆泄肝汤)Formulation granule extract 11.1482 5.2111 1.2817 0.1236
15Sang ju gan mao pian
(桑菊感冒片)Tablet 17.3489 173.6155 2.8579 N.D
16Dan zhi xiao yao pian
(丹栀逍遥片)Tablet 7.8101 135.1892 1.0883 0.2624
17Long dan xie gan pian
(龙胆泄肝片)Tablet N.D 5.5352 6.7428 0.2378
18 Bu zhong yi qi (补中益气) Tablet 0.9052 623.1338 5.9485 0.5964
19 Xiao yao wan (逍遥丸) Pill 12.015 79.7951 11.7471 1.1516
5. Conclusions
A simple isocratic RP-HPLC method with UV detection has been developed for simultaneous detection of querce-tin, curcumin, demethoxycurcumin and bisdemethoxy-curcumin. The analytes were well separated and detected
http://www.journal.ac 047Journal of Pharmacopuncture 2014;17(4):036-049
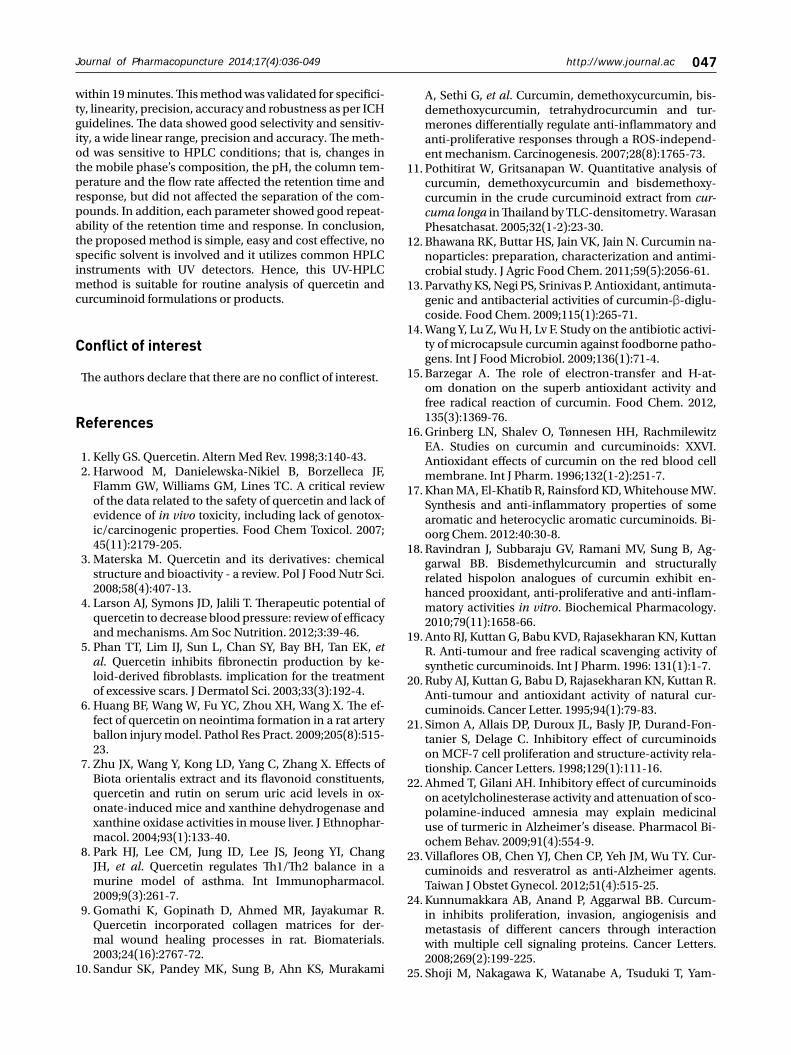
within 19 minutes. This method was validated for specifici-ty, linearity, precision, accuracy and robustness as per ICH guidelines. The data showed good selectivity and sensitiv-ity, a wide linear range, precision and accuracy. The meth-od was sensitive to HPLC conditions; that is, changes in the mobile phase’s composition, the pH, the column tem-perature and the flow rate affected the retention time and response, but did not affected the separation of the com-pounds. In addition, each parameter showed good repeat-ability of the retention time and response. In conclusion, the proposed method is simple, easy and cost effective, no specific solvent is involved and it utilizes common HPLC instruments with UV detectors. Hence, this UV-HPLC method is suitable for routine analysis of quercetin and curcuminoid formulations or products.
Conflict of interest
The authors declare that there are no conflict of interest.
References
Kelly GS. Quercetin. Altern Med Rev. 1998;3:140-43.Harwood M, Danielewska-Nikiel B, Borzelleca JF, Flamm GW, Williams GM, Lines TC. A critical review of the data related to the safety of quercetin and lack of evidence of in vivo toxicity, including lack of genotox-ic/carcinogenic properties. Food Chem Toxicol. 2007; 45(11):2179-205.Materska M. Quercetin and its derivatives: chemical structure and bioactivity - a review. Pol J Food Nutr Sci. 2008;58(4):407-13. Larson AJ, Symons JD, Jalili T. Therapeutic potential of quercetin to decrease blood pressure: review of efficacy and mechanisms. Am Soc Nutrition. 2012;3:39-46.Phan TT, Lim IJ, Sun L, Chan SY, Bay BH, Tan EK, et al. Quercetin inhibits fibronectin production by ke-loid-derived fibroblasts. implication for the treatment of excessive scars. J Dermatol Sci. 2003;33(3):192-4.Huang BF, Wang W, Fu YC, Zhou XH, Wang X. The ef-fect of quercetin on neointima formation in a rat artery ballon injury model. Pathol Res Pract. 2009;205(8):515-23.Zhu JX, Wang Y, Kong LD, Yang C, Zhang X. Effects of Biota orientalis extract and its flavonoid constituents, quercetin and rutin on serum uric acid levels in ox-onate-induced mice and xanthine dehydrogenase and xanthine oxidase activities in mouse liver. J Ethnophar-macol. 2004;93(1):133-40.Park HJ, Lee CM, Jung ID, Lee JS, Jeong YI, Chang JH, et al. Quercetin regulates Th1/Th2 balance in a murine model of asthma. Int Immunopharmacol. 2009;9(3):261-7.Gomathi K, Gopinath D, Ahmed MR, Jayakumar R. Quercetin incorporated collagen matrices for der-mal wound healing processes in rat. Biomaterials. 2003;24(16):2767-72.Sandur SK, Pandey MK, Sung B, Ahn KS, Murakami
1.2.
3.
4.
5.
6.
7.
8.
9.
10.
A, Sethi G, et al. Curcumin, demethoxycurcumin, bis-demethoxycurcumin, tetrahydrocurcumin and tur-merones differentially regulate anti-inflammatory and anti-proliferative responses through a ROS-independ-ent mechanism. Carcinogenesis. 2007;28(8):1765-73. Pothitirat W, Gritsanapan W. Quantitative analysis of curcumin, demethoxycurcumin and bisdemethoxy-curcumin in the crude curcuminoid extract from cur-cuma longa in Thailand by TLC-densitometry. Warasan Phesatchasat. 2005;32(1-2):23-30.Bhawana RK, Buttar HS, Jain VK, Jain N. Curcumin na-noparticles: preparation, characterization and antimi-crobial study. J Agric Food Chem. 2011;59(5):2056-61.Parvathy KS, Negi PS, Srinivas P. Antioxidant, antimuta-genic and antibacterial activities of curcumin-β-diglu-coside. Food Chem. 2009;115(1):265-71.Wang Y, Lu Z, Wu H, Lv F. Study on the antibiotic activi-ty of microcapsule curcumin against foodborne patho-gens. Int J Food Microbiol. 2009;136(1):71-4.Barzegar A. The role of electron-transfer and H-at-om donation on the superb antioxidant activity and free radical reaction of curcumin. Food Chem. 2012, 135(3):1369-76.Grinberg LN, Shalev O, Tønnesen HH, Rachmilewitz EA. Studies on curcumin and curcuminoids: XXVI. Antioxidant effects of curcumin on the red blood cell membrane. Int J Pharm. 1996;132(1-2):251-7.Khan MA, El-Khatib R, Rainsford KD, Whitehouse MW. Synthesis and anti-inflammatory properties of some aromatic and heterocyclic aromatic curcuminoids. Bi-oorg Chem. 2012:40:30-8.Ravindran J, Subbaraju GV, Ramani MV, Sung B, Ag-garwal BB. Bisdemethylcurcumin and structurally related hispolon analogues of curcumin exhibit en-hanced prooxidant, anti-proliferative and anti-inflam-matory activities in vitro. Biochemical Pharmacology. 2010;79(11):1658-66.Anto RJ, Kuttan G, Babu KVD, Rajasekharan KN, Kuttan R. Anti-tumour and free radical scavenging activity of synthetic curcuminoids. Int J Pharm. 1996: 131(1):1-7.Ruby AJ, Kuttan G, Babu D, Rajasekharan KN, Kuttan R. Anti-tumour and antioxidant activity of natural cur-cuminoids. Cancer Letter. 1995;94(1):79-83.Simon A, Allais DP, Duroux JL, Basly JP, Durand-Fon-tanier S, Delage C. Inhibitory effect of curcuminoids on MCF-7 cell proliferation and structure-activity rela-tionship. Cancer Letters. 1998;129(1):111-16. Ahmed T, Gilani AH. Inhibitory effect of curcuminoids on acetylcholinesterase activity and attenuation of sco-polamine-induced amnesia may explain medicinal use of turmeric in Alzheimer’s disease. Pharmacol Bi-ochem Behav. 2009;91(4):554-9.Villaflores OB, Chen YJ, Chen CP, Yeh JM, Wu TY. Cur-cuminoids and resveratrol as anti-Alzheimer agents. Taiwan J Obstet Gynecol. 2012;51(4):515-25.Kunnumakkara AB, Anand P, Aggarwal BB. Curcum-in inhibits proliferation, invasion, angiogenisis and metastasis of different cancers through interaction with multiple cell signaling proteins. Cancer Letters. 2008;269(2):199-225.Shoji M, Nakagawa K, Watanabe A, Tsuduki T, Yam-
11.
12.
13.
14.
15.
16.
17.
18.
19.
20.
21.
22.
23.
24.
25.

048 http://www.journal.ac Journal of Pharmacopuncture 2014;17(4):036-049
ada T, Kuwahara S, et al. Comparison of the effects of curcumin and curcumin glucuronide in human hepatocellular carcinoma HepG2 cells. Food Chem. 2014;151:126-32.Kim T, Davis J, Zhang AJ, He X, Mathews ST. Curcumin activates AMPK and suppresses gluconeogenic gene expression in hepatoma cells. Biochem Biophys Res Commun. 2009;388(2):377-82.Mahattanadul S, Nakamura T, Panichayupakaranant P, Phdoongsombut N, Tungsinmunkong K, Bouking P. Comparative antiulcer effect of bisdemethoxycurcum-in and curcumin in a gastric ulcer model system. Phy-tomedicine. 2009;16(4):342-51.Jain K, Sood S, Gowthamarajan K. Modulation of cer-ebral malaria by curcumin as an adjunctive therapy. Braz J Infect Dis. 2013;17(5):579-91.Nayak A, Tiyaboonchai W, Patankar S, Madhusudhan B, Souto EB. Curcuminoids-loaded lipid nanoparticles: novel approach towards malaria treatment. Colloids Surf B Biointerfaces. 2010;81(1):263-73.Jagetia GC, Rajanikant GK. Role of curcumin, a natu-rally occurring phenolic compound of turmeric in ac-celerating the repair of excision wound, in mice whole-body exposed to various doses of γ-radiation. J Surg Res. 2004;120(1):127-38.Li X, Nan K, Li L, Zhang Z, Chen H. In vivo evaluation of curcumin nanoformulation loaded methoxy poly(eth-yleneglycol)-graft-chitosan composite film for wound healing application. Carbohydr Polym. 2012;88(1):84-90.Panchatcharam M, Miriyala S, Gayathri VS, Suguna L. Curcumin improves wound healing by modulating col-lagen and decreasing reactive oxygen species. Mol Cell Biochem. 2006;290(1-2):87-96.Aneja G, Dave U, Vadodaria K. Simultaneous estima-tion of piperine, quercetin, and curcumin in a mixture using u.v-visible spectrophotometer and method val-idation. International Journal of Therapeutic Applica-tions. 2012;8:14-7.Askal HF, Saleh GA, Backheet EY. A selective spectro-photometric method for determination of querce-tin in the presence of other flavonoids. Talanta. 1992;39(3):259-63.Kuntić V, Pejić N, Mićić S, Vukojević V, Vujić Z, Malešev D. Determination of quercetin in pharmaceu-tical formations via its reaction with potassium tita-nyloxalate. Determination of the stability constants of the quercetin titanyloxalato complex. J Serb Chem Soc. 2005;70(5):753-63. Sharma K, Agrawal SS, Gupta M. Development and val-idation of UV spectrophotometric method for the esti-mation of curucmin in bulk drug and pharmaceutical dosage forms. IJDDR. 2012;4(2):375-80.Kulkarni SJ, Maske KN, Budre MP, Mahajan RP. Extrac-tion and purification of curcuminoids from Turmeric (curcuma longa L.). Int J Pharm Technol. 2012;1(2):81-4. Revathy S, Elumalai S, Benny M, Antony B: Isolation, purification and identification of curcuminoids from turmeric (Curcuma long L.) by column chromatogra-phy. Journal of Experimental Sciences. 2011;2(7):21-5.
Sheikh S, Asghar S, Ahmad S. Development of HPTLC method and its validation for the estimation of cur-cuminoids from polyherbal mouth ulcer gel formula-tion. IOSR J Pharm Biol Sci. 2013;3(1):29-34.Careri M, Corradini C, Elviri L, Nicoletti I, Zagnoni I. Direct HPLC analysis of quercetin and trans-resveratrol in red wine, grape, and winemaking byproducts. J Agric Food Chem. 2003;51(18):5226-31.Ishii K, Furuta T, Kasuya Y. High-performance liquid chromatographic determination of quercetin in human plasma and urine utilizing solid-phase extraction and ultraviolet detection. J Chromatogr B. 2003;794(1):49-56. Jayaprakasha GK, Rao LJM, Sakariah KK. Improved HPLC method for the determination of curcumin, demethoxycurcumin, and bisdemethoxycurcumin. J Agric Food Chem. 2002;50(13):3668-72. Rajalakshmi PV, Senthil KK. Direct HPLC analysis of quercetin in exudates of abutilon indicum (Linn). mal-vaceae. J Pharm Sci Technol. 2009;1(2):80-3.Wichitnithad W, Jongaroonngamsang N, Pummangu-ra S, Rojsitthisak, P. A simple isocratic HPLC method for the simultaneous determination of curcuminoids in commercial turmeric extracts. Phytochem Anal. 2009;20(4):314-9.Zhang J, Jinnai S, Ikeda R, Wada M, Hayashida S, Na-kashima K. A simple HPLC-fluorescence method for quantitation of curcuminoids and its application to turmeric products. Analyt Sci. 2009;25(3):385-8.Ashraf K, Mujeeg M, Ahmad A, Amir M, Mallick MN, Sharma D. Validated HPTLC analysis method for quantification of variability in content of curcumin in Curcuma long L (turmeric) collected from different ge-ographical region of India. Asian Pac J Trop Biomed. 2012;S584-8.Paramasivam M, Poi R, Banerjee H, Bandyopadhyay A. High-performance thin layer chromatographic method for quantitative determination of curcuminoids in Cur-cuma longa germplasm. Food Chem. 2009;113(2):640-4. Verma MK, Najar IA, Tikoo MK, Singh G, Gupta DK, Anand R, et al. Development of a validated UPLC-qTOF-MS method for the determination of curcumi-noids and their pharmacokinetic study in mice. DARU Journal of Pharmaceutical Sciences. 2013;21:11.Avula B, Wang YH, Khan IA. Quantitative determina-tion of curcuminoids from the roots of Curcuma longa, Curcuma species and dietary supplements using an UPLC-UV-MS method. J Chromatograph Separat Tech-niq. 2012;3(1):1000120.Li W, Xiao H, Wang L, Liang X. Analysis of minor cur-cuminoids in Curcuma longa L. by high performance liquid chromatography-tandem mass spectrometry. Se Pu. 2009;27(3):264-9.Long Y, Zhang W, Wang F, Chen Z. Simultaneous de-termination of three curcuminoids in Curcuma long L. by high performance liquid chromatography cou-pled with electrochemical detection. J Pharm Anal. 2014;4(5):325-30.Validation of analytical procedures: text and method-ology Q2 (R1). ICH Harmonised Tripartite Guideline
26.
27.
28.
29.
30.
31.
32.
33.
34.
35.
36.
37.
38.
39.
40.
41.
42.
43.
44.
45.
46.
47.
48.
49.
50.
51.
52.
http://www.journal.ac 049Journal of Pharmacopuncture 2014;17(4):036-049
[internet]. Switzerland: ICH; 1996. Available from: http://www.ich.org/fileadmin/Public_Web_Site/ICH_Products/Guidelines/Quality/Q2_R1/Step4/Q2_R1__Guideline.pdf.Reviewer guidance-validation of chromatographic methods [internet]. USA: Center for Drug Evaluation and Research (CDER). U.S. FDA; 1994. Available from: http://www.fda.gov/downloads/Drugs/Guidances/UCM134409.pdf.General chapters <621> Chromatography Glossary of Symbols [internet]. USA: USP Pharmacists’ Pharmaco-peia; 2008. Available from: http://www.usp.org/sites/default/files/usp_pdf/EN/products/usp2008p2sup-plement3.pdf.
53.
54.