HP Application Performance Management What’s New Vivit ... · Develop script or reuse testing...
62
© Copyright 2012 Hewlett-Packard Development Company, L.P. The information contained herein is subject to change without notice. HP Application Performance Management – What’s New – Vivit User Group Chicago Dan Simanaitis – HP BSM Solution Architect February 7, 2013 [email protected]
Transcript of HP Application Performance Management What’s New Vivit ... · Develop script or reuse testing...

© Copyright 2012 Hewlett-Packard Development Company, L.P. The information contained herein is subject to change without notice.
HP Application Performance Management – What’s New – Vivit User Group Chicago
Dan Simanaitis – HP BSM Solution Architect
February 7, 2013

© Copyright 2012 Hewlett-Packard Development Company, L.P. The information contained herein is subject to change without notice. 2
Discussion Topics Agenda :
Business Service Management Overview – HP’s Point of View
HP Application Performance Management – Overview & What’s New
• Business Process Monitor (BPM)
• Real User Monitor (RUM)
• Diagnostics
Demo – Diagnostics Client Monitoring – Audience Participation Required
Questions & Answers

© Copyright 2012 Hewlett-Packard Development Company, L.P. The information contained herein is subject to change without notice. 3
BSM Portfolio The different components of BSM
Service Intelligence
Event Management & Correlation (OMi)
Run Time Service Model (RTSM), Foundation Platform Services
Applications Mgmt
Virtualization Mgmt
Network Mgmt
Storage Mgmt
Log Mgmt
System Mgmt
1) Analytics
2) Event Management
3) Unified Monitoring

© Copyright 2012 Hewlett-Packard Development Company, L.P. The information contained herein is subject to change without notice. 4
Mobile Cloud DevOps • Proactive – Identify issues using global
synthetic transactions before your customers find them
• Real Time – Capture each real user experience, transactions and behavior from every location
• Depth – Drill down deep into transactions across the entire transaction value delivery chain, from end-user to the mainframe
360 degree view of application health
HP Application Performance Management

© Copyright 2012 Hewlett-Packard Development Company, L.P. The information contained herein is subject to change without notice. 5
1) Monitor End User Performance – Business Process Monitor (BPM) / Real User Monitor (RUM)
HP Application Performance Management (APM)
2) Pinpoint Application Bottlenecks – Diagnostics , TransactionVision, Business Process Insight
3) Predict Application Performance Issues – Service Health Analyzer Analyzer
Transaction Management (Deep Diagnostics/Tracking/Business Visibility)
Predictive Analytics
End-User Management (Synthetic/Real/Client)
Transaction flow, e.g.; e-commerce order

© Copyright 2012 Hewlett-Packard Development Company, L.P. The information contained herein is subject to change without notice.
HP Business Process Monitor – Overview and What’s New

© Copyright 2012 Hewlett-Packard Development Company, L.P. The information contained herein is subject to change without notice. 7
Synthetic end-user monitoring for all application from all locations
HP Business Process Monitor (BPM)
Synthetic user Switzerland
Synthetic user New York
Synthetic user Singapore
(BAC Anywhere)
Launch Script
Txn1 Txn2 Txn3
Verify business service (script)
Synthetic mobile user Singapore
(BAC Anywhere)
Report and alert in centralized console
Develop script or reuse testing script to quickly monitor applications
1
2 Monitor from all locations
3 Verify key business service 4
© Copyright 2012 Hewlett-Packard Development Company, L.P. The information contained herein is subject to change without notice. 8
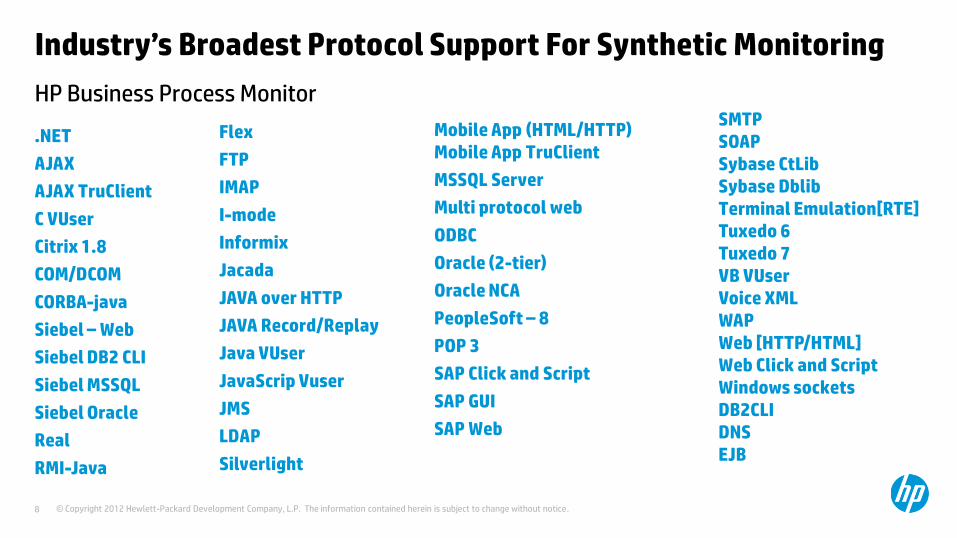
Industry’s Broadest Protocol Support For Synthetic Monitoring
.NET
AJAX
AJAX TruClient
C VUser
Citrix 1.8
COM/DCOM
CORBA-java
Siebel – Web
Siebel DB2 CLI
Siebel MSSQL
Siebel Oracle
Real
RMI-Java
Flex
FTP
IMAP
I-mode
Informix
Jacada
JAVA over HTTP
JAVA Record/Replay
Java VUser
JavaScrip Vuser
JMS
LDAP
Silverlight
Mobile App (HTML/HTTP) Mobile App TruClient
MSSQL Server
Multi protocol web
ODBC
Oracle (2-tier)
Oracle NCA
PeopleSoft – 8
POP 3
SAP Click and Script
SAP GUI
SAP Web
HP Business Process Monitor SMTP SOAP Sybase CtLib Sybase Dblib Terminal Emulation[RTE] Tuxedo 6 Tuxedo 7 VB VUser Voice XML WAP Web [HTTP/HTML] Web Click and Script Windows sockets DB2CLI DNS EJB

© Copyright 2012 Hewlett-Packard Development Company, L.P. The information contained herein is subject to change without notice. 9
Monitor the availability and performance of mobile applications
Internet Business Application
BPM
BPM BPM
Monitor mobile web and native mobile applications Combine mobile application performance with underlying infrastructure
Monitor application over Internet from local location or remote location.
Monitor location can be configured with access to a Wireless Carrier

© Copyright 2012 Hewlett-Packard Development Company, L.P. The information contained herein is subject to change without notice. 10
HP Business Process Monitor
• Automated Baselines
• Mobile Protocols
• VuGen IPv6 support
• Enhanced Reports for Synthetic Monitoring of Mobile Apps
• Alerts by Mobile Device Type
• Import data from HP Performance Center (BPM scripts & SiteScope Config templates)
What’s New

© Copyright 2012 Hewlett-Packard Development Company, L.P. The information contained herein is subject to change without notice. 11
BPM baselining – motivation
What is normal behavior for an application?

© Copyright 2012 Hewlett-Packard Development Company, L.P. The information contained herein is subject to change without notice. 12
BPM baselining – calculations, granularity & thresholds
Calculations from samples:
• Mean
• Standard deviation
Granularity is per:
• Transaction
• Location
Thresholds for:
• Performance
• But NOT Availability

© Copyright 2012 Hewlett-Packard Development Company, L.P. The information contained herein is subject to change without notice. 13
BPM baseline – trends & seasonality
Seasonality
• Repeated pattern
• Constant time intervals
Trend
• Consistent linear change over time
How much data?
• ~1 week’s worth to begin
• Updated weekly
Mon Tu Wed Th Fri

© Copyright 2012 Hewlett-Packard Development Company, L.P. The information contained herein is subject to change without notice. 14
Baseline in BPM reports The baseline threshold sleeves will be shown in Metrics Over Time report for BPM metrics.
Includes “Adoption mode” – use static thresholds and compare them to baseline results before applying baseline mode.

© Copyright 2012 Hewlett-Packard Development Company, L.P. The information contained herein is subject to change without notice. 15
Metrics Over Time report displays baseline data

© Copyright 2012 Hewlett-Packard Development Company, L.P. The information contained herein is subject to change without notice. 16
Baseline is transparent in all other reports
Baseline in Reports - transparent to the user

© Copyright 2012 Hewlett-Packard Development Company, L.P. The information contained herein is subject to change without notice. 17
Alerts display Baseline data

© Copyright 2012 Hewlett-Packard Development Company, L.P. The information contained herein is subject to change without notice.
HP Real User Monitor – Overview and What’s New

© Copyright 2012 Hewlett-Packard Development Company, L.P. The information contained herein is subject to change without notice. 19
HP Real User Monitor measures the real user experience of key business applications
HP Real User Monitor (RUM)
Mainframe
Virtual / physical hybrid environments
Browser
Citrix
Mobile
Mobile carriers
Cloud services/ISPs
Employees/Customers
Firewall
Employees
Network Web servers /Load balancer Application servers/
composite applications
Databases Web services
Real User Monitor
Reporting and alerting in central console

© Copyright 2012 Hewlett-Packard Development Company, L.P. The information contained herein is subject to change without notice. 20
RUM Protocols, Templates and Protocol SDK
Increasing Real-Time End-User Coverage Fr
on
ten
d
Ba
cken
d
/Mid
dle
wa
re
Ma
il
Va
rio
us
Custom web HTTP/HTTPs
Flash Flex AMF0, AMF3
SAP Oracle Forms NCA Siebel
HTTP/S , SAP GUI Over HTTP/TCP HTTP/S
PeopleSoft HTTP/s
Streaming/VoIP UDP
IMAP IMAP
SMTP SMTP
POP3 POP3
VD
I Citrix Xen Citrix ICA
Application Protocol Application Protocol
FTP FTP
LDAP LDAP
ISO 8583 VISA Base I, MasterCard CIS
SOAP IBM WebSphere MQ
HTTP/s MQ
Oracle DB Oracle DB
MS SQL MS SQL
MySQL MySQL
DB2 DB2

© Copyright 2012 Hewlett-Packard Development Company, L.P. The information contained herein is subject to change without notice. 21
RUM Architecture Version 9.20 and prior

© Copyright 2012 Hewlett-Packard Development Company, L.P. The information contained herein is subject to change without notice. 22
RUM Architecture Version 9.21
RUM Svr Colltr – lightwt agent servers as a virtual tap

© Copyright 2012 Hewlett-Packard Development Company, L.P. The information contained herein is subject to change without notice. 23
Flexible deployment for any use-case
Real User Monitor – new capabilities for mobile apps
Network (Traditional) Browser Hybrid = Network + Browser
Collect data from browser, measure Client tier accurately, No Network settings required!
Network Real User Monitor
Real User Monitor
Browser
Real User Monitor
Browser
Network
New New
Combines data from browser and network for true end to end visibility
Collects data from network, measure inside data center, monitor frontend and backend tiers
Discovery Network Backend Web 2.0 User Analytics End to End User Experience

© Copyright 2012 Hewlett-Packard Development Company, L.P. The information contained herein is subject to change without notice. 24
HP Real User Monitor
• New Protocols – AMF (Flex), MQ, SAP GUI, Generic Routing Encapsulation (GRE) Tunneling
• Web-tier breakdown
• Automated baselines
• Support for IPv6 based traffic
• Just-in-time discovery
• Web-client monitoring (RUM Browser)
• RUM data export to csv file(s)
• RUM Server Collector
• RUM Probe on RHEL 6
What’s New

© Copyright 2012 Hewlett-Packard Development Company, L.P. The information contained herein is subject to change without notice. 25
RUM supports Flex
• Flex - a framework for developing Flash applications
• Flex uses AMF protocol to communicate between Flash client & server
• RUM 9.12 supports AMF0 and AMF3
Server Flash Client
AMF0
AMF3

© Copyright 2012 Hewlett-Packard Development Company, L.P. The information contained herein is subject to change without notice. 26
MQ
Qu
eue
Man
ager
users
etc permissions
queues
RUM supports MQ Application Server
Application Server
Web Server MQ
Qu
eue
Man
ager
users
etc permissions
MQ {channel, queue manager, request type}
RUM
User names
Message type
Message queue
Manager queue
Message content:
• Mask sensitive content
queues

© Copyright 2012 Hewlett-Packard Development Company, L.P. The information contained herein is subject to change without notice. 27
Session Details report with MQ actions

© Copyright 2012 Hewlett-Packard Development Company, L.P. The information contained herein is subject to change without notice. 28
RUM supports SAPGUI
SAP: multitier application with two UIs:
• SAPGUI client
• NetWeaver (HTML)
SAPGUI Client Browser
SAP R/3 Server
DB
Business process ID’d by T-CODE
RUM monitors:
• SAP Transactions
•User name
•Performance
•Sessions
•Classification
•Network quality

© Copyright 2012 Hewlett-Packard Development Company, L.P. The information contained herein is subject to change without notice. 29
Real User Monitoring of SAP GUI Clients Example RUM passively monitoring All SAP Transactions from All Locations, All the Time
SAP topology in respect to Application Tiers and SAP Transactions
SAP Business Impact Analysis through SLM
Alert on Transactions , App and Network Performance
Adding Real User Perspective to HP’s SAP Monitoring through BSM (infrastructure monitoring, discovery, topology and synthetic monitoring)
SAP TCODE Monitor HTTP NetWeaver and SAP GUI based SAP Clients
Measure Performance, including network
Auto Transaction detection based on SAP TCODEs (SAP GUI only)
Trace an individual user’s session
Detect and filter by username
SAP Topology

© Copyright 2012 Hewlett-Packard Development Company, L.P. The information contained herein is subject to change without notice. 30
Front-end HTTP tier breakdown App. Server
App. Server
Load Balancer Reverse Proxy
Track HTTP traffic passing through several Web servers
Client

© Copyright 2012 Hewlett-Packard Development Company, L.P. The information contained herein is subject to change without notice. 31
Show transaction breakdown by Web tier
New Report – Web Tier Breakdown

© Copyright 2012 Hewlett-Packard Development Company, L.P. The information contained herein is subject to change without notice. 32
RUM baselining – goals
Simplify the definition of pages
User does not know what threshold to use for each page
Automatic thresholds for classified pages
No need to define the page to have a separate threshold for it
Dynamic thresholds for pages and transactions
Transaction threshold changes whenever there is a change in the behavior

© Copyright 2012 Hewlett-Packard Development Company, L.P. The information contained herein is subject to change without notice. 33
RUM baselining – details
Calculations from samples:
• Mean & Standard deviation: use pre-defined “bucket” size, configurable in JMX Console
• Updated with every sample
• Mean + 2*StdDev – configurable in JMX Console
Granularity is per:
• Page
• Transaction
• But NOT Location
Thresholds for:
• Page time
• Server time
• Set value to avoid false alerts
No seasonality due to current overhead

© Copyright 2012 Hewlett-Packard Development Company, L.P. The information contained herein is subject to change without notice. 34
RUM baselining – the bucket
Bucket consists of:
• Four sample queues (default)
• Each queue holds 2000 samples (default)
• Both are configurable in JMX Console
• algorithmQueueSize = 4
• algorithmSamplesPerQueuedItem = 2000
• Baseline calculated over all samples
• When all are filled, oldest is dropped

© Copyright 2012 Hewlett-Packard Development Company, L.P. The information contained herein is subject to change without notice. 35
RUM baseline - Reports
Action Summary – different thresholds for undefined pages
Tier summary – performance includes dynamic thresholds
RUM reports are “sleeveless”
Dynamic threshold in tooltip

© Copyright 2012 Hewlett-Packard Development Company, L.P. The information contained herein is subject to change without notice. 36
RUM baseline - Configuration Per application tier
Allow to force static threshold per defined page
Dynamic threshold definition in transaction (regardless of baseline)
Available for search and update in GSAR (Global Search And Replace)

© Copyright 2012 Hewlett-Packard Development Company, L.P. The information contained herein is subject to change without notice. 37
Monitor application performance, availability and usage volume
RUM Browser
User Session Clickstream (single user)
Aggregated Performance & Availability (all users, individual or all apps)
Transaction
comp comp comp comp comp comp comp comp
comp comp comp comp comp
Page
comp comp comp comp comp comp comp
Page Page
Transaction
Page
Res
po
nse
Tim
e Track User Session Location | Username | Browser | OS | Device
Sessions by Usernames | Browsers | OS | Devices
Locations (all users, all sessions, per app)

© Copyright 2012 Hewlett-Packard Development Company, L.P. The information contained herein is subject to change without notice. 38
Breakdown user experience by location, username, browser, OS, device…
RUM Browser
Track User Session Location | Username | Browser | OS | Device
User Session Clickstream (single user)
Sessions by Usernames | Browsers | OS | Devices
Aggregated Performance & Availability (all users, individual or all apps)
Transaction
comp comp comp comp comp comp comp comp
comp comp comp comp comp
Page
comp comp comp comp comp comp comp
Locations (all users, all sessions, per app)
Page Page
Transaction
Page
Res
po
nse
Tim
e

© Copyright 2012 Hewlett-Packard Development Company, L.P. The information contained herein is subject to change without notice. 39
Search for individual user session by various properties
RUM Browser
User Session Clickstream (single user)
Aggregated Performance & Availability (all users, individual or all apps)
Transaction
comp comp comp comp comp comp comp comp
comp comp comp comp comp
Page
comp comp comp comp comp comp comp
Page Page
Transaction
Page
Res
po
nse
Tim
e Track User Session Location | Username | Browser | OS | Device
Sessions by Usernames | Browsers | OS | Devices
Locations (all users, all sessions, per app)

© Copyright 2012 Hewlett-Packard Development Company, L.P. The information contained herein is subject to change without notice. 40
Transaction Matching – monitor multi step user flows
RUM Browser
User Session Clickstream (single user)
Aggregated Performance & Availability (all users, individual or all apps)
Transaction
comp comp comp comp comp comp comp comp
comp comp comp comp comp
Page
comp comp comp comp comp comp comp
Page Page
Transaction
Page
Res
po
nse
Tim
e Track User Session Location | Username | Browser | OS | Device
Sessions by Usernames | Browsers | OS | Devices
Locations (all users, all sessions, per app)

© Copyright 2012 Hewlett-Packard Development Company, L.P. The information contained herein is subject to change without notice. 41
Collects and Stores every user action, for all users
RUM Browser Enables Analytics
Business Process Recognition
Troubleshooting/Isolation and deep dive
Business Process Distribution
Network Perf
Analyze Transaction popularity & response time to generate load tests
Identify Common User Flows
Real User Monitor
Browser
Easy Export of ALL user recorded data for data analysis
Export RAW Data
New
VERTICA

© Copyright 2012 Hewlett-Packard Development Company, L.P. The information contained herein is subject to change without notice. 42
Just-in-time Passive Discovery
RUM for HP Universal Discovery (UD)
Real Time Discovery
Performed Passively (no noise)
Credential-less
Continuous
Shallow discovery
Capturing ALL Connections
Noise Filtering *RUM Probe deployment requires configured Span Port/Tap
RUM Integrates to UD
Sends Event
UD (DDM)
Active Probe
Discovers
Additional CI’s
CMS (UCMDB)
Report CIs
Captured in
Event
Invoke Active Discovery Jobs
1 2
3
4 Use Cases • Real time dependencies mapping
• Example: Identify UDP based business critical application dependencies
• Transient dependencies detection
• Example: Threshold based automated backup
• Reduced overhead and TCO
• Example: can be a replacement for setting and maintaining NetFlow for discovery
© Copyright 2012 Hewlett-Packard Development Company, L.P. The information contained herein is subject to change without notice.
HP Diagnostics – Overview and What’s New
© Copyright 2012 Hewlett-Packard Development Company, L.P. The information contained herein is subject to change without notice. 44
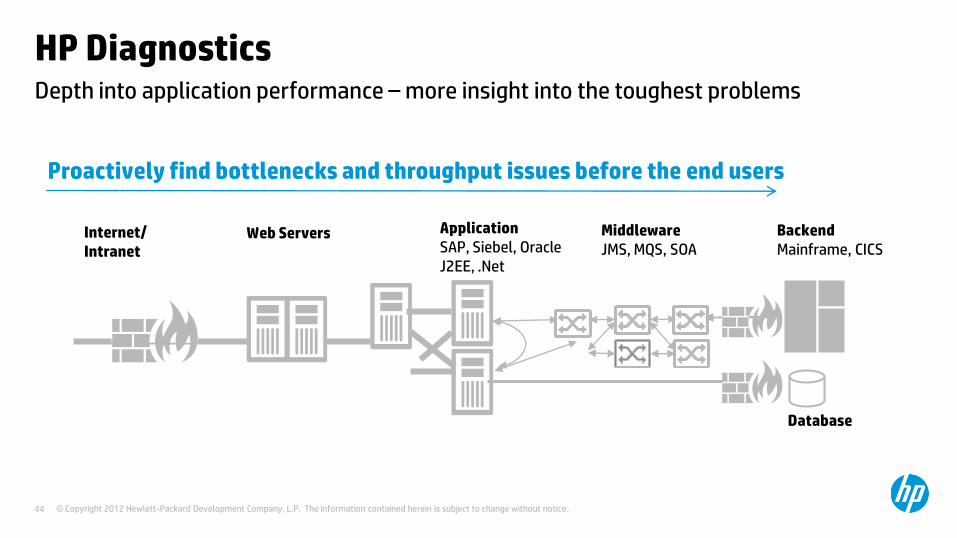
Depth into application performance – more insight into the toughest problems
HP Diagnostics
Internet/ Intranet Firewall
Web Servers Application SAP, Siebel, Oracle J2EE, .Net
Backend Mainframe, CICS
Middleware JMS, MQS, SOA
Database
Proactively find bottlenecks and throughput issues before the end users

© Copyright 2012 Hewlett-Packard Development Company, L.P. The information contained herein is subject to change without notice. 45
Example: HP Diagnostics quickly isolate issues in complex cloud & Mobile environments
HP Diagnostics - Isolate issues in complex hybrid environments
Proactive notification of issue
Transaction topology showing point of issue
Application component details isolating issue to the transaction calls
Root cause of application issue
1 3
4 2

© Copyright 2012 Hewlett-Packard Development Company, L.P. The information contained herein is subject to change without notice. 46
HP Diagnostics give you in-depth details of the application so you can solve issues faster
Unique depth into applications—HP Diagnostics
Simple solution that is easily used by both developers and IT to solve the hardest of application problems
Data monitoring and collection
In-depth isolation Transaction typology
End User Experience Monitoring
Troubleshooting/Isolation and deep dive
Business Impact and SLA
Historical, Sub-component level data
Application flow instances
Thread performance to identify issues
Business Transaction & Service Request Correlation
Root Cause
24x7 stability
Global scalability
Collaborative devops

© Copyright 2012 Hewlett-Packard Development Company, L.P. The information contained herein is subject to change without notice. 47
HP Diagnostics
• Platform Support
• Client Monitoring
• Integration w/BSM Performance Grapher (PMi)
• Java Thread State Analyzer
• Diagnostics Python Agent probe
• Support for OpenStack (Diablo & Essex releases)
• Easier application search within UI
• Improved ease-of-use navigating UI
• Diagnostics tracks licenses by operating system instances now instead of application instances
What’s New

© Copyright 2012 Hewlett-Packard Development Company, L.P. The information contained herein is subject to change without notice. 48
Java 1.7 support is
new!
Platform Support The official HP Diagnostics support matrix – get it!
• http://support.openview.hp.com/sc/support_matrices.jsp#Diagnostics
Diagnostics Server
• Windows 32/64, Linux, HP-UX, Solaris
Java Probe (1.4 thru 1.7)
• HP-UX, AIX, Z/OS, OS/400, Windows 32/64, Linux, Solaris
.NET Probe (2.0 thru 4.0)
• Windows x86 2003-2008 (32/64)
Collectors
• Oracle 10g/11g, SQL Server 2005/2008, Tibco EMS, IBM WebSphere MQ, SAP R/3 NetWeaver, VMWare

© Copyright 2012 Hewlett-Packard Development Company, L.P. The information contained herein is subject to change without notice. 49
Web client monitoring – business case
Business benefits
• Collect end-to-end performance measurements for Web pages direct from users browser.
User story
• Customers want to be able to monitor the actual browsing experience – the mobile revolution has made this need more urgent than before.
What’s new
• Unified view of end-user and back end performance for each URL.
• Captures total, server and client time as experienced by the user.
• Results may be organized by URL, Browser type, or location.

© Copyright 2012 Hewlett-Packard Development Company, L.P. The information contained herein is subject to change without notice. 50
Web Client Monitoring – Supportability Items to Note
.NET-based applications
At this point, .NET applications are not supported. Only Java web applications are supported.
BSM Integration
Unfortunately, this release does not integrate any client monitoring related events into BSM. The impact is that you will only see status of client monitoring health within HP Diagnostics.
Not stand-alone
The client monitoring capability requires that the Java web applications be instrumented with the HP Diagnostics Java probe. “Client monitoring” only use-cases are not supported.
Automatic instrumentation
Diagnostics can automatically instrument Tomcat, JBoss, WebLogic and WebSphere JSPs. All you need to do is deploy a single .war file ”ClientMonitoring.war”.

© Copyright 2012 Hewlett-Packard Development Company, L.P. The information contained herein is subject to change without notice. 51
Web Client Monitoring in HP Diagnostics - URL

© Copyright 2012 Hewlett-Packard Development Company, L.P. The information contained herein is subject to change without notice. 52
Web Client Monitoring in HP Diagnostics - Browser

© Copyright 2012 Hewlett-Packard Development Company, L.P. The information contained herein is subject to change without notice. 53
Web Client Monitoring in HP Diagnostics - Location

© Copyright 2012 Hewlett-Packard Development Company, L.P. The information contained herein is subject to change without notice.
Diagnostics – Client Monitoring Demo On your laptop, smart phone, IPAD, or other mobile device – bring up: http://tinyurl.com/DiagPetClinicHPCS Find Owner – Simanaitis and / or Add New Owner

© Copyright 2012 Hewlett-Packard Development Company, L.P. The information contained herein is subject to change without notice. 55
New Features
HP Diagnostics Data source support • Host, .Net and J2EE Probe
SaaS Support • Templates available to all customers
Performance & Usability Improvements • RTSM performance/improved UI
OMi Decoupling • OMi license not required

© Copyright 2012 Hewlett-Packard Development Company, L.P. The information contained herein is subject to change without notice. 56
Diagnostics data source support
BSM Grapher (PMi)
• Visualize data from Host, .Net and J2EE Probe metrics
• Cross-domain analysis of performance bottlenecks
• Correlate Diagnostics data with Agent/SiS/EUM data
• Top-down approach to performance troubleshooting
• Faster root cause analysis
• Data retrieved from Time-Series DB • OpalRegistrationClient API

© Copyright 2012 Hewlett-Packard Development Company, L.P. The information contained herein is subject to change without notice. 57
Java Thread State Analyzer – Business Case Business benefits
• Reduced MTTR.
• Isolate thread issues visually without having to compare thread stack traces over time by hand.
User story
• Diagnostics has Thread monitoring in the Profiler and can capture Stack Traces over time but the job to isolate issues still takes too much time.
What’s new
• New visualizer of Java Thread States over time – find threading issues fast!
• Visualize state distribution (%) by thread : states include - Deadlocked, Blocked, Running, I/O, Sleeping, Waiting, Starving, Unknown.
• Adjustable sampling interval, history length, and stack trace depth.

© Copyright 2012 Hewlett-Packard Development Company, L.P. The information contained herein is subject to change without notice. 58
Manual Examination of Stack Traces is Exhausting
Examining every stack trace to determine the state of each thread will get very tedious (this example had 55 threads)!

© Copyright 2012 Hewlett-Packard Development Company, L.P. The information contained herein is subject to change without notice. 59
Java Thread State Analyzer
• Visualize Java Thread States over time – find thread issues faster! Save hours of time!
• Visualize state distribution (%) by thread where states include - Deadlocked, Blocked, Running, I/O, Sleeping, Waiting, Starving, Unknown.
• Adjustable sampling interval, history length, and stack trace depth
Thread
Method and Line Number
Thread State over time
Clear situation of I/O resource contention

© Copyright 2012 Hewlett-Packard Development Company, L.P. The information contained herein is subject to change without notice. 60
HP Diagnostics now monitors Python & OpenStack!
• Python Probe for deep dive diagnostics monitoring of Python-based applications
– Quick isolation of performance problems for Python based applications
– Supports Python application servers for monitoring for standard HP Diagnostics capabilities
– Supports Python code snippet capability for custom instrumentation
• OpenStack Instrumentation
– OpenStack monitoring including the collection of transactions and SQL statements
Example: Openstack Topology
OpenStack Probes
Probe Details

© Copyright 2012 Hewlett-Packard Development Company, L.P. The information contained herein is subject to change without notice.
Questions?

© Copyright 2012 Hewlett-Packard Development Company, L.P. The information contained herein is subject to change without notice. HP Restricted.
Thank you