
HOW WE VOTED IN 2020 - MIT Election Lab
36
HOW WE VOTED IN 2020 A TOPICAL LOOK AT THE SURVEY OF THE PERFORMANCE OF AMERICAN ELECTIONS Charles Stewart III
Transcript of HOW WE VOTED IN 2020 - MIT Election Lab

HOW WE VOTED IN 2020A TOPICAL LOOK AT THE SURVEY OF THE PERFORMANCE OF AMERICAN ELECTIONS
Charles Stewart III

Acknowledgements
Charles Stewart III is the Kenan Sahin Distinguished Professor of Political Science and the Director of the MIT Election Data and Science Lab. Jesse Clark, Jacob Jaffe, and An-nie Kang were integral in bringing this report to life. The 2020 Survey of the Performance of American Elections and this report were made possible in part by the gracious support of the Democracy Fund.
About this report
The findings, interpretations, and conclustions expressed in this report do not necessarily represent the views or opinions of the Massachusetts Institute of Technology.
The MIT Election Data & Science Lab encourages dissemination of knowledge and re-search; this report may be reproduced in whole or in part for non-commercial or educa-tional purposes so long as full attribution to its authors is given.

EXECUTIVE SUMMARY
iii
» Voters who cast ballots in person and by mail continued to express high levels of satisfaction with the process, as in past years.
» Only about half of the ballots that were mailed to voters were returned by mail. Twenty-two percent of mail ballots were returned to drop boxes. In the long-standing vote-by-mail states of Colorado, Oregon, and Washington, 60 percent were returned to drop boxes.
» Worry about COVID was the top reason cited for voting by mail.
» Sixty percent of mail voters stated that it was “very likely” they would vote by mail again, 65 percent of Democrats and 49 percent of Republicans.
» The use of schools declined as an in-per-son polling place, with community cen-ters rising in use.
» Fifty-nine percent of in-person voters were “very confident” that the public health measures in their polling place would protect against catching COVID.
» Eighty-seven percent of in-person vot-ers report seeing poll workers wearing masks.
» Average wait times to vote increased for all modes of in-person voting, and in most states.
» Measured across all voters, confidence that votes were counted as intended re-mained similar to past years. However, significant partisan gaps opened up.
» Among Republicans, lack of confidence in whether votes were counted as in-tended at the state level was strongly
EXECUTIVE SUMMARY
The Survey of the Performance of Ameri-can Elections (SPAE) provides information about how Americans experience to voting in the most recent federal election. Con-ducted in every presidential election since 2008, the SPAE is the only national survey of election administration that focuses on the process of voting, and provides insights into the performance of elections in the in-dividual states.
In 2020, 18,200 registered voters respond-ed to the survey, which was administered by YouGov. Two hundred respondents each were interviewed in 40 states plus the Dis-trict of Columbia. 1000 additional inter-views were conducted in the states of Ar-izona, Florida, Georgia, Iowa, Michigan, Nevada, North Carolina, Ohio, Pennsyl-vania, and Wisconsin. The 2020 SPAE was supported, in part, through the generosity of the Democracy Fund.
Among the findings discussed in this re-port as the following:
» The percentage of voters casting ballots by mail grew to 46 percent, more than doubling the fraction from 2016. The share of voters casting ballots on Elec-tion Day fell to 28 percent, from 60 per-cent in 2016.
» Sixty percent of Democrats, compared to 32 percent of Republicans, reported voting by mail.

How we voted in 2020
iv
correlated with whether Donald Trump won the respondent’s state and with the fraction of votes cast by mail in the state.
» Partisan attitudes about the prevalence of several types of voter fraud became more polarized in 2020, particularly at-titudes about absentee ballot fraud.
» Attitudes around reform—both over-all support and partisan divisions—re-mained similar to past years. Partisan divisions most notably opened up fur-ther on the issue of voting by mail.
» Requiring electronic voting machines to have paper backups, automatical-ly changing registrations when voters move, requiring election officials to be nonpartisan, declaring Election Day a holiday, and requiring voters to show a photo ID to vote were supported by ma-jorities of both Democrats and Repub-licans.
» Adopting automatic voter registration, election-day registration, and moving elections to weekends are supported by a majority of voters, but not by a major-ity of Republicans.
About the Survey of the performance of american electionsThe Survey of the Performance of American Elections (SPAE) provides information about how Americans experience to voting in the most recent federal election. Conducted in every presidential election since 2008, the SPAE is the only national survey of election administration that focuses on the process of voting, and provides insights into the performance of elections in the individual states.
In 2020, 18,200 registered voters responded to the survey, which was administered by YouGov. Two hundred respondents each were interviewed in 40 states plus the District of Columbia. One thou-sand additional interviews were conducted in the states of Arizona, Florida, Georgia, Iowa, Michigan, Nevada, North Carolina, Ohio, Pennsylvania, and Wisconsin. The 2020 SPAE was supported, in part, through the generosity of the De-mocracy Fund.
This document provides a look into some of the findings from the survey. More information, includ-ing the questionnaire and data, may be downloaded at the Har-vard Dataverse: https://dataverse.harvard.edu/dataverse/SPAE.

5
CONTENTS
Executive Summary iii
Voting by Mail 6
Voting in person 15
Confidence in the election 21
Fraud 29
Reform 32
Conclusion 34
How we voted in 2020
6
VOTING BY MAIL
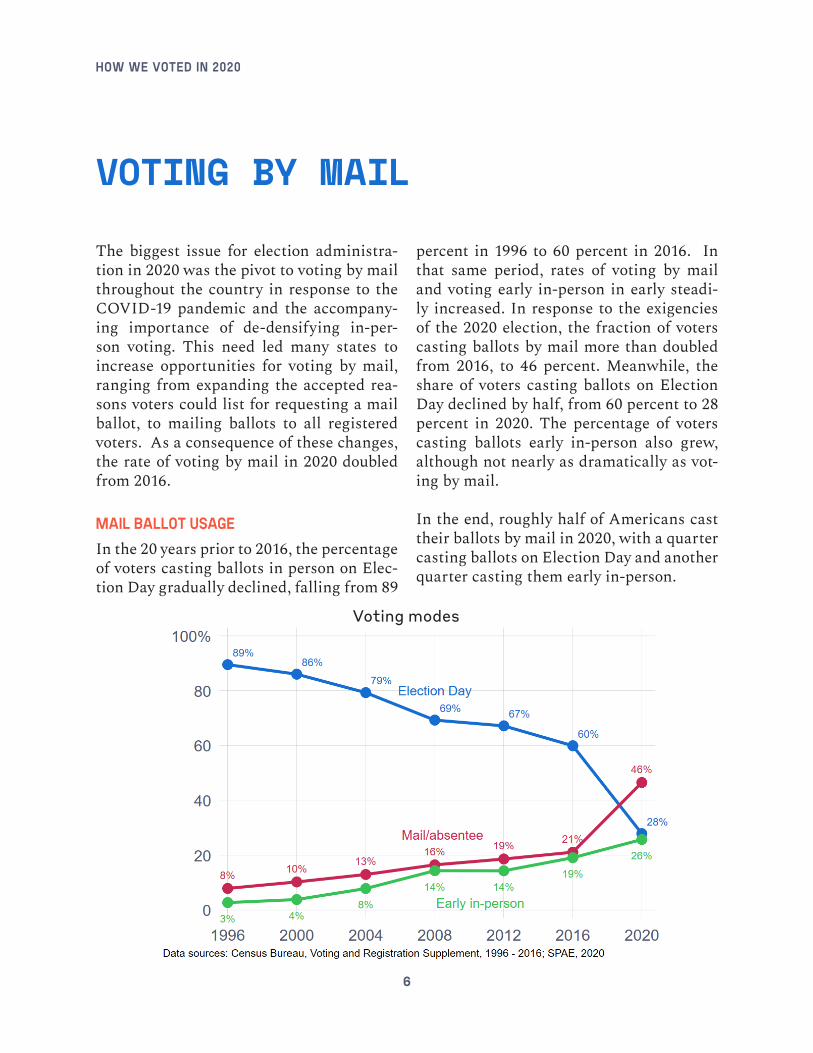
The biggest issue for election administra-tion in 2020 was the pivot to voting by mail throughout the country in response to the COVID-19 pandemic and the accompany-ing importance of de-densifying in-per-son voting. This need led many states to increase opportunities for voting by mail, ranging from expanding the accepted rea-sons voters could list for requesting a mail ballot, to mailing ballots to all registered voters. As a consequence of these changes, the rate of voting by mail in 2020 doubled from 2016.
Mail ballot usageIn the 20 years prior to 2016, the percentage of voters casting ballots in person on Elec-tion Day gradually declined, falling from 89
percent in 1996 to 60 percent in 2016. In that same period, rates of voting by mail and voting early in-person in early steadi-ly increased. In response to the exigencies of the 2020 election, the fraction of voters casting ballots by mail more than doubled from 2016, to 46 percent. Meanwhile, the share of voters casting ballots on Election Day declined by half, from 60 percent to 28 percent in 2020. The percentage of voters casting ballots early in-person also grew, although not nearly as dramatically as vot-ing by mail.
In the end, roughly half of Americans cast their ballots by mail in 2020, with a quarter casting ballots on Election Day and another quarter casting them early in-person.
Voting modes

VOTING BY MAIL
7
The transition from voting in-person to voting by mail proceeded at different pac-es across the states. As the following graph shows, however, every state saw at least
AL
AR
AZCA
CODC
FL
GA
HI
IA
ID
IL
IN
KS
KY
LA
MD
MEMI
MN
MO
MS
NC
ND
NE
NH
NJ
NMNV
NY
OH
OK
PA
SD
TN
TX
VAVT
WA
WV
WY
OR
AK
CT
MT
RI
WI
MA
UT
DE
SC
0 20 40 60 80
100%
100%
80
60
40
20
0
0
20
40
60
80
100%
Mail predominates Early in-person predominates
Election Day predominates
More Election Day voting
More in-person early voting
Mor
e m
ail v
otin
g
some increase in voting by mail, and in-deed, all saw a decline in the percentage of their voters who cast ballots on Election Day.1
1 1 This is called a triplot graph or ternary plot. Voters in states at the very top of the triangle all cast their ballots on Election Day. Voters in states at the lower left corner all cast their ballots by mail. Voters in states in the lower right-hand corner all cast their ballots early in-person. States won by Donald Trump are indicated with red squares. State won by Joe Biden are indicated with blue circles. The data tokens indi-cate the mix of voting modes in the 2020 election. The gray lines attached to the data tokens start where the state was located in 2016. The downward path of all states reflects the fact that all states saw a decline in Election Day voting. The general shift of the data cloud to the southwest is indicative of the general drift toward mail balloting in 2020. Note that data from 2016 were taken from the U.S. Census Bureau, Current Population Survey, Voting and Registration Supplement.

How we voted in 2020
8
Another way to visualize the shift to voting by mail is to consider the issue geograph-ically. Prior to 2020, most voters casting their ballots by mail were in Western states. In 2020, however the percentage of voters casting ballots by mail grew significantly throughout the country. While voting by mail still predominates in the West, it also
caught on in the upper Midwest and along the eastern seaboard. The one part of the country that did not see such a dramatic increase in voting by mail — although it did see some degree of increase — is the south-central part of the country, ranging from Texas up to Missouri and over to Ten-nessee.
Use of mail ballots, 2016
Use of mail ballots, 2020

VOTING BY MAIL
9
One last way to look at the vote by mail shift is to consider the data along political party lines. President Trump criticized vot-ing by mail as being prone to fraud, which increasingly led Republican voters to re-gard it with suspicion. On the other hand, Democratic activists and voters were more likely to embrace the opportunity to vote by mail, either because of political reasons or out of a desire to manage voting safely during the pandemic. Whatever the reason for these differences in the approach to vot-ing by mail, the fact is that Democrats and Republicans used the mail at significantly different rates in 2020.
As the following graph shows, between 2008 and 2016 Democrats were slightly more likely to vote by mail than Republi-
cans. However, this difference is primari-ly an artifact of which states had chosen to conduct their elections entirely by mail.
Looking at 2020, the partisan difference in voting by mail increased substantially. The proportion of Democrats voting by mail more than doubled, while the proportion of Republicans using vote-by-mail increased by “only” 50 percent compared to 2016. In total, 60 percent of Democrats cast their ballots by mail in 2020, compared to only 32 percent of Republicans.
Voting by mail, by party
How we voted in 2020
10
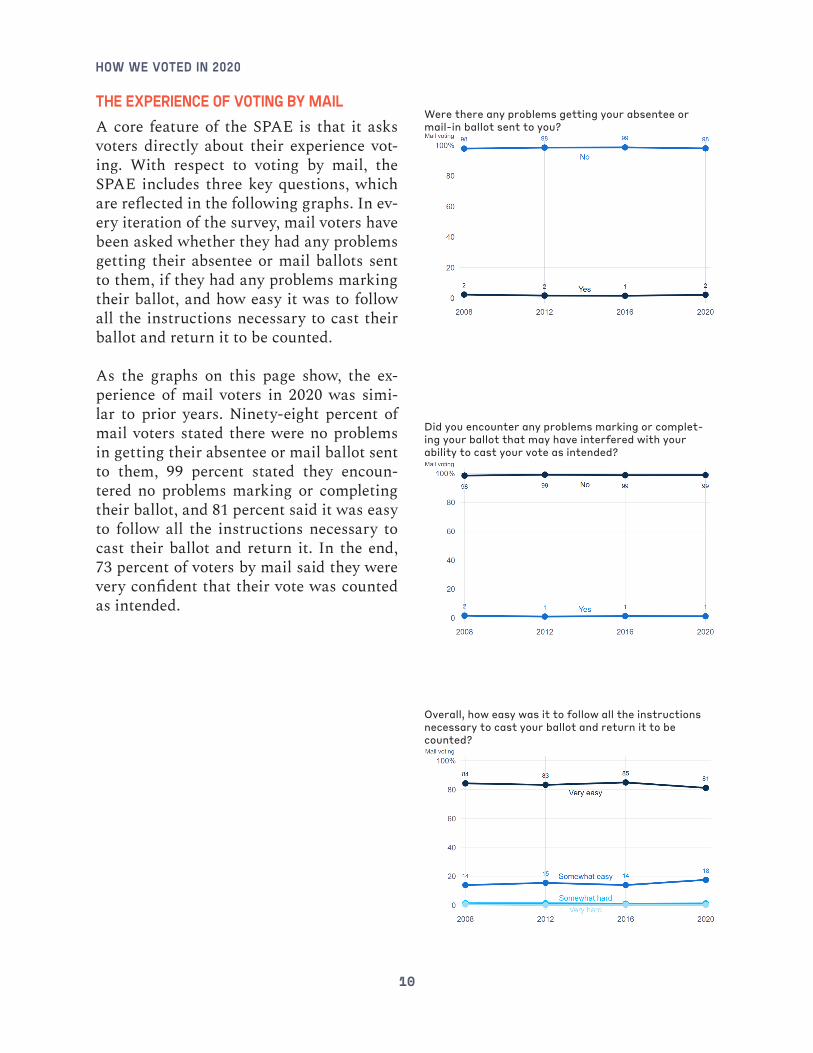
The experience of voting by mailA core feature of the SPAE is that it asks voters directly about their experience vot-ing. With respect to voting by mail, the SPAE includes three key questions, which are reflected in the following graphs. In ev-ery iteration of the survey, mail voters have been asked whether they had any problems getting their absentee or mail ballots sent to them, if they had any problems marking their ballot, and how easy it was to follow all the instructions necessary to cast their ballot and return it to be counted.
As the graphs on this page show, the ex-perience of mail voters in 2020 was simi-lar to prior years. Ninety-eight percent of mail voters stated there were no problems in getting their absentee or mail ballot sent to them, 99 percent stated they encoun-tered no problems marking or completing their ballot, and 81 percent said it was easy to follow all the instructions necessary to cast their ballot and return it. In the end, 73 percent of voters by mail said they were very confident that their vote was counted as intended.
Were there any problems getting your absentee or mail-in ballot sent to you?
Did you encounter any problems marking or complet-ing your ballot that may have interfered with your ability to cast your vote as intended?
Overall, how easy was it to follow all the instructions necessary to cast your ballot and return it to be counted?

VOTING BY MAIL
11
Returning mail ballotsAn important issue that arose in the months leading up to the general election was how best to return mail ballots. Historically, experience in vote-by-mail states had sug-gested that the most secure and convenient way for voters to return their mail ballots was through drop boxes provided by the election authority. In addition, controversy arose over the capacity of the United States Postal Service to deliver mail ballots in time to be counted in November. Election administrators responded by expanding op-portunities to return ballots through modes other than the mail, and voters took them up on those opportunities.
As the accompanying graph shows, nearly half the mail ballots 2020 were returned in person, down from 2016 when two-thirds of all mail ballots were returned through the Postal Service. Instead of mailing their ballots in 2020, voters were more likely to return their mail ballots through drop box-es, to election offices, and to polling places themselves. In the case of drop boxes par-ticularly, the percentage of mail ballots re-turned to them rose from 16 percent in 2016 to 22 percent in 2020.
Of course, most of the country was new to the experience of voting by mail. It is in-structive to compare how voters returned their ballots in the more long-standing vote-by-mail states of Colorado, Oregon, and Washington to the rest of the nation; the next two graphs show how voters in those three states returned their ballots compared to voters in the other states and D.C.
How mail ballots were returned

How we voted in 2020
12
In the more established vote-by-mail states, the percentage of voters returning ballots through drop boxes did increase, jumping from roughly half in 2016 to three-fifths in 2020, while the fraction of voters returning their ballots by mail fell from a third to a quarter.
Changes were even more dramatic in the states that were newer to voting by mail. The fraction of voters returning their bal-
lots by mail in these states plummeted from 77 percent in 2016 to 55 percent in 2020. Returns to all three alternative methods in-creased, but the increased reliance on drop boxes was particularly pronounced. The percentage of voters in these states who re-turned their ballots by mail increased five-fold, from 4 percent in 2016 to 19 percent in 2020.
How mail ballots were returned (CO, OR, & WA)
How mail ballots were returned (excluding CO, OR, & WA)

VOTING BY MAIL
13
COVID-19 and the choice of voting by mailA major justification for expanding mail-ballot opportunities in 2020 was that it would reduce the density of people at in-person polling places and provide a way to reassure those who feared contracting COVID-19 by being in crowds.
Respondents who voted by mail were asked to select the statement that most closely de-scribed why they voted by mail or absentee. The modal response, chosen by 30.5 percent of respondents was “I was worried about the COVID-19 virus.” This was followed by “I have signed up to receive a mail or absentee ballot automatically in each election” (21.4 percent) and “Voting by mail or absentee was just more convenient for me this elec-tion” (20.9 percent). In contrast, the modal
response in 2016 was “I have signed up to receive a mail or absentee ballot automat-ically in each election” (30.5 percent) and voting by mail was more convenient (28.4 percent).
Among those who reported that they typi-cally voted in person, nearly half (47.7 per-cent) stated they voted by mail because of worries about the COVID-19 virus, com-pared to only 14.3 percent of typical mail voters. Among those very worried about catching COVID-19, 46.8 percent stated they voted by mail because of worries about COVID, compared to 28.5 percent who said they were “somewhat worried,” 12.2 per-cent who said they were “not too worried,” and 5.3 percent who reported they were “not worried at all.”
REASON VOTED BY MAIL 2016 2020
COVID worry – 30.5%
On permanent list 30.5% 21.4%
Mail more convenient 28.4% 20.9%
Only has vote-by-mail 14.8% 10.9%
Disability 9.4% 6.7%
Other 3.0% 3.5%
Out of town 6.7% 2.9%
Work/school conflict 4.6% 1.9%
Election official/poll worker 2.3% 0.9%
Armed forces 0.3% 0.2%
Religious observances 0.0% 0.2%

How we voted in 2020
14
The future of voting by mailWhy voters chose to vote by mail in 2020 and whether they will in the future are im-portant topics for election administration. Respondents to the SPAE who voted by mail were asked whether they typically had voted by mail in the past and whether they would vote by mail again. Among all mail voters, roughly half said they had voted by mail before, with Republicans being slight-ly more likely to be experienced mail voters than Democrats.
On the issue of voting by mail in the fu-ture, 60 percent of all mail voters in 2020 said they were very likely to vote by mail in the future, while 21 percent said they were somewhat likely. Democrats were much more likely to say they were they would vote by mail the future, compared to Republi-cans. These results suggest that the shift to voting by mail in 2020 will have perma-nent repercussions for the administration of elections in the US, but there may still be a slight decline in mail voting in the near future.
Typically voted by mail before?
Will vote by mail again
All mail voters 51% yes 60% very likesly21% somewhat likely
Democrats 49% yes 65% very likely23% somewhat likely
Republicans 57% yes 49% very likely19% somewhat likely

VOTING IN PERSON
15
Although the most notable issue in election administration in 2020 was the expansion of voting by mail, voting in-person was equally important. Roughly half of U.S. vot-ers ended up voting in-person; of those, half voted on Election Day, and the other half during the early voting period.
The challenge of voting in-person in 2020 can be split into three categories: people, places, and things. That is, responding to the demand for voting in-person was strained by the potential lack of poll work-ers, polling places, and provisions neces-sary to carry out voting. If voting by mail had not been so successful, the in-person voting system would have been under a perhaps-insurmountable strain. In the end, voters who cast their ballots in-person re-ported that their experiences were very similar to in-person voters in the past.
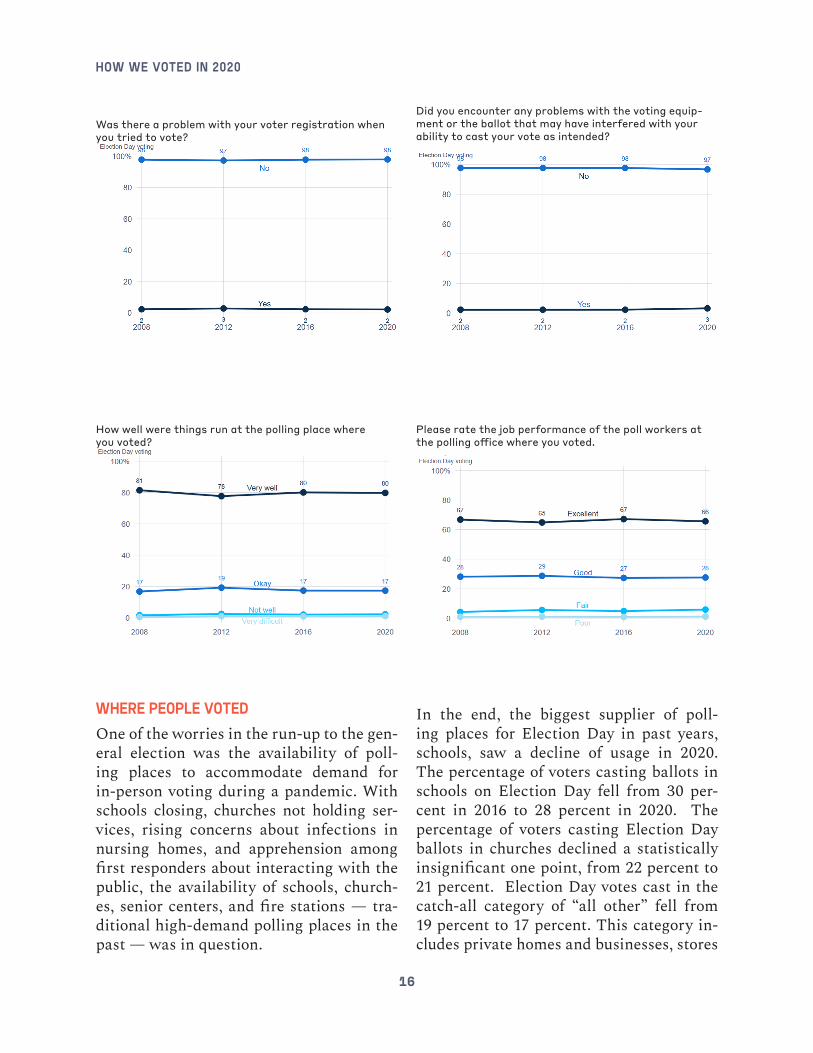
The in-person voting experienceThe SPAE asks in-person voters about prob-lems they had with voter registration and voting equipment, how well things were run the polling place, and the job perfor-mance of poll workers. As with mail vot-ing, in-person voters reported very similar, and overall positive, experiences to past years. Among those who voted on Election Day, for instance, 98 percent said they had no problems with registration when they tried to vote, 97 percent did not encounter any problems with the voting equipment, 80 percent said the polling place was very well-run, and 66 percent said the perfor-
VOTING IN PERSON
mance of the poll workers at the polling place was excellent. These statistics are vir-tually identical to the past three presiden-tial elections.
In addition, 58 percent of the Election Day voters said that they were very confident that their ballot was counted as intended, with another 28 percent saying they were somewhat confident. The percentage of Election Day voters who were very confi-dent that their vote was counted as intend-ed was down quite a bit from 2016, and is in distinct contrast with the increased con-fidence among those who voted by mail. As we will see below, this may largely be due to differences in the partisan composition of the in-person and vote by mail electorates.
How we voted in 2020
16
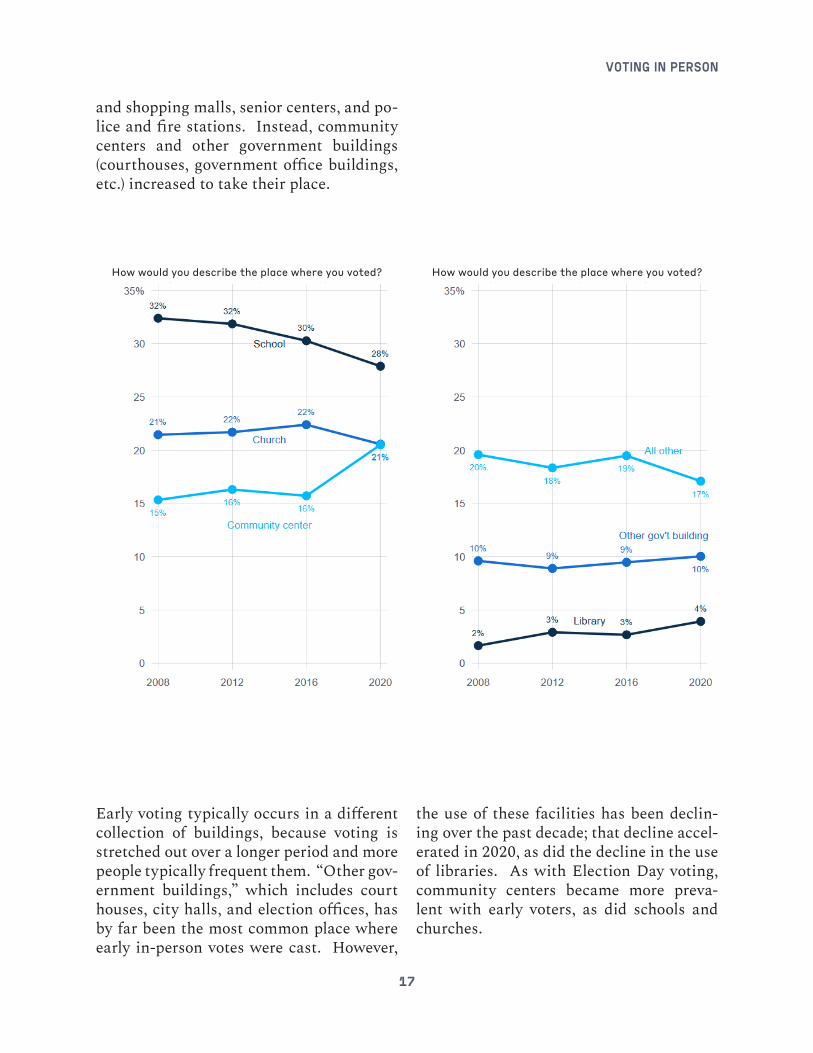
Where people votedOne of the worries in the run-up to the gen-eral election was the availability of poll-ing places to accommodate demand for in-person voting during a pandemic. With schools closing, churches not holding ser-vices, rising concerns about infections in nursing homes, and apprehension among first responders about interacting with the public, the availability of schools, church-es, senior centers, and fire stations — tra-ditional high-demand polling places in the past — was in question.
In the end, the biggest supplier of poll-ing places for Election Day in past years, schools, saw a decline of usage in 2020. The percentage of voters casting ballots in schools on Election Day fell from 30 per-cent in 2016 to 28 percent in 2020. The percentage of voters casting Election Day ballots in churches declined a statistically insignificant one point, from 22 percent to 21 percent. Election Day votes cast in the catch-all category of “all other” fell from 19 percent to 17 percent. This category in-cludes private homes and businesses, stores
Was there a problem with your voter registration when you tried to vote?
Did you encounter any problems with the voting equip-ment or the ballot that may have interfered with your ability to cast your vote as intended?
How well were things run at the polling place where you voted?
Please rate the job performance of the poll workers at the polling office where you voted.
VOTING IN PERSON
17
and shopping malls, senior centers, and po-lice and fire stations. Instead, community centers and other government buildings (courthouses, government office buildings, etc.) increased to take their place.
Early voting typically occurs in a different collection of buildings, because voting is stretched out over a longer period and more people typically frequent them. “Other gov-ernment buildings,” which includes court houses, city halls, and election offices, has by far been the most common place where early in-person votes were cast. However,
the use of these facilities has been declin-ing over the past decade; that decline accel-erated in 2020, as did the decline in the use of libraries. As with Election Day voting, community centers became more preva-lent with early voters, as did schools and churches.
How would you describe the place where you voted? How would you describe the place where you voted?

How we voted in 2020
18
One of the most publicly visible types of polling places in 2020 was sports arenas. NBA teams, baseball teams, and other ma-jor sporting leagues made their facilities available to election officials. These were high-visibility locations, but they did not accommodate many voters overall. Only six-tenths of 1 percent of in-person voters—combining both Election Day and early vot-ers—reported that they voted in a sports arena. This is four-tenths of 1 percent of Election Day voters, and eight-tenths of 1 percent of early voters. Of course, large sporting arenas are not available every-where, and are concentrated in large urban areas. Looking at only the counties in which voters reported voting in arenas (i.e., con-fining ourselves to counties that may have had sports arenas available), 3.5 percent of in-person voters in these counties reported
casting a ballot in a sports arena — 3.0 per-cent of Election Day voters and 3.9 percent of early voters.
Health precautions in polling placesOf course, the big issue in maintaining in-person voting sites was the susceptibili-ty of voters and poll workers to catching the COVID-19 virus while in the polling place. Election officials placed a premium on en-suring that in-person polling sites were safe for voters and poll workers alike. In-person voters on the whole reported that they felt safe when they voted in-person. Fifty-nine percent stated that they were very confident that the layout of the polling place they vot-ed in protected them from being infected with COVID 19, while another 30 percent were somewhat confident.
How would you describe the place where you voted? How would you describe the place where you voted?

VOTING IN PERSON
19
Very confident 59%
Somewhat confident 30%
Not too confident 5%
Not at all confident 2%
I don't know 4%
In-person voters were asked to report on the various health-related activities they noticed when they voted. These voters most commonly reported that they saw poll workers wearing masks, followed by the use of hand sanitizer. Less commonly noted were poll workers with face shields, barriers between voting booths, voting booths be-ing cleaned between voters, and single-use pens to mark ballots.
Connecting these two pieces of information together, based on multivariate statistical analysis, it appears that the availability of hand sanitizers and the cleaning of voting booths between voter contributed the most to voters feeling that polling places were safe from pandemic infection.
Wait times to voteBecause of the reduced capacity of polling places, the reduced number of polling plac-es, and the longer service times due to so-cial distancing, it was anticipated that wait times would be longer during in-person voting, even though the demand on in-per-son facilities would be less. And in fact, the SPAE data bear this out. Wait times to vote in 2020 were much greater in 2020 than in 2016. As with the past three pres-idential elections, early voting wait times were much greater than Election Day wait times — 22 percent of early voters report-ed waiting longer than 30 minutes for early voting compared to 14 percent for Election Day voters. However, it is interesting to note that the percentage of people waiting more than 30 minutes to vote was on par with that statistic for the election of 2008. In other words, although average wait times were longer than the past two elections, they were no worse (within statistical con-fidence) than has been observed over the past four presidential elections.
Did you see any of the following in the polling place where you voted? (Check all that apply)

How we voted in 2020
20
The increase in wait times for in-person vot-ers was not uniformly distributed through-out the United States. As a general matter, wait times were the longest in the eastern part of the country.
Approximately, how long did you have to wait in line to vote?Those waiting more than 30 minutes
2016 2020

CONFIDENCE IN THE ELECTION
21
CONFIDENCE IN THE ELECTION
With all of the discord over the postelection period, there is been renewed attention to con-fidence in the electoral process and confidence in our democracy. The SPAE asks a series of questions that takes a very focused approach to the issue of confidence. It asks whether voters were confident that their vote was counted as intended. In addition, it asks all respondents, whether they voted or not, if they were confi-
dent that votes in their city, county, and nation-wide were counted as intended. The general pattern of responses in 2020 was similar to that of past years. Respondents were the most confident that their own vote was counted as intended, less confident that votes in their county were counted as intended, slightly less confident about votes in the state, and the least confident about votes nationwide.
How confident are you that votes [at level] were counted as intended?
How we voted in 2020
22
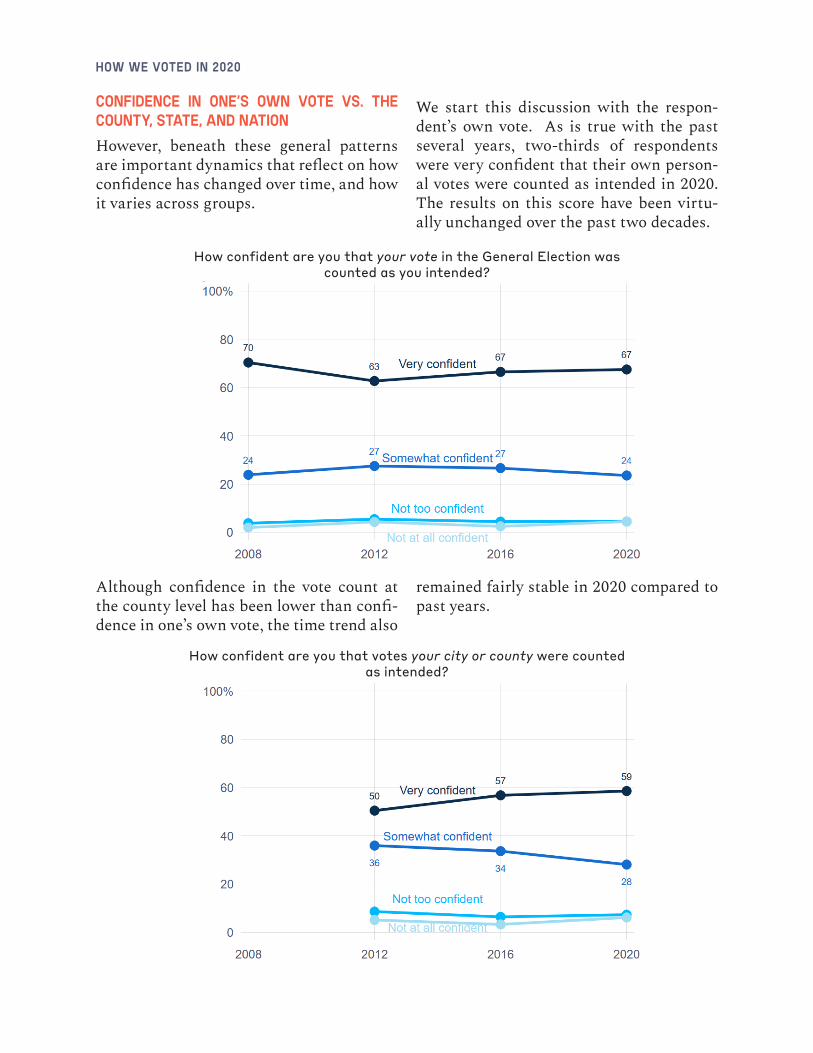
Confidence in one’s own vote vs. the county, state, and nationHowever, beneath these general patterns are important dynamics that reflect on how confidence has changed over time, and how it varies across groups.
We start this discussion with the respon-dent’s own vote. As is true with the past several years, two-thirds of respondents were very confident that their own person-al votes were counted as intended in 2020. The results on this score have been virtu-ally unchanged over the past two decades.
Although confidence in the vote count at the county level has been lower than confi-dence in one’s own vote, the time trend also
remained fairly stable in 2020 compared to past years.
How confident are you that your vote in the General Election was counted as you intended?
How confident are you that votes your city or county were counted as intended?

CONFIDENCE IN THE ELECTION
23
It is in asking about confidence that votes in the state were counted as intended where the movement in the time trend becomes apparent. Confidence that votes were counted as intended softened in 2020 when respondents were asked about their state. The percentage of voters who were very
confident actually rose, but the percentage of those who were somewhat confident fell significantly, from 38 percent to 29 percent. In addition, the percentage of respondents who answered “not at all confident” dou-bled, rising from 5 percent to 10 percent.
Respondents’ answers to the questions about confidence in votes nationwide most clearly reflect the political polarization on the issue. Both the percentage of respon-dents saying they were very confident that votes were counted as intended nationwide and the percentage reporting that they were not confident at all rose from 2016. The “very confident” rose from 29 percent to 38 percent, and the “not-at-all confident” also rose, from 9 percent to 26 percent. At the same time, the two middle categories – of those who were somewhat confident or not too confident – fell. The fraction answering “somewhat confident” fell from 44 percent to 23 percent while the fraction answering “not too confident” fell from 18 percent to 13 percent.
How confident are you that votes your state were counted as intended?

How we voted in 2020
24
Partisan polarization of confidence in state and nationThis pattern is a product of the fact that confidence in the nationwide vote count became highly polarized along partisan lines. In 2016, Democrats and Republicans were fairly similar in their responses to this
question, with Republicans being slightly more confident. In 2020, confidence among Democrats rose from 69 percent to 93 per-cent, while the percentage of Republicans who were either very or somewhat confi-dent in the nationwide vote count fell from 83 percent to 22 percent.
How confident are you that votes nationwide were counted as voters intended?
How confident are you that votes nationwide were counted as voters intended? (Very or somewhat confident)

CONFIDENCE IN THE ELECTION
25
Of particular interest here is confidence about vote counting in the states. It is the states, after all, that administer elections, and that therefore bear the brunt of contro-versy in close and contested elections.
Upon first inspection, the polarization be-tween the two parties seen in responses to the question about votes nationwide was not as great when we asked about the state
vote count. Democrats and Republicans were more polarized on the state question in 2020 than in 2016, when they gave vir-tually identical answers, and even more polarized than in 2012, when 92 percent of Democrats and 74 percent of Republicans stated they were very or somewhat confi-dent. But, the gap between the parties was not the yawning 71-point gap we saw when we asked about votes nationwide.
However, the gap between Democrats and Republicans opens up in some states levels that rival what we see on the “nationwide” question. We begin to see this in the graph on the following page, which shows the per-centage of Democrats and Republicans who answered they were either “very” or “some-what” confident that votes in their state were counted as intended. The variability of Democrats across the states was relative-ly meagre compared to the variability of Republicans. The gap between Democrats in some states, notably Michigan and Penn-sylvania, was as great as the gap in confi-dence in the nationwide vote count. As a
general matter, this graph highlights that Republican lack of confidence was great-est in the battleground states that Trump barely lost—Michigan, Pennsylvania, Wis-consin, Nevada, and Georgia—plus perhaps in non-battleground states that mailed bal-lots to all voters (note New Jersey, Oregon, Washington, Colorado, and California).
In particular, respondents in closely con-tested states were much less confident in their state’s vote count than those in states where one of the candidates won in a land-slide. Regardless of whether their candi-date won or lost their state, Democrats on
How confident are you that votes in your state were counted as vot-ers intended? (Very or somewhat confident)

How we voted in 2020
26
average were more confident in state vote counts than Republicans.
The next two graphs show in another way the inter-relatedness of the closeness of the election in a state, partisanship, and mail-ballot usage and their influence on confidence. Each graph treats Democrats and Republicans in each state separately. The y-axis is the percentage of partisans who stated they were either very or some-what confident that votes were counted as cast in their state. In each graph, the solid squares show the data for states in which more than half of voters cast ballots by mail; the hollow squares show the data for states in which less than half the voters cast ballot by mail. Finally, the lines show the least-square fits to the data. We have broken the lines at the 50 percent Trump vote-share mark, which allows us to explore the influence of closeness of the election in a state to confidence.
In the left-hand graph, note that the least confident Republicans lived in the states that Trump barely lost. Among states that Trump won, Republicans were also less con-fident as his vote share approached 50 per-cent, but the effect of Trump vote share on confidence (as measured by the slope of the regression lines) was much less pronounced than in the states that Trump lost. Second, note that among the states that Trump lost, Republicans were less confident in states where most ballots were cast by mail than in the other states.
(This is measured by the distance between the solid and dashed line.) The vertical dis-tance between those two lines is approxi-mately ten percentage points.
In the right-hand graph, we see again that Democrats were more confident than Re-publicans in almost all states. Further-more, while Democrats in states that Trump barely won were slightly less confident than
Percentage of Democrats and Republicans answering very or somewhat confident to state confidence question

CONFIDENCE IN THE ELECTION
27
Democrats in states that Trump won hand-ily, this effect is nowhere close to what we see in the Republican graph. (In fact, the slope of the line is not statistically different from zero at the traditional 95 percent con-fidence level.)
Polarization over confidence in 2016If we were to perform this analysis on elec-tion returns from prior years, we would see similar patterns between Democrats and Republicans depending on how close the election was in a state, but the differences would not be so stark. Here, for compari-
son, we show the same analysis using the 2016 SPAE results.
The graph below shows the percentage of Democrats and Republicans reporting they were either very or somewhat confi-dent that votes were counted as intended in their state in the 2016 election. The states are sorted according to the difference be-tween average Democratic and Republican responses. Unlike 2020, where Democrats were more confident in almost every state than Republicans, in 2016 Democrats were more confident in some states and Republi-cans in others.
Average confidence that votes were counted as intended in statePercent answering very of somewhat confident among Republicans
Average confidence that votes were counted as intended in statePercent answering very of somewhat confident among Democrats
Percentage of Democrats and Republicans answering very or somewhat confident to state confidence question
2016 Election

How we voted in 2020
28
The following two graphs display aver-age state-level confidence for both parties plotted against Trump’s percentage of the two-party vote. (Here, we have not distin-guished states according to their usage of absentee ballots because there is no sta-
tistical difference in confidence for either party based on mail-ballot usage.) On the Republican side, confidence is simply a lin-ear function of how well Trump did in the state. The break at the 50 percent point is very small and statistically insignificant.
On the Democratic side, there is the pres-ence of the “winners-losers effect,” where-by Democrats in states that Trump barely won were more confident than in states that Trump won comfortably. Among states that Trump lost, there is no correla-tion between how well Trump did and the confidence of Democrats. In this sense, the response of Republicans to losing a state in 2020 was the mirror image of the Dem-ocratic response in 2016. However, it is also important to note that the gap at the 50-percent point in 2016 among Democrats (22 points in confidence) was significantly less than the gap at the 50-percent point in 2020 among Republicans (36 points in con-fidence).
Average confidence that votes were counted as intended in state2016 Election
Percent answering very of somewhat confident among Republicans
Average confidence that votes were counted as intended in state2016 Election
Percent answering very of somewhat confident among Democrats

FRAUD
29
FRAUD
President Trump’s continued criticism of voting by mail, and his charge that voting by mail was prone to corruption and fraud brought attention to these issues, and had the potential to encourage voters, partic-ularly Republicans, to look at election ad-ministration in a negative light. We see from the responses to the SPAE that these comments had an effect.
For the last several years, the SPAE has asked respondents to indicate how often they believe certain fraudulent or illegal ac-tivities occur in their city or county. These
activities include people voting with an ab-sentee ballot intended for another person, noncitizens voting, voter impersonation, people voting more than once, election of-ficials fraudulently changing the reported vote count, and people stealing or tamper-ing with ballots that had been cast.
On the whole, the overall percentage of vot-ers who believed these activities occurred remains very similar to what we’ve seen over the past dozen years. However, greater partisan gaps opened up in 2020 than be-fore.
Please indicate how often you think these activities occur in your county or city: People voting an absentee ballot intended for
another person
Please indicate how often you think these activities occur in your county or city: People voting who are not U.S. citizens
Please indicate how often you think these activities occur in your county or city: People pretending to be someone else when going
to vote
Please indicate how often you think these activities occur in your county or city: People voting more than once in an election

How we voted in 2020
30
Partisan patterns in beliefs about fraud However, when we break the results out by party, we begin to see the large degree of partisan polarization that has been stoked by the focus on election fraud. The follow-ing graph shows one example of this, with respondents’ answer to a question about stealing or tampering with ballots that
have been voted. In the 2016 election, the percentage of Democrats and Republicans saying this almost never or infrequently happened was only 10 percentage points apart — 79 percent for Democrats and 69 percent for Republicans. In 2020, however, this percentage rose to 89 percent among Democrats and fell to 43 percent among Republicans.
Please indicate how often you think these activities occur in your county or city: Officials [fraudulently] changing the reported vote
count
Please indicate how often you think these activities occur in your county or city: People stealing or tampering with ballots that
have been voted
Please indicate how often you think these activities occur in your county or city: People stealing or tampering with ballots
that have been votedThose saying 'almost never' or 'infrequently'

FRAUD
31
A similar divergence of partisan opinion occurred in all the items in the fraud bat-tery. In 2016, a majority of Republicans said that these frauds “almost never” or “infrequently” happened for all items ex-cept voting another person’s absentee ballot and non-citizens voting. In 2020, the item
Interestingly, unlike voter confidence at the state level, heightened beliefs that fraud is frequent was only weakly correlated among Republicans with the fraction of votes cast by mail in the state. For instance, the cor-relation between the fraction of Republi-cans believing absentee ballot fraud is com-mon is a state was only weakly correlated with the percentage of votes cast by mail in 2020 (r = .24). However, it was strongly correlated with the vote share received by Trump (r = .52). This high degree of cor-relation between the overall partisanship of the state and the belief that absentee ballot fraud is common may be an explanation for why Republican state legislatures are cur-rently considering laws to restrict access to mail ballots, even in states where voters are otherwise confident that votes were count-ed as intended.
that Republicans were most likely to believe almost never or infrequently occurred was officials changing the vote count improper-ly, at 47 percent. Democrats, on the other hand, became much more likely to say that these frauds almost never or infrequently occurred.
Change in attitudes about frequency of fraud among partisans between 2016 and 2020
Those saying frauds happen 'almost never' or 'infrequently'

How we voted in 2020
32
REFORM
Finally, there is the issue of election re-form. For the past dozen years, the SPAE has asked respondents their opinions about eleven reform ideas that are pursued from time to time by various reform groups. These reforms range from voting over the Internet and voting by mail to establishing Election Day as a holiday or moving it to a weekend.
Responses to these items in 2020 were sim-ilar to previous years. The most popular re-forms, by far, were requiring computerized voting machines to have paper backups, re-quiring voters to show photo ID to vote, al-lowing automatic changes to a voter’s regis-tration upon moving, making Election Day a national holiday, and electing officials on a bipartisan basis. The least popular reform has been voting by cell phone, followed by voting on the Internet and then voting by mail.
As in past years, opinions about most of these reforms were split along party lines. The only reforms without a partisan split were requiring electronic machines to have paper backups and requiring that election officials be elected on a nonpartisan basis.
In 2020, opinions did not change much compared to 2016 with most items. There were small changes in a pro-reform direc-tion due to both Democrats and Republi-cans becoming more reform-inclined for selecting non-partisan election officials,
Do you support or oppose any of the following proposals for new ways of voting or
conducting elections?
Do you support or oppose any of the following proposals for new ways of voting or
conducting elections?

REFORM
33
declaring Election Day a holiday or holding elections on a weekend, and requiring pho-to ID in order to vote.
The one reform that became more polar-ized along party lines was voting by mail. Over the past dozen years, Republicans have regularly been disinclined to support voting by mail. Democrats, too, have also tended to oppose the reform. However, in light of events surrounding 2020, Republi-can opposition increased a small amount—they could not fall much farther—, but Democratic support increased substantial-ly. As a consequence, voting by mail is now more popular among the general public as a whole than it once was, but only because the added embrace by Democrats has been greater than any new aversion among Re-publicans.
There is an interesting, and potentially very important pattern on the question of sup-porting voting by mail that emerges when we look at the question at the state level. Respondents in Colorado, Oregon, and Washington — states that have conducted all vote by mail elections for several cycles — have long been more supportive of vot-ing by mail than in the rest of the nation. Although Republicans in these states have tended to support voting by mail at much lower rates the Democrats, in the past two presidential elections Republican support has been around 40 percent. In the 2020 election, however, support among Repub-licans plummeted to 15 percent in these three states, while it continued to grow to among Democrats, now up to 90 percent.
At the same time, support among Repub-licans and the remaining states for voting by mail has always been low, and remained low in 2020. Democrats, on the other hand, had opposed voting by mail in the elections
of 2008, 2012, and 2016 – until 2020, when support among Democrats in states with-out a long tradition of voting by mail nearly doubled.
Colorado, Oregon, and WashingtonThose supporting 'strongly' or 'somewhat'
Except Colorado, Oregon, and WashingtonThose supporting 'strongly' or 'somewhat'

How we voted in 2020
34
CONCLUSION
The 2020 election may go down as one of the most administratively challenging elec-tions in American history. Seen from the perspective of the voter, the experience was positive, both for those who voted in person and who voted by mail. These experiences will no doubt inform American attitudes in the coming months and years, as debates continue about how to incorporate what was learned from the emergency situation in 2020 into long-term practice.
The election will also have long-term conse-quences for the attitudes Americans bring to the issue of election administration. Although election administration already bore the marks of partisan divisions, that gap widened in 2020, especially on the is-sue of voting by mail. These divisions have already been evident as state legislatures have begun debating permanent changes to state election law and the two parties in Congress have lined up in opposition to each other over HR 1.

This page intentionally left blank.


