How To Save Real Dollars with SQL Tuning - SHARE€¦ · Insert Custom Session QR if Desired. How...
33
Insert Custom Session QR if Desired. How To Save Real Dollars with SQL Tuning Phil Grainger BMC Software 7 August 2014, 10:00 15492 Test link: www.SHARE.org
Transcript of How To Save Real Dollars with SQL Tuning - SHARE€¦ · Insert Custom Session QR if Desired. How...

Insert
Custom
Session
QR if
Desired.
How To Save Real Dollars
with SQL Tuning
Phil Grainger
BMC Software
7 August 2014, 10:00
15492
Test link: www.SHARE.org
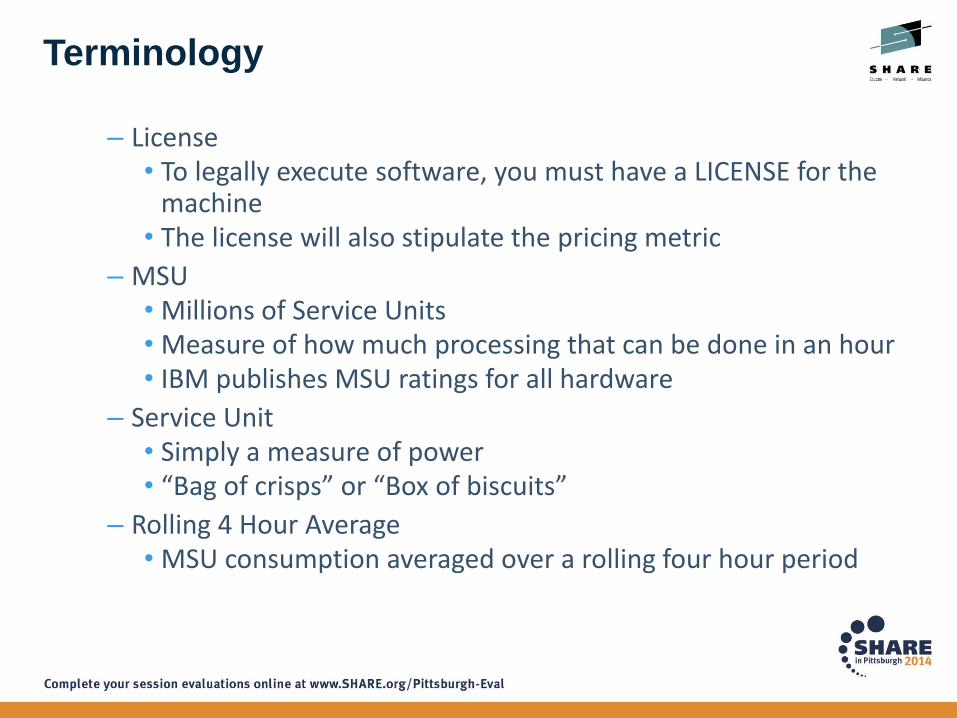
Terminology
– License• To legally execute software, you must have a LICENSE for the
machine• The license will also stipulate the pricing metric
– MSU• Millions of Service Units• Measure of how much processing that can be done in an hour• IBM publishes MSU ratings for all hardware
– Service Unit• Simply a measure of power• “Bag of crisps” or “Box of biscuits”
– Rolling 4 Hour Average• MSU consumption averaged over a rolling four hour period
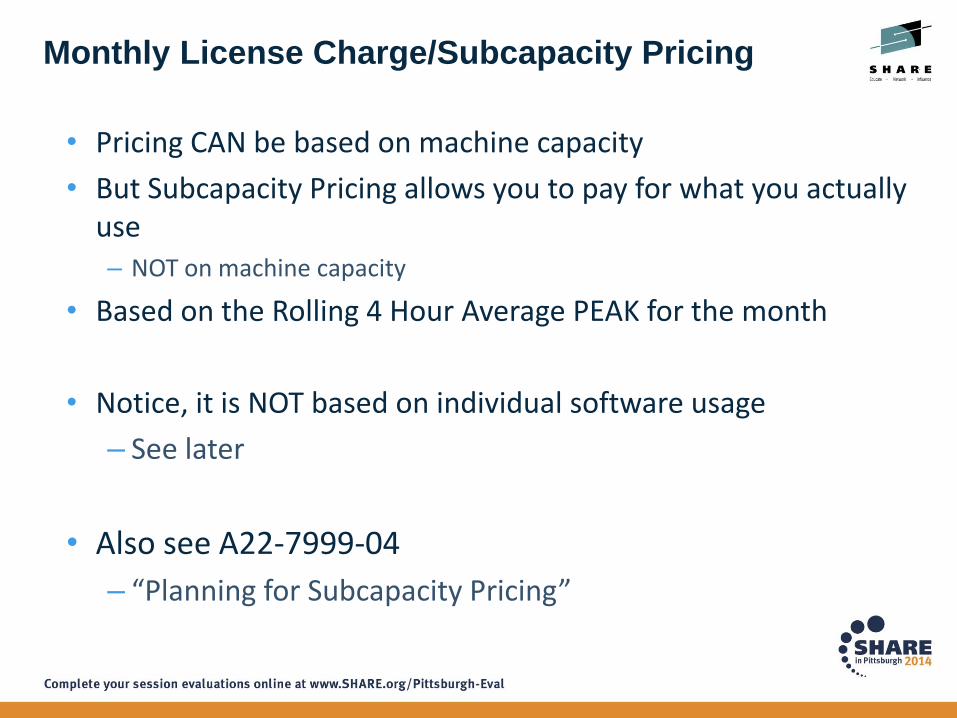
Monthly License Charge/Subcapacity Pricing
• Pricing CAN be based on machine capacity
• But Subcapacity Pricing allows you to pay for what you actually use– NOT on machine capacity
• Based on the Rolling 4 Hour Average PEAK for the month
• Notice, it is NOT based on individual software usage
– See later
• Also see A22-7999-04
– “Planning for Subcapacity Pricing”
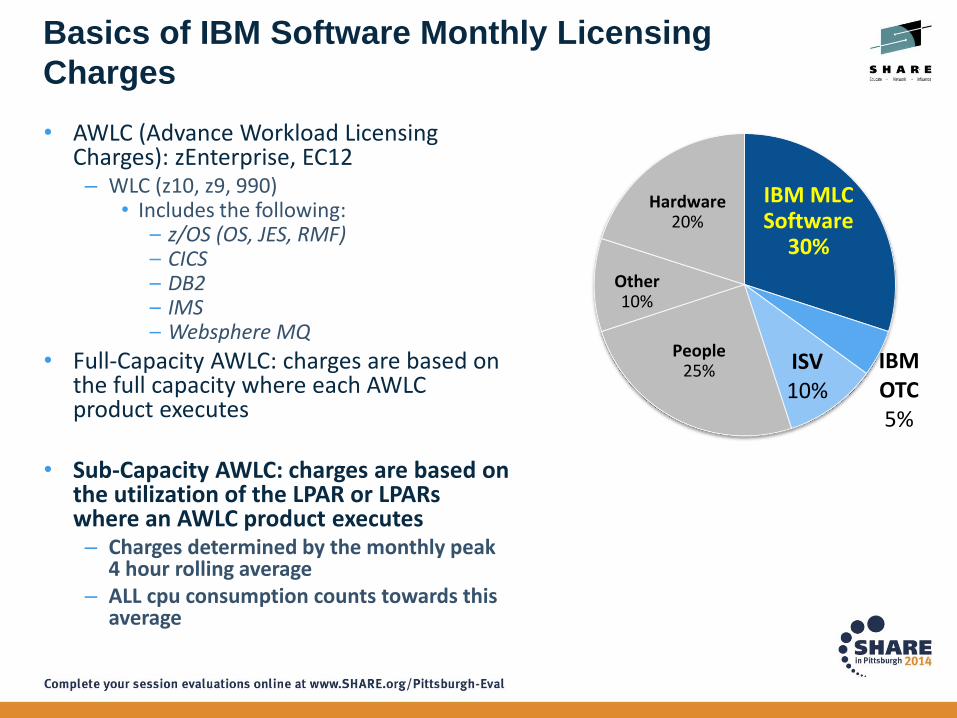
Basics of IBM Software Monthly Licensing
Charges
• AWLC (Advance Workload Licensing Charges): zEnterprise, EC12– WLC (z10, z9, 990)
• Includes the following:– z/OS (OS, JES, RMF)– CICS– DB2– IMS– Websphere MQ
• Full-Capacity AWLC: charges are based on the full capacity where each AWLC product executes
• Sub-Capacity AWLC: charges are based on the utilization of the LPAR or LPARs where an AWLC product executes– Charges determined by the monthly peak
4 hour rolling average– ALL cpu consumption counts towards this
average
IBM OTC5%
ISV 10%
Other10%
IBM MLCSoftware
30%
People25%
Hardware20%
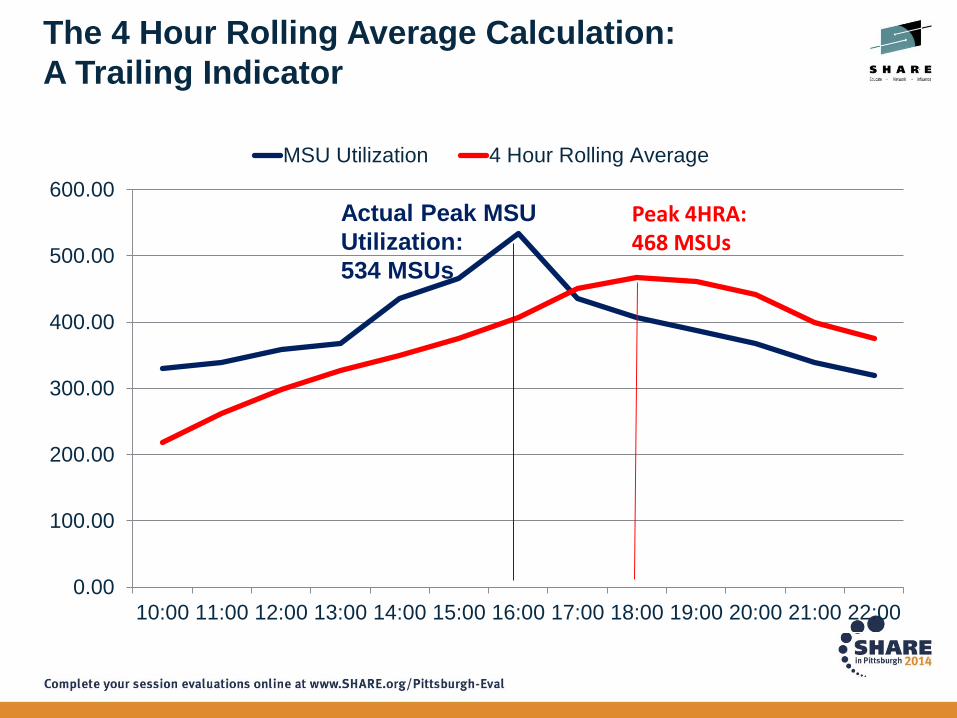
The 4 Hour Rolling Average Calculation:
A Trailing Indicator
0.00
100.00
200.00
300.00
400.00
500.00
600.00
10:00 11:00 12:00 13:00 14:00 15:00 16:00 17:00 18:00 19:00 20:00 21:00 22:00
MSU Utilization 4 Hour Rolling Average
Peak 4HRA:468 MSUs
Actual Peak MSU
Utilization:
534 MSUs
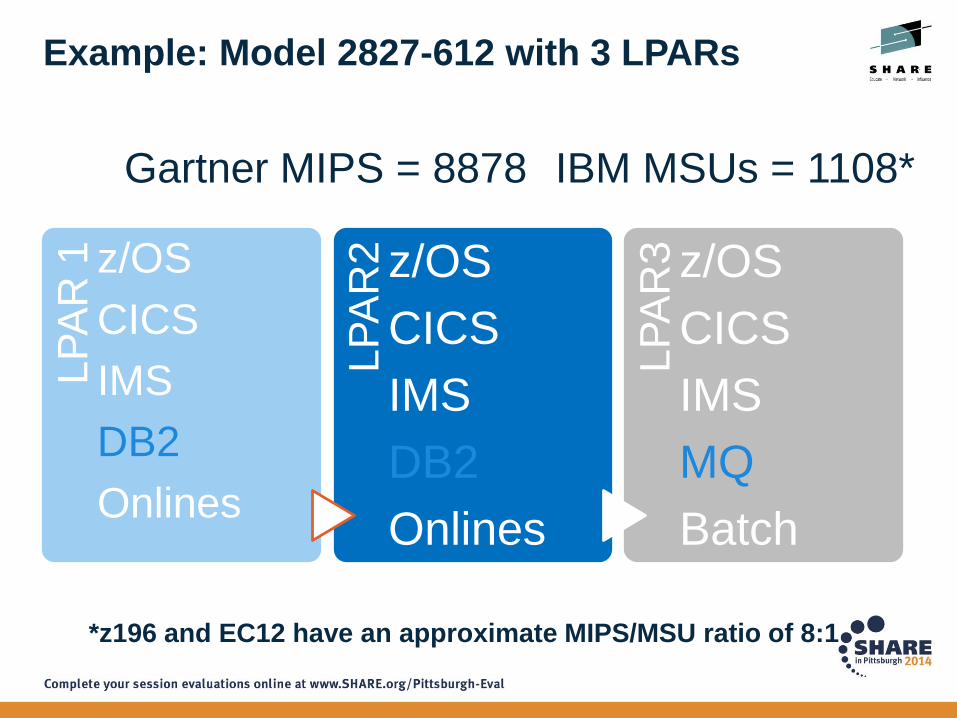
Example: Model 2827-612 with 3 LPARs L
PA
R 1 z/OS
CICS
IMS
DB2
Onlines
LP
AR
2 z/OS
CICS
IMS
DB2
Onlines
LP
AR
3 z/OS
CICS
IMS
MQ
Batch
Gartner MIPS = 8878 IBM MSUs = 1108*
*z196 and EC12 have an approximate MIPS/MSU ratio of 8:1
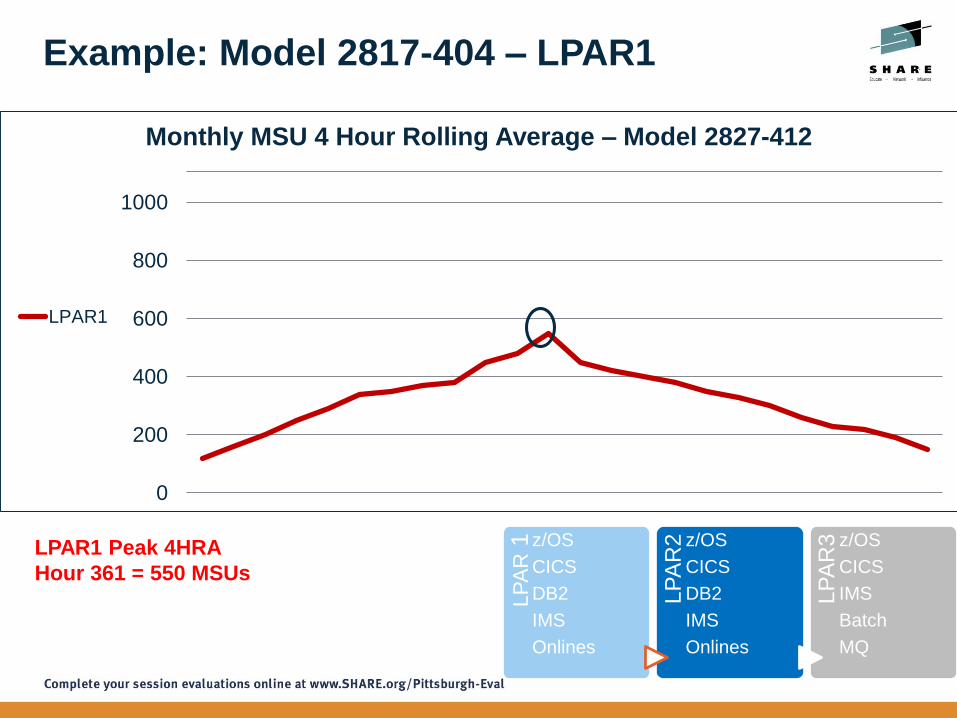
Example: Model 2817-404 – LPAR1
LPAR1 Peak 4HRA
Hour 361 = 550 MSUs
0
200
400
600
800
1000
Monthly MSU 4 Hour Rolling Average – Model 2827-412
LPAR1
LP
AR
1 z/OS
CICS
DB2
IMS
Onlines
LP
AR
2 z/OS
CICS
DB2
IMS
Onlines
LP
AR
3 z/OS
CICS
IMS
Batch
MQ
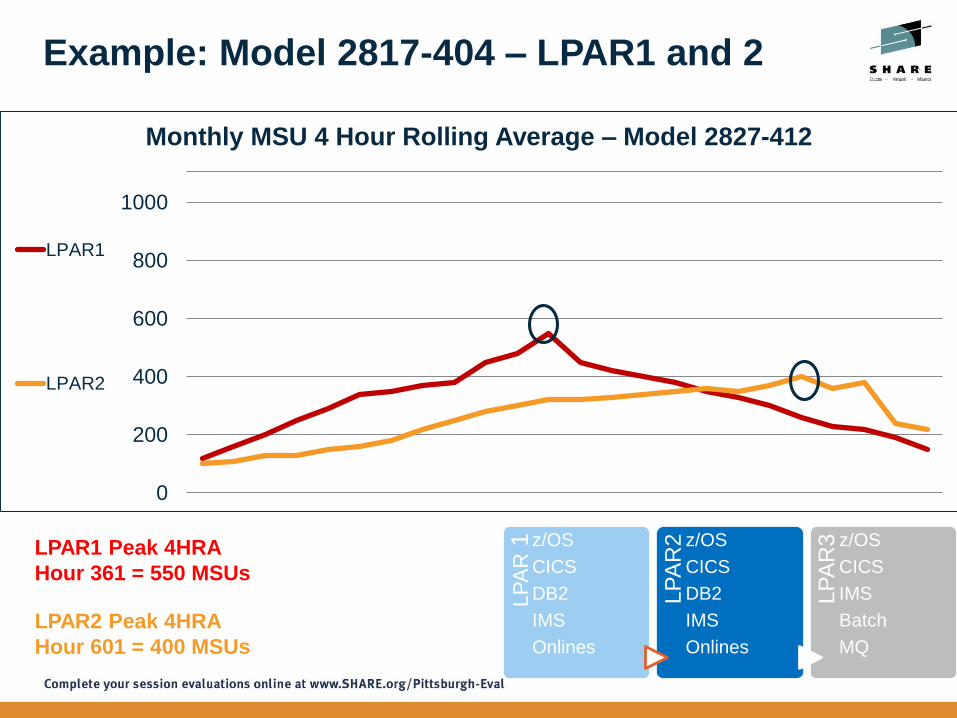
Example: Model 2817-404 – LPAR1 and 2
LPAR1 Peak 4HRA
Hour 361 = 550 MSUs
LPAR2 Peak 4HRA
Hour 601 = 400 MSUs
0
200
400
600
800
1000
Monthly MSU 4 Hour Rolling Average – Model 2827-412
LPAR1
LPAR2
LP
AR
1 z/OS
CICS
DB2
IMS
Onlines
LP
AR
2 z/OS
CICS
DB2
IMS
Onlines
LP
AR
3 z/OS
CICS
IMS
Batch
MQ
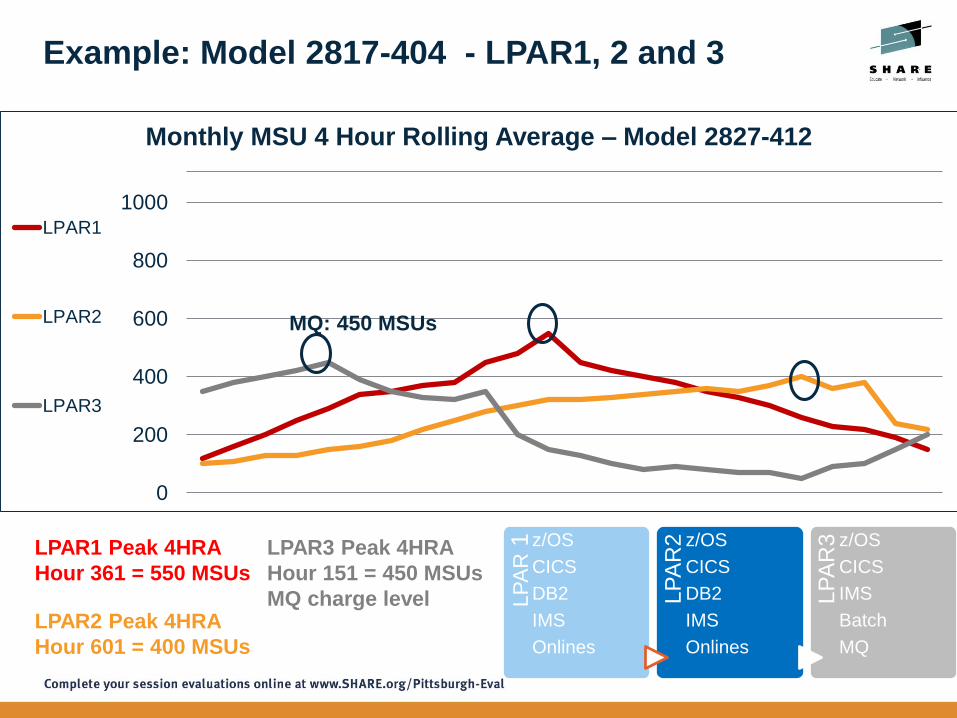
Example: Model 2817-404 - LPAR1, 2 and 3
LPAR1 Peak 4HRA
Hour 361 = 550 MSUs
LPAR3 Peak 4HRA
Hour 151 = 450 MSUs
MQ charge levelLPAR2 Peak 4HRA
Hour 601 = 400 MSUs
0
200
400
600
800
1000
Monthly MSU 4 Hour Rolling Average – Model 2827-412
LPAR1
LPAR2
LPAR3
LP
AR
1 z/OS
CICS
DB2
IMS
Onlines
LP
AR
2 z/OS
CICS
DB2
IMS
Onlines
LP
AR
3 z/OS
CICS
IMS
Batch
MQ
MQ: 450 MSUs
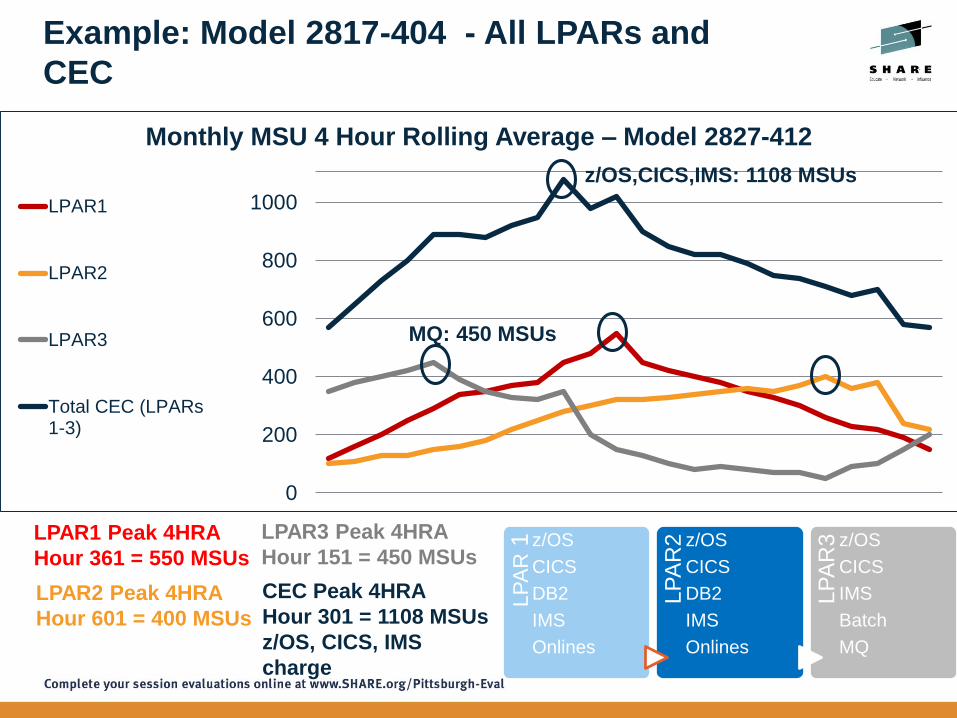
Example: Model 2817-404 - All LPARs and
CEC
CEC Peak 4HRA
Hour 301 = 1108 MSUs
z/OS, CICS, IMS
charge
LPAR1 Peak 4HRA
Hour 361 = 550 MSUs
LPAR3 Peak 4HRA
Hour 151 = 450 MSUs
LPAR2 Peak 4HRA
Hour 601 = 400 MSUs
0
200
400
600
800
1000
Monthly MSU 4 Hour Rolling Average – Model 2827-412
LPAR1
LPAR2
LPAR3
Total CEC (LPARs1-3)
LP
AR
1 z/OS
CICS
DB2
IMS
Onlines
LP
AR
2 z/OS
CICS
DB2
IMS
Onlines
LP
AR
3 z/OS
CICS
IMS
Batch
MQ
MQ: 450 MSUs
z/OS,CICS,IMS: 1108 MSUs

Example: Model 2817-404 – The DB2 peak
LPAR1 + LPAR2 Peak 4HRA
Hour 361 = 870 MSUs
DB2 charge!
0
200
400
600
800
1000
Monthly MSU 4 Hour Rolling Average – Model 2827-412
LPAR1
LPAR2
LPAR3
Total CEC (LPARs1-3)
LPAR1 and LPAR2
LP
AR
1 z/OS
CICS
DB2
IMS
Onlines
LP
AR
2 z/OS
CICS
DB2
IMS
Onlines
LP
AR
3 z/OS
CICS
IMS
Batch
MQ
DB2: 870 MSUs
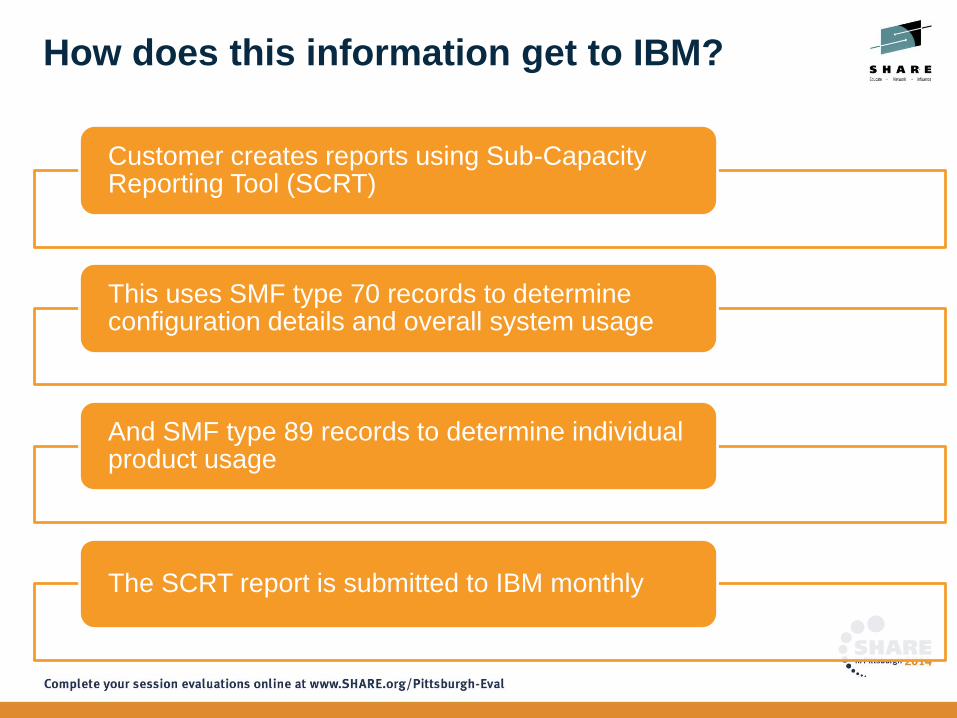
How does this information get to IBM?
Customer creates reports using Sub-Capacity Reporting Tool (SCRT)
This uses SMF type 70 records to determine configuration details and overall system usage
And SMF type 89 records to determine individual product usage
The SCRT report is submitted to IBM monthly
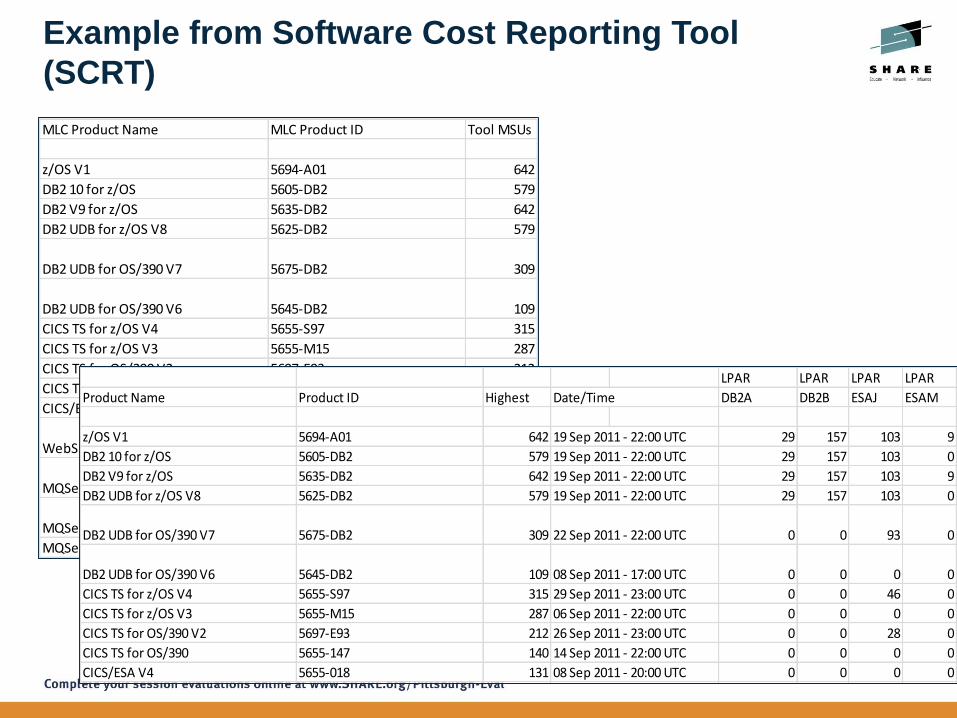
Example from Software Cost Reporting Tool
(SCRT)
MLC Product Name MLC Product ID Tool MSUs
z/OS V1 5694-A01 642
DB2 10 for z/OS 5605-DB2 579
DB2 V9 for z/OS 5635-DB2 642
DB2 UDB for z/OS V8 5625-DB2 579
DB2 UDB for OS/390 V7 5675-DB2 309
DB2 UDB for OS/390 V6 5645-DB2 109
CICS TS for z/OS V4 5655-S97 315
CICS TS for z/OS V3 5655-M15 287
CICS TS for OS/390 V2 5697-E93 212
CICS TS for OS/390 5655-147 140
CICS/ESA V4 5655-018 131
WebSphere MQ for z/OS V7 5655-R36 560
MQSeries for z/OS V6 5655-L82 511
MQSeries for OS/390 V5 5655-F10 89
MQSeries MVS/ESA 5695-137 109
LPAR LPAR LPAR LPAR LPAR
Product Name Product ID Highest Date/Time DB2A DB2B ESAJ ESAM IMSA
z/OS V1 5694-A01 642 19 Sep 2011 - 22:00 UTC 29 157 103 9 39
DB2 10 for z/OS 5605-DB2 579 19 Sep 2011 - 22:00 UTC 29 157 103 0 39
DB2 V9 for z/OS 5635-DB2 642 19 Sep 2011 - 22:00 UTC 29 157 103 9 39
DB2 UDB for z/OS V8 5625-DB2 579 19 Sep 2011 - 22:00 UTC 29 157 103 0 39
DB2 UDB for OS/390 V7 5675-DB2 309 22 Sep 2011 - 22:00 UTC 0 0 93 0 0
DB2 UDB for OS/390 V6 5645-DB2 109 08 Sep 2011 - 17:00 UTC 0 0 0 0 0
CICS TS for z/OS V4 5655-S97 315 29 Sep 2011 - 23:00 UTC 0 0 46 0 0
CICS TS for z/OS V3 5655-M15 287 06 Sep 2011 - 22:00 UTC 0 0 0 0 0
CICS TS for OS/390 V2 5697-E93 212 26 Sep 2011 - 23:00 UTC 0 0 28 0 0
CICS TS for OS/390 5655-147 140 14 Sep 2011 - 22:00 UTC 0 0 0 0 0
CICS/ESA V4 5655-018 131 08 Sep 2011 - 20:00 UTC 0 0 0 0 0

Graphically is easier to read
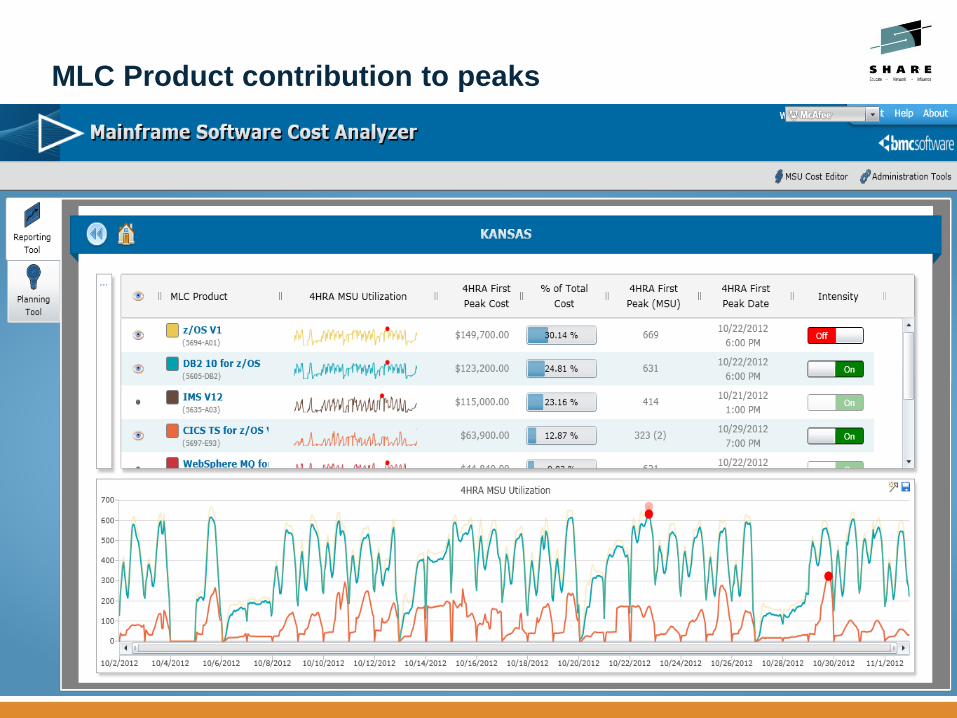
MLC Product contribution to peaks
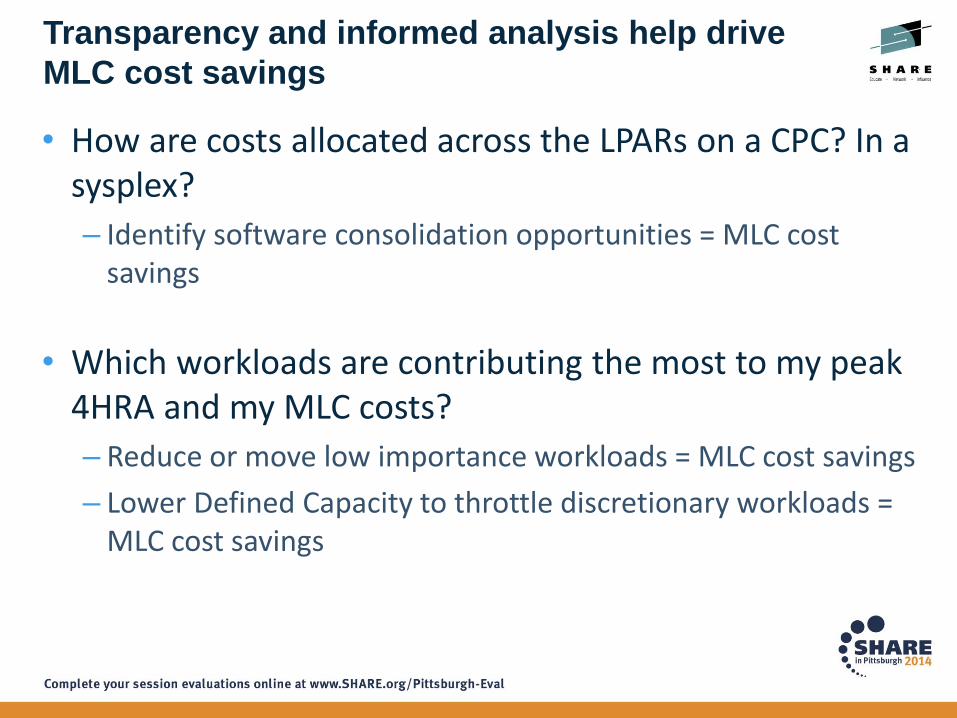
Transparency and informed analysis help drive
MLC cost savings
• How are costs allocated across the LPARs on a CPC? In a sysplex?
– Identify software consolidation opportunities = MLC cost savings
• Which workloads are contributing the most to my peak 4HRA and my MLC costs?
– Reduce or move low importance workloads = MLC cost savings
– Lower Defined Capacity to throttle discretionary workloads = MLC cost savings
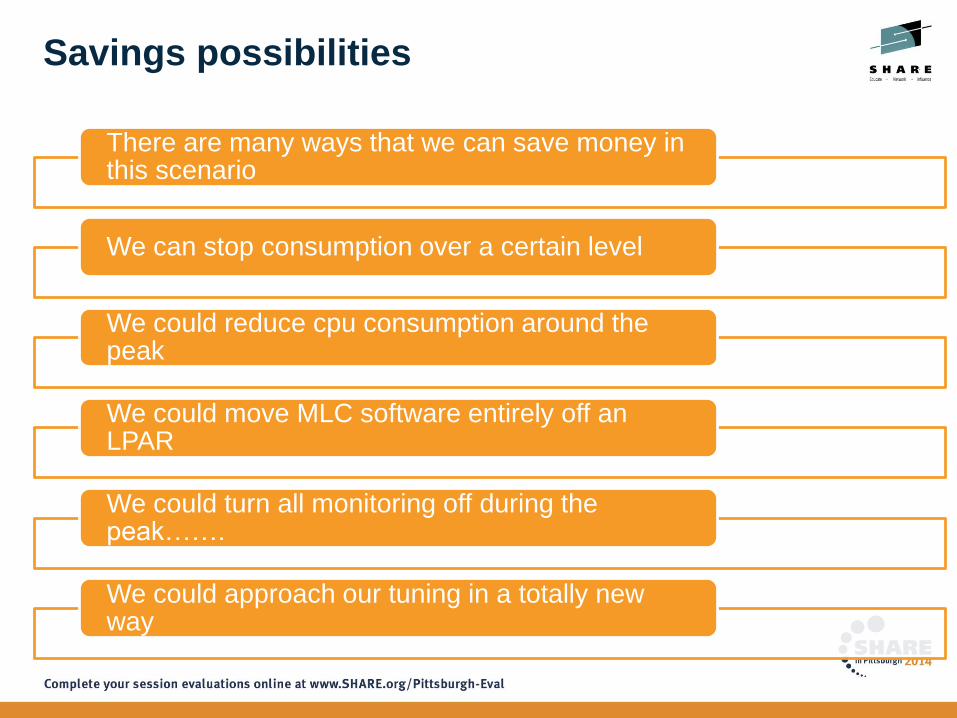
Savings possibilities
There are many ways that we can save money in this scenario
We can stop consumption over a certain level
We could reduce cpu consumption around the peak
We could move MLC software entirely off an LPAR
We could turn all monitoring off during the peak…….
We could approach our tuning in a totally new way

Capping
Set a ceiling on MSU usage
Now, consumption cannot exceed a pre-defined level
If a workload does try to exceed the limit, it will be held back
Which is worse- Having a surprise bill from IBM- Having response time issues due to capping

Reducing cpu consumption in the R4HA peak
Product Current Monthly
MSU Charge
Estimated Cost Per
MSU
Current MLC Charge
z/OS 1108 150 $166,200
CICS 1108 75 $83,100
IMS 1108 100 $110,800
DB2 870 75 $65,250
MQ 450 25 $11,250
Monthly Total
$436,600

Reducing cpu consumption in the R4HA peak
– By 5%
Product Current Monthly
MSU Charge
Estimated Cost Per
MSU
Current MLC Charge
Reduced MSU Usage
by 5%
z/OS 1108 150 $166,200 $157,890
CICS 1108 75 $83,100 $78,945
IMS 1108 100 $110,800 $105,260
DB2 870 75 $65,250 $61,988
MQ 450 25 $11,250 $10,688
Monthly Total
$436,600 $414,770
Annual Savings Per CEC
$261,960
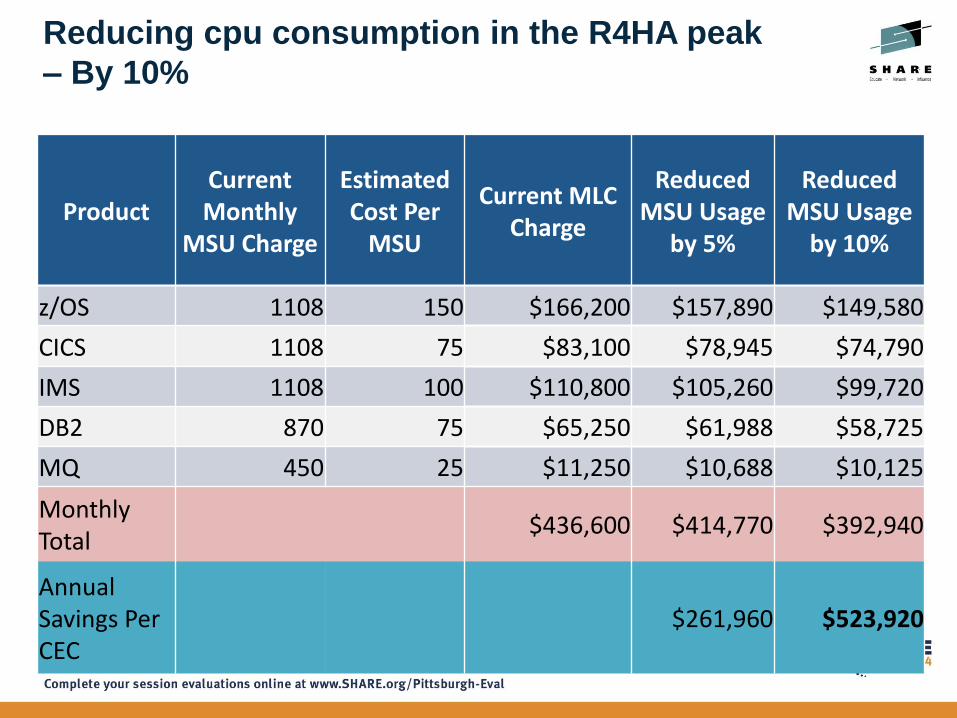
Reducing cpu consumption in the R4HA peak
– By 10%
Product Current Monthly
MSU Charge
Estimated Cost Per
MSU
Current MLC Charge
Reduced MSU Usage
by 5%
Reduced MSU Usage
by 10%
z/OS 1108 150 $166,200 $157,890 $149,580
CICS 1108 75 $83,100 $78,945 $74,790
IMS 1108 100 $110,800 $105,260 $99,720
DB2 870 75 $65,250 $61,988 $58,725
MQ 450 25 $11,250 $10,688 $10,125
Monthly Total
$436,600 $414,770 $392,940
Annual Savings Per CEC
$261,960 $523,920
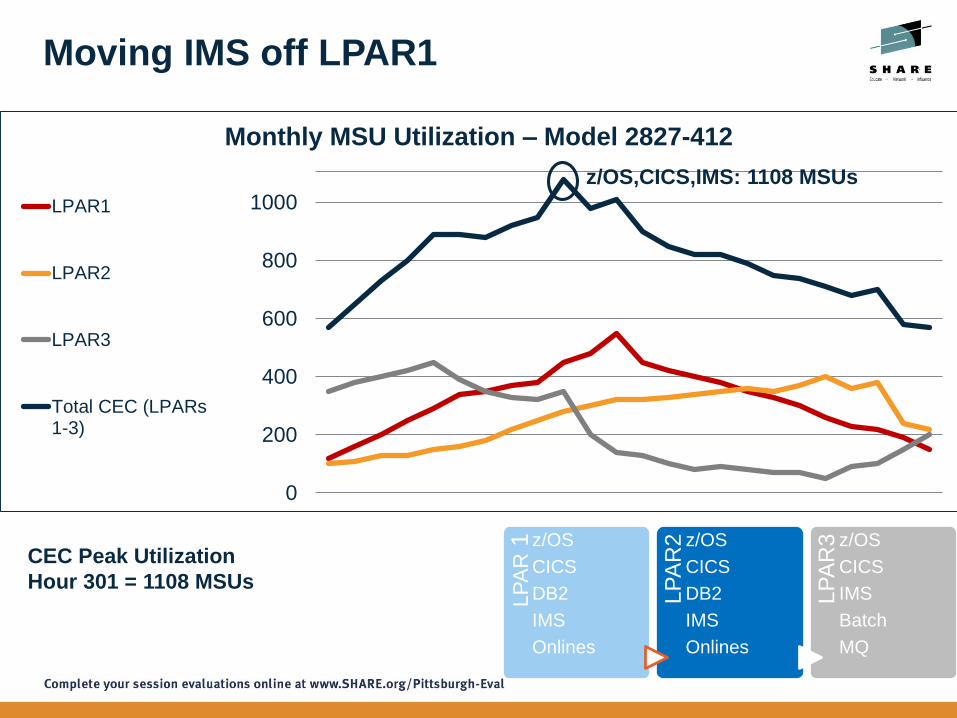
Moving IMS off LPAR1
CEC Peak Utilization
Hour 301 = 1108 MSUs
0
200
400
600
800
1000
Monthly MSU Utilization – Model 2827-412
LPAR1
LPAR2
LPAR3
Total CEC (LPARs1-3)
LP
AR
1 z/OS
CICS
DB2
IMS
Onlines
LP
AR
2 z/OS
CICS
DB2
IMS
Onlines
LP
AR
3 z/OS
CICS
IMS
Batch
MQ
z/OS,CICS,IMS: 1108 MSUs

Moving IMS off LPAR1 – New peak for LPAR2
plus LPAR3
CEC Peak Utilization
Hour 301 = 1108 MSUs
0
200
400
600
800
1000
Monthly MSU Utilization – Model 2827-412
LPAR1
LPAR2
LPAR3
Total CEC (LPARs1-3)
LPAR2 and LPAR 3
LP
AR
1 z/OS
CICS
Onlines LP
AR
2 z/OS
CICS
DB2
IMS
Onlines
LP
AR
3 z/OS
CICS
IMS
Batch
MQ
IMS: 630 MSUs
LPAR2 + LPAR3
Peak 4HRA
Hour 301 = 630 MSUs
New IMS charge
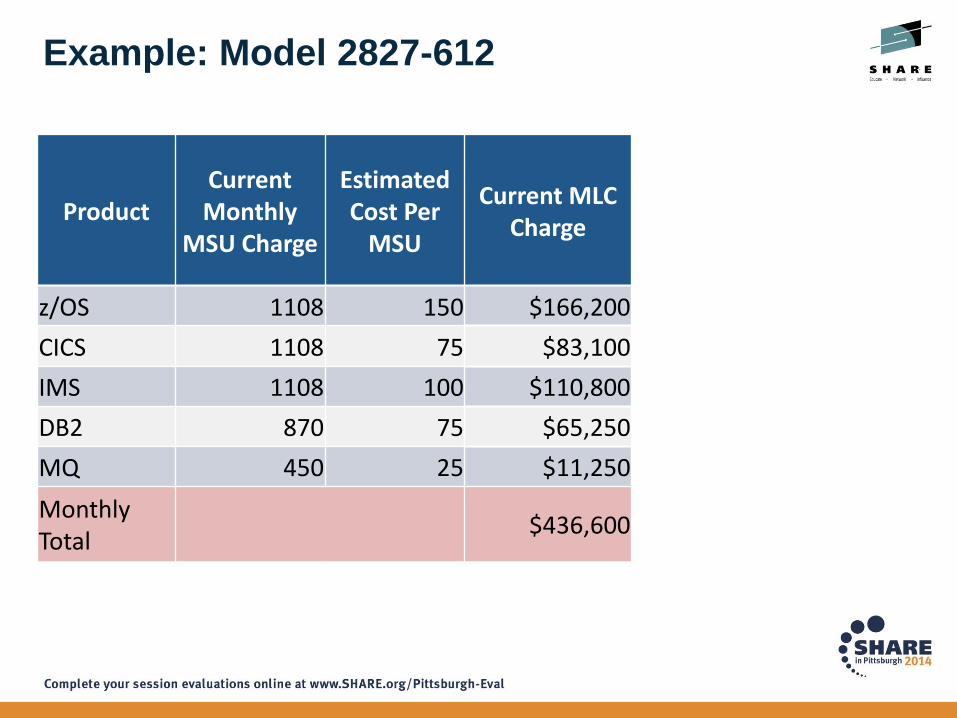
Example: Model 2827-612
Product Current Monthly
MSU Charge
Estimated Cost Per
MSU
Current MLC Charge
z/OS 1108 150 $166,200
CICS 1108 75 $83,100
IMS 1108 100 $110,800
DB2 870 75 $65,250
MQ 450 25 $11,250
Monthly Total
$436,600

Example: Model 2827-612
Product Current Monthly
MSU Charge
Estimated Cost Per
MSU
Current MLC Charge
IMS now on only two
LPARS
z/OS 1108 150 $166,200 $166,200
CICS 1108 75 $83,100 $83,100
IMS 630 100 $110,800 $63,000
DB2 870 75 $65,250 $65,250
MQ 450 25 $11,250 $11,250
Monthly Total
$436,600 $388,800
Annual Savings Per CEC
$537,600

Moving IMS off LPAR1 –
New peak for LPAR2 plus LPAR3?
CEC Peak Utilization
Hour 301 = 1108 MSUs
0
200
400
600
800
1000
Monthly MSU Utilization – Model 2827-412
LPAR1
LPAR2
LPAR3
Total CEC (LPARs1-3)
LPAR2 and LPAR 3
LP
AR
1 z/OS
CICS
Onlines LP
AR
2 z/OS
CICS
DB2
IMS
Onlines
LP
AR
3 z/OS
CICS
IMS
Batch
MQ
LPAR2 / LPAR3
Peak 4HRA
Hour 301 = 630 MSUs
New IMS charge
If moving IMS
also changed the
CEC peak R4HA,
we could have
saved even more
IMS: 630 MSUs
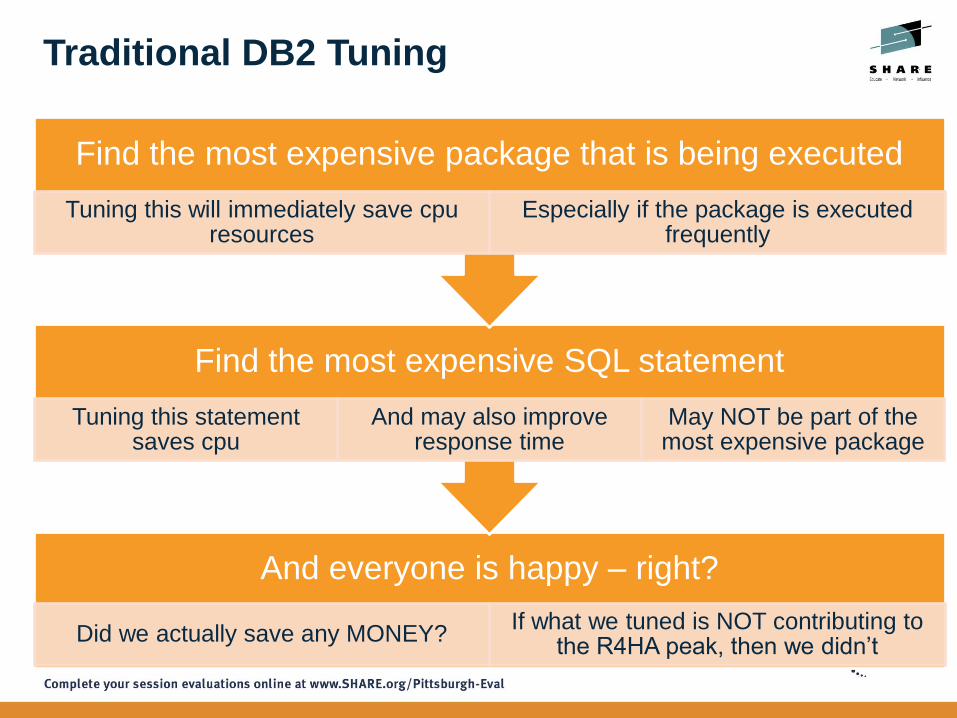
Traditional DB2 Tuning
And everyone is happy – right?
Did we actually save any MONEY?If what we tuned is NOT contributing to
the R4HA peak, then we didn’t
Find the most expensive SQL statement
Tuning this statement saves cpu
And may also improve response time
May NOT be part of the most expensive package
Find the most expensive package that is being executed
Tuning this will immediately save cpuresources
Especially if the package is executed frequently
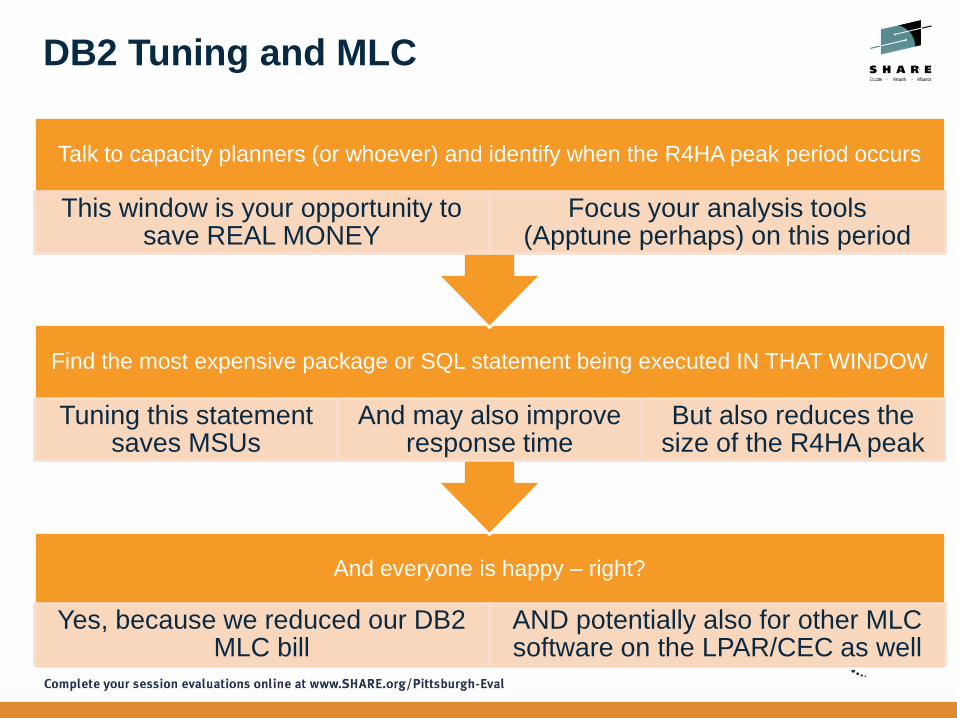
DB2 Tuning and MLC
And everyone is happy – right?
Yes, because we reduced our DB2 MLC bill
AND potentially also for other MLC software on the LPAR/CEC as well
Find the most expensive package or SQL statement being executed IN THAT WINDOW
Tuning this statement saves MSUs
And may also improve response time
But also reduces the size of the R4HA peak
Talk to capacity planners (or whoever) and identify when the R4HA peak period occurs
This window is your opportunity to save REAL MONEY
Focus your analysis tools (Apptune perhaps) on this period

Workloads and MLC
What else can you do to affect MLC charging?
Once the R4HA period is identified
Are there any workloads that don’t HAVE to be executed at that time?
Could some batch or housekeeping be rescheduled?
Or even moved to another LPAR
Anything you can remove (or delay) will have an immediate effect on the size of the R4HA peak
And thus bring immediate saving on MLC charges
Tuning outside the peak may make you feel good, and may improve response times, but it is NOT going to save money
Workloads and MLC
More DB2 thoughts
Look at new DB2 features for reducing cpu
Multi Row fetch, for example
Yes, they will cost money to implement
BUT the savings can be greater, and ongoing
And not just for DB2!
Workloads and MLC
Surprises Any MLC software that is ACTIVE during the peak will be charged
If you don’t NEED CICS/ IMS, DB2 etc to be up, then don’t keep them up
Consider Data Sharing members
Active but not being used costs money
Inactive (down) does NOT
Workloads and MLC
So don’t limit tuning to solely DB2
Someone should examine EVERYTHING that is executing in the R4HA peak
Is everything as efficient as it can be?
Are there alternatives that can save cpu?
Saving money is about much more than acquisition costs
The savings can be SIGNIFICANT, as we saw

MLC tuning – never ending cycle
Identify R4HA peak
period
Reschedule any
discretionary workloads
Tune workloads that remain
Now you are saving MLC
charges
Did you move the peak to different period?