Treating Dementia and Traumatic Brain Injury with EEG Biofeedback and 1072nm IR Stimulation.
How to Run an EEG-Biofeedback Session
© 2010 Clarity Enterprises, Inc.

NEUROFEEDBACK APPLICATIONS
CONTENTS
EEG The Art of Finding the Best Feedback Display..............................................................1
NEUROFEEDBACK BASICS....................................................................................................2
EEG –Site Selection and Impedance Detection...................................................................4
Adjust Bands and Go!..........................................................................................................5
WHAT TO ADJUST DURING A TRAIL:....................................................................................6
FINE TUNING......................................................................................................................12
STANDARD BAND TYPES:...................................................................................................13
Two kinds of EEG Signal Smoothing: Using Average Adjust..............................................16
Types of EEG Feedback......................................................................................................17
FINE-TUNING THRESHOLDS:..............................................................................................20
HOW ARTIFACT WORKS:....................................................................................................20
GUIDELINES FOR ASSIGNING ACTIVE BAND FUNCTIONS:................................................22
Selecting An EEG Screen:...................................................................................................25
ABOUT FINE-TUNING.........................................................................................................27
EEG REPORT GENERATOR:.................................................................................................29
2-SITE NEUROFEEDBACK....................................................................................................31
4-SITE NEUROFEEDBACK....................................................................................................33
4-SITE COMODULATION.....................................................................................................34
COMODULATION FEEDBACK..............................................................................................35
Comodulation Screens.......................................................................................................38
Combo[6a4]2EEG+SOMATIC+HRV-Profile&FB..................................................................40
DATA MANAGEMENT.........................................................................................................45
[5b4] EMG A&B. EEG C&D. Pain Control............................................................................45
© 2010 Clarity Enterprises, Inc. i

EEG The Art of Finding the Best Feedback DisplayWelcome
We know neurofeedback training is challenging. The C2 Plus is here to help.
Neurofeedback has slowly spread beyond the boundaries of the biofeedback community, and the majority of new practitioners have little formal training in brain science or psychophysiological research. However most have a common background in learning theory – classical and operant conditioning. This remains the bedrock of both biofeedback and neurofeedback.
Why Clarity Combines Autonomic Signals with Brain Waves:The combination of EEG band changes and peripheral signal changes is reinforcing. It will act as a second opinion for your session. And if you add the Subjective Ratings Scale, adjusting it during a session, you will be able to look back and provide a truly full picture of subjective, brain and peripheral arousal as it impacted on operant responding [density of reward graphs] for your client.
Peripheral biofeedback signals remain the best mirrors of internal arousal and relaxation states. They should be used by all neurofeedback supervisors as part of training, and mentoring new members. The neurofeedback applications provided here were designed to do exactly that. Attach respiration, temperature and SC, and a new vision of your neurofeedback sessions will unfold. I guarantee it. No more guesses about boredom or attention, overload or drowsiness, and other outside cognitive-emotional events.
HOW TO LEARN: All neurofeedback applications require some study. We recommend breaking your studies into small segments and mastering each step. Use it every day and it becomes very easy. Follow our help-screen tutorials in the beginning. Do not ‘test’ any program on clients. Make sure you have mastered how to navigate each application first.
HINT: PRINT OUT EVERY SESSION – while learning. You can learn more by pushing yourself to save and review session graphs every time you practice or run a session. If you exit and save data after a session and immediately go to Data Management, the last session data is held for you, ready to display in View Data. The program retains the name of the current client, brings it up the last session automatically in Data Management, and allows you to View the Current Session right away. Print a copy for the client or the record, write some notes or give the graph as part of a homework assignment.
All this data viewing and printing can be done within 3 minutes of saving the data.
Robert N Grove, PhD
© 2010 Clarity Enterprises, Inc. 1

Chief Science OfficerClarity Enterprises, Inc.rgrove@clarityenterprisesinc.comwww.clarityenterprisesinc.com
NEUROFEEDBACK BASICSFunctional Brain Map
This diagram was developed by Dr. Julie Madsen, Clarity’s Chief Education Officer. Dr. Madsen has over 15 years experience with neurofeedback. She also does Q-EEGs and has a private neurofeedback practice in California. This Functional Brain Map is her summary of brain functions localized to the 10-20 EEG sensor site system. Electrodes are placed based on the 10-20 system.
© 2010 Clarity Enterprises, Inc. 2

Consistency of placement is critical. Placements should be identical from session to session and person to person.
© 2010 Clarity Enterprises, Inc. 3

EEG ELECTRODES:Clarity provides electrodes that can be used for 2 sites with common ear references.The cables have a white [+] and black [-] electrode snap. If the cable also has a 3rd green snap lead, the green lead is an electrical ground.How many electrodes? It depends on whether you use a monopolar or a bipolar arrangement.
Monopolar is easiest: Place a positive lead at each site. Place a negative lead on each ear, and place a ground lead anywhere. If you have an SC/Temp sensor, you can attach the green SC lead to a finger. It does double duty as a ground, too.These placements are for a 2 EEG program. If you want 4 EEGs, you must have our C2 Plus 12 [it has 4 EEG inputs available], and 2 special electrodes, the single-post mono electrode cables, one for the third EEG site, and one for the 4th EEG site.
Bipolar is a little different. For 2 site bipolar, you do not use the ears at all. The positive goes on one site and the negative on another site for the cable-pair. The second EEG cable is likewise split between one positive and another negative. Sites 3 and 4 also need a split-pair cable, with positive and negative across two other sites.
The default is monopolar. If you want bipolar, find the Mono/Bi Screen and click on the Mono Button.
HOOKUP TIPS:Really scrub the skin. Don’t be delicate – you will have false signals! Poor or incomplete abrasion is the real reason that so much ‘delta-theta’ is seen in so many ‘neurofeedback’ l EEGs. Poor impedance is misinterpreted as large delta-theta waves, so be careful. Keep all the equipment away from florescent lights, computers, motors and anything electric. Provide at least 3 feet of safe space.Do not use USB extension cables. Wireless USB does work. See jjengineering.info for details.Place the Respiration, SC and Temp sensors after prepping the head site but BEFORE attaching the EEG. You may dab 10-20 paste on the head sites and let it ‘melt’ – it is a wax. Then place some 10-20 pastes in the cup-electrodes and ‘glue’ the cup to the dab of past on the head site.
© 2010 Clarity Enterprises, Inc. 4

EEG –Site Selection and Impedance DetectionLow EEG Impedance is CRITICAL!The first screen is the hookup and electrode impedance screen. A one-channel application will just have A+ and the references will be called A-. In a one-channel application you have the option of switching between monopolar and bipolar configurations manually. A software switch is not necessary.
This impedance test screen is showing the live impedance of each electrode to ground. In additional to the digital reading in K-Ohms there are red-yellow-green colored dots indicating: green - under 5K, yellow - between 5 and 10K, and red - over 10K. Instructional information, if provided, appears in a panel to the right with Previous and Next buttons to cycle through multiple pages.
You can label the channels with the site name as you are hooking up electrodes by clicking the site on the headmap, then clicking on the white space next to the corresponding channel to the right. After the impedances are satisfactory, click Verify waveforms Check & Label, to check raw signals and change site names if required.2. SELECT POLARITY --Mono/Bipolar Setup Screen
© 2010 Clarity Enterprises, Inc. 5

SIDEBAR:New to neurofeedback? Confused by this screen? The Bipolar/Monopolar Switch is not needed for classic EEG feedback. You can safely skip it.
Press the big button in the middle to switch between Mono – and Bipolar.
This screen shot shows that the electrodes are now in bipolar mode.Unless you have a need to change polarity, there is no need to make any changes.
Adjust Bands and Go!When you are satisfied with your label names and EEG waveforms [and polarity], click the tab, ‘Adjust Bands and Go.’This screen has Band Master-Control Boxes, and orange Session-Start [Go] buttons.The Band Master-Control Boxes set up which bands are active for feedback. Each Band Control Box allows you to adjust the upper and lower EEG band [on the bottom left]. On the right is a Feedback-indicator light, controlled by buttons on the upper left. We will have more details later.For now, note that most EEG protocols can be achieved by adjusting these individual bands and thresholds.
© 2010 Clarity Enterprises, Inc. 6

This is a one-channel EEG setup and Start [Go] Screen.The signal layout is found in our single EEG application, [5a].We will use this as a starting place for simple EEG Feedback session.
WHICH TO CHOOSE?It depends on your skill level.If you are not very skilled or do not yet have confidence in navigating the program, choose one of the upper left feedback-specific buttons. With these buttons, what you will see on your screen will also be seen on the patient’s monitor.If you are more skilled or confident, choose the Manual MASTER Screen button on the bottom right. It will take you to the MASTER SCREEN and all you need to do is manually select a dual screen.
This second option requires that you make sure the same active signals seen by you on the MASTER SCREEN are also manually selected for the Dual Screen.SIDEBAR: The program is the similar for the 2-Site and 4-Site Neurofeedback applications.
WHAT TO ADJUST DURING A TRAIL:
Match a Start Button to the Active Feedback Box or Boxes.
© 2010 Clarity Enterprises, Inc. 7
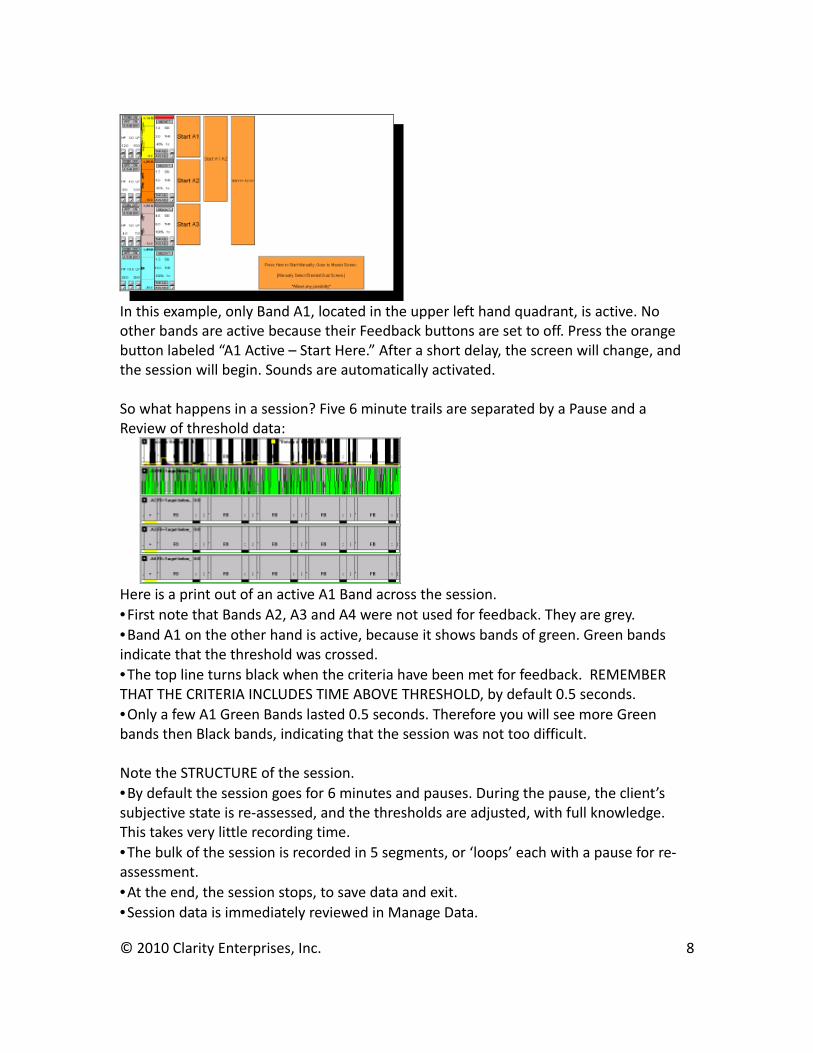
In this example, only Band A1, located in the upper left hand quadrant, is active. No other bands are active because their Feedback buttons are set to off. Press the orange button labeled “A1 Active – Start Here.” After a short delay, the screen will change, and the session will begin. Sounds are automatically activated.
So what happens in a session? Five 6 minute trails are separated by a Pause and a Review of threshold data:
Here is a print out of an active A1 Band across the session.•First note that Bands A2, A3 and A4 were not used for feedback. They are grey.•Band A1 on the other hand is active, because it shows bands of green. Green bands indicate that the threshold was crossed.•The top line turns black when the criteria have been met for feedback. REMEMBER THAT THE CRITERIA INCLUDES TIME ABOVE THRESHOLD, by default 0.5 seconds.•Only a few A1 Green Bands lasted 0.5 seconds. Therefore you will see more Green bands then Black bands, indicating that the session was not too difficult.
Note the STRUCTURE of the session.•By default the session goes for 6 minutes and pauses. During the pause, the client’s subjective state is re-assessed, and the thresholds are adjusted, with full knowledge. This takes very little recording time.•The bulk of the session is recorded in 5 segments, or ‘loops’ each with a pause for re-assessment.•At the end, the session stops, to save data and exit.•Session data is immediately reviewed in Manage Data.
© 2010 Clarity Enterprises, Inc. 8
DETAILS:
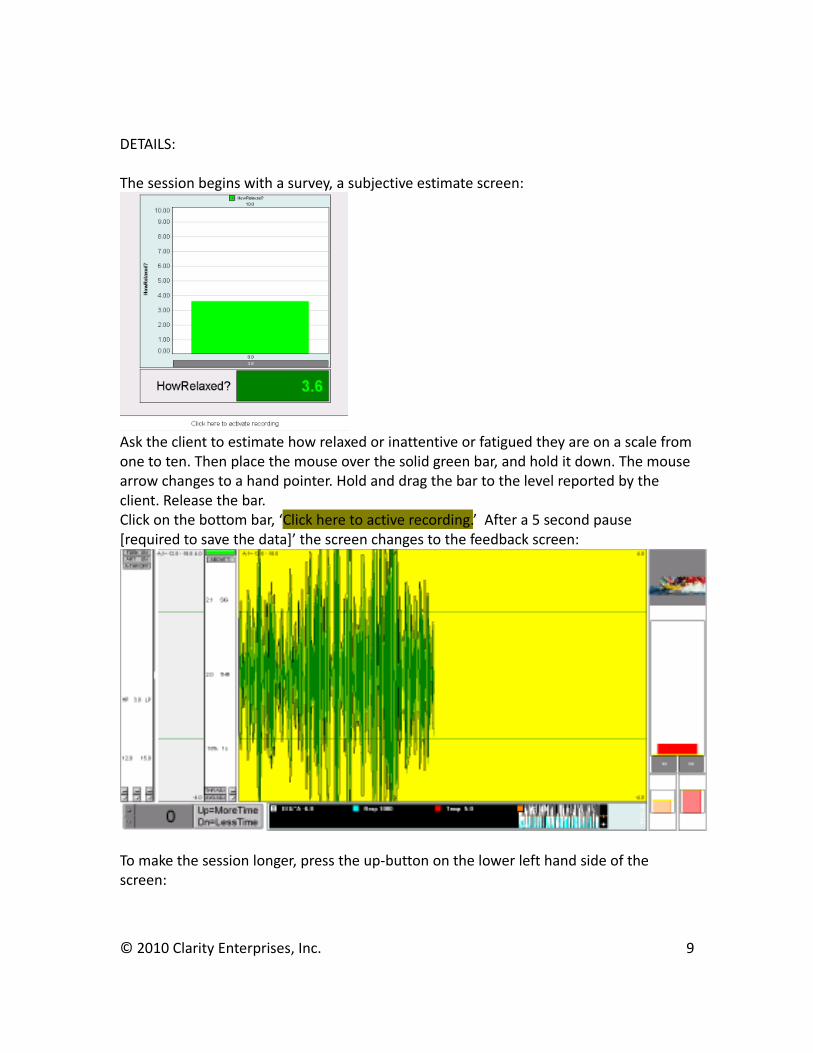
The session begins with a survey, a subjective estimate screen:
Ask the client to estimate how relaxed or inattentive or fatigued they are on a scale from one to ten. Then place the mouse over the solid green bar, and hold it down. The mouse arrow changes to a hand pointer. Hold and drag the bar to the level reported by the client. Release the bar.Click on the bottom bar, ‘Click here to active recording.’ After a 5 second pause [required to save the data]’ the screen changes to the feedback screen:
To make the session longer, press the up-button on the lower left hand side of the screen:
© 2010 Clarity Enterprises, Inc. 9

For example, each loop will now take 480 seconds = 8 minutes:
To lower the time per loop, click the down button:
To control the active feedback threshold, use the Band control panel [or panels] on the left of the screen:
<- Press here.
On the right side of the screen:1.The Photofill object:
Go to the photofill section for instructions on changing photos.2.The OnTarget Bar:
© 2010 Clarity Enterprises, Inc. 10

The Red Bar steps up with each correct response. When the Red Bar completes a cycle, it steps up the yellow Laps line by on unit, and resets itself to zero.3.SC-Arousal & Temp-Arousal Bars:
The small bars remind you of important changes – rapid shifts in SC, and rapid shifts in temperature.
On the bottom, EVENT MARKER, SC, temp, and Respiration are shown in a black background.
The loop ends.A pause period begins, and the screen returns to the Subjective Report screen:
© 2010 Clarity Enterprises, Inc. 11

Ask the client to rank his relaxation [or attention] once again.Ready? Click on the bottom to continue.
Wait for 5 seconds while the new Ratings data is being recorded.You will be taken to a data management screen, where you may Fine-tune Thresholds:
This is not a feedback screen. It is a progress report screen. It reports how successful you were in setting the threshold for the active band or bands. Active bands are marked by a colored circle. In this example, A1 is the active screen.
Adjust the graph time to see haw your initial threshold value worked out. If it appears to be too easy, raise the threshold. If it is too hard, lower it. Now is the time for you to discuss strategies with the client. Now is the time to inform the client that you may need to adjust thresholds or de-activate a Band Control Box.Ready? Find the ‘Click here to continue’ on the bottom of the screen.
Press the bottom bar to continue. Wait 5 seconds for the data to be updated.
You will be returned to the first feedback screen, the one you started with.
© 2010 Clarity Enterprises, Inc. 12

SIDEBAR: Make adjustments as needed. Allow the client time to focus on the task. Try to shape the threshold response at the beginning of the trial, and inform the client of the changes.
At the end of the segment, the screen again switches to the Ratings Scale. Ask for an updated rating, and click below to continue to the Fine Tuning Screen. After tuning, click below to return to the feedback screen.
This cycle repeats 5 times.At the end of the last cycle, you are prompted to Exit and Save the data.
Follow the instructions to save and exit the program.
SIDEBAR: You cannot resume the program. You must exit.
FINE TUNING
Each EEG channel will have from two to four bands connected to it. The bands are color-coded to match the trace color of the channel they are connected to. They are further identified by 10-20 system name (only if you chose the site in the first ‘Welcome’ screen).
© 2010 Clarity Enterprises, Inc. 13

In this example, Band 2-A indicates that this trace represents the second band connected to the A channel. This name will be used in feedback displays and in recorded data.
Here the threshold is 0.8.
Adjust threshold to 2.0, and the signal ‘shrinks.’This is because the Thresholds are fixed at 25 and 75 %.
SIDEBAR: If you adjust the Average [AVG ADJ] to 1000 mec, note that the peak signal is both smoothed and delayed. We do not recommend delayed feedback for beginners.
© 2010 Clarity Enterprises, Inc. 14

FDBK ON / FDBK OFFThe Band ON/OFF button in the upper left corner of the band display controls whether
the band is used as feedback. If this button is toggled OFF, this band is not used for feedback and the top right color bar is grey.
Art On / Art Off - Artifact is calculated automatically on the Artifact Band [usually Band 3, [4 Site EEG] or Band 4 of [2 site EEG].Artifact is expressed as a tine orange trace inside the regular Band boxes.For now, leave it as it is.
AUTOTHRESHOLD BUTTON: Be very careful with auto-threshold.When enabled from the Band Control Box, it will automatically adjust the threshold for that band about once every few seconds. This will drive your clients crazy! Do not use it! There is another way of providing Auto-Thresh h olding if it is absolutely needed. This will be noted later.
Basics:
STANDARD BAND TYPES:The normal convention for setting up the bands is to use:Band 1 for Reinforcement [‘Above Threshold’]Band 2 for Inhibit, [‘Below Threshold’]Band 3 for Artifact inhibit [‘Feedback Off’ or ‘’Below Threshold’].’ONE OR TWO INHIBIT BANDS? You should set up a minimum of two Inhibit bands to eliminate artifact as follows:•Inhibit settings of 1-4 Hz for eye blink and lead motion attached to a frontally located lead and•Inhibit settings of 30-60 Hz for EMG attached to any site.•OTHER ADJUSTMENT BUTTONS:
EEG Threshold Adjustments - Overview
© 2010 Clarity Enterprises, Inc. 15

The two horizontal lines in the graph area are the physical positions of the threshold. The threshold lines do not move. Only the scale of the display changes. The controls on the right side of the band are for setting threshold. When the signal line crosses either of the threshold lines the threshold state changes. The effect of this change is determined by the position of the Above/Below Threshold button.•A green color bar at the top of the controls to the right of the signal band indicates that your threshold target has been met. •Any red bar on the screen will stop feedback.
•When all bands are within target for the length of time (called a ‘step’) that you specify, feedback is given. Feedback will only occur if all bars are green . No feedback will be given if any bar is red.
SIDEBARSPECIAL ARTIFACT-ACTIVE THRESHOLDThe bottom band, Band A4, detects artifact. It has a different color threshold line. The lines are orange.Go to the Artifact Section for details.
MORE ON SPECIAL PAUSE AT THE MOMENT OF SUCCESSFUL FEEDBACK: By default, when EEG bands achieve success at the same time, a sound announces the success and the screen temporarily pauses [‘freezes’] for 2 seconds. This is called a ‘Special Pause,’ or a Success-Pause.•For example, if the EEG Above-Threshold Band signal has been inside the threshold lines for some time and it crosses outside either threshold line, the indicator will change state and the indicator will turn green.•When the ‘green’ [success] state is enabled, the feedback screen freezes and holds state for 2 seconds regardless of what the signal does. This prevents the indicator and feedback display scrolling on after feedback is achieved. There is no delay when crossing the threshold in the success or non-success direction.’
© 2010 Clarity Enterprises, Inc. 16

SIG’: The number to the left of “SIG” indicates the amplitude of the signal in peak microvolts. The number to the left of “THR” indicates the amplitude of the target threshold. Below this is the percentage of the time that threshold is achieved. Above/Below Th Settings The controls on the right side of the band are for setting threshold. When the signal line crosses either of the threshold lines the threshold state changes.
The effect of this change is determined by the position of the ABOVE / BELOW THR button.SIDEBAR: A green color bar at the top of the controls to the right of the signal band indicates that your threshold target has been met. Any red bar on the screen will stop feedback. When all bands are within target for the length of time (step) that you specify, feedback is given. Feedback will only occur if all bars are green or red.
If the signal has been inside the threshold lines for some time and it crosses outside either threshold line, the indicator will change state. There is no delay when crossing the threshold in the success direction, unless you activate AVERAGE ADJUST button.
If the Above/Below Th button is toggled on to “Above Th”, the signal line must extend beyond both the top and bottom threshold lines in order for the green indicator bar to show that the target threshold for this band has been met.
If the Above/Below Th button is toggled on to “Below Th”, the signal line must remain within both threshold lines in order for the green indicator bar to show that the target threshold for this band has been met.
MAN Threshold vs. AUTO Threshold ModeA-Th OFF: OFF is the preferred default state. If AUTO Th OFF is selected, the up/down THR. ADJ. arrows found on the other side box can be used to manually increase or decrease the threshold value. You can manipulate the threshold according to the client’s signal amplitude to achieve a desired success average.
A-Th ON Be very careful with auto-threshold.When enabled, it will automatically adjust the threshold value. The update time in seconds is shown on the right side bar. Here it is 1 s [one second]:
© 2010 Clarity Enterprises, Inc. 17

This means that the auto-threshold value is calculated over the last one second..A one second update makes the Threshold jump from second to second, and is quite confusing. You need to select a much longer update time, and that is only possible using the special Auto-Threshold Button, and this button is only available on a Master Screen, the Auto-Threshold Adj Screen [see Master Screens, below].The Autothreshold Button, if used, must be enabled. Once enabled on a master screen find the AutoThreshold Control Button:
Manually adjust the time to at least 20 seconds, and preferably 120 seconds. Explain to the client that every 120 seconds the computer will make a small adjustment to try to keep the goal at about 66% of the last minute.
Two kinds of EEG Signal Smoothing: Using Average AdjustThe AVG ADJ function is in two places. One smoothes one band, and the other smoothes all bands.
1. AVG ADJ Single-Band– Enable it here to change just that Band – it smoothes that band, while all others are unsmoothed.This is used by some who are training longer EEG band ‘states’ like ‘alpha’ and want to ignore minor drop outs. Smoothing averages the signal, making occasional brief drop outs disappear to the client.
© 2010 Clarity Enterprises, Inc. 18

The up-down buttons to the left of the “Avg Adjust” label increase or decrease the averaging function (smoothing) of a single signal
2. AVG ADJ All-Bands – Enable it here to change ALL Bands..
Again, this button is only found on the Master Screens.Use this button if you are giving more than one signal for smoothed feedback.
Types of EEG FeedbackThe EEG applications are set up to do two different types of feedback with different audio feedback and display options for each type.
The first is traditional threshold-driven continuous reinforcement with feedback consisting of MIDI synthesizer music, recorded voice or music WAV files, Media Player video files or music CDs. This type of feedback is controlled using the Sound Select window described in the Audio Features section. To control feedback you can use individual bands or you can combine all bands that are turned on into one signal (called “yoked thresholds”) by selecting “Audio All Thr Tune” or “All Bands”. This type of continuously running feedback is turned on when all thresholds are grey or green and feedback turned off when any threshold turns red.
The second type of feedback is response-reward-timeout feedback with a beginning, discreet steps, and an end, which is a reward period after a fixed number of steps. Progress is measured in rewards per minute. Rewards consist of pictures revealed in steps or specialized AVI files that show one image frame per step.
EEG Feedback: OnTarget BarThe Score or OnTarget function is designed to provide a discrete reward event achieved by holding a set of threshold conditions for an interval of time [response time]. Examples are: displaying a new portion of a larger picture puzzle or displaying the next picture in a sequence of pictures.
© 2010 Clarity Enterprises, Inc. 19

Success indicator: Green = On Target
Failure indicator: Red= Not On Target.
Success is determined by the position of the ABOVE / BELOW THR button.A green color bar at the top of the controls to the right of the signal band indicates that your threshold target has been met. Any red bar on the screen will stop feedback. When all bands are within target for the length of time (step) that you specify response time], feedback [Score or OnTarget] is given. Feedback will only occur if all bars are green or red.
The OnTarget function combines the threshold outputs from all EEG bands into a single output.
When all band indicators are either green or grey (off), indicating a threshold success state, the Score timer is started. Example: Here we have 3 bands. When each band keeps it’s signal above the criterion threshold for ½ sec – ALL AT THE SAME TIME – all criteria are met, the ready-to-START Bar temporarily freezes green, and the red OnTarget bar advances one step while triggering a brief sound [beep or chirp] and holding all displays frozen for 2 seconds:
Band A1 + Band A2 + Band A3 + + = ‘START’ criteria met -> OnTarget Steps & Hold for 2 seconds
½ sec ½ sec ½ sec ½ sec 2 sec Special Pause
Feedback is provided after a time interval that you specify. Default is ½ sec. Each time the combined[ Threshold + Time Held] Criteria is met, the START bar freezes temporarily, and the feedback is provided the red OnTarget bar moves one step to the right and holds for a fixed time. Default is 2 seconds.
Here the criteria have not been met, and START is grey- currently inactive.
© 2010 Clarity Enterprises, Inc. 20
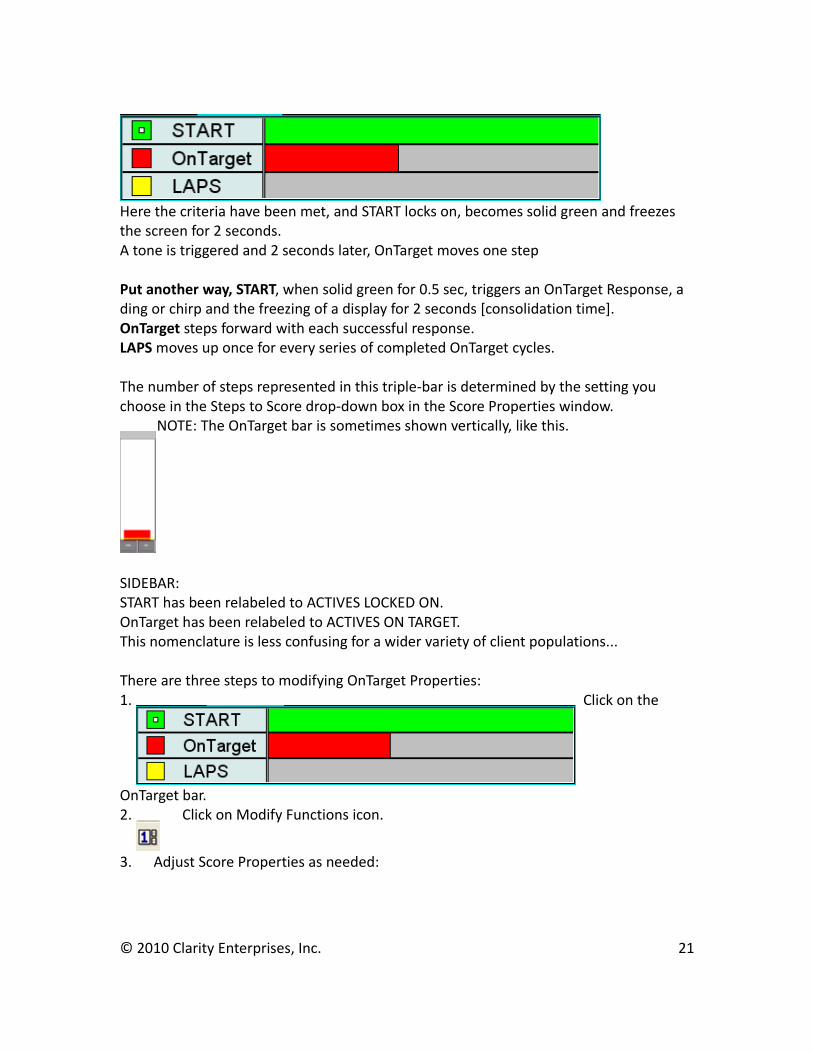
Here the criteria have been met, and START locks on, becomes solid green and freezes the screen for 2 seconds.A tone is triggered and 2 seconds later, OnTarget moves one step
Put another way, START, when solid green for 0.5 sec, triggers an OnTarget Response, a ding or chirp and the freezing of a display for 2 seconds [consolidation time].OnTarget steps forward with each successful response.LAPS moves up once for every series of completed OnTarget cycles.
The number of steps represented in this triple-bar is determined by the setting you choose in the Steps to Score drop-down box in the Score Properties window.
NOTE: The OnTarget bar is sometimes shown vertically, like this.
SIDEBAR:START has been relabeled to ACTIVES LOCKED ON.OnTarget has been relabeled to ACTIVES ON TARGET.This nomenclature is less confusing for a wider variety of client populations...
There are three steps to modifying OnTarget Properties:1. Click on the
OnTarget bar.2. Click on Modify Functions icon.
3. Adjust Score Properties as needed:
© 2010 Clarity Enterprises, Inc. 21
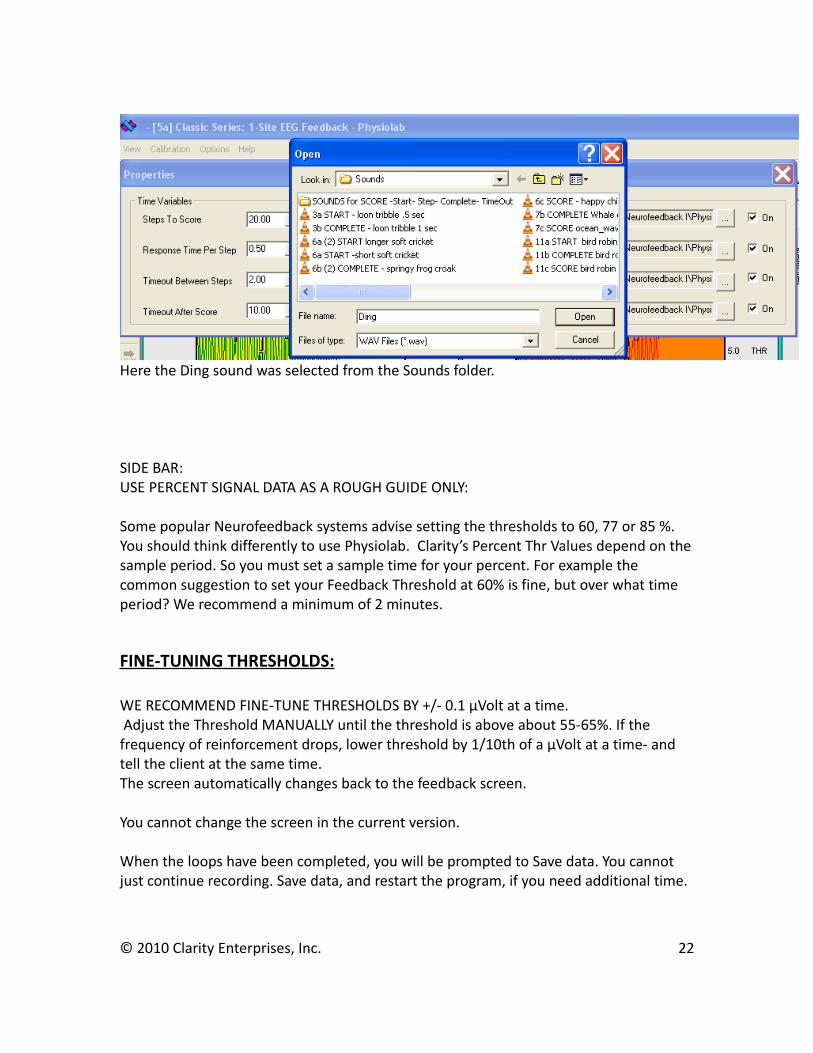
Here the Ding sound was selected from the Sounds folder.
SIDE BAR:USE PERCENT SIGNAL DATA AS A ROUGH GUIDE ONLY:
Some popular Neurofeedback systems advise setting the thresholds to 60, 77 or 85 %. You should think differently to use Physiolab. Clarity’s Percent Thr Values depend on the sample period. So you must set a sample time for your percent. For example the common suggestion to set your Feedback Threshold at 60% is fine, but over what time period? We recommend a minimum of 2 minutes.
FINE-TUNING THRESHOLDS:
WE RECOMMEND FINE-TUNE THRESHOLDS BY +/- 0.1 µVolt at a time. Adjust the Threshold MANUALLY until the threshold is above about 55-65%. If the frequency of reinforcement drops, lower threshold by 1/10th of a µVolt at a time- and tell the client at the same time.The screen automatically changes back to the feedback screen.
You cannot change the screen in the current version.
When the loops have been completed, you will be prompted to Save data. You cannot just continue recording. Save data, and restart the program, if you need additional time.
© 2010 Clarity Enterprises, Inc. 22

HOW ARTIFACT WORKS:
Artifact is detected from only one band Control Box. Artifact is shown on all bands.Artifact however is detected from only one band, the artifact band. This band control has orange threshold bars, making it unique.
SPECIAL ARTIFACT-ACTIVE THRESHOLD LINESThe bottom band, Band A4, detects artifact. It has a different color threshold line. The lines are orange.
The label also gives the name, ~ART.
To enable engaging Artifact on the Artifact Band Control, the button ART, must be ON. To disable the orange artifact line, turn ART OFF.
* Here is a typical example of how Artifact works on OTHER Bands.
© 2010 Clarity Enterprises, Inc. 23

Whenever Artifact goes above Threshold in its Control Box, it draws an orange line on all other band screens. For example, note the orange bands in the middle of the upper and middle bands.
About Neurofeedback Protocols:On the Activate and Go Screen you will find only one active band in default mode:
SIDEBAR: You are welcome to add more active feedback control boxes, and adjust band frequencies manually. And- once you have saved a session, the same bands will be re-instated under a returning client’s name.
But what if it is the first session? What if you need a different feedback setup?
Our Neurofeedback applications have a special feature, Export Settings, that comes pre-loaded with basic protocols for Neurofeedback.
© 2010 Clarity Enterprises, Inc. 24

GUIDELINES FOR ASSIGNING ACTIVE BAND FUNCTIONS:Of course you can assign any band to be active, to be above or below threshold. To standardize band assignments, the following ‘rules’ have emerged from users and workshop teaching. The normal convention for setting up the bands is:Band 1 for Reinforcement [above threshold],Band 2 for Inhibit [below threshold],Band 3 for Artifact alone [FDBK OFF] or with Inhibit [below threshold. Band 3 always draws an orange Artifact line in all displays, including Band 1 and Band 2. Selecting Band 3 for Artifact without inhibit does not stop or freeze the feedback screen. This lets the client know the only indicator of ‘success’ is a beep and a temporary screen freeze, nothing else.If you also Inhibit Band 3, the client is trained that they must stop artifact as well to advance feedback.
COMMON INHIBIT-BANDWIDTHS:If you have four bands per channel, you should set up a minimum of two ‘Inhibit’ [below threshold] bands on the bottom [e.g. A3 and A4, B3 and B4, etc], to eliminate muscle movement or eye blink or/and artifact.
Here are common inhibit bands:EYEBLINK: Inhibit settings of 1-4 Hz for eye blink and lead motion attached to a frontally located lead andEMG: Inhibit settings of 25-35 Hz for EMG attached to any site.SIDEBAR: The EMG bandwidth is that found by Dr. Barry Sterman. Others teach that these higher frequencies detect other functions. We make no claims here. It is your choice as to which bands you choose for these functions.Whole Band Inhibition: Another choice is to inhibit feedback when an entire full band is out of range [stops above threshold, so set to ‘go’ above threshold]. Select a wide band 2 to 60 Hz and a threshold of about 10 µVolts. This is a common full-band inhibit setting.
Making It Easy - Pre-Set Protocols at the touch of a button.We have provided you with a small set of research-guided EEG feedback protocols. To find them, just press the 'Save Settings' button on the bottom of the screen.
© 2010 Clarity Enterprises, Inc. 25

The 'Export Settings' Window pops up. Simply highlight the protocol, click IMPORT, and you are ready to begin.
Here is a list of commonly used protocols. Use this list as a way of learning how to make your own...
TARGET-INHIBIT COMBOs
[5a] - INSOMNIA ___ Adult 3b - 10-12 Up and 21-33 Dn at F3 and F4[5a] - INSOMNIA Child ___ 3b - 12-15 Up and 21-33 Dn at F3 and F4
[5a] - ADD Adult 1 - 4-10 Hz Dn at AFz and Cz[5a] - ADD Adult- 2- 12-15 Up Cz+15-18 Up AFz[5a] - ADD Adult- 3- 4-8 C3 and C4
[5a] - ADD Child 1- 4-8 Hz Dn at AFz and Cz[5a] - ADD Child- 2- 12-15 Up Cz+15-18 Up AFz [5a] - ADD Child- 3- 4-8 C3 and C4
[5a] - ANXIETY Adult 1- 3-10 Hz Dn at F3 and F4[5a] - ANXIETY Adult 2- 15-18 Up at F3 and F4.[5a] - ANXIETY Adult 3- 21-33 Dn at F3 and F4
[5a] - ANXIETY Child 1- 3-7 Hz Dn at FF3 and F4[5a] - ANXIETY Child 2- 13-18 Up at F3 and F4.[5a] - ANXIETY Child 3- 21-33 Dn at F3 and F4
[5a] - Autism Child 1- 13-15 Up 4-8 Dn at FCz
[5a] - Depression Adult 1 - 3-10 Dn at F5 and F7[5a] - Depression Adult 2 - 13-18 at F7 and F8.[5a] - Depression Adult 3 - 25-31 Dn at F7 and F8
[5a] - Depression Child 1 - 3-7 Dn atF5 and F7[5a] - Depression Child 2 - 13-18 at F7 and F8
[5a] - INSOMNIA _____ ___ Adult 3b - 10-12 Up and 21-33 Dn at F3 and F4[5a] - INSOMNIA Child ___ _____ 3b - 12-15 Up and 21-33 Dn at F3 and F4[5a] - INSOMNIA Child and Adult 1 - 12-15 at C3 and C4
© 2010 Clarity Enterprises, Inc. 26

[5a] - READING COMP 1 4-8 Dn at P3 and T5.[5a] - READING COMP 2 15-18 at P3 and T5
[5a] - VERBAL MEMORY 1 4-8 Dn at T3 and T5[5a] - VERBAL MEMORY 2 15-18 at T3 and T5
© 2010 Clarity Enterprises, Inc. 27

About Neurofeedback Tasks:A task is a specific program, with a start, adjustment events, and an end.Select a Task.
The default session time is five 6-minute loops, for a total of 30 minutes. Decide approximately how long your session will be – you can make it shorter or longer after starting by adjusting the TIME Button once you start.
To record EEG data simply click on any Start Task Button. Each Orange Bar activates a different Screen.
By clicking on a Task-start Button, a sequence of different Screens begin.
USE THE BOTTOM INFORMATION BAR TO CHECK TIME REMAINING:
The number to the left of Remaining indicates the number of seconds the task will run unless you change it.
TIME-REMAINING BAR:While the default timing is good for some clinics, it may need adjustment. We include a special button that allows you to increase or decrease session time at will, once the session begins.To change the time remaining, click on the Up/Down buttons.
© 2010 Clarity Enterprises, Inc. 28

Although the Time Remaining may say ‘0’, once you click on an up or down button, it will reveal the true time remaining, either 1200 or 600 or 300 seconds, depending on the application.You can use the up/down arrows to the left of this number to increase or decrease the length of the task. You can manually end the task at any time by clicking down the timer.
Selecting an EEG Screen:Neurofeedback runs best on two screens. All Primary screens allow you to fine-tune every band live during a session. We call it composing a session.
This Primary Screen shows the Special Pause [freeze] screens for clients: When OnTarget is reached, everything stops. A sound occurs and the screen ‘freezes’ for 2 seconds.
The Special Pause Graphs are very interesting to those clients who want to see exactly how well the criteria were met. The two-second pause is good for the operator, too. You get to see just how strong the signal is, and whether the client is good at sustaining a signal over many trials.SIDEBAR: Generally it is best to contrast neurofeedback bands. Try instructing clients to ‘turn off’ the tone and feedback signal for one segment, and turn it on for another. Some bands reverse easily; while some inhibit bands do not.
SPECIFIC MATCHED FEEDBACK GRAPHS:When you select a Task, you will be directed to a feedback screen on the primary screen. If this is your only screen, turn off the dual screen option. See the Physiolab manual for details.
© 2010 Clarity Enterprises, Inc. 29

If you have an extended [dual] screen, be sure to activate the Extended Desktop Mode, and the Dual screen mode.Now when you click on a primary screen, it will automatically bring up an extended screen, a slimmed-down version of the main screen.
In THR displays, the bar changes color when it crosses the threshold.All bar displays assume that band 1 is reinforcement, band 2 is inhibit and band 3 is artifact inhibit. 02 Band: up.up [A1] + [B1][^]
Typical Up/down Threshold Bars Screen.Bars ‘freeze’ for 2 seconds when OnTarget criteria are met.
03 Band: up.down [A1]./[A2][A3][o]
Typical Up/down Threshold Circles Screen.Circles ‘freeze’ for 2 seconds when OnTarget criteria are met.
01: up/down Circles+FFT
© 2010 Clarity Enterprises, Inc. 30

Typical mixed Up/down Threshold Circles plus EEG FFT Screen.Bars and FFT display ‘freezes’ for2 seconds when OnTarget criteria is met.
Raw Band Graphs are line graphs showing all of the bands in peak microvolt.
01 Band: [A1]/[A2][A3] .[=]
ABOUT FINE-TUNINGFine Tuning Graphs are a subset of Live History Graphs. Live History Graphs show live statistics of performance in the immediate past. They show overall success rate for the current task, the overall score for the previous task, and the peak microvolt averages for each band with markers to show task boundaries. History graph EEG bands are mainly used to review the session live, and make adjustments to threshold values.
© 2010 Clarity Enterprises, Inc. 31

Here is a sample from the Fine Tuning Graph. The threshold remains in the middle of the signal.While it provided feedback, the task was so easy, no learning was going to take place.
So the threshold was raised to about the 70% levels. Only high amplitude ‘bursts’ are now reinforced, and learning is more likely.
If this is difficult to see on a live history screen, use ZOOM to exaggerate seeing the History graph, then click and drag the threshold during ZOOM. Tell the client, and resume training.The program returns to the Live Threshold Fine-Tuning screen at the end of each 3 [or 5] minute cycle, to gauge whether the threshold encouraged learning.
© 2010 Clarity Enterprises, Inc. 32
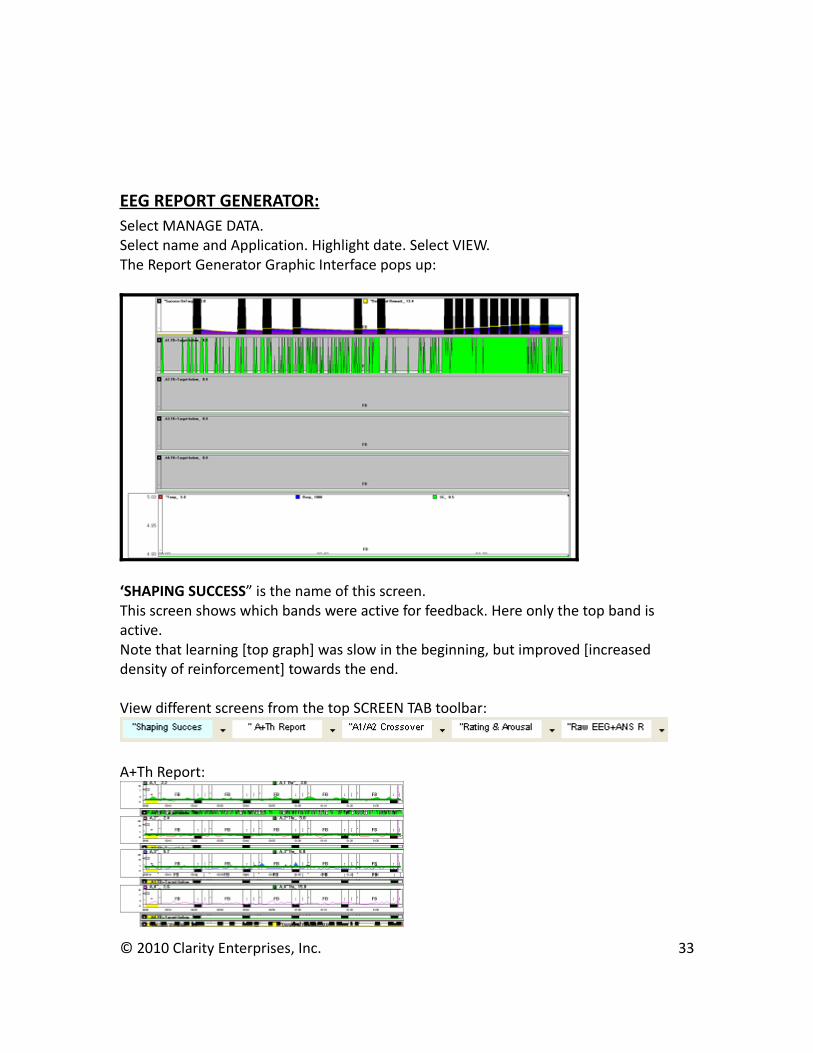
EEG REPORT GENERATOR:Select MANAGE DATA.Select name and Application. Highlight date. Select VIEW.The Report Generator Graphic Interface pops up:
‘SHAPING SUCCESS” is the name of this screen.This screen shows which bands were active for feedback. Here only the top band is active.Note that learning [top graph] was slow in the beginning, but improved [increased density of reinforcement] towards the end.
View different screens from the top SCREEN TAB toolbar:
A+Th Report:
© 2010 Clarity Enterprises, Inc. 33

All Bands from Site 1 are shown in this Report.The Thresholds are shown as well, plus the frequency with which the threshold was exceeded for reinforcement.
A1/A2 Crossover:
This Report also shows Band A1 and A2, plus the crossovers on the bottom.
‘RATINGS and Arousal:
This graph shows a new feature, the rating scale.
All BANDS’:
Here is a side by side summary of all 4 bands.
© 2010 Clarity Enterprises, Inc. 34

2-SITE NEUROFEEDBACK
C2 Plus 12 has EEG leads on inputs C & D.This allows C2 Plus 12 users to explore many different peripheral and EEG applications without the need to switch leads.
© 2010 Clarity Enterprises, Inc. 35

© 2010 Clarity Enterprises, Inc. 36

4-SITE NEUROFEEDBACKThese applications are larger versions of the One-Site Neurofeedback application.
© 2010 Clarity Enterprises, Inc. 37

Refer to that application for details.
4-SITE COMODULATIONEXPERIMENTAL. Contact Barry Sterman or David Kaiser, PhD for training.
© 2010 Clarity Enterprises, Inc. 38

COMODULATION FEEDBACK
Comodulation accesses the relationship between two sites, both at the same frequency. It is frequency-specific, and depends on the state of the two signals: if one goes up while the other goes down, they are negatively correlated. If both go in the same direction, they are positively correlated.
POLARITY
© 2010 Clarity Enterprises, Inc. 39

MAKE PROTOCOL AND GO
© 2010 Clarity Enterprises, Inc. 40

This is a magnified version of the screen shown above.WE recommend using this screen and selecting a dual screen.
This screen is arranged a little differently.Raw EEG Bands are arranged A-B C-D.Comodulation bands are in light orange.Cm AB is located between Band A and Band B.Cm AC is located between Band A and Band C.Cm BD is located between Band B and Band D.Cm CD is located between Band C and Band D.
In addition, there are two cm Bands that cross over:Cm BC is located between Band b and Band C.Cm AD is located between Band A and Band D.Crossover cm Bands are colored light blue, in the corners, on the bottom.
Start-task [Go] buttons are in orange.Decide which Bands are active. Choose the orange button that matches the active sites.Click to begin, and you are taken to the Subjective Ratings screen.
The program is identical to that presented for other Neurofeedback programs.I will not repeat it here.
Comodulation Screens
Each Comodulation Screen also shows the raw Band signals for that Band.For example, cm AB is shown with Band A1 and Band B1.
© 2010 Clarity Enterprises, Inc. 41

If you make two or more cm’s active, select one of these screens.CM+ 4 Bands
CM+Cross Bands
For Games, try these screens:
© 2010 Clarity Enterprises, Inc. 42

The screen to Fine Tune Thresholds is a little different, too:
Active Bands are marked with a Yellow Indicator Light.
The screens are similar to those for neurofeedback.See the Neurofeedback section for details.
This program is considered experimental. Ask Dr. Barry Sterman, the originator, for instruction on this application.
Combo[6a4]2EEG+SOMATIC+HRV-Profile&FB
This program uses Classic and Synchrony Feedback, plus NeurofeedbackTemp-SC on A. Respiration on B. EEG on C & D
This program detects all signals and provides both bio- and neurofeedback.
The 12-channel versions have:A. EMG, Temp/SC.B. ECG, Respiration.
© 2010 Clarity Enterprises, Inc. 43

C. EEG One.D. EEG Two..This program adds EEG to the 3d application.
So what is the relationship between peripheral and central EEG feedback?Do you want to monitor EEG while performing a biofeedback task? Do you want to monitor peripheral measures while performing EEG feedback?This is your application.
The screens are almost identical to those in application 3D.Refer to that section of the manual for details.
Includes EEG channels. Remember they connect to inputs C and D.
© 2010 Clarity Enterprises, Inc. 44

The set up screen includes two EEG bands, one for each channel.
By default, the program starts with EMG. If you want to start with a different protocol, return to the Protocol screen and activate the appropriate channels.
Early users of this program found it frustrating to keep from giving the wrong feedback by mistake. To address these concerns, we have simplified the primary screen: Every primary screen in divided in to two columns, right and left.For example, for EMG, the EMG Master Control Box is on the left:
© 2010 Clarity Enterprises, Inc. 45
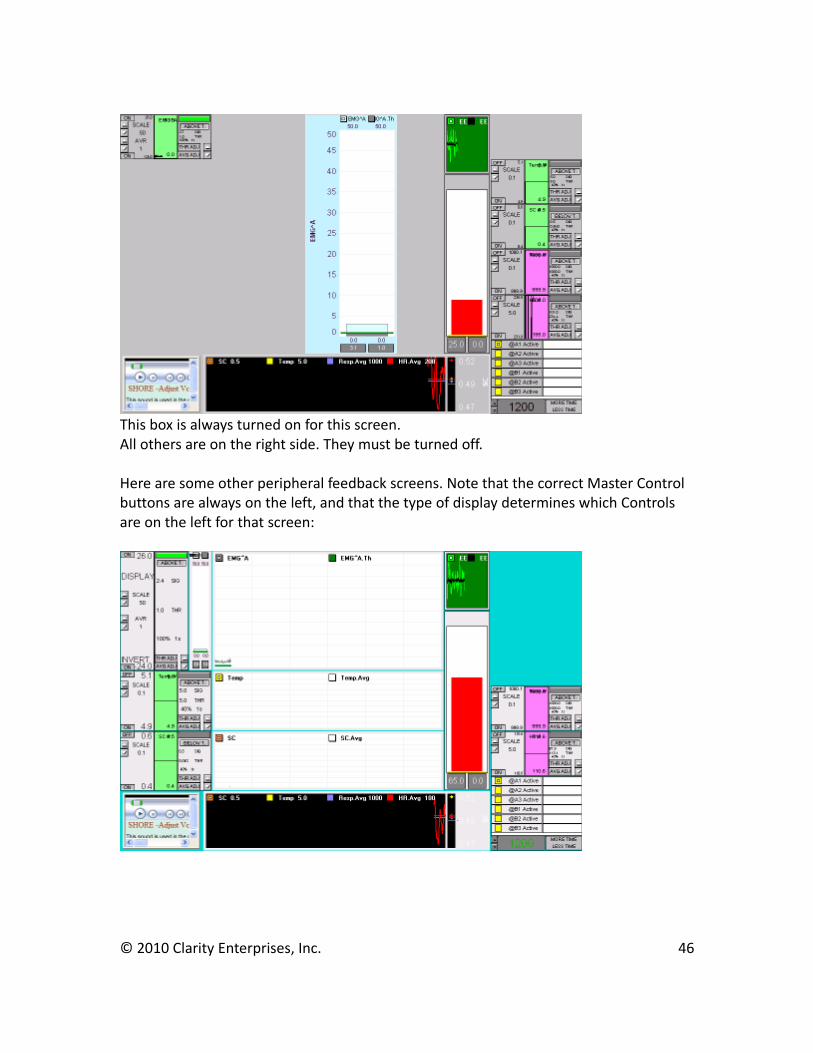
This box is always turned on for this screen.All others are on the right side. They must be turned off.
Here are some other peripheral feedback screens. Note that the correct Master Control buttons are always on the left, and that the type of display determines which Controls are on the left for that screen:
© 2010 Clarity Enterprises, Inc. 46

.
© 2010 Clarity Enterprises, Inc. 47

Games remain as before. Be sure the right signals are active.
© 2010 Clarity Enterprises, Inc. 48

This is the EXIT screen.
DATA MANAGEMENT
Data Management is similar to that found in application 3D.In addition, this application has an additional screen for EEG:
[5b4] EMG A&B. EEG C&D. Pain Control
This is a special application to monitor and provide feedback for both EEG [e.g., SMR] and for EMG. It is useful for dealing with chronic neuromuscular pain and suffering.[5b4] EMG A&B. EEG C&D. Pain Control. For C2+12 OnlyTemp-SC on A. Respiration on B. EMG on A & B. EEG on C & D.
© 2010 Clarity Enterprises, Inc. 49

The EMG impedance bands are found at the bottom of the screen/
EMG is on the left. EEG is on the right.
The EMG Master Control Boxes are on the left of the screen.
© 2010 Clarity Enterprises, Inc. 50

Simple EMG training screens have no visible EEG feedback at all.
You can add EEG Bands A1 & B1.
Or use only one EEG Band, like Band A1 shown here.
You can also use 3 Bands from One EEG Site, with EMG threshold training.
© 2010 Clarity Enterprises, Inc. 51

This is yet another way of showing EEG Bands A1 & B1 with EMG Thresholds.
Of course, Photofill Games can also be used. They are complex on the Main Screen...
.. but simple on the dual screen.
REPORT GENERATOR
© 2010 Clarity Enterprises, Inc. 52
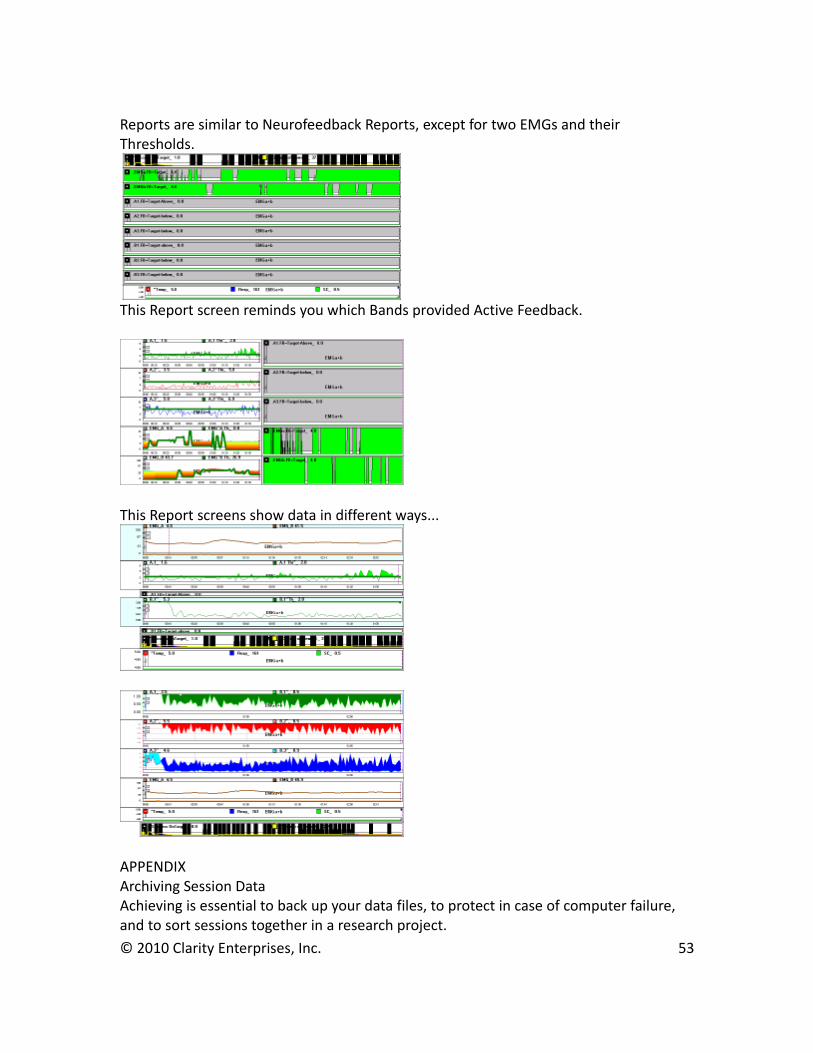
Reports are similar to Neurofeedback Reports, except for two EMGs and their Thresholds.
This Report screen reminds you which Bands provided Active Feedback.
This Report screens show data in different ways...
APPENDIXArchiving Session DataAchieving is essential to back up your data files, to protect in case of computer failure, and to sort sessions together in a research project.
© 2010 Clarity Enterprises, Inc. 53

SIDEBAR: Archiving to a folder can be very beneficial for supervision.Your interns can email session data for a single client or a group of clients. Researchers can archive session data by protocol, for example, putting all pain clients into a pain-stress profile folder.
One GB Maximum Limit on stored data for all sessions. The achieve function is critical housekeeping for your data.•After 1 GB of data is reached, the program 'dumps' the oldest files. ‘Dumped’ files cannot be retrieved.•As a caution, Clarity has added an automatic ‘warning’ pop-up message when the data folder is reaching maximum, but do not rely on it. When you have stored ½ gigabyte of data, you will start getting messages suggesting that you archive files. It is important to respond to these prompts and archive data since you will not be able to access session data if the 1 gigabyte maximum database size is reached.•If you fail to remove your data and the 1 GB limit is reached, the data management system becomes unstable. It will likely save recent data, but deletes old data. IBI data, a special case, will likely be corrupted.SOLUTIONS:• We recommend MOVING, ARCHEIVING, and COMPACTING your data weekly or monthly.•ALTERNATIVES: If the data is already very large, you may find it easier move the entire data.mdb file to a safe place, and start over.• The program will build a new data.mbd file, ready for client names and data. The old data.mdb file in a new directory is intact; it too can be reverse-archived. Open the Data Management file, and run and save a session to activate the new file. Then in Data Management, select ARCHEIVE on the side menu. In ARCHEIVE, upload old files from the old data.mdb file o the new one. When done, EXIT the application and restart it. The old data for that client is now stored in the new data.mdb file.
YOU CAN ARCHIEVE DATA IN TWO WAYS:•Achieve by Backing up [archive by copying].1.Achieve by Clearing [achieve by moving ]2.Delete File You can also just ‘delete’ a file. Once deleted, you cannot retrieve a' file.
All patient data is saved into the same Physiolab file, called data.mdb. FINDING data.mdb: To find it, use Windows Search: ‘data.mdb’.
© 2010 Clarity Enterprises, Inc. 54

To archive data, click Manage Data on the main entry menu, and then click Archive.
•In the Archiving window, select a client alias name in the Main Database drop-down box.•Select an application that has data for the client in the top drop-down box. •To select a target folder location for your archived files, click the small button to the right of the Archive textbox. •Either select an archive file name in the Open window (if you have previously archived data) or browse to the folder location where you wish to create a new archive, type a new name in the “File name” box, like ‘stress profile-01.mdb,’ and click Open. •You can choose to have a separate database file for each client or you can archive files by time period (quarterly, half-yearly, etc.)
•Back in the Archiving window, click on the date of a session in the list to the left, and then click the right arrow to move it into the list of files to be archived. •You can select and move all files in the list or you can pick and choose sessions by holding down the Control key while clicking on those you wish to archive.•Finally, click Compact Databases to free up space in the Physiolab database, confirm by clicking yes, and click Close to exit the window.
1.COPY ONLY: You can copy a file for a colleague, and keep the original in data.mdb.2.If you wish to copy a file into a new data location, while leaving the original file in place, follow the procedure for archiving files, but click the Copy dot before you click the
© 2010 Clarity Enterprises, Inc. 55

right arrow to move files into the right side of the Archiving window (This does not free up space in the data.mdb file). Click Close to exit the window.
MOVE BACK: You may receive a file from a colleague. To view it, transfer the file back using Archive window. At any time you can move archived files back into the original Physiolab database to view them. Follow the same procedure for archiving files, but select archived sessions in the right side of the Archiving window and use the left arrow to move them back into Physiolab. However this only works if you have the same application installed. If someone sends a stress profile, and you do not have that profile in your Clarity applications already, you cannot move it back or view it.
© 2010 Clarity Enterprises, Inc. 56