HOW TO READ A PAPER - Viv'z Blogvivrolfe.com/ProfDoc/Assets/How-to-Read-a-Paper_Evidence-Based...HOW...
240
Transcript of HOW TO READ A PAPER - Viv'z Blogvivrolfe.com/ProfDoc/Assets/How-to-Read-a-Paper_Evidence-Based...HOW...


HOW TO READ A PAPERThe basics of evidence based medicine
Second edition
TRISHA GREENHALGHDepartment of Primary Care and Population Sciences
Royal Free and University College Medical SchoolLondon, UK

© BMJ Books 2001
All rights reserved. No part of this publication may be reproduced, stored in aretrieval system, or transmitted, in any form or by any means, electronic,
mechanical, photocopying, recording and/or otherwise, without the prior writtenpermission of the publishers.
First published in 1997 Second impression 1997 Third impression 1998 Fourth impression 1998 Fifth impression 1999 Sixth impression 2000
Seventh impression 2000 Second Edition 2001
by the BMJ Publishing Group, BMA House, Tavistock Square,London WC1H 9JRwww.bmjbooks.com
British Library Cataloguing in Publication Data
A catalogue record for this book is available from the British Library
ISBN 0-7279-1578-9
Cover by Landmark Design, Croydon, SurreyTypeset by FiSH Books, London
Printed and bound by MPG Books Ltd, Bodmin

Contents
Foreword to the first edition ix
Preface xiii
Preface to the first edition: Do you need to read this book? xv
Acknowledgments xvii
1 Why read papers at all? 1
Does “evidence based medicine” simply mean “reading medical papers”? 1
Why do people often groan when you mention evidencebased medicine? 3
Before you start: formulate the problem 8
2 Searching the literature 15
Reading medical articles 15
The Medline database 16
Problem 1:You are trying to find a particular paper which you know exists 17
Problem 2:You want to answer a very specific clinical question 22
Problem 3:You want to get general information quicklyabout a well defined topic 25
Problem 4:Your search gives you lots of irrelevant articles 29
Problem 5:Your search gives you no articles at all or not as many as you expected 30
v

Problem 6:You don’t know where to start searching 32
Problem 7:Your attempt to limit a set leads to loss ofimportant articles but does not exclude those of lowmethodological quality 33
Problem 8: Medline hasn’t helped, despite a thoroughsearch 34
The Cochrane Library 36
3 Getting your bearings (what is this paper about?) 39
The science of “trashing” papers 39
Three preliminary questions to get your bearings 41
Randomised controlled trials 46
Cohort studies 50
Case-control studies 51
Cross-sectional surveys 52
Case reports 53
The traditional hierarchy of evidence 54
A note on ethical considerations 55
4 Assessing methodological quality 59
Was the study original? 59
Who is the study about? 60
Was the design of the study sensible? 62
Was systematic bias avoided or minimised? 64
Was assessment “blind”? 68
Were preliminary statistical questions addressed? 69
Summing up 73
5 Statistics for the non-statistician 76
How can non-statisticians evaluate statistical tests? 76
vi

Have the authors set the scene correctly? 78
Paired data, tails, and outliers 83
Correlation, regression and causation 85
Probability and confidence 87
The bottom line (quantifying the risk of benefit and harm) 90
Summary 92
6 Papers that report drugs trials 94
“Evidence” and marketing 94
Making decisions about therapy 96
Surrogate endpoints 97
How to get evidence out of a drug rep 101
7 Papers that report diagnostic or screening tests 105
Ten men in the dock 105
Validating diagnostic tests against a gold standard 106
Ten questions to ask about a paper which claims to validate a diagnostic or screening test 111
A note on likelihood ratios 116
8 Papers that summarise other papers (systematic reviews and meta-analyses) 120
When is a review systematic? 120
Evaluating systematic reviews 123
Metaanalysis for the non-statistician 128
Explaining heterogeneity 133
9 Papers that tell you what to do (guidelines) 139
The great guidelines debate 139
Do guidelines change clinicians’ behaviour? 141
Questions to ask about a set of guidelines 144
vii

10 Papers that tell you what things cost (economic analyses) 151
What is economic analysis? 151
Measuring the costs and benefits of health interventions 153
Ten questions to ask about an economic analysis 158
Conclusion 163
11 Papers that go beyond numbers (qualitative research) 166
What is qualitative research? 166
Evaluating papers that describe qualitative research 170
Conclusion 176
12 Implementing evidence based findings 179
Surfactants versus steroids: a case study in adopting evidencebased practice 179
Changing health professionals’ behaviour: evidence from studies on individuals 181
Managing change for effective clinical practice: evidencefrom studies on organisational change 188
The evidence based organisation: a question of culture 189
Theories of change 193
Priorities for further research on the implementation process 195
Appendix 1: Checklists for finding, appraising, and implementing evidence 200
Appendix 2: Evidence based quality filters for everyday use 210
Appendix 3: Maximally sensitive search strings (to be used mainly for research) 212
Appendix 4: Assessing the effects of an intervention 215
Index 216
viii

Foreword to the firstedition
Not surprisingly, the wide publicity given to what is now called“evidence based medicine” has been greeted with mixed reactionsby those who are involved in the provision of patient care.The bulkof the medical profession appears to be slightly hurt by theconcept, suggesting as it does that until recently all medicalpractice was what Lewis Thomas has described as a frivolous andirresponsible kind of human experimentation, based on nothingbut trial and error and usually resulting in precisely that sequence.On the other hand, politicians and those who administrate ourhealth services have greeted the notion with enormous glee. Theyhad suspected all along that doctors were totally uncritical and nowthey had it on paper. Evidence based medicine came as a gift fromthe gods because, at least as they perceived it, its implied efficiencymust inevitably result in cost saving.
The concept of controlled clinical trials and evidence basedmedicine is not new, however. It is recorded that Frederick II,Emperor of the Romans and King of Sicily and Jerusalem, wholived from 1192 to 1250 AD and who was interested in the effectsof exercise on digestion, took two knights and gave them identicalmeals. One was then sent out hunting and the other ordered tobed. At the end of several hours he killed both and examined thecontents of their alimentary canals; digestion had proceededfurther in the stomach of the sleeping knight. In the 17th centuryJan Baptista van Helmont, a physician and philosopher, becamesceptical of the practice of bloodletting. Hence he proposed whatwas almost certainly the first clinical trial involving large numbers,randomisation, and statistical analysis. This involved taking200–500 poor people, dividing them into two groups by casting
ix

lots and protecting one from phlebotomy while allowing the otherto be treated with as much bloodletting as his colleagues thoughtappropriate. The number of funerals in each group would be usedto assess the efficacy of bloodletting. History does not record whythis splendid experiment was never carried out.
If modern scientific medicine can be said to have had abeginning, it was in Paris in the mid-19th century where it had itsroots in the work and teachings of Pierre Charles Alexandre Louis.Louis introduced statistical analysis to the evaluation of medicaltreatment and, incidentally, showed that bloodletting was avalueless form of treatment, though this did not change the habitsof the physicians of the time or for many years to come. Despitethis pioneering work, few clinicians on either side of the Atlanticurged that trials of clinical outcome should be adopted, althoughthe principles of numerically based experimental design wereenunciated in the 1920s by the geneticist Ronald Fisher. The fieldonly started to make a major impact on clinical practice after theSecond World War following the seminal work of Sir AustinBradford Hill and the British epidemiologists who followed him,notably Richard Doll and Archie Cochrane.
But although the idea of evidence based medicine is not new,modern disciples like David Sackett and his colleagues are doing agreat service to clinical practice, not just by popularising the ideabut by bringing home to clinicians the notion that it is not a dryacademic subject but more a way of thinking that should permeateevery aspect of medical practice. While much of it is based onmegatrials and meta-analyses, it should also be used to influencealmost everything that a doctor does. After all, the medicalprofession has been brainwashed for years by examiners in medicalschools and Royal Colleges to believe that there is only one way ofexamining a patient. Our bedside rituals could do with as muchcritical evaluation as our operations and drug regimes; the samegoes for almost every aspect of doctoring.
As clinical practice becomes busier and time for reading andreflection becomes even more precious, the ability effectively toperuse the medical literature and, in the future, to become familiarwith a knowledge of best practice from modern communicationsystems will be essential skills for doctors. In this lively book,TrishaGreenhalgh provides an excellent approach to how to make best useof medical literature and the benefits of evidence based medicine. It
HOW TO READ A PAPER
x

should have equal appeal for first-year medical students and grey-haired consultants and deserves to be read widely.
With increasing years, the privilege of being invited to write aforeword to a book by one’s ex-students becomes less of a rarity.Trisha Greenhalgh was the kind of medical student who never lether teachers get away with a loose thought and this inquiringattitude seems to have flowered over the years; this is a splendidand timely book and I wish it all the success it deserves. After all,the concept of evidence based medicine is nothing more than thestate of mind that every clinical teacher hopes to develop in theirstudents; Dr Greenhalgh’s sceptical but constructive approach tomedical literature suggests that such a happy outcome is possible atleast once in the lifetime of a professor of medicine.
Professor Sir David Weatherall
FOREWORD
xi

In November 1995, my friend Ruth Holland, bookreviews editor of the British Medical Journal,suggested that I write a book to demystify theimportant but often inaccessible subject of evidencebased medicine. She provided invaluable commentson earlier drafts of the manuscript but was tragicallykilled in a train crash on 8th August 1996. This bookis dedicated to her memory.
xii

Preface
When I wrote this book in 1996, evidence based medicine was a bitof an unknown quantity. A handful of academics (including me)were enthusiastic and had already begun running “training thetrainers” courses to disseminate what we saw as a highly logical andsystematic approach to clinical practice. Others – certainly themajority of clinicians – were convinced that this was a passing fadthat was of limited importance and would never catch on. I wroteHow to read a paper for two reasons. First, students on my owncourses were asking for a simple introduction to the principlespresented in what was then known as “Dave Sackett’s big redbook” (Sackett DL, Haynes RB, Guyatt GH, Tugwell P. Clinicalepidemiology – a basic science for clinical medicine. London: Little,Brown, 1991) – an outstanding and inspirational volume that wasalready in its fourth reprint, but which some novices apparentlyfound a hard read. Second, it was clear to me that many of thecritics of evidence based medicine didn’t really understand whatthey were dismissing and that until they did, serious debate on thepolitical, ideological, and pedagogical place of evidence basedmedicine as a discipline could not begin.
I am of course delighted that How to read a paper has become astandard reader in many medical and nursing schools and has sofar been translated into French, German, Italian, Polish, Japanese,and Russian. I am also delighted that what was so recently a fringesubject in academia has been well and truly mainstreamed inclinical service in the UK. For example, it is now a contractualrequirement for all doctors, nurses, and pharmacists to practise(and for managers to manage) according to best research evidence.
In the three and a half years since the first edition of this bookwas published, evidence based medicine has become a growthindustry. Dave Sackett’s big red book and Trisha Greenhalgh’s littleblue book have been joined by some 200 other textbooks and 1500journal articles offering different angles on the 12 topics covered
xiii

briefly in the chapters which follow. My biggest task in preparingthis second edition has been to update and extend the referencelists to reflect the wide range of excellent material now available tothose who wish to go beyond the basics. Nevertheless, there isclearly still room on the bookshelves for a no-frills introductory textso I have generally resisted the temptation to go into greater depthin these pages.
Trisha Greenhalgh
HOW TO READ A PAPER
xiv

Preface to the firstedition: Do you need to read this book?
This book is intended for anyone, whether medically qualified ornot, who wishes to find their way into the medical literature, assessthe scientific validity and practical relevance of the articles theyfind, and, where appropriate, put the results into practice. Theseskills constitute the basics of evidence based medicine.
I hope this book will help you to read and interpret medicalpapers better. I hope, in addition, to convey a further message,which is this. Many of the descriptions given by cynics of whatevidence based medicine is (the glorification of things that can bemeasured without regard for the usefulness or accuracy of what ismeasured; the uncritical acceptance of published numerical data;the preparation of all-encompassing guidelines by self-appointed“experts” who are out of touch with real medicine; the debasementof clinical freedom through the imposition of rigid and dogmaticclinical protocols; and the overreliance on simplistic, inappropriate,and often incorrect economic analyses) are actually criticisms ofwhat the evidence based medicine movement is fighting against,rather than of what it represents.
Do not, however, think of me as an evangelist for the gospelaccording to evidence based medicine. I believe that the science offinding, evaluating and implementing the results of medicalresearch can, and often does, make patient care more objective,more logical, and more cost effective. If I didn’t believe that, Iwouldn’t spend so much of my time teaching it and trying, as ageneral practitioner, to practise it. Nevertheless, I believe that whenapplied in a vacuum (that is, in the absence of common sense andwithout regard to the individual circumstances and priorities of the
xv

person being offered treatment), the evidence based approach topatient care is a reductionist process with a real potential for harm.
Finally, you should note that I am neither an epidemiologist nora statistician but a person who reads papers and who has developeda pragmatic (and at times unconventional) system for testing theirmerits. If you wish to pursue the epidemiological or statisticalthemes covered in this book, I would encourage you to move on toa more definitive text, references for which you will find at the endof each chapter.
Trisha Greenhalgh
HOW TO READ A PAPER
xvi

Acknowledgments
I am not by any standards an expert on all the subjects covered inthis book (in particular, I am very bad at sums) and I am gratefulto the people listed below for help along the way. I am, however, thefinal author of every chapter and responsibility for any inaccuraciesis mine alone.
1. To PROFESSOR DAVE SACKETT and PROFESSOR ANDY HAINES
who introduced me to the subject of evidence based medicineand encouraged me to write about it.
2. To DR ANNA DONALD, who broadened my outlook throughvaluable discussions on the implications and uncertainties of thisevolving discipline.
3. To the following medical informaticists (previously known aslibrarians), for vital input into Chapter 2 and the appendices onsearch strings: MR REINHARDT WENTZ of Charing Cross andWestminster Medical School, London; MS JANE ROWLANDS ofthe BMA library in London; MS CAROL LEFEBVRE of the UKCochrane Centre, Summertown Pavilion, Oxford; and MS
VALERIE WILDRIDGE of the King’s Fund library in London. Istrongly recommend Jane Rowlands’ Introductory andAdvanced Medline courses at the BMA library.
4. To the following expert advisers and proofreaders: DR SARAH
WALTERS and DR JONATHAN ELFORD (Chapters 3, 4, and 7), DR
ANDREW HERXHEIMER (Chapter 6), PROFESSOR SIR IAIN
CHALMERS (Chapter 8), PROFESSOR BRIAN HURWITZ (Chapter9), PROFESSOR MIKE DRUMMOND and DR ALISON TONKS
(Chapter 10), PROFESSOR NICK BLACK and DR ROD TAYLOR
(Chapter 11), and MR JOHN DOBBY (Chapters 5 and 12).
5. To MR NICK MOLE, of Ovid Technologies Ltd, for checkingChapter 2 and providing demonstration software for me to playwith.
xvii

6. To the many people, too numerous to mention individually, whotook time to write in and point out both typographical andfactual errors in the first edition. As a result of their contribu-tions, I have learnt a great deal (especially about statistics) andthe book has been improved in many ways. Some of the earliestcritics of How to Read a Paper have subsequently worked with meon my teaching courses in evidence based practice; several haveco-authored other papers or book chapters with me, and one ortwo have become personal friends.
Thanks also to my family for sparing me the time and space tofinish this book.
HOW TO READ A PAPER
xviii
Chapter 1: Why readpapers at all?
1.1 Does “evidence based medicine” simply mean“reading medical papers”?
Evidence based medicine is much more than just reading papers.According to the most widely quoted definition, it is “theconscientious, explicit and judicious use of current best evidence inmaking decisions about the care of individual patients”.1 I find thisdefinition very useful but it misses out what for me is a veryimportant aspect of the subject – and that is the use ofmathematics. Even if you know almost nothing about evidencebased medicine you know it talks a lot about numbers and ratios!Anna Donald and I recently decided to be upfront about this andproposed this alternative definition:
“Evidence-based medicine is the enhancement of a clinician’straditional skills in diagnosis, treatment, prevention and related areasthrough the systematic framing of relevant and answerable questionsand the use of mathematical estimates of probability and risk”.2
If you follow an evidence based approach, therefore, all sorts ofissues relating to your patients (or, if you work in public healthmedicine, planning or purchasing issues relating to groups ofpatients or patient populations) will prompt you to ask questionsabout scientific evidence, seek answers to those questions in asystematic way, and alter your practice accordingly.
You might ask questions, for example, about a patient’ssymptoms (“In a 34 year old man with left-sided chest pain, whatis the probability that there is a serious heart problem, and if thereis, will it show up on a resting ECG?”), about physical or diagnosticsigns (“In an otherwise uncomplicated childbirth, does the
1

presence of meconium [indicating fetal bowel movement] in theamniotic fluid indicate significant deterioration in the physiologicalstate of the fetus?”), about the prognosis of an illness (“If apreviously well 2 year old has a short fit associated with a hightemperature, what is the chance that she will subsequently developepilepsy?”), about therapy (“In patients with an acute myocardialinfarction [heart attack], are the risks associated with thrombolyticdrugs [clotbusters] outweighed by the benefits, whatever thepatient’s age, sex, and ethnic origin?”), about cost effectiveness(“In order to reduce the suicide rate in a health district, is it betterto employ more consultant psychiatrists, more communitypsychiatric nurses or more counsellors?”), and about a host ofother aspects of health and health services.
Professor Dave Sackett, in the opening editorial of the very firstissue of the journal evidence based Medicine,3 summarised theessential steps in the emerging science of evidence based medicine.
• To convert our information needs into answerable questions (i.e.to formulate the problem).
• To track down, with maximum efficiency, the best evidence withwhich to answer these questions – which may come from theclinical examination, the diagnostic laboratory, the publishedliterature or other sources.
• To appraise the evidence critically (i.e. weigh it up) to assess itsvalidity (closeness to the truth) and usefulness (clinicalapplicability).
• To implement the results of this appraisal in our clinical practice.
• To evaluate our performance.
Hence, evidence based medicine requires you not only to readpapers but to read the right papers at the right time and then to alteryour behaviour (and, what is often more difficult, the behaviour ofother people) in the light of what you have found. I am concernedthat the plethora of how-to-do-it courses in evidence basedmedicine so often concentrate on the third of these five steps(critical appraisal) to the exclusion of all the others.Yet if you haveasked the wrong question or sought answers from the wrongsources, you might as well not read any papers at all. Equally, allyour training in search techniques and critical appraisal will go to
HOW TO READ A PAPER
2
waste if you do not put at least as much effort into implementingvalid evidence and measuring progress towards your goals as youdo into reading the paper.
If I were to be pedantic about the title of this book, these broaderaspects of evidence based medicine should not even get a mentionhere. But I hope you would have demanded your money back if Ihad omitted the final section of this chapter (Before you start:formulate the problem), Chapter 2 (Searching the literature), andChapter 12 (Implementing evidence based findings). Chapters3–11 describe step three of the evidence based medicine process:critical appraisal, i.e. what you should do when you actually havethe paper in front of you.
Incidentally, if you are computer literate and want to explore thesubject of evidence based medicine on the Internet, you could trythe following websites. If you’re not, don’t worry (and don’t worryeither when you discover that there are over 200 websites dedicatedto evidence based medicine – they all offer very similar materialand you certainly don’t need to visit them all).
• Oxford Centre for evidence based Medicine A well keptwebsite from Oxford, UK, containing a wealth of resources andlinks for EBM. http://cebm.jr2.ox.ac.uk
• POEMs (Patient Oriented Evidence that Matters)Summaries of evidence that is felt to have a direct impact onpatients’ choices, compiled by the US Journal of Family Practice.http://jfp.msu.edu/jclub/indexes/jcindex.htm
• SCHARR Auracle Evidence based, information seeking, wellpresented links to other evidence based health care sites by theSheffield Centre for Health and Related Research in the UK.http://panizzi.shef.ac.uk/auracle/aurac.html
1.2 Why do people often groan when you mentionevidence based medicine?
Critics of evidence based medicine might define it as: “theincreasingly fashionable tendency of a group of young, confidentand highly numerate medical academics to belittle the performanceof experienced clinicians using a combination of epidemiologicaljargon and statistical sleight-of-hand” or “the argument, usually
WHY READ PAPERS AT ALL?
3

presented with near-evangelistic zeal, that no health related actionshould ever be taken by a doctor, a nurse, a purchaser of healthservices or a politician unless and until the results of several largeand expensive research trials have appeared in print and beenapproved by a committee of experts”.
Others have put their reservations even more strongly.
“evidence based medicine seems to [replace] original findings withsubjectively selected, arbitrarily summarised, laundered, and biasedconclusions of indeterminate validity or completeness. It has beencarried out by people of unknown ability, experience, and skills usingmethods whose opacity prevents assessment of the original data”.4
The palpable resentment amongst many health professionalstowards the evidence based medicine movement5, 6 is mostly areaction to the implication that doctors (and nurses, midwives,physiotherapists, and other health professionals) were functionallyilliterate until they were shown the light and that the few whoweren’t illiterate wilfully ignored published medical evidence.Anyone who works face to face with patients knows how often it isnecessary to seek new information before making a clinical decision.Doctors have spent time in libraries since libraries were invented.Wedon’t put a patient on a new drug without evidence that it is likelyto work; apart from anything else, such off licence use of medicationis, strictly speaking, illegal. Surely we have all been practisingevidence based medicine for years, except when we weredeliberately bluffing (using the “placebo” effect for good medicalreasons), or when we were ill, overstressed or consciously being lazy?
Well, no, we haven’t.There have been a number of surveys on thebehaviour of doctors, nurses, and related professionals,7–10 and mostof them reached the same conclusion: clinical decisions are onlyrarely based on the best available evidence. Estimates in the early1980s suggested that only around 10–20% of medical interventions(drug therapies, surgical operations, X-rays, blood tests, and so on)were based on sound scientific evidence.11, 12These figures have sincebeen disputed, since they were derived by assessing all diagnosticand therapeutic procedures currently in use, so that each procedure,however obscure, carried equal weight in the final fraction. A morerecent evaluation using this method classified 21% of healthtechnologies as evidence based.13
Surveys which look at the interventions chosen for consecutive
HOW TO READ A PAPER
4

series of patients, which reflect the technologies that are actuallyused rather than simply those that are on the market, havesuggested that 60–90% of clinical decisions, depending on thespecialty, are “evidence based”.14–18 But as I have arguedelsewhere,19 these studies had methodological limitations. Apartfrom anything else, they were undertaken in specialised units andlooked at the practice of world experts in evidence based medicine;hence, the figures arrived at can hardly be generalised beyond theirimmediate setting (see section 4.2).
Let’s take a look at the various approaches which healthprofessionals use to reach their decisions in reality, all of which areexamples of what evidence based medicine isn’t.
Decision making by anecdote
When I was a medical student, I occasionally joined the retinueof a distinguished professor as he made his daily ward rounds. Onseeing a new patient, he would enquire about the patient’ssymptoms, turn to the massed ranks of juniors around the bed andrelate the story of a similar patient encountered 20 or 30 yearspreviously. “Ah, yes. I remember we gave her such-and-such, andshe was fine after that.” He was cynical, often rightly, about newdrugs and technologies and his clinical acumen was second tonone. Nevertheless, it had taken him 40 years to accumulate hisexpertise and the largest medical textbook of all – the collection ofcases which were outside his personal experience – was foreverclosed to him.
Anecdote (storytelling) has an important place in professionallearning20 but the dangers of decision making by anecdote are wellillustrated by considering the risk–benefit ratio of drugs andmedicines. In my first pregnancy, I developed severe vomiting andwas given the anti-sickness drug prochlorperazine (Stemetil).Within minutes, I went into an uncontrollable and very distressingneurological spasm. Two days later, I had recovered fully from thisidiosyncratic reaction but I have never prescribed the drug since,even though the estimated prevalence of neurological reactions toprochlorperazine is only one in several thousand cases. Conversely,it is tempting to dismiss the possibility of rare but potentiallyserious adverse effects from familiar drugs – such as thrombosis onthe contraceptive pill – when one has never encountered suchproblems in oneself or one’s patients.
WHY READ PAPERS AT ALL?
5

We clinicians would not be human if we ignored our personalclinical experiences, but we would be better advised to base ourdecisions on the collective experience of thousands of clinicianstreating millions of patients, rather than on what we as individualshave seen and felt. Chapter 5 of this book (Statistics for the non-statistician) describes some more objective methods, such as thenumber needed to treat (NNT) for deciding whether a particulardrug (or other intervention) is likely to do a patient significant goodor harm.
Decision making by press cutting
For the first 10 years after I qualified, I kept an expanding fileof papers which I had ripped out of my medical weeklies beforebinning the less interesting parts. If an article or editorial seemedto have something new to say, I consciously altered my clinicalpractice in line with its conclusions. All children with suspectedurinary tract infections should be sent for scans of the kidneys toexclude congenital abnormalities, said one article, so I beganreferring anyone under the age of 16 with urinary symptoms forspecialist investigations. The advice was in print and it was recent,so it must surely replace traditional practice – in this case,referring only children below the age of 10 who had had two welldocumented infections.
This approach to clinical decision making is still very common.How many doctors do you know who justify their approach to aparticular clinical problem by citing the results section of a singlepublished study, even though they could not tell you anything at allabout the methods used to obtain those results? Was the trialrandomised and controlled (see section 3.3)? How many patients,of what age, sex, and disease severity, were involved (see section4.2)? How many withdrew from (“dropped out of”) the study, andwhy (see section 4.6)? By what criteria were patients judged cured?If the findings of the study appeared to contradict those of otherresearchers, what attempt was made to validate (confirm) andreplicate (repeat) them (see section 7.3)? Were the statistical testswhich allegedly proved the authors’ point appropriately chosen andcorrectly performed (see Chapter 5)? Doctors (and nurses,midwives, medical managers, psychologists, medical students, andconsumer activists) who like to cite the results of medical researchstudies have a responsibility to ensure that they first go through a
HOW TO READ A PAPER
6

checklist of questions like these (more of which are listed inAppendix 1).
Decision making by expert opinion (eminence based medicine)
An important variant of decision making by press cutting is theuse of “off the peg” reviews, editorials, consensus statements, andguidelines. The medical freebies (free medical journals and other“information sheets” sponsored directly or indirectly by thepharmaceutical industry) are replete with potted recommendationsand at-a-glance management guides. But who says the advice givenin a set of guidelines, a punchy editorial or an amply referenced“overview” is correct?
Professor Cynthia Mulrow, one of the founders of the science ofsystematic review (see Chapter 8), has shown that experts in aparticular clinical field are actually less likely to provide an objectivereview of all the available evidence than a non-expert whoapproaches the literature with unbiased eyes.21 In extreme cases, an“expert review” may consist simply of the lifelong bad habits andpersonal press cuttings of an ageing clinician. Chapter 8 of thebook takes you through a checklist for assessing whether a“systematic review” written by someone else really merits thedescription and Chapter 9 discusses the potential limitations of“off the peg” clinical guidelines.
Decision making by cost minimisation
The general public is usually horrified when it learns that atreatment has been withheld from a patient for reasons of cost.Managers, politicians, and, increasingly, doctors can count onbeing pilloried by the press when a child with a brain tumour is notsent to a specialist unit in America or a frail old lady is deniedindefinite board and lodging on an acute medical ward.Yet in thereal world, all health care is provided from a limited budget and itis increasingly recognised that clinical decisions must take intoaccount the economic costs of a given intervention. As Chapter 10argues, clinical decision making purely on the grounds of cost(“cost minimisation” – purchasing the cheapest option with noregard for how effective it is) is usually both senseless and cruel andwe are right to object vocally when this occurs.
Expensive interventions should not, however, be justified simplybecause they are new or because they ought to work in theory or
WHY READ PAPERS AT ALL?
7

because the only alternative is to do nothing – but because they arevery likely to save life or significantly improve its quality. How,though, can the benefits of a hip replacement in a 75 year old bemeaningfully compared with those of cholesterol lowering drugs ina middle aged man or infertility investigations for a couple in their20s? Somewhat counterintuitively, there is no self evident set ofethical principles or analytical tools which we can use to matchlimited resources to unlimited demand. As you will see in Chapter10, the much derided quality adjusted life year (QALY) and similarutility based units are simply attempts to lend some objectivity tothe illogical but unavoidable comparison of apples with oranges inthe field of human suffering.
There is another reason why some people find the term“evidence based medicine” unpalatable. This chapter has arguedthat evidence based medicine is about coping with change, notabout knowing all the answers before you start. In other words, itis not so much about what you have read in the past but about howyou go about identifying and meeting your ongoing learning needsand applying your knowledge appropriately and consistently in newclinical situations. Doctors who were brought up in the old schoolstyle of never admitting ignorance may find it hard to accept thatsome aspect of scientific uncertainty is encountered, on average,three times for every two patients seen by experienced teachinghospital consultants22 (and, no doubt, even more often by their lessup to date provincial colleagues). An evidence based approach toward rounds may turn the traditional medical hierarchy on its headwhen the staff nurse or junior doctor produces new evidence thatchallenges what the consultant taught everyone last week. Forsome senior clinicians, learning the skills of critical appraisal is theleast of their problems in adjusting to an evidence based teachingstyle! If you are interested in reading more about the philosophyand sociology of evidence based medicine, try the references listedat the end of this chapter.23, 24
1.3 Before you start: formulate the problemWhen I ask my medical students to write me an essay about high
blood pressure, they often produce long, scholarly, and essentiallycorrect statements on what high blood pressure is, what causes it,and what the treatment options are. On the day they hand their
HOW TO READ A PAPER
8

essays in, most of them know far more about high blood pressurethan I do. They are certainly aware that high blood pressure is thesingle most common cause of stroke and that detecting andtreating everyone’s high blood pressure would cut the incidence ofstroke by almost half. Most of them are aware that stroke, thoughdevastating when it happens, is a fairly rare event and that bloodpressure tablets have side effects such as tiredness, dizziness,impotence, and getting “caught short” when a long way from thelavatory.
But when I ask my students a practical question such as “MrsJones has developed light-headedness on these blood pressuretablets and she wants to stop all medication; what would you adviseher to do?”, they are foxed. They sympathise with Mrs Jones’predicament, but they cannot distil from their pages of closewritten text the one thing that Mrs Jones needs to know. AsRichard Smith (paraphrasing T S Eliot) asked a few years ago in aBMJ editorial: “Where is the wisdom we have lost in knowledge,and the knowledge we have lost in information?”.25
Experienced doctors (and many nurses) might think they cananswer Mrs Jones’ question from their own personal experience. AsI argued earlier in this chapter, few of them would be right.7 Andeven if they were right on this occasion, they would still need anoverall system for converting the ragbag of information about apatient (an ill defined set of symptoms, physical signs, test results,and knowledge of what happened to this patient or a similar patientlast time), the particular anxieties and values (utilities) of thepatient, and other things that could be relevant (a hunch, a half-remembered article, the opinion of an older and wiser colleague ora paragraph discovered by chance while flicking through a textbook)into a succinct summary of what the problem is and what specificadditional items of information we need to solve that problem.
Sackett and colleagues have recently helped us by dissecting theparts of a good clinical question.26
• First, define precisely whom the question is about (i.e. ask “Howwould I describe a group of patients similar to this one?”).
• Next, define which manoeuvre you are considering in this patientor population (for example, a drug treatment) and, if necessary,a comparison manoeuvre (for example, placebo or currentstandard therapy).
WHY READ PAPERS AT ALL?
9

• Finally, define the desired (or undesired) outcome (for example,reduced mortality, better quality of life, overall cost savings to thehealth service, and so on).
The second step may not, in fact, concern a drug treatment,surgical operation or other intervention. The “manoeuvre” could,for example, be the exposure to a putative carcinogen (somethingthat might cause cancer) or the detection of a particular surrogateendpoint in a blood test or other investigation. (A surrogateendpoint, as section 6.3 explains, is something that predicts, or issaid to predict, the later development or progression of disease. Inreality, there are very few tests which reliably act as crystal balls forpatients’ medical future. The statement “The doctor looked at thetest results and told me I had six months to live” usually reflectseither poor memory or irresponsible doctoring!). In both thesecases, the “outcome” would be the development of cancer (or someother disease) several years later. In most clinical problems withindividual patients, however, the “manoeuvre” consists of a specificintervention initiated by a health professional.
Thus, in Mrs Jones’ case, we might ask, “In a 68 year old whitewoman with essential (i.e. common-or-garden) hypertension (highblood pressure), no co-existing illness, and no significant past medicalhistory, do the benefits of continuing therapy with hydrochlorthiazide(chiefly, reduced risk of stroke) outweigh the inconvenience?”. Notethat in framing the specific question, we have already established thatMrs Jones has never had a heart attack, stroke or early warning signssuch as transient paralysis or loss of vision. If she had, her risk ofsubsequent stroke would be much higher and we would, rightly, loadthe risk–benefit equation to reflect this.
In order to answer the question we have posed, we mustdetermine not just the risk of stroke in untreated hypertension butalso the likely reduction in that risk which we can expect withdrug treatment. This is, in fact, a rephrasing of a more generalquestion (“Do the benefits of treatment in this case outweigh therisks?”) which we should have asked before we prescribed hydro-chlorthiazide to Mrs Jones in the first place, and which all doctorsshould, of course, ask themselves every time they reach for theirprescription pad.
Remember that Mrs Jones’ alternative to staying on thisparticular drug is not necessarily to take no drugs at all; there may
HOW TO READ A PAPER
10

be other drugs with equivalent efficacy but less disabling sideeffects (remember that, as Chapter 6 argues, too many clinicaltrials of new drugs compare the product with placebo rather thanwith the best available alternative) or non-medical treatments suchas exercise, salt restriction, homeopathy or acupuncture. Not all ofthese approaches would help Mrs Jones or be acceptable to her, butit would be quite appropriate to seek evidence as to whether theymight help her.
We will probably find answers to some of these questions in themedical literature and Chapter 2 describes how to search forrelevant papers once you have formulated the problem. But beforeyou start, give one last thought to your patient with high bloodpressure. In order to determine her personal priorities (how doesshe value a 10% reduction in her risk of stroke in five years’ timecompared to the inability to go shopping unaccompanied today?),you will need to approach Mrs Jones, not a blood pressurespecialist or the Medline database!
In the early days of evidence based medicine, there wasconsiderable enthusiasm for using a decision tree approach toincorporate the patient’s perspective into an evidence basedtreatment choice.27, 28 In practice, this often proves impossible,because (I personally would argue) patients’ experiences arecomplex stories that refuse to be reduced to a tree of yes/nodecisions.29 Perhaps the most powerful criticism of evidence basedmedicine is that it potentially dismisses the patient’s own perspectiveon their illness in favour of an average effect on a population sampleor a column of QALYs (see Chapter 10) calculated by a medicalstatistician.29–31 In the past few years the evidence based medicinemovement has made rapid progress in developing a more practicalmethodology for incorporating the patient’s perspective in clinicaldecision making, 19, 32 the introduction of evidence based policy,33
and the design and conduct of research trials.34, 35 I have attempted toincorporate the patient’s perspective into Sackett’s five-stage modelfor evidence based practice;1 the resulting eight stages, which I havecalled a context sensitive checklist for evidence based practice, areshown in Appendix 1.
WHY READ PAPERS AT ALL?
11

Exercise 1
1. Go back to the fourth paragraph in this chapter, whereexamples of clinical questions are given. Decide whethereach of these is a properly focused question in terms of:
• the patient or problem
• the manoeuvre (intervention, prognostic marker,exposure)
• the comparison manoeuvre, if appropriate
• the clinical outcome.
2. Now try the following.
a) A 5 year old child has been on high dose topical steroidsfor severe eczema since the age of 20 months.The motherbelieves that the steroids are stunting the child’s growthand wishes to change to homeopathic treatment. Whatinformation does the dermatologist need to decide (a)whether she is right about the topical steroids and (b)whether homeopathic treatment will help this child?
b) A woman who is nine weeks pregnant calls out her GPbecause of abdominal pain and bleeding. A previousultrasound scan has confirmed that the pregnancy is notectopic. The GP decides that she might be having amiscarriage and tells her she must go into hospital for ascan and, possibly, an operation to clear out the womb.The woman refuses.What information do they both needin order to establish whether hospital admission ismedically necessary?
c) In the UK, most parents take their babies at the agesof 6 weeks, 8 months, 18 months, and 3 years fordevelopmental checks, where a doctor listens for heartmurmurs, feels the abdomen and checks that thetesticles are present, and a nurse shakes a rattle andcounts how many bricks the infant can build into atower. Ignoring the social aspects of “well babyclinics”, what information would you need to decidewhether the service is a good use of health resources?
HOW TO READ A PAPER
12

1 Sackett DL, Rosenberg WMC, Gray JAM, Haynes RB, Richardson WS.evidence based medicine: what it is and what it isn’t. BMJ 1996; 312: 71–2.
2 Donald A, Greenhalgh T. A hands-on guide to evidence based health care: practiceand implementation. Oxford: Blackwell Science, 2000; in press.
3 Sackett DL, Haynes B. On the need for evidence based medicine. evidence basedMedicine 1995; 1: 4–5.
4 James NT. Scientific method and raw data should be considered (letter). BMJ1996; 313: 169–70.
5 Stradling JR, Davies RJO.The unacceptable face of evidence based medicine. JEval Clin Pract 1997; 3:99–103.
6 Black D. The limitations to evidence. J R Coll Physicians Lond 1998; 32:23–6.7 Institute of Medicine. Guidelines for clinical practice: from development to use.
Washington DC: National Academy Press, 1992.8 Brook RH, Williams KN, Avery SB. Quality assurance today and tomorrow:
forecast for the future. Ann Intern Med 1976; 85: 809–17.9 Roper WL, Winkenwerde W, Hackbarth GM, Krakauer H. Effectiveness in
health care: an initiative to evaluate and improve medical practice. New Engl JMed 1988; 319: 1197–202.
10 Sackett DL, Haynes RB, Guyatt GH, Tugwell P. Clinical epidemiology – a basicscience for clinical medicine. London: Little, Brown, 1991:305–33.
11 Office of Technology Assessment of the Congress of the United States. Theimpact of randomised clinical trials on health policy and medical practice.WashingtonDC: US Government Printing Office, 1983.
12 Williamson JW, Goldschmidt PG, Jillson IA. Medical Practice InformationDemonstration Project: final report. Baltimore, Maryland: Policy Research, 1979.
13 Dubinsky M, Ferguson JH. Analysis of the National Institutes of HealthMedicare Coverage Assessment. Int J Technol Assess Health Care 1990; 6: 480–8.
14 Ellis J, Mulligan I, Rowe J, Sackett DL. Inpatient general medicine is evidencebased. A-team, Nuffield Department of Clinical Medicine. Lancet 1995; 346:407–10.
15 Gill P, Dowell AC, Neal RD, Smith N, Heywood P,Wilson AE. Evidence basedgeneral practice: a retrospective study of interventions in one training practice.BMJ 1996; 312: 819–21.
16 Geddes J, Game D, Jenkins N, Peterson LA, Pottinger GR, Sackett DL. In-patient psychiatric treatment is evidence based. Qual Health Care 1996; 4:215–17.
17 Myles PS, Bain DL, Johnson F, McMahon R. Is anaesthesia evidence based? Asurvey of anaesthetic practice. Br J Anaesthesia 1999; 82:591–5.
18 Howes N, Chagla L, Thorpe M, McCulloch P. Surgical practice is evidencebased. Br J Surg 1997; 84:1220–3.
19 Greenhalgh T. Is my practice evidence based? (editorial) BMJ 1996; 313:957–8.
20 Macnaughton J. Anecdote in clinical practice. In: Greenhalgh T, Hurwitz B, eds.Narrative based medicine: dialogue and discourse in clinical practice. London: BMJPublications, 1999: 202–11.
21 Mulrow C. Rationale for systematic reviews. BMJ 1994; 309: 597–9.22 Covell DG, Uman GC, Manning PR. Information needs in office practice: are
they being met? Ann Intern Med 1985; 103: 596–9.23 Tanenbaum SJ. Evidence and expertise: the challenge of the outcomes
movement to medical professionalism. Acad Med 1999; 74:757–63.24 Tonelli MR. The philosophical limits of evidence based medicine. Acad Med
1998; 73:1234–40.25 Smith R. Where is the wisdom . . . ? BMJ 1991; 303: 798–9.
WHY READ PAPERS AT ALL?
13

26 Sackett DL, Richardson WS, Rosenberg WMC, Haynes RB. evidence basedmedicine: how to practice and teach EBM, 2nd edn. London: ChurchillLivingstone, 2000.
27 Kassirer JP. Incorporating patients’ preferences into medical decisions. NewEngl J Med 1994; 330: 1895–6.
28 Dowie J. “Evidence-based”, “cost-effective”, and “preference-driven” medicine.J Health Serv Res Policy 1996; 1: 104–13.
29 Greenhalgh T. Narrative based medicine in an evidence based world. BMJ1999; 318: 323–5.
30 Grimley Evans J. evidence based and evidence-biased medicine. Age Ageing1995; 24: 461–3.
31 Feinstein AR, Horwitz RI. Problems in the “evidence” of “evidence basedmedicine”. Am J Med 1997; 103: 529–35.
32 Greenhalgh T, Young G. Applying the evidence with patients. In: Haines A,Silagy C, eds. evidence based health care – a guide for general practice. London:BMJ Publications, 1998.
33 Domenighetti G, Grilli R, Liberati A. Promoting consumers’ demand forevidence based medicine. Int J Technol Assess Health Care 1998; 14: 97-105.
34 Fulford KWM, Ersser S, Hope T. Essential practice in patient-centred care.Oxford: Blackwell Science, 1996.
35 Entwistle VA, Sheldon TA, Sowden A, Watt IS. Evidence-informed patientchoice. Practical issues of involving patients in decisions about health caretechnologies. Int J Technol Assess Health Care 1998; 14: 212–25.
HOW TO READ A PAPER
14

Chapter 2: Searchingthe literature
2.1 Reading medical articles
Navigating one’s way through the jungle that calls itself themedical literature is no easy task and I make no apology that thischapter is the longest in the book. You can apply all the rules forreading a paper correctly but if you’re reading the wrong paper youmight as well be doing something else entirely. There are alreadyover 15 million medical articles on our library shelves. Every month,around 5000 medical journals are published worldwide and thenumber of different journals which now exist solely to summarisethe articles in the remainder probably exceeds 250. Only 10–15% ofthe material which appears in print today will subsequently prove tobe of lasting scientific value. A number of research studies haveshown that most clinicians are unaware of the extent of the clinicalliterature and of how to go about accessing it.1, 2
Dr David Jewell, writing in the excellent book Critical reading forprimary care,3 reminds us that there are three levels of reading.
1. Browsing, in which we flick through books and journals lookingfor anything that might interest us.
2. Reading for information, in which we approach the literaturelooking for answers to a specific question, usually related to aproblem we have met in real life.
3. Reading for research, in which we seek to gain a comprehensiveview of the existing state of knowledge, ignorance, anduncertainty in a defined area.
In practice, most of us get most of our information (and, let’s faceit, a good deal of pleasure) from browsing.To overapply the rules for
15

critical appraisal which follow in the rest of this book would be tokill the enjoyment of casual reading. Jewell warns us, however, tosteer a path between the bland gullibility of believing everything andthe strenuous intellectualism of formal critical appraisal.
2.2 The Medline database
If you are browsing (reading for the fun of it), you can read whatyou like, in whatever order you wish. If reading for information(focused searching) or research (systematic review), you will wastetime and miss many valuable articles if you simply search at random.Many (but not all – see section 2.10) medical articles are indexed inthe huge Medline database, access to which is almost universal inmedical and science libraries in developed countries. Note that if youare looking for a systematic quality checked summary of all theevidence on a particular topic you should probably start with theCochrane database (see section 2.11) rather than Medline, whichuses very similar search principles. However, if you are relativelyunfamiliar with both, Medline is probably easier to learn on.
Medline is compiled by the National Library of Medicine of theUSA and indexes over 4000 journals published in over 70 countries.Three versions of the information in Medline are available.
• Printed (the Index Medicus, a manual index updated every year,from which the electronic version is compiled).
• On-line (the whole database from 1966 to date on a mainframecomputer, accessed over the Internet or other electronic server).
• CD-ROM (the whole database on between 10 and 18 CDs,depending on who makes it).
The Medline database is exactly the same, whichever company isselling it, but the commands you need to type in to access it differaccording to the CD-ROM software. Commercial vendors ofMedline on-line and/or on CD-ROM include Ovid Technologies(OVID), Silver Platter Information Ltd (WinSPIRS), AriesSystems Inc (Knowledge Finder), and PubMed.
The best way to learn to use Medline is to book a session with atrained librarian, informaticist or other experienced user. Unlessyou are a technophobe, you can pick up the basics in less than anhour. Remember that articles can be traced in two ways.
HOW TO READ A PAPER
16

1. By any word listed on the database including words in the title,abstract, authors’ names, and the institution where the researchwas done (note: the abstract is a short summary of what thearticle is all about, which you will find on the database as well asat the beginning of the printed article).
2. By a restricted thesaurus of medical titles, known as medicalsubject heading (MeSH) terms.
To illustrate how Medline works, I have worked through somecommon problems in searching. The following scenarios have beendrawn up using OVID software4 (because that’s what I personally usemost often and because it is the version used by the dial up service ofthe BMA library, to which all BMA members with a modem have freeaccess). I have included notes on WinSPIRS5 (which manyuniversities use as a preferred system) and PubMed (which isavailable free on the Internet, comes with ready made search filterswhich you can insert at the touch of a button, and throws in a searchof PreMedline, the database of about to be published and just recentlypublished articles6). All these systems (Ovid, WinSPIRS andPubMed) are designed to be used with Boolean logic, i.e. putting inparticular words (such as “hypertension”,“therapy” and so on) linkedby operators (such as “and”, “or” and “not”, as illustrated on pp 19and 20). Knowledge Finder7 is a different Medline software which ismarketed as a “fuzzy logic” system; in other words, it is designed tocope with complete questions such as “What is the best therapy forhypertension?” and is said to be more suited to the naïve user (i.e.someone with little or no training). I have certainly found KnowledgeFinder’s fuzzy logic approach quick and effective and wouldrecommend it as an investment for your organisation if you expect alot of untrained people to be doing their own searching.The practicalexercises included in this chapter are all equally possible with all typesof Medline software.
2.3 Problem 1:You are trying to find a particularpaper which you know exists
Solution: Search the database by field suffix (title, author, journal,institution, etc.) or by textwords
This shouldn’t take long.You do not need to do a comprehensivesubject search. Get into the part of the database which covers the
SEARCHING THE LITERATURE
17
approximate year of the paper’s publication (usually the past fiveyears). Selecting this is one of the first things the system asks youto do on the main Medline search screen; if you’re already in themain Medline menu, select “database” (Alt-B).
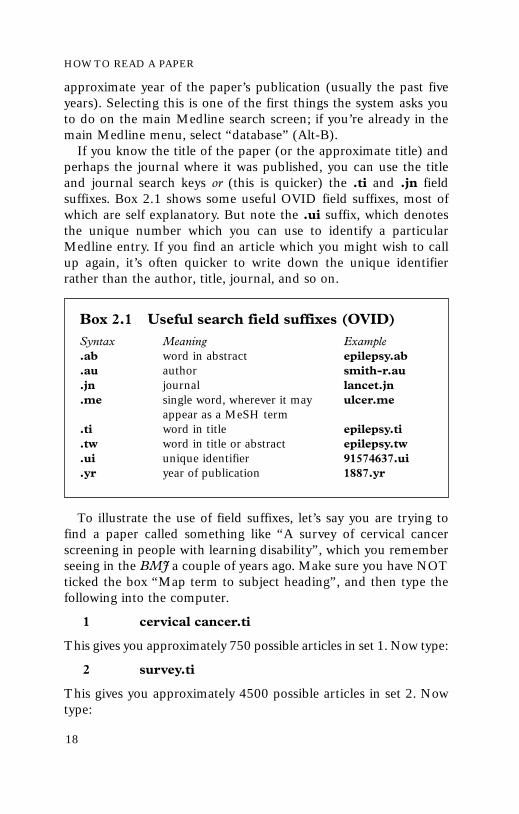
If you know the title of the paper (or the approximate title) andperhaps the journal where it was published, you can use the titleand journal search keys or (this is quicker) the .ti and .jn fieldsuffixes. Box 2.1 shows some useful OVID field suffixes, most ofwhich are self explanatory. But note the .ui suffix, which denotesthe unique number which you can use to identify a particularMedline entry. If you find an article which you might wish to callup again, it’s often quicker to write down the unique identifierrather than the author, title, journal, and so on.
To illustrate the use of field suffixes, let’s say you are trying tofind a paper called something like “A survey of cervical cancerscreening in people with learning disability”, which you rememberseeing in the BMJ a couple of years ago. Make sure you have NOTticked the box “Map term to subject heading”, and then type thefollowing into the computer.
1 cervical cancer.ti
This gives you approximately 750 possible articles in set 1. Now type:
2 survey.ti
This gives you approximately 4500 possible articles in set 2. Nowtype:
HOW TO READ A PAPER
18
Box 2.1 Useful search field suffixes (OVID)Syntax Meaning Example.ab word in abstract epilepsy.ab.au author smith-r.au.jn journal lancet.jn.me single word, wherever it may ulcer.me
appear as a MeSH term.ti word in title epilepsy.ti.tw word in title or abstract epilepsy.tw.ui unique identifier 91574637.ui.yr year of publication 1887.yr

3 learning disability.ti
This gives you approximately 100 possible articles in set 3. Nowtype:
4 BMJ.jn
This gives you several thousand articles in set 4, i.e. all articles listedin this part of the Medline database for the years you selected fromthe BMJ. Now combine these sets by typing:
5 1 and 2 and 3 and 4
This gives you anything with “cervical cancer” and “survey” and“learning disability” in the title and which was published in theBMJ: a single article in five steps.8 Note you can also combine setsin OVID by using the “combine” button at the top of the screen.
You could have done all this in one step using the followingcommand (try it now):
6 (cervical cancer AND survey AND learningdisability).ti and BMJ.jn
This step illustrates the use of the Boolean operator “and”,which will give you articles common to both sets. Using theoperator “or” will simply add the two sets together.
Note that you should not generally use abbreviations for journaltitles in OVID, but other software packages may use standardabbreviations. Two important exceptions to this rule in OVID arethe Journal of the American Medical Association (JAMA) and theBritish Medical Journal, which changed its official title in 1988 toBMJ. To search for BMJ articles from 1988 to date, you must useBMJ; for articles up to and including 1987 you should searchunder both British Medical Journal and British Medical Journalclinical research ed. Another important point is that searching fortitle words will only uncover the exact word; for example, thissearch would have missed an article whose title was about learningdisabilities rather than disability. To address that problem you needto use a truncation symbol (see p 20).
Often, you don’t know the title of a paper but you know whowrote it. Alternatively, you may have been impressed with an articleyou have read (or lecture you heard) by a particular author and youwant to see what else they have published. Clear your previous
SEARCHING THE LITERATURE
19

searches by selecting “edit” from the menu bar at the top of themain search screen, then choosing “delete all”.
Let’s try finding Professor Sir Michael Marmot’s publicationsover the past five years. The syntax is as follows. Type:
1 marmot-m.au
This gives you all articles on this part of the database in whichM Marmot is an author or co-author – approximately 35 papers.But like many authors, Michael is not the only M Marmot in themedical literature and – another problem – he has a middle initialwhich he uses inconsistently in his publications. Unless you alreadyknow his middle initial, you must use a truncation symbol to find itout. Type:
2 marmot-m$.au
This gives you about 60 articles, which include the previous 35you found under M Marmot, plus articles by MA Marmot, MDMarmot and another 25 articles by – we’ve found him – MGMarmot! Note that in OVID, the dollar sign is a truncation symbolmeaning “any character or characters”. With Silver Platter searchsoftware the equivalent symbol is an asterisk (*). You can use thetruncation symbol to search a stem in a textword search; forexample, the syntax electric$.tw (in OVID) will uncover articleswith “electric”, “electricity”, “electrical”, and so on in the title orabstract.
You could have used the following single line command:
3 (marmot-m or marmot-mg).au
This gives a total of around 60 articles, which you now need tobrowse by hand to exclude any M Marmots other than ProfessorSir Michael!
You may also find it helpful to search by institution field. Thiswill give you all the papers which were produced in a particularresearch institution. For example, type:
4 (withington hospital and manchester).in
to find all the papers where “Withington Hospital, Manchester”appears in the “institution” field (either as the main address wherethe research was done or as that of one of the co-authors).
If you can’t remember the title of the article you want but you
HOW TO READ A PAPER
20

SEARCHING THE LITERATURE
21
know some exact key phrases from the abstract, it might be quickerto search under textwords than MeSH terms (which are explainedin the next section). The field suffixes you need are .ti (title), .ab(abstract), and .tw (textword = either title or abstract). Let’s sayyou were trying to find an editorial from one of the medicaljournals (you can’t remember which) in 1999 about evidencebased medicine. Clear your previous searches, then type:
1 evidence based medicine.tw and 1999.yr
This gives you a total of about 100 articles. You could nowbrowse the abstracts by hand to identify the one you are lookingfor. Alternatively, you could refine your search by publication typeas follows. Type:
2 limit 1 to editorial
You could, in fact, have done all this in a single step with thefollowing command:
3 evidence based medicine.tw and 1999.yr andeditorial.pt
where .tw means “textword” (in title or abstract), .yr means “yearof publication” and .pt means “publication type”. (You could alsohave used the “limit set” button at the top of the screen here andthen selected the publication type as “editorial”.) Note, however,that this method will only pick up articles with the exact string“evidence based medicine” as a textword. It will miss, for example,articles which talk about “evidence based health care” instead ofevidence based medicine. For this we need to search under MeSHterms, as explained below, and/or cover all possible variations in thetextwords (including different ways of spelling each word).
Exercise 11. Try to track down the following articles using as few
commands as possible.
a) A systematic review by Craig and colleagues on themeasurement of children’s temperature in the axillacompared with the rectum published in a major Englishlanguage journal in about 2000. (Don’t forget that theOVID system needs an initial for the author’s name.)

HOW TO READ A PAPER
22
b) A paper by Professor Marsh’s team from Oxford on theeffect of phenobarbital on the frequency of fits. (Notethat you do not need the full address of the institutionto search under this field.)
c) A paper describing death rates from different causes inparticipants in the HOPE (Heart Outcomes PreventionEvaluation) study, by Salim Yusuf and colleagues,published in either the New England Journal of Medicineor the Journal of the American Medical Association (notethat Medline indexes the former under its full nameand the latter as JAMA).
d)Two articles published in 1995 in the American Journalof Medical Genetics on the inheritance of schizophreniain Israeli subjects. See if you can find them in a singlecommand using field suffixes.
2. Trace the series of ongoing articles published in theJournal of the American Medical Association from 1992 todate, entitled “Users’ guides to the medical literature”.Once you’ve found them, copy them and keep them. Muchof the rest of this book is based on these users’ guides.
3. How many articles can you find by Professor DavidSackett, who, like Professor Marmot, uses his middleinitial inconsistently?
4. Find out how many articles were published by SandraGoldbeck-Wood in the BMJ in 1999. Remember that torestrict your search to a particular year in OVID, use the“limit set” button at the top of the screen and then select“publication year”, or, alternatively, use the field suffix .yr(e.g. 1994.yr).
2.4 Problem 2:You want to answer a very specificclinical question
Solution: Construct a focused (specific) search by combining two ormore broad (sensitive) searches
I was recently asked by the mother of a young girl with anorexianervosa whose periods had ceased to put her on the pill to stop
SEARCHING THE LITERATURE
23
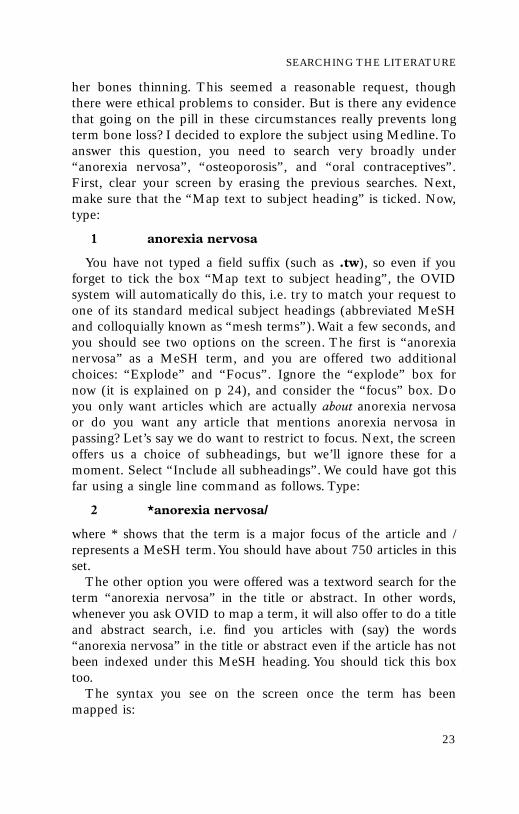
her bones thinning. This seemed a reasonable request, thoughthere were ethical problems to consider. But is there any evidencethat going on the pill in these circumstances really prevents longterm bone loss? I decided to explore the subject using Medline.Toanswer this question, you need to search very broadly under“anorexia nervosa”, “osteoporosis”, and “oral contraceptives”.First, clear your screen by erasing the previous searches. Next,make sure that the “Map text to subject heading” is ticked. Now,type:
1 anorexia nervosa
You have not typed a field suffix (such as .tw), so even if youforget to tick the box “Map text to subject heading”, the OVIDsystem will automatically do this, i.e. try to match your request toone of its standard medical subject headings (abbreviated MeSHand colloquially known as “mesh terms”).Wait a few seconds, andyou should see two options on the screen. The first is “anorexianervosa” as a MeSH term, and you are offered two additionalchoices: “Explode” and “Focus”. Ignore the “explode” box fornow (it is explained on p 24), and consider the “focus” box. Doyou only want articles which are actually about anorexia nervosaor do you want any article that mentions anorexia nervosa inpassing? Let’s say we do want to restrict to focus. Next, the screenoffers us a choice of subheadings, but we’ll ignore these for amoment. Select “Include all subheadings”. We could have got thisfar using a single line command as follows. Type:
2 *anorexia nervosa/
where * shows that the term is a major focus of the article and /represents a MeSH term.You should have about 750 articles in thisset.
The other option you were offered was a textword search for theterm “anorexia nervosa” in the title or abstract. In other words,whenever you ask OVID to map a term, it will also offer to do a titleand abstract search, i.e. find you articles with (say) the words“anorexia nervosa” in the title or abstract even if the article has notbeen indexed under this MeSH heading. You should tick this boxtoo.
The syntax you see on the screen once the term has beenmapped is:

HOW TO READ A PAPER
24
1 anorexia nervosa.mp [title, abstract, registrynumber word, or MeSH]
Note that not all Medline software packages will automaticallymap your suggestion to MeSH terms. With Silver Platter searchsoftware, for example, you need to enter your heading and click the“suggest” button. In this case, the screen offers you either “eatingdisorders” or “anorexia nervosa” and asks you to pick the closestone. Choose “anorexia nervosa” (space bar to highlight the text,then press “return”).
Similarly, to get articles on osteoporosis (which is also a MeSHterm), use the following single line command:
2 osteoporosis/
You should get about 3000 articles. Note that in OVID, if youknow that the subject you want is an official MeSH term, you canshortcut the mapping process by typing a slash (/) after the word.This can save considerable time. Note also that we have not used anasterisk here, because osteoporosis may not be the focus of the articlewe are looking for.
Finally, put in the term “oral contraceptives” (without an asteriskand without a slash) to see what the MeSH term here is. TheMeSH term is “contraceptives, oral” (if you had known this youcould have used the syntax contraceptives,oral/ but don’t do this,for a reason I’m about to explain).
3 oral contraceptives
OVID maps your set to “contraceptives,oral” and asks you if youwant to restrict your set to focus (probably not, so don’t tick thisbox) and if you want to explode the term.The MeSH terms are likethe branches of a tree, with, for example, “asthma” subdividing into“asthma in children”, “occupational asthma”, and so on. Medlineindexers are instructed to index items using the most specificMeSH terms they can. If you just ask for articles on “asthma” youwill miss all the terminal divisions of the branch unless you“explode” the term. (Note, however, that you can only explode aterm down the MeSH tree, not upwards.)
If you do not tick the “explode” box for “contraceptives,oral”,your set will probably only contain around 700 articles, whereasthe exploded term contains about 5000! A quick route to explodea topic when you know the MeSH term is:

SEARCHING THE LITERATURE
25
3 exp contraceptives, oral/
If you combine these three sets, either by using their set numbers1 and 2 and 3 or by typing the single line command:
4 *anorexia nervosa/ and osteoporosis/ and expcontraceptives, oral/
you will have searched over 6000 articles and obtained a set of onlythree references – a letter,9 an original research study,10 and asubstantive review article.11 (If you don’t find these, check thesyntax of your search carefully, then try running the same searchthrough the previous five-year database using the “database”button at the top of the screen.)
Exercise 2Try to find a set of less than five articles relating to any of thefollowing questions or clinical problems.
1.Is the high incidence of coronary heart disease in certainethnic Asian groups attributable to differences in insulinlevels?
2.The hypothesis linking vitamin C with cure of the commoncold is, apparently, something to do with its role as anantioxidant. Is there any (clinical or theoretical) evidence tosupport this hypothesis?
3.How should thyrotoxicosis be managed in pregnancy?
Make sure you practise finding the MeSH term for eachsubject, using the asterisk to restrict to focus, and using theslash to denote what you know is a MeSH term. (If thecurrent database disappoints you, re-run your search onprevious databases by selecting the “database” button.)
2.5 Problem 3:You want to get general informationquickly about a well defined topic
Solution: Use subheadings and/or the “limit set” options
This is one of the commonest reasons why we approach Medlinein real life. We don’t have a particular paper in mind or a veryspecific question to ask and we aren’t aiming for an exhaustive

overview of the literature. We just want to know, say, what’s thelatest expert advice on drug treatment for asthma or whetheranything new has been written on malaria vaccines.
One method of accomplishing this is to search using MeSHterms and then, if we unearth a large number of articles but nototherwise, to use index subheadings. Subheadings are the finetuning of the Medline indexing system and classify articles on aparticular MeSH topic into aetiology, prevention, therapy, and soon. The most useful ones are listed in Box 2.2 (you don’t have tomemorise these since the OVID mapping process automaticallyoffers you subheadings to tick, but you can truncate the mappingprocess and therefore save time if you do happen to know thesubheading you need). I try not to use subheadings myself, sincemy librarian colleagues tell me that an estimated 50% of articles inMedline are inadequately or incorrectly classified by subheading.
Note that the subheading /th in Box 2.2 refers to the non-pharmacological therapy of a disease, whereas /dt is used for drugtherapy.The subheading /tu is used exclusively for drugs and means“therapeutic use of”.The subheading /px is used with non-psychiatricdiseases as in this example – diabetes/px = psychology of diabetes.
Not all subheadings are used in the indexing system for every topic.
HOW TO READ A PAPER
26
Box 2.2 Useful subheadings (OVID)Syntax Meaning Example/ae adverse effects thalidomide/ae/co complications measles/co/ct contraindications [of drug] propranolol/ct/di diagnosis glioma/di/dt drug therapy depression/dt/ed education asthma/ed/ep epidemiology poliomyelitis/ep/hi history mastectomy/hi/nu nursing cerebral palsy/nu/og organisation/administration health service/og/pc prevention and control influenza/pc/px psychology diabetes/px/th therapy hypertension/th/tu therapeutic use [of drug] aspirin/tu

SEARCHING THE LITERATURE
27
To find the subheadings for a MeSH term such as asthma, type:
1 sh asthma
This command will tell you which subheadings are used in theindexing system for this MeSH term. It gives you a number ofoptions, including diagnosis, economics, ethnology, and so on.Youshould choose /dt (drug therapy).You could have typed the singleline command:
2 *asthma/dt
where * denotes a major focus of the article, / denotes a MeSHterm, and dt means drug therapy. This will give you around 2000articles to choose from.You now need to limit the set, so start withthe frequently used options for limiting a set which are listed as tickboxes below the table on your screen (“human”, “reviews”, and soon). If you actually want to copy a full article today, select “localholdings”.This will restrict your set to journals that are held in theparticular library through which you are accessing Medline. If youdial Medline at the BMA library via a computer modem, “localholdings” means journals held at the BMA library, not the librarywhere you are dialling from! Note that options such as “localholdings” reduce your article count in a non-systematic way; thereare probably many excellent and relevant articles published injournals that your local library does not take.
If after choosing any relevant options from the frequently used“limit set” boxes, you still have too many articles, now select the“limit set” button at the top of the screen. You must now chooseadditional options for cutting the set down to a number that you canbrowse comfortably. It actually doesn’t take long to browse through50 or so articles on the screen. It is better to do this than to rely onthe software to give you the best of the bunch. In other words, don’toverapply the “limit set” commands you find in Box 2.3.
If you are sure you want a review article, select this option.Youcan get the latest review by selecting first “review articles” and then“latest update”. However, given that the very latest update may notbe the best overview written in the past year or so, you may bebetter selecting “publication year” as the current year and trawlingthrough. Remember that only a systematic review will have involved,and will include details of, a thorough search of the relevantliterature (see Chapter 8).

HOW TO READ A PAPER
28
The option “AIM journals” denotes all journals listed in theAbridged Index Medicus, i.e. the “mainstream” medical journals.Alternatively, if you want articles relating to nursing rather thanmedical care, you could limit the set to “Nursing journals”.This isoften a better way of limiting a large set than asking for localholdings. If you are not interested in seeing anything in a foreignlanguage (even though the abstract may be in English), select thisoption, again bearing in mind that it is a non-systematic (indeed, avery biased) way of excluding articles from your set.12
Note that instead of using the “limit set” function key you canuse direct single line commands such as:
3 limit 2 to local holdings
4 limit 3 to human
Exercise 3
Try to find a single paper (by browsing a larger set) to giveyou a quick answer to the following questions:
1. Is hormone replacement therapy ever indicated in womenwho have had breast cancer in the past?
2. The North American medical literature often mentionshealth maintenance organisations. What are these?
3. Imagine that you are a medical journalist who has beenasked to write an article on screening for prostate cancer.You want two fairly short review articles, from themainstream medical literature, to use as your sources.
4. Does watching violence on television lead to violentbehaviour in adolescents?
Box 2.3 Useful “limit set” optionsAIM journals Review articles English languageNursing journals Editorials MaleDental journals Abstracts HumanCancer journals Local holdings Publication year

SEARCHING THE LITERATURE
29
2.6 Problem 4:Your search gives you lots of irrelevantarticlesSolution: Refine your search as you go along in the light of interim results
Often, a search uncovers dozens of articles that are irrelevant toyour question.The Boolean operator “not” can help here. I recentlyundertook a search to identify articles on surrogate endpoints inclinical pharmacology research. I searched Medline by MeSH termsbut I also wanted to search by textwords to pick up articles that theMeSH indexing system had missed (see section 2.7). Unfortunately,my search revealed hundreds of articles I didn’t want, all on surrogatemotherhood. (Surrogate endpoints are explained in section 6.3 butthe point here is that they are nothing to do with surrogate mother-hood!) The syntax to exclude the unwanted articles is as follows:
1 (surrogate not mother$).tw
Deciding to use the “not” operator is a good example of how youcan (and should) refine your search as you go along, much easier thanproducing the perfect search off the top of your head! Another way ofgetting rid of irrelevant articles is to narrow your textword search toadjacent words. For example, the term “home help” includes two verycommon words linked in a specific context. Link them as follows:
2 home adj help.tw
where adj means “adjacent”. Similarly, “community adj care”,“Macmillan adj nurse”.You can even specify the number of wordsgap between two linked words, as in
3 community adj2 care.tw
which would find “community mental health care” as well as“community child care” and “community care”.
Exercise 4
1. Find articles about occupational asthma caused by sugar.
2. The drug chloroquine is most commonly used for thetreatment of falciparum malaria. Find out what other usesit has. (Hint: use the subheading /tu, which means “therapeutic use of”, and remember that malaria is oftenreferred to by its Latin name plasmodium falciparum. Youshould, of course, limit a large search to review articles ifyou are reading for quick information rather thansecondary research).

HOW TO READ A PAPER
30
2.7 Problem 5:Your search gives you no articles at allor not as many as you expected
Solution: First, don’t overuse subheadings or the “limit set” options.Second, search under textwords as well as MeSH terms.Third, learnabout the “explode” command, and use it routinely
If your carefully constructed search bears little or no fruit, it ispossible that there are no relevant articles in the database. Morelikely, you have missed them. Many important articles are missed notbecause we constructed a flawed search strategy but because werelied too heavily on a flawed indexing system. I’ve already talkedabout the overuse of subheadings (see section 2.5). MeSH termsmay also be wrongly assigned or not assigned at all. For this reason,you should adopt a “belt and braces” approach and search undertextwords as well as by MeSH. After all, it’s difficult to write anarticle on the psychology of diabetes without mentioning the words“diabetes”, “diabetic”, “psychology” or “psychological”, so thetruncation stems diabet$.tw and psychol$.tw would supplement asearch under the MeSH term “diabetes mellitus” and thesubheading /px (psychology).
Clear your screen, then consider this example. If you wanted toanswer the question: what is the role of aspirin in the preventionand treatment of myocardial infarction?, you could type the singleline command:
1 (myocardial infarction/pc or myocardialinfarction/dt) and aspirin/tu
which would give you all articles listed in this part of the Medlinedatabase which cover the therapeutic use of aspirin and theprevention or treatment of myocardial infarction – 190 or soarticles, but no immediate answer to your question. You might bebetter dropping the subheadings and limiting the set as follows:
1 myocardial infarction/ and aspirin/
2 limit 1 to AIM journals
3 limit 2 to review articles
a strategy which would give you around 25 review articles,including at least one very useful one which your first search (bysubheadings) missed. Now, let’s add an extra string to this

SEARCHING THE LITERATURE
31
strategy. Erase the set so far, and work as follows:
1 (myocardial infarction and aspirin).mp
2 limit 1 to AIM journals
3 limit 2 to review articles
The .mp suffix (see p 24) automatically gives you a textwordsearch of the title and abstracts and should give you over 50articles, most of which look very relevant to your question andsome of which were missed when you searched MeSH termsalone.
Another important strategy for preventing incomplete searches isto use the powerful “explode” command.This function is explainedon p 24 above and you should use it routinely unless you have goodreason not to.Try the following search as an example.We are tryingto get hold of a good review article about gonococcal arthritis (arare type of acute arthritis caused by the gonococcus bacterium).Clear your screen, then type the MeSH term
1 *arthritis/
This will give you about 1300 articles in which arthritis is thefocus. Now search for articles on arthritis in which the word“gonococcal” is mentioned in the title or abstract, by typing:
2 gonococcal.tw
3 1 and 2
This narrows your search drastically to one or two articles,neither of which offers a comprehensive overview of the subject.And how many have you missed? The answer is quite a few of them,because the MeSH term “arthritis” subdivides into severalbranches, including “arthritis, infectious”. Try it all again (withouterasing the first search) but this time, explode the term “arthritis”before you start and then limit your set to review articles:
4 exp arthritis/
5 2 and 4
6 limit 5 to review articles
You now have around five articles, including a major overview13

HOW TO READ A PAPER
32
which your unexploded search missed.You can demonstrate this bytyping:
7 6 not 3
which will show you what the exploded search revealed over andabove the unexploded one. Incidentally, if you were also thinking ofsearching under textwords, the syntax for identifying articles aboutthe problem in men would be (male not female).tw and (mennot women).tw, since the female terms here literally incorporatethe male!
2.8 Problem 6:You don’t know where to start searching
Solution: Use the “permuted index” option
Let’s take the term “stress”. It comes up a lot but searching forparticular types of stress would be laborious and searching “stress”as a textword would be too unfocused. We need to know where inthe MeSH index the various types of stress lie, and when we seethat, we can choose the sort of stress we want to look at. For this,we use the command ptx (“permuted index”). Type:
1 ptx stress
The screen shows many options, including posttraumatic stressdisorders, stress fracture, oxidative stress, stress incontinence, andso on.
ptx is a useful command when the term you are exploring mightbe found in several subject areas. If your subject word is a discreteMeSH term, use the tree command. For example:
2 tree epilepsy
will show where epilepsy is placed in the MeSH index (as a branchof “brain diseases”), which itself branches into generalised epilepsy,partial epilepsy, posttraumatic epilepsy, and so on.
Exercise 5
1. Find where the word “nursing” might appear as part of aMeSH term.
2. Use the tree command to expand the MeSH term“diabetes mellitus”.

SEARCHING THE LITERATURE
33
2.9 Problem 7:Your attempt to limit a set leads to lossof important articles but does not exclude those of lowmethodological quality
Solution: Apply an evidence based quality filter
What do you do when your closely focused search still gives youseveral hundred articles to choose from and if applyingsubheadings or limit set functions seems to lose valuable (andrelevant) papers? First, you should consider the possibility thatyour search wasn’t as focused as you thought. But if you can’timprove on it, you should try inserting a quality string designed tolimit your set to therapeutic interventions, aetiology, diagnosticprocedures or epidemiology. Alternatively, you could apply searchstrings to identify the publication type, such as randomisedcontrolled trial, systematic review or metaanalysis.
These evidence based quality filters, which are listed inAppendices 2 and 3, are highly complex search strategiesdeveloped and refined by some of the world’s most experiencedmedical information experts. Carol Lefebvre of the UK CochraneCentre first introduced me to them and credits their origin toAnne McKibbon who has written extensively on the subject ofsearching in relation to evidence based practice.14 You can copythem into your personal computer and save them as cut andpaste strategies to be added to your subject searches. Othermaximally sensitive search strategies are being developed whichwill identify cohort studies, case-control studies, and so on, andwill soon be available from the UK Cochrane Centre,Summertown Pavilion, Middle Way, Oxford OX2 7LG, [email protected].
Exercise 6
1. Search for a good randomised controlled trial of the useof aspirin in the therapy of acute myocardial infarction.
2. Find a systematic review on the risk of gastrointestinalbleeding with non-steroidal antiinflammatory drugs.

HOW TO READ A PAPER
34
2.10 Problem 8: Medline hasn’t helped, despite athorough search
Solution: Explore other medical and paramedical databases
Entry of articles onto the Medline database is open to humanerror, both from authors and editors who select key words forindexing and from librarians who group articles under subheadingsand type in the abstracts. According to one estimate, 40% ofmaterial which should be listed on Medline can, in reality, only beaccessed by looking through all the journals again, by hand.Furthermore, a number of important medical and paramedicaljournals are not covered by Medline at all. It is said that Medlinelacks comprehensive references in the fields of psychology, medicalsociology, and non-clinical pharmacology.
If you wish to broaden your search to other electronic databases,ask your local librarian where you could access the following.
• AIDSLINE References the literature on AIDS and HIV backto 1980. Available via a number of suppliers including InternetGrateful Med (see below).
• Allied and Complementary Medicine (AMED) Covers a rangeof complementary and alternative medicine including homeopathy, chiropractic, acupuncture, and so on. Producedby the British Library, available from a number of suppliersincluding Silver Platter or OVID. For more details on AMEDsee http://www.silverplatter.com.catalog/amed.htm
• Bandolier Award-winning summary journal with searchableindex produced by Andrew Moore and colleagues in Oxford,UK. Includes a range of commissioned review topics for the UKNHS Research and Development Directorate.http://www. jr2.ox.ac.uk:80/Bandolier/
• Cancer-CD A compilation by Silver Platter of CANCERLITand Embase cancer related records from 1984. The CD-ROMversion is updated quarterly.
• CINAHL The nursing and allied health database covering allaspects of nursing, health education, occupational therapy,social services in health care, and other related disciplines from1983. The CD-ROM version is updated monthly.

SEARCHING THE LITERATURE
35
• Cochrane Library The Cochrane Controlled Trials Register(CCTR), Cochrane Database of Systematic Reviews (CDSR),Database of Abstracts of Reviews of Effectiveness (DARE), andCochrane Review Methodology Database (CRMD) areupdated quarterly; authors of systematic reviews on CDSRundertake to update their own contributions periodically. Seetext for further details. Abstracts are available free onhttp://hiru.mcmaster.ca/cochrane/cochrane/revabstr/abidx.htm
• Current Contents Search Indexes journal issues on or beforetheir publication date. It is useful when checking for the verylatest output on a subject. Updated weekly. From 1990.Available from OVID; more details fromhttp://ovid.gwdg. de/ovidweb/fldguide/cc.htm#geni
• English National Board health care database A database ofjournal references primarily of interest to nurses, midwives, andhealth visitors. http://www.enb.org.uk/hcd.htm
• Embase The database of Excerpta Medica, which focuses ondrugs and pharmacology, but also includes other biomedicalspecialties. It is more up to date than Medline and with betterEuropean coverage. The CD-ROM version is updated monthly.Available via a number of software suppliers including OVID(see reference list).
• Internet Grateful Med Public access “front end” to medicaldatabases, offering Medline, HealthSTAR, PreMedline,AIDSLINE, AIDSDRUGS, AIDSTRIALS, and several others.http://igm.nlm.nih.gov/
• NHS economic evaluation database Public access database withquality assessed structured abstracts of clinical trials that includean economic evaluation.http://nhscrd.york.ac.uk
• NHS health technology assessment database Public accessdatabase with quality assessed structured abstracts of clinicaltrials that include an evaluation of health technology.http://nhscrd.york.ac.uk
• National Guideline Clearinghouse (US) A comprehensivedatabase of evidence based clinical practice guidelines and

related documents produced by the US Agency for Health CarePolicy and Research (AHCPR), in partnership with theAmerican Medical Association (AMA) and the AmericanAssociation of Health Plans (AAHP).http://www.guidelines.gov/index.asp
• National Research Register (UK) List of ongoing UK clinical trialsby the Medical Research Council and National Research Register.http://www.update-software.com/National/nrr-frame.html
• Psyclit Produced by the American Psychological Association asthe computer-searchable version of Psychological Abstracts. Itcovers psychology, psychiatry and related subjects; journals areincluded from 1974 and books from 1987 (English languageonly). Available through several software companies (seereference list) along with Medline.
• Science Citation Index Indexes the references cited in articles aswell as the usual author, title, abstract and citation of the articlesthemselves. Useful for finding follow up work done on a keyarticle and for tracking down the addresses of authors. Available(at a charge) from Web of Science at http://wos.mimas.ac.uk/
• SUMSearch A new method of searching the Internet forevidence based medical information. Querying a number of keydatabases, such as Medline, Cochrane abstracts and DARE (seeabove), SUMSearch aims to select the most appropriate source,format the search query, modify this query if too few or too manyhits are found, and return a single document to the clinician. Formany queries this is a good first port of call.http://SUMSearch.uthscsa.edu
• UNICORN The main database of the King’s Fund, London.Covers a range of journals on health, health management, healtheconomics, and social sciences. Particularly strong on primaryhealth care and the health of Londoners. Accessible at the King’sFund Library, 11–13 Cavendish Square, London W1M 0AN.
2.11 The Cochrane LibraryWhen I wrote the first edition of this book, the Cochrane library
was a fairly small and exploratory project but I predicted that by2000 it would probably have replaced Medline as the medical
HOW TO READ A PAPER
36

researcher’s first port of call when looking for quality articles andsummaries of clinical research. This is indeed the case, and theCochrane Library now boasts several hundred systematic reviewsand hundreds of thousands of peer reviewed summaries ofrandomised controlled trials. The story behind the Cochraneproject is worth telling.
In 1972, epidemiologist Archie Cochrane called for theestablishment of a central international register of clinical trials. (Itwas Cochrane who, as a rebellious young medical student, marchedthrough the streets of London in 1938 bearing a placard which stated,“All effective treatments should be free”. His book Effectiveness andefficiency15 caused little reaction at the time but captures the essence oftoday’s evidence based medicine movement.)
Though he never lived to see the eponym, Archie Cochrane’svision of a 100% accurate medical database, the CochraneControlled Trials Register, is approaching reality. The CochraneLibrary also includes two “metadatabases” (the CochraneDatabase of Systematic Reviews and the Database of Abstracts ofReviews of Effectiveness) and a fourth database on the science ofresearch synthesis (the Cochrane Review Methodology Database).This entire library is available on CD-ROM from the BMAbookshop.
Published articles are entered on to the Cochrane databases bymembers of the Cochrane Collaboration,16 an internationalnetwork of (mostly) medically qualified volunteers who each takeon the handsearching of a particular clinical journal back to thevery first issue. Using strict methodological criteria, thehandsearchers classify each article according to publication type(randomised trial, other controlled clinical trial, epidemiologicalsurvey, and so on), and prepare structured abstracts in house style.The Collaboration has already identified around 60 000 trials thathad not been appropriately tagged in Medline.
All the Cochrane databases are in user friendly Windows styleformat with a search facility very similar to that used in thecommon Medline packages. Numerical data in overviews arepresented in a standardised graphics way to allow busy clinicians toassess their relevance quickly and objectively. In 1997 some of thefounder members of the Cochrane Collaboration published acompilation of articles reflecting on Cochrane’s original vision andthe projects that have emerged from it. Despite its uninspiring title,
SEARCHING THE LITERATURE
37

Non-random reflections . . . is a fascinating account of one ofmedicine’s most important collaborative initiatives in the 20thcentury.17
Finally, if you are interested in becoming involved with theCochrane Library projects, contact the Cochrane Library UsersGroup on http://www.york.ac.uk/inst/crd/clug.htm.
1 Young JM, Ward JE. General practitioners’ use of evidence databases. Med JAustralia 1999; 170: 56–8.
2 McColl A, Smith H, White P, Field J. General practitioners’ perceptions of theroute to evidence based medicine: a questionnaire study. BMJ 1998; 316:361–5.
3 Jones R, Kinmonth A-L. Critical reading for primary care. Oxford: OxfordUniversity Press, 1995.
4 For further details on the OVID system of Medline see the company’s websitehttp://www.ovid.com.
5 For further details on the WinSPIRS system of Medline see the company’swebsite http://silverplatter.com.
6 The PubMed version of Medline and PreMedline can be accessed free on theInternet on http://www.ncbi.nlm.nih.gov/PubMed/.
7 For further details on the Knowledge Finder system of Medline see thecompany’s website http://www.kfinder.com/newweb/.
8 Stein K, Allen N. Cross sectional survey of cervical cancer screening in womenwith learning disability. BMJ 1999; 318: 641.
9 Mehler PS. Eating disorders [letter]. New Engl J Med 1999; 341: 614-15.10 Grinspoon S, Miller K, Coyle C et al. Severity of osteopenia in estrogen-
deficient women with anorexia nervosa and hypothalamic amenorrhea. J ClinEndocrinol Metab 1999; 84: 2049–55.
11 Grinspoon S, Herzog D, Klibanski A. Mechanisms and treatment options forbone loss in anorexia nervosa. Psychopharmacol Bull 1997; 33: 399–404.
12 Moher D, Fortin P, Jadad AR et al. Completeness of reporting of trialspublished in languages other than English: implications for conduct andreporting of systematic reviews. Lancet 1996; 347: 363–6.
13 Angulo JM, Espinoza LR. Gonococcal arthritis. Comprehensive Therapy 1999;25: 155–62.
14 McKibbon KA. evidence based practice. Bull Med Library Assoc 1998;86:396–401.
15 Cochrane A. Effectiveness and efficiency. London: Nuffield Provincial HospitalsTrust, 1972.
16 Bero L, Rennie D. The Cochrane Collaboration: preparing, maintaining, anddisseminating systematic reviews of the effects of health care. JAMA 1995; 274:1935–8.
17 Maynard A, Chalmers I, eds. Non-random reflections on health services research.London: BMJ Books, 1997.
HOW TO READ A PAPER
38

Chapter 3: Getting yourbearings (what is thispaper about?)
3.1 The science of “trashing” papers
It usually comes as a surprise to students to learn that some (thepurists would say up to 99% of) published articles belong in the binand should certainly not be used to inform practice. In 1979, theeditor of the British Medical Journal, Dr Stephen Lock, wrote “Fewthings are more dispiriting to a medical editor than having to rejecta paper based on a good idea but with irremediable flaws in themethods used”. Things have improved since then, but notenormously1 (see Box 3.1).
Most papers appearing in medical journals these days arepresented more or less in standard IMRAD format: Introduction(why the authors decided to do this particular piece of research),Methods (how they did it and how they chose to analyse theirresults), Results (what they found), and Discussion (what they thinkthe results mean). If you are deciding whether a paper is worthreading, you should do so on the design of the methods section andnot on the interest value of the hypothesis, the nature or potentialimpact of the results or the speculation in the discussion.
Conversely, bad science is bad science regardless of whether thestudy addressed an important clinical issue, whether the results are“statistically significant” (see section 5.5), whether things changedin the direction you would have liked them to, and whether, if true,the findings promise immeasurable benefits for patients or savingsfor the health service. Strictly speaking, if you are going to trash apaper, you should do so before you even look at the results.
39

It is much easier to pick holes in other people’s work than to doa methodologically perfect piece of research oneself. When I teachcritical appraisal, there is usually someone in the group who findsit profoundly discourteous to criticise research projects into whichdedicated scientists have put the best years of their lives. On a morepragmatic note, there may be good practical reasons why theauthors of the study have “cut corners” and they know as well asyou do that their work would have been more scientifically valid ifthey hadn’t.
Most good scientific journals send papers out to a referee forcomments on their scientific validity, originality, and importancebefore deciding whether to print them. This process is known as
HOW TO READ A PAPER
40
Box 3.1 Common reasons why papers are rejected forpublication
• The study did not examine an important scientific issue (seesection 3.2)
• The study was not original – that is, someone else has already donethe same or a similar study (see section 4.1)
• The study did not actually test the authors’ hypothesis (see section3.2)
• A different study design should have been used (see section 3.3)
• Practical difficulties (for example, in recruiting subjects) led theauthors to compromise on the original study protocol (seesection 4.3)
• The sample size was too small (see section 4.6)
• The study was uncontrolled or inadequately controlled (seesection 4.4)
• The statistical analysis was incorrect or inappropriate (seechapter 5)
• The authors have drawn unjustified conclusions from their data
• There is a considerable conflict of interest (for example, one of theauthors or a sponsor might benefit financially from the publicationof the paper and insufficient safeguards were seen to be in place toguard against bias)
• The paper is so badly written that it is incomprehensible

peer review and much has been written about it.2 Common defectspicked up by referees are listed in Box 3.1.
I recently corresponded with an author whose paper I hadrefereed (anonymously, though I subsequently declared myself)and recommended that it should not be published. On reading myreport, he wrote to the editor and admitted he agreed with myopinion. He described five years of painstaking and unpaidresearch done mostly in his spare time and the gradual realisationthat he had been testing an important hypothesis with the wrongmethod. He informed the editor that he was “withdrawing thepaper with a wry smile and a heavy heart” and pointed out severalfurther weaknesses of his study which I and the other referee hadmissed. He bears us no grudge and, like Kipling’s hero, has nowstooped to start anew with worn-out tools. His paper remainsunpublished but he is a true (and rare) scientist.
The assessment of methodological quality (critical appraisal) hasbeen covered in detail in many textbooks on evidence basedmedicine,3–7 and in Sackett and colleagues’ “Users’ guides to themedical literature” in the JAMA.8–32 The structured guidesproduced by these authors on how to read papers on therapy,diagnosis, screening, prognosis, causation, quality of care,economic analysis, and overview are regarded by many as thedefinitive checklists for critical appraisal. Appendix 1 lists somesimpler checklists which I have derived from the users’ guides andthe other sources cited at the end of this chapter, together withsome ideas of my own. If you are an experienced journal reader,these checklists will be largely self explanatory. If, however, you stillhave difficulty getting started when looking at a medical paper, tryasking the preliminary questions in the next section.
3.2 Three preliminary questions to get your bearings
Question 1:Why was the study done and what hypothesis were theauthors testing?
The introductory sentence of a research paper should state, in anutshell, what the background to the research is. For example,“Grommet insertion is a common procedure in children and it hasbeen suggested that not all operations are clinically necessary”.This statement should be followed by a brief review of thepublished literature, for example, “Gupta and Brown’s prospective
GETTING YOUR BEARINGS
41

survey of grommet insertions demonstrated that . . .”. It isirritatingly common for authors to forget to place their research incontext, since the background to the problem is usually clear asdaylight to them by the time they reach the writing up stage.
Unless it has already been covered in the introduction, themethods section of the paper should state clearly the hypothesiswhich the authors have decided to test, such as “This study aimedto determine whether day case hernia surgery was safer and moreacceptable to patients than the standard inpatient procedure”.Again, this important step may be omitted or, more commonly,buried somewhere mid-paragraph. If the hypothesis is presented inthe negative (which it usually is), such as “The addition of metformin to maximal dose sulphonylurea therapy will not improvethe control of type 2 diabetes”, it is known as a null hypothesis.
The authors of a study rarely actually believe their null hypothesiswhen they embark on their research. Being human, they haveusually set out to demonstrate a difference between the two armsof their study. But the way scientists do this is to say “Let’s assumethere’s no difference; now let’s try to disprove that theory”. If youadhere to the teachings of Karl Popper, this hypotheticodeductiveapproach (setting up falsifiable hypotheses which you then proceedto test) is the very essence of the scientific method.33
If you have not discovered what the authors’ stated (or unstated)hypothesis was by the time you are halfway through the methodssection, you may find it in the first paragraph of the discussion.Remember, however, that not all research studies (even good ones)are set up to test a single definitive hypothesis. Qualitative researchstudies, which are as valid and as necessary as the moreconventional quantitative studies, aim to look at particular issues ina broad, open-ended way in order to generate (or modify)hypotheses and prioritise areas to investigate.This type of researchis discussed further in Chapter 11. Even quantitative research(which the rest of this book is about) is now seen as more thanhypothesis testing. As section 5.5 argues, it is strictly preferable totalk about evaluating the strength of evidence around a particularissue than about proving or disproving hypotheses.
Question 2:What type of study was done?
First, decide whether the paper describes a primary or secondarystudy. Primary studies report research first hand, while secondary
HOW TO READ A PAPER
42

(or integrative) studies attempt to summarise and draw conclusionsfrom primary studies. Primary studies, the stuff of most publishedresearch in medical journals, usually fall into one of three categories.
• Experiments, in which a manoeuvre is performed on an animal ora volunteer in artificial and controlled surroundings.
• Clinical trials, in which an intervention, such as a drug treatment,is offered to a group of patients who are then followed up to seewhat happens to them.
• Surveys, in which something is measured in a group of patients,health professionals, or some other sample of individuals.
The more common types of clinical trials and surveys are discussedin the later sections of this chapter. Make sure you understand anyjargon used in describing the study design (see Box 3.2).
Secondary research is composed of:
• overviews, considered in Chapter 8, which may be divided into:
(a) (non-systematic) reviews, which summarise primary studies
(b) systematic reviews, which do this according to a rigorous andpredefined methodology
(c) meta-analyses, which integrate the numerical data from morethan one study
• guidelines, considered in Chapter 9, which draw conclusions fromprimary studies about how clinicians should be behaving
• decision analyses, which are not discussed in detail in this book butare covered elsewhere;16, 17, 34–36 these use the results of primarystudies to generate probability trees to be used by both healthprofessionals and patients in making choices about clinicalmanagement or resource allocation
• economic analyses, considered in Chapter 10, which use the resultsof primary studies to say whether a particular course of action isa good use of resources.
Question 3:Was this design appropriate to the broad field of researchaddressed?
Examples of the sorts of questions that can reasonably beanswered by different types of primary research study are given in
GETTING YOUR BEARINGS
43

HOW TO READ A PAPER
44
Box 3.2 Terms used to describe design features ofclinical research studies
Term Meaning
Parallel group Each group receives a different treatment,comparison with both groups being entered at the same
time. In this case, results are analysed bycomparing groups
Paired (or matched) Subjects receiving different treatments are comparison matched to balance potential confounding
variables such as age and sex. Results areanalysed in terms of differences betweensubject pairs
Within subject Subjects are assessed before and after an comparison intervention and results analysed in terms of
within subject changes
Single blind Subjects did not know which treatment theywere receiving
Double blind Neither investigators nor subjects knew whowas receiving which treatment
Crossover Each subject received both the interventionand control treatments (in random order)often separated by a washout period of notreatment
Placebo controlled Control subjects receive a placebo (inactivepill), which should look and taste the same asthe active pill. Placebo (sham) operations mayalso be used in trials of surgery
Factorial design A study that permits investigation of theeffects (both separately and combined) ofmore than one independent variable on agiven outcome (for example, a 2 x 2 factorialdesign tested the effects of placebo, aspirinalone, streptokinase alone or aspirin plusstreptokinase in acute heart attack37)

the sections which follow. One question which frequently cries outto be asked is this: was a randomised controlled trial (see section3.3 below) the best method of testing this particular hypothesisand if the study was not a randomised controlled trial, should ithave been? Before you jump to any conclusions, decide whatbroad field of research the study covers (see Box 3.3). Then askwhether the right type of study was done to address a question inthis field. For more help on this task (which some people finddifficult until they have got the hang of it) see the Oxford Centrefor EBM website38 or the journal article by the same group.39
GETTING YOUR BEARINGS
45
Box 3.3 Broad topics of research
Most research studies are concerned with one or more of thefollowing.
• Therapy – testing the efficacy of drug treatments, surgicalprocedures, alternative methods of patient education orother interventions. Preferred study design is randomisedcontrolled trial (see section 3.3 and Chapter 6)
• Diagnosis – demonstrating whether a new diagnostic test isvalid (can we trust it?) and reliable (would we get the sameresults every time?). Preferred study design is cross-sectional survey (see section 3.6 and Chapter 7) in whichboth the new test and the gold standard test are performed
• Screening – demonstrating the value of tests that can beapplied to large populations and that pick up disease at apresymptomatic stage. Preferred study design is cross-sectional survey (see section 3.6 and Chapter 7)
• Prognosis – determining what is likely to happen to someonewhose disease is picked up at an early stage. Preferred studydesign is longitudinal cohort study (see section 3.4)
• Causation – determining whether a putative harmful agent,such as environmental pollution, is related to thedevelopment of illness. Preferred study design is cohort orcase-control study, depending on how rare the disease is(see sections 3.4 and 3.5), but case reports (see section 3.7)may also provide crucial information

3.3 Randomised controlled trials
In a randomised controlled trial (RCT), participants in the trialare randomly allocated by a process equivalent to the flip of a cointo either one intervention (such as a drug treatment) or another(such as placebo treatment). Both groups are followed up for aspecified time period and analysed in terms of specific outcomesdefined at the outset of the study (for example, death, heart attack,serum cholesterol level, etc). Because, on average, the groups areidentical apart from the intervention, any differences in outcomeare, in theory, attributable to the intervention. In reality, however,not every RCT is a bowl of cherries.
Some papers which report trials comparing an intervention witha control group are not, in fact, randomised trials at all. The namefor these is other controlled clinical trials, a term used to describecomparative studies in which subjects were allocated tointervention or control groups in a non-random manner. Thissituation may arise, for example, when random allocation would beimpossible, impractical or unethical.The problems of non-randomallocation are discussed further in section 4.4 in relation todetermining whether the two groups in a trial can reasonably becompared with one another on a statistical level.
Some trials count as a sort of halfway house between truerandomised trials and non-randomised trials. In these,randomisation is not done truly at random (for example, usingsequentially numbered sealed envelopes each with a computergenerated random number inside) but by some method whichallows the clinician to know which group the patient would be inbefore he or she makes a definitive decision to randomise the patient.This allows subtle biases to creep in, since the clinician might bemore (or less) likely to enter a particular patient into the trial ifhe or she believed that the patient would get active treatment. Inparticular, patients with more severe disease may besubconsciously withheld from the placebo arm of the trial.Examples of unacceptable methods include randomisation by lastdigit of date of birth (even numbers to group A, etc.), toss of acoin, sequential allocation (patient A to group 1, patient B togroup 2, etc.), and date seen in clinic (all patients seen this weekto group A, all those seen next week to group 2, etc.).40
HOW TO READ A PAPER
46

Listed below are examples of clinical questions which would bebest answered by a randomised controlled trial but note also theexamples in the later sections of this chapter of situations whereother types of study could or must be used instead.
• Is this drug better than placebo or a different drug for a particulardisease?
• Is a new surgical procedure better than currently favouredpractice?
• Is a leaflet better than verbal advice in helping patients makeinformed choices about the treatment options for a particularcondition?
• Will changing from a margarine high in saturated fats to one highin polyunsaturated fats significantly affect serum cholesterol levels?
RCTs are said to be the gold standard in medical research. Upto a point, this is true (see section 3.8) but only for certain types ofclinical question (see Box 3.3 and sections 3.4 to 3.7). Thequestions which best lend themselves to the RCT design are allabout interventions, and are mainly concerned with therapy orprevention. It should be remembered, however, that even when weare looking at therapeutic interventions, and especially when we are
GETTING YOUR BEARINGS
47
Box 3.4 Advantages of the randomised controlled trialdesign
• Allows rigorous evaluation of a single variable (for example, effectof drug treatment versus placebo) in a precisely defined patientgroup (for example, menopausal women aged 50–60 years)
• Prospective design (that is, data are collected on events thathappen after you decide to do the study)
• Uses hypotheticodeductive reasoning (that is, seeks to falsify,rather than confirm, its own hypothesis; see section 3.2)
• Potentially eradicates bias by comparing two otherwise identicalgroups (but see below and section 4.4)
• Allows for metaanalysis (combining the numerical results ofseveral similar trials) at a later date; see section 8.3

not, there are a number of important disadvantages associated withrandomised trials (see Box 3.5).41
Remember, too, that the results of an RCT may have limitedapplicability as a result of exclusion criteria (rules about who maynot be entered into the study), inclusion bias (selection of trialsubjects from a group which is unrepresentative of everyone withthe condition (see section 4.2)), refusal of certain patient groups toconsent to be included in the trial,42 analysis of only predefined“objective” endpoints which may exclude important qualitativeaspects of the intervention47 (see Chapter 11), and publication bias(i.e. the selective publication of positive results).43 Furthermore,RCTs can be well or badly managed,44 and, once published, theirresults are open to distortion by an overenthusiastic scientificcommunity or by a public eager for a new wonder drug.45 Whilst allthese problems might also occur with other trial designs, they maybe particularly pertinent when a RCT is being sold to you as,methodologically speaking, whiter than white.
There are, in addition, many situations in which RCTs are eitherunnecessary, impractical or inappropriate.
HOW TO READ A PAPER
48
Box 3.5 Disadvantages of the randomised controlledtrial design
Expensive and time consuming, hence, in practice:
• many trials are either never done, are performed on too fewsubjects or are undertaken for too short a period (see section 4.6)
• most trials are funded by large research bodies (university orgovernment sponsored) or drug companies, who ultimately dictatethe research agenda
• surrogate endpoints are often used in preference to clinicaloutcome measures (see section 6.3)
May introduce “hidden bias”, especially through:
• imperfect randomisation (see above)
• failure to randomise all eligible patients (clinician offersparticipation in the trial only to patients he or she considers willrespond well to the intervention)
• failure to blind assessors to randomisation status of patients (seesection 4.5)

RCTs are unnecessary
• When a clearly successful intervention for an otherwise fatalcondition is discovered.
• When a previous RCT or metaanalysis has given a definitiveresult (either positive or negative – see section 5.5). Some peoplewould argue that it is actually unethical to ask patients to berandomised to a clinical trial without first conducting asystematic literature review to see whether the trial needs to bedone at all.
RCTs are impractical
• Where it would be unethical to seek consent to randomise.46
• Where the number of patients needed to demonstrate asignificant difference between the groups is prohibitively high(see section 4.6).
RCTs are inappropriate
• Where the study is looking at the prognosis of a disease. For thisanalysis, the appropriate route to best evidence is a longitudinalsurvey of a properly assembled inception cohort (see section 3.4).
• Where the study is looking at the validity of a diagnostic or screen-ing test. For this analysis, the appropriate route to best evidence isa cross-sectional survey of patients clinically suspected of harbouringthe relevant disorder (see section 3.6 and Chapter 7).
• Where the study is looking at a “quality of care” issue in whichthe criteria for “success” have not yet been established. Forexample, an RCT comparing medical versus surgical methods ofabortion might assess “success” in terms of number of patientsachieving complete evacuation, amount of bleeding, and painlevel. The patients, however, might decide that other aspects ofthe procedure are important, such as knowing in advance howlong the procedure will take, not seeing or feeling the abortuscome out, and so on. For this analysis, the appropriate route tobest evidence is a qualitative research method47 (see Chapter 11).
All these issues have been discussed in great depth by the clinicalepidemiologists,3, 6 who remind us that to turn our noses up at the
GETTING YOUR BEARINGS
49

non-randomised trial may indicate scientific naïveté and not, asmany people routinely assume, intellectual rigour. Note also thatthere is now a recommended format for reporting RCTs in medicaljournals, which you should try to follow if you are writing one upyourself.48 For an in-depth discussion of the pros and cons of theRCT, you might like to take a look at the entire issue of the BMJfrom 31st October 1998 (BMJ 1998; 317: 1167–261), as well as arecent book49 and journal articles.50
3.4 Cohort studies
In a cohort study, two (or more) groups of people are selected onthe basis of differences in their exposure to a particular agent (suchas a vaccine, a medicine or an environmental toxin) and followedup to see how many in each group develop a particular disease orother outcome. The follow up period in cohort studies is generallymeasured in years (and sometimes in decades), since that is howlong many diseases, especially cancer, take to develop. Note thatRCTs are usually begun on patients (people who already have adisease), whereas most cohort studies are begun on subjects whomay or may not develop disease.
A special type of cohort study may also be used to determine theprognosis (i.e. what is likely to happen to someone who has it) of adisease. A group of patients who have all been diagnosed as havingan early stage of the disease or a positive screening test (seeChapter 7) is assembled (the inception cohort) and followed up onrepeated occasions to see the incidence (new cases per year) andtime course of different outcomes. (Here is a definition which youshould commit to memory if you can: incidence is the number ofnew cases of a disease per year, whereas prevalence is the overallproportion of the population who suffer from the disease.)
The world’s most famous cohort study, which won its twooriginal authors a knighthood, was undertaken by Sir AustenBradford Hill, Sir Richard Doll and, latterly, Richard Peto. Theyfollowed up 40 000 British doctors divided into four cohorts (non-smokers, light, moderate and heavy smokers) using both all cause(any death) and cause specific (death from a particular disease)mortality as outcome measures. Publication of their 10 yearinterim results in 1964,51 which showed a substantial excess in bothlung cancer mortality and all cause mortality in smokers, with a
HOW TO READ A PAPER
50

“dose–response” relationship (i.e. the more you smoke, the worseyour chances of getting lung cancer), went a long way todemonstrating that the link between smoking and ill health wascausal rather than coincidental. The 20 year52 and 40 year53 resultsof this momentous study (which achieved an impressive 94%follow up of those recruited in 1951 and not known to have died)illustrate both the perils of smoking and the strength of evidencethat can be obtained from a properly conducted cohort study.
Clinical questions which should be addressed by a cohort studyinclude the following.
• Does the contraceptive pill “cause” breast cancer? (Note, onceagain, that the word “cause” is a loaded and potentially misleadingterm. As John Guillebaud has argued in his excellent book thePill,54 if 1000 women went on the pill tomorrow, some of themwould get breast cancer. But some of those would have got itanyway.The question which epidemiologists try to answer throughcohort studies is “What is the additional risk of developing breastcancer which this woman would run by taking the pill, over andabove her “baseline” risk attributable to her own hormonalbalance, family history, diet, alcohol intake, and so on?”.)
• Does smoking cause lung cancer?53
• Does high blood pressure get better over time?
• What happens to infants who have been born very prematurely,in terms of subsequent physical development and educationalachievement?
3.5 Case-control studies
In a case-control study, patients with a particular disease orcondition (cases) are identified and “matched” with controls(patients with some other disease, the general population,neighbours or relatives). Data are then collected (for example, bysearching back through these people’s medical records or by askingthem to recall their own history) on past exposure to a possiblecausal agent for the disease. Like cohort studies, case-controlstudies are generally concerned with the aetiology of a disease (i.e.what causes it), rather than its treatment. They lie lower down thehierarchy of evidence (see section 3.8) but this design is usually the
GETTING YOUR BEARINGS
51
only option when studying rare conditions. An important source ofdifficulty (and potential bias) in a case-control study is the precisedefinition of who counts as a “case”, since one misallocated subjectmay substantially influence the results (see section 4.4). Inaddition, such a design cannot demonstrate causality; in otherwords, the association of A with B in a case-control study does notprove that A has caused B.
Clinical questions which should be addressed by a case-controlstudy include the following.
• Does the prone sleeping position increase the risk of cot death(sudden infant death syndrome)?
• Does whooping cough vaccine cause brain damage? (see section4.4)
• Do overhead power cables cause leukaemia?
3.6 Cross-sectional surveys
We have probably all been asked to take part in a survey, evenif it was only a lady in the street asking us which brand oftoothpaste we prefer. Surveys conducted by epidemiologists arerun along essentially the same lines: a representative sample ofsubjects (or patients) is interviewed, examined or otherwisestudied to gain answers to a specific clinical question. In cross-sectional surveys, data are collected at a single timepoint but mayrefer retrospectively to health experiences in the past, such as, forexample, the study of patients’ casenotes to see how often theirblood pressure has been recorded in the past five years.
Clinical questions which should be addressed by a cross-sectional survey include the following.
• What is the “normal” height of a 3 year old child? (This, likeother questions about the range of normality, can be answeredsimply by measuring the height of enough healthy 3 year olds.But such an exercise does not answer the related clinicalquestion “When should an unusually short child beinvestigated for disease?” since, as in almost all biologicalmeasurements, the physiological (normal) overlaps with thepathological (abnormal). This problem is discussed further insection 7.4.)
HOW TO READ A PAPER
52

• What do psychiatric nurses believe about the value of electro-convulsive therapy (ECT) in the treatment of severe depression?
• Is it true that “half of all cases of diabetes are undiagnosed”?(This is an example of the more general question “What is theprevalence (proportion of people with the condition) of thisdisease in this community?”The only way of finding the answeris to do the definitive diagnostic test on a representative sampleof the population.)
3.7 Case reports
A case report describes the medical history of a single patient inthe form of a story (“Mrs B is a 54 year old secretary whodeveloped chest pain in June 2000 . . .”). Case reports are often runtogether to form a case series, in which the medical histories of morethan one patient with a particular condition are described toillustrate an aspect of the condition, the treatment or, mostcommonly these days, adverse reaction to treatment.
Although this type of research is traditionally considered to berelatively weak scientific evidence (see section 3.8), a great deal ofinformation can be conveyed in a case report that would be lost ina clinical trial or survey (see Chapter 11). In addition, case reportsare immediately understandable by non-academic clinicians and bythe lay public. They can, if necessary, be written up and publishedwithin days, which gives them a definite edge over meta-analyses(whose gestation period can run into years) or clinical trials(several months). There is certainly a vocal pressure group withinthe medical profession calling for the reinstatement of the humblecase report as a useful and valid contribution to medical science.55
Clinical situations in which a case report or case series is anappropriate type of study include the following.
• A doctor notices that two babies born in his hospital have absentlimbs (phocomelia). Both mothers had taken a new drug(thalidomide) in early pregnancy. The doctor wishes to alert hiscolleagues worldwide to the possibility of drug related damage asquickly as possible.56 (Anyone who thinks “quick and dirty” casereports are never scientifically justified should remember thisexample.)
GETTING YOUR BEARINGS
53

• A patient who has taken two different drugs, terfenadine (for hayfever) and itraconazole (for fungal infection), with no side effectsin the past takes them concurrently (i.e. both at the same time)and develops a life-threatening heart rhythm disturbance. Thedoctors treating him suspect that the two drugs are interacting.57
3.8 The traditional hierarchy of evidence
Standard notation for the relative weight carried by the differenttypes of primary study when making decisions about clinicalinterventions (the “hierarchy of evidence”) puts them in thefollowing order.20
1. Systematic reviews and meta-analyses (see Chapter 8).
2. Randomised controlled trials with definitive results (i.e.confidence intervals which do not overlap the threshold clinicallysignificant effect; see section 5.5).
3. Randomised controlled trials with non-definitive results (i.e. apoint estimate which suggests a clinically significant effect butwith confidence intervals overlapping the threshold for thiseffect; see section 5.5).
4. Cohort studies.
5. Case-control studies.
6. Cross-sectional surveys.
7. Case reports.
The pinnacle of the hierarchy is, quite properly, reserved forsecondary research papers, in which all the primary studies on aparticular subject have been hunted out and critically appraisedaccording to rigorous criteria (see Chapter 8). Note, however, thatnot even the most hard line protagonist of evidence based medicinewould place a sloppy metaanalysis or a randomised controlled trialthat was seriously methodologically flawed above a large, welldesigned cohort study. And as Chapter 11 shows, many importantand valid studies in the field of qualitative research do not featurein this particular hierarchy of evidence at all. In other words,evaluating the potential contribution of a particular study tomedical science requires considerably more effort than is needed tocheck off its basic design against the six point scale above.
HOW TO READ A PAPER
54

3.9 A note on ethical considerations
When I was a junior doctor, I got a job in a world renownedteaching hospital. One of my humble tasks was seeing the geriatric(elderly) patients in casualty. I was soon invited out to lunch by twocharming registrars, who (I later realised) were seeking my helpwith their research. In return for getting my name on the paper, Iwas to take a rectal biopsy (i.e. cut out a small piece of tissue fromthe rectum) on any patient over the age of 90 who hadconstipation. I asked for a copy of the consent form which patientswould be asked to sign.When they assured me that the average 90year old would hardly notice the procedure, I smelt a rat andrefused to cooperate with their project.
I was naïvely unaware of the seriousness of the offence beingplanned by these doctors. Doing any research, particularly thatwhich involves invasive procedures, on vulnerable and sick patientswithout full consideration of ethical issues is both a criminal offenceand potential grounds for a doctor to be “struck off” the medicalregister. Getting ethical approval for one’s research study can be anenormous bureaucratic hurdle,58 but it is nevertheless a legalrequirement (and one which was, until recently, frequently ignoredin research into the elderly and those with learning difficulties59).Most editors routinely refuse to publish research which has not beenapproved by the relevant research ethics committee but if you are indoubt about a paper’s status, there is nothing to stop you writing toask the authors for copies of relevant documents.
Note, however, that this hand can be overplayed.58 Researchethics committees frequently deem research proposals unethical,yet it could be argued that in areas of genuine clinical uncertaintythe only ethical option is to allow the informed patient theopportunity to help reduce that uncertainty. The randomised trialwhich showed that neural tube defects could be prevented bygiving folic acid supplements to the mother in early pregnancy60 issaid to have been held back for years because of ethics committeeresistance.
1 Altman DG. The scandal of poor medical research. BMJ 1994; 308: 283–4.2 Jefferson T, Godlee F. Peer Review in Health Sciences. London: BMJ Books, 1999.3 Sackett DL, Haynes RB, Guyatt GH, Tugwell P. Clinical epidemiology – a basic
science for clinical medicine. London: Little, Brown, 1991.4 Sackett DL, Richardson WS, Rosenberg WMC, Haynes RB. evidence based
GETTING YOUR BEARINGS
55

medicine: how to practice and teach EBM, 2nd edn. London: ChurchillLivingstone, 2000.
5 Crombie IM. The pocket guide to critical appraisal. London: BMJ Publications,1996.
6 Fletcher RH, Fletcher SW, Wagner EH. Clinical epidemiology: the essentials, 3rdedn. Baltimore: Williams and Wilkins, 1996.
7 Rose G, Barker DJP. Epidemiology for the uninitiated, 4th edn. London: BMJPublications, 1999.
8 Oxman AD, Sackett DS, Guyatt GH. Users’ guides to the medical literature. I.How to get started. JAMA 1993; 270: 2093–5.
9 Guyatt GH, Sackett DL, Cook DJ. Users’ guides to the medical literature. II.How to use an article about therapy or prevention. A. Are the results of thestudy valid? JAMA 1993; 270: 2598–601.
10 Guyatt GH, Sackett DL, Cook DJ. Users’ guides to the medical literature. II.How to use an article about therapy or prevention. B.What were the results andwill they help me in caring for my patients? JAMA 1994; 271:59–63.
11 Jaeschke R, Guyatt G, Sackett DL. Users’ guides to the medical literature. III.How to use an article about a diagnostic test. A. Are the results of the studyvalid? JAMA 1994; 271: 389–91.
12 Jaeschke R, Guyatt G, Sackett DL. Users’ guides to the medical literature. III.How to use an article about a diagnostic test. B.What were the results and willthey help me in caring for my patients? JAMA 1994; 271: 703–7.
13 Levine M, Walter S, Lee H, Haines T, Holbrook A, Moyer V. Users’ guides tothe medical literature. IV. How to use an article about harm. JAMA 1994;271:1615–19.
14 Laupacis A, Wells G, Richardson WS, Tugwell P. Users’ guides to the medicalliterature. V. How to use an article about prognosis. JAMA 1994; 271: 234–7.
15 Oxman AD, Cook DJ, Guyatt GH. Users’ guides to the medical literature. VI.How to use an overview. JAMA 1994; 272: 1367–71.
16 Richardson WS, Detsky AS. Users’ guides to the medical literature.VII. How touse a clinical decision analysis. A. Are the results of the study valid? JAMA1995; 273: 1292–5.
17 Richardson WS, Detsky AS. Users’ guides to the medical literature.VII. How touse a clinical decision analysis. B.What are the results and will they help me incaring for my patients? JAMA 1995; 273: 1610–13.
18 Hayward RSA,Wilson MC,Tunis SR, Bass EB, Guyatt G. Users’ guides to themedical literature. VIII. How to use clinical practice guidelines. A. Are therecommendations valid? JAMA 1995; 274: 570–4.
19 Wilson MC, Hayward RS, Tunis SR, Bass EB, Guyatt G. Users’ guides to themedical literature. VIII. How to use clinical practice guidelines. B. Will therecommendations help me in caring for my patients? JAMA 1995; 274: 1630–2.
20 Guyatt GH, Sackett DL, Sinclair JC, Hayward R, Cook DJ, Cook RJ. Users’guides to the medical literature. IX. A method for grading health carerecommendations. JAMA 1995; 274: 1800–4.
21 Naylor CD, Guyatt GH. Users’ guides to the medical literature. X. How to usean article reporting variations in the outcomes of health services. JAMA 1996;275: 554–8.
22 Naylor CD, Guyatt GH. Users’ guides to the medical literature. XI. How to usean article about a clinical utilization review. JAMA 1996; 275: 1435–9.
23 Guyatt GH, Naylor CD, Juniper E, Heyland DK, Jaeschke R. Cook DJ. Users’guides to the medical literature. XII. How to use articles about health-relatedquality of life. JAMA 1997; 277: 1232–7.
24 Drummond MF,Richardson WS,O’Brien BJ,Levine M,Heyland D.Users’ guides
HOW TO READ A PAPER
56

to the medical literature. XIII. How to use an article on economic analysis ofclinical practice. A. Are the results of the study valid? JAMA 1997; 277: 1552–7.
25 O’Brien BJ, Heyland D, Richardson WS, Levine M, Drummond MF. Users’guides to the medical literature. XIII. How to use an article on economicanalysis of clinical practice. B. What are the results and will they help me incaring for my patients? JAMA 1997; 277: 1802–6.
26 Dans AL, Dans LF, Guyatt GH, Richardson S. Users’ guides to the medicalliterature. XIV. How to decide on the applicability of clinical trial results to yourpatient. JAMA 1998; 279: 545–9.
27 Richardson WS,Wilson MC, Guyatt GH, Cook DJ, Nishikawa J. Users’ guidesto the medical literature. XV. How to use an article about disease probability fordifferential diagnosis. JAMA 1999; 281:1214–19.
28 Guyatt GH, Sinclair J, Cook DJ, Glasziou P. Users’ guides to the medicalliterature. XVI. How to use a treatment recommendation. JAMA 1999; 281:1836–43.
29 Barratt A, Irwig L, Glasziou P et al. Users’ guides to the medical literature:XVII. How to use guidelines and recommendations about screening. JAMA1999; 281: 2029–34.
30 Randolph AG, Haynes RB,Wyatt JC, Cook DJ, Guyatt GH. Users’ guides to themedical literature. XVIII. How to use an article evaluating the clinical impact ofa computer-based clinical decision support system. JAMA 1999; 282: 67–74.
31 Giacomini MK, Cook DJ. A user’s guide to qualitative research in health care.Part I: Are the results of the study valid? JAMA 2000; 357–62.
32 Giacomini MK, Cook DJ. A user’s guide to qualitative research in health care.Part II: What are the results and how do they help me care for my patients?JAMA 2000; 478–82.
33 Popper K. Conjectures and refutations: the growth of scientific knowledge. New York:Routledge and Kegan Paul, 1963.
34 Thornton JG, Lilford RJ, Johnson N. Decision analysis in medicine. BMJ 1992;304: 1099–103.
35 Thornton JG, Lilford RJ. Decision analysis for medical managers. BMJ 1995;310: 791–4.
36 Dowie J. “Evidence-based”, “cost-effective”, and “preference-driven” medicine.J Health Serv Res Policy 1996; 1: 104–13.
37 ISIS-2 Collaborative Group. Randomised trial of intravenous streptokinase,aspirin, both, or neither among 17187 cases of suspected acute myocardialinfarction: ISIS-2. Lancet 1988; ii: 349–60.
38 http://cebm.jr2.ox.ac.uk/docs/studies.html.39 Sackett DL,Wennberg JE. Choosing the best research design for each question.
BMJ 1997; 315: 1636.40 Stewart LA, Parmar MKB. Bias in the analysis and reporting of randomized
controlled trials. Int J Technol Assess Health Care 1996; 12: 264–75.41 Bero LA, Rennie D. Influences on the quality of published drug studies. Int J
Technol Assess Health Care 1996; 12: 209–37.42 MacIntyre IMC. Tribulations for clinical trials. Poor recruitment is hampering
research. BMJ 1991; 302: 1099–100.43 Stern JM, Simes RJ. Publication bias: evidence of delayed publication in a
cohort study of clinical research projects. BMJ 1997; 315: 640–5.44 Farrell B. Efficient management of randomised controlled trials: nature or
nurture. BMJ 1998; 317: 1236–9.45 McCormack J, Greenhalgh T. Seeing what you want to see in randomised
controlled trials: versions and perversions of the UK PDS data. BMJ 2000; 320:720–3.
GETTING YOUR BEARINGS
57
46 Lumley J, Bastian H. Competing or complementary: ethical considerations andthe quality of randomised trials. Int J Technol Assess Health Care 1996; 12:247–63.
47 Mays N, Pope C, eds. Qualitative research in health care, 2nd edn. London: BMJPublications, 2000.
48 Altman D. Better reporting of randomised controlled trials: the CONSORTstatement. BMJ 1996; 313: 570–1.
49 Jadad AR. Randomised controlled trials: a user’s guide. London: BMJ Publications,1998.
50 Britton A, McKee M, Black N, McPherson K, Sanderson C, Bain C. Choosingbetween randomised and non-randomised studies: a systematic review. HealthTechnol Assess 1998; 2: 1–124.
51 Doll R, Hill AB. Mortality in relation to smoking: ten years’ observations onBritish doctors. BMJ 1964; i: 1399–414, 1460–7.
52 Doll R, Peto R. Mortality in relation to smoking: ten years’ observations onBritish doctors. BMJ 1976; ii: 1525–36.
53 Doll R, Peto R, Wheatley K, Gray R, Sutherland I. Mortality in relation tosmoking: 40 years’ observations on male British doctors. BMJ 1994; 309:901–11.
54 Guillebaud J. The pill, 4th edn. Oxford: Oxford University Press, 1991.55 Macnaughton J. Anecdote in clinical practice. In: Greenhalgh T, Hurwitz B, eds.
Narrative based medicine: dialogue and discourse in clinical practice. London: BMJPublications, 1999: 202–11.
56 McBride WG.Thalidomide and congenital abnormalities. Lancet 1961; ii: 1358.57 Pohjola-Sintonen S, Viitasalo M, Toivonen L, Neuvonen P. Itraconazole
prevents terfenadine metabolism and increases the risk of torsades de pointesventricular tachycardia. Eur J Clin Pharm 1993; 45: 191–3.
58 Middle C, Johnson A, Petty T, Sims L, Macfarlane A. Ethics approval for anational postal survey: recent experience. BMJ 1995; 311: 659–60.
59 Olde Rickert MGM, ten Have HAMJ, Hoefnagels WHL. Informed consent inbiomedical studies on ageing: survey of four journals. BMJ 1996; 313: 1117.
60 MRC Vitamin Research Group. Prevention of neural tube defects. Results of theMRC Vitamin Study. Lancet 1991; 338: 131–7.
HOW TO READ A PAPER
58

Chapter 4: Assessingmethodological quality
As I argued in section 3.1, a paper will sink or swim on thestrength of its methods section. This chapter considers fiveessential questions which should form the basis of your decision to“bin” it, suspend judgement or use it to influence your practice.
• Was the study original?
• Who is it about?
• Was it well designed?
• Was systematic bias avoided (i.e. was the study adequately“controlled”)?
• Was it large enough and continued for long enough to make theresults credible?
These questions are considered in turn below.
4.1 Was the study original?
There is, in theory, no point in testing a scientific question whichsomeone else has already proved one way or the other. But in reallife, science is seldom so cut and dried. Only a tiny proportion ofmedical research breaks entirely new ground and an equally tinyproportion repeats exactly the steps of previous workers. The vastmajority of research studies will tell us (if they are methodologicallysound) that a particular hypothesis is slightly more or less likely tobe correct than it was before we added our piece to the wider jigsaw.Hence, it may be perfectly valid to do a study which is, on the faceof it, “unoriginal”. Indeed, the whole science of meta-analysisdepends on there being several studies in the literature which have
59

addressed the same question in pretty much the same way.The practical question to ask, then, about a new piece of
research is not “Has anyone ever done a similar study before?” but“Does this new research add to the literature in any way?”.
• Is this study bigger, continued for longer or otherwise moresubstantial than the previous one(s)?
• Are the methods of this study any more rigorous (in particular,does it address any specific methodological criticisms of previousstudies)?
• Will the numerical results of this study add significantly to ametaanalysis of previous studies?
• Is the population studied different in any way (for example, hasthe study looked at different ethnic groups, ages or gender thanprevious studies)?
• Is the clinical issue addressed of sufficient importance, and doesthere exist sufficient doubt in the minds of the public or keydecision makers to make new evidence “politically” desirableeven when it is not strictly scientifically necessary?
4.2 Who is the study about?
One of the first papers that ever caught my eye was entitled “Butwill it help my patients with myocardial infarction?”1 I don’tremember the details of the article but it opened my eyes to the factthat research on someone else’s patients may not have a take homemessage for my own practice. This is not mere xenophobia. Themain reasons why the participants (Sir Iain Chalmers has arguedforcefully against calling them “patients”)2 in a clinical trial orsurvey might differ from patients in “real life” are as follows.
• They were more, or less, ill than the patients you see
• They were from a different ethnic group, or lived a differentlifestyle, from your own patients
• They received more (or different) attention during the study thanyou could ever hope to give your patients
• Unlike most real life patients, they had nothing wrong with themapart from the condition being studied
HOW TO READ A PAPER
60

• None of them smoked, drank alcohol or were taking thecontraceptive pill.
Hence, before swallowing the results of any paper whole, askyourself the following questions.
How were the subjects recruited?
If you wanted to do a questionnaire survey of the views of usersof the hospital casualty department, you could recruit respondentsby putting an advertisement in the local newspaper. However, thismethod would be a good example of recruitment bias since thesample you obtain would be skewed in favour of users who werehighly motivated and liked to read newspapers. You would, ofcourse, be better to issue a questionnaire to every user (or to a onein 10 sample of users) who turned up on a particular day.
Who was included in the study?
Many trials in the UK routinely exclude patients with co-existingillness, those who do not speak English, those taking certain othermedication, and the illiterate. This approach may be scientifically“clean” but since clinical trial results will be used to guide practicein relation to wider patient groups, it is not necessarily all thatlogical.3 The results of pharmacokinetic studies of new drugs in 23year old healthy male volunteers will clearly not be applicable to theaverage elderly female! This issue, which has been a bugbear of somedoctors for some time,4 has recently been taken up by the patientsthemselves, most notably in the plea from patient support groupsfor a broadening of inclusion criteria in trials of anti-AIDS drugs.5
Who was excluded from the study?
For example, a RCT may be restricted to patients with moderate orsevere forms of a disease such as heart failure, a policy which couldlead to false conclusions about the treatment of mild heart failure.Thishas important practical implications when clinical trials performed onhospital outpatients are used to dictate “best practice” in primarycare, where the spectrum of disease is generally milder.
Were the subjects studied in “real life” circumstances?
For example, were they admitted to hospital purely forobservation? Did they receive lengthy and detailed explanations of
ASSESSING METHODOLOGICAL QUALITY
61

the potential benefits of the intervention? Were they given thetelephone number of a key research worker? Did the company whofunded the research provide new equipment which would not beavailable to the ordinary clinician? These factors would not, ofcourse, invalidate the study itself but they may cast doubt on theapplicability of its findings to your own practice.
4.3 Was the design of the study sensible?
Although the terminology of research trial design can beforbidding, much of what is grandly termed “critical appraisal” isplain common sense. Personally, I assess the basic design of aclinical trial via two questions.
What specific intervention or other manoeuvre was being consideredand what was it being compared with?
This is one of the most fundamental questions in appraising anypaper. It is tempting to take published statements at face value butremember that authors frequently misrepresent (usually sub-consciously rather than deliberately) what they actually did andoverestimate its originality and potential importance. In the examplesin Box 4.1, I have used hypothetical statements so as not to causeoffence, but they are all based on similar mistakes seen in print.
What outcome was measured, and how?
If you had an incurable disease for which a pharmaceuticalcompany claimed to have produced a new wonder drug, you wouldmeasure the efficacy of the drug in terms of whether it made youlive longer (and, perhaps, whether life was worth living given yourcondition and any side effects of the medication).You would not betoo interested in the level of some obscure enzyme in your bloodwhich the manufacturer assured you was a reliable indicator ofyour chances of survival. The use of such surrogate endpoints isdiscussed further in section 6.3.
The measurement of symptomatic (for example, pain),functional (for example, mobility), psychological (for example,anxiety) or social (for example, inconvenience) effects of anintervention is fraught with even more problems.The methodologyof developing, administering and interpreting such “soft” outcomemeasures is beyond the scope of this book. But in general, you
HOW TO READ A PAPER
62

ASSESSING METHODOLOGICAL QUALITY
63
Box 4.1 Examples of problematic descriptions in the methodssection of papers
What the authors said What thev should have An example ofsaid (or should have done)
“We measured how “We looked in patients’ Assumption that often GPs ask patients medical records and medical records are whether they smoke” counted how many had 100% accurate
had their smoking status recorded”
“We measured how “We measured what Assumption that what doctors treat low back doctors say they do when doctors say they do pain” faced with a patient with reflects what they
low back pain” actually do
“We compared a “Subjects in the Failure to state dose of nicotine replacement intervention group were drug or nature of patch with placebo” asked to apply a patch placebo
containing 15 mg nicotine twice daily; those in the control group received identical looking patches”
“We asked 100 teenagers “We approached 167 Failure to give sufficient to participate in our white American teenagers information about survey of sexual aged 12–18 (85 males) at subjects (note in thisattitudes” a summer camp; 100 of example the figures
them (31 males) agreed to indicate a recruitment participate” bias towards females)
“We randomised patients “The intervention group Failure to give sufficientto either ‘individual care were offered an individual information about plan’ or ‘usual care’” care plan consisting of . . . ; intervention (enough
control patients were information should be offered . . .” given to allow the study
to be repeated by other workers)
“To assess the value of an If the study is purely to Failure to treat groups educational leaflet, we assess the value of the equally apart form the gave the intervention leaflet, both groups should specific interventiongroup a leaflet and a have got the helpline telephone helpline numbernumber. Controls received neither”
“We measured the use A systematic literature Unoriginal studyof vitamin C in the search would have found prevention of the numerous previous studies common cold” on this subject (see
section 8.1)

should always look for evidence in the paper that the outcomemeasure has been objectively validated, that someone hasdemonstrated that the scale of anxiety, pain, and so on used in thisstudy has previously been shown to measure what it purports tomeasure and that changes in this outcome measure adequatelyreflect changes in the status of the patient. Remember that what isimportant in the eyes of the doctor may not be valued so highly bythe patient, and vice versa.6
4.4 Was systematic bias avoided or minimised?
Systematic bias is defined by epidemiologists Geoffrey Rose andDavid Barker as anything which erroneously influences theconclusions about groups and distorts comparisons.7 Whether thedesign of a study is a randomised controlled trial, a non-randomisedcomparative trial, a cohort study or a case-control study, the aimshould be for the groups being compared to be as like one anotheras possible except for the particular difference being examined.They should, as far as possible, receive the same explanations, havethe same contacts with health professionals, and be assessed thesame number of times using the same outcome measures. Differentstudy designs call for different steps to reduce systematic bias.
Randomised controlled trials
In a RCT, systematic bias is (in theory) avoided by selecting asample of participants from a particular population and allocatingthem randomly to the different groups. Section 3.3 describessome ways in which bias can creep into even this gold standard ofclinical trial design and Figure 4.1 summarises particular sourcesto check for.
Non-randomised controlled clinical trials
I recently chaired a seminar in which a multidisciplinary groupof students from the medical, nursing, pharmacy, and alliedprofessions were presenting the results of several in-house researchstudies. All but one of the studies presented were of comparativebut non-randomised design – that is, one group of patients (say,hospital outpatients with asthma) had received one intervention(say, an educational leaflet), while another group (say, patientsattending GP surgeries with asthma) had received another
HOW TO READ A PAPER
64

ASSESSING METHODOLOGICAL QUALITY
65
Target populations (baseline state)
Allocation
Selection bias (systematic Intervention group Control groupdifferences in the comparisongroups attributable toincomplete randomisation)
Performance bias (systematic Exposed to Not exposed todifferences in the care intervention interventionprovided apart from theintervention being evaluated)
Exclusion bias (systematic Follow up Follow updifferences in withdrawalsfrom the trial)
Detection bias (systematic Outcomes Outcomesdifferences in outcomeassessment)
Figure 4.1 Sources of bias to check for in a randomised controlled trial

intervention (say, group educational sessions). I was surprised howmany of the presenters believed that their study was, or wasequivalent to, a randomised controlled trial. In other words, thesecommendably enthusiastic and committed young researchers wereblind to the most obvious bias of all: they were comparing twogroups which had inherent, self selected differences even before theintervention was applied (as well as having all the additionalpotential sources of bias listed in Figure 4.1 for RCTs).
As a general rule, if the paper you are looking at is a non-randomised controlled clinical trial, you must use your commonsense to decide if the baseline differences between the interventionand control groups are likely to have been so great as to invalidateany differences ascribed to the effects of the intervention. This is,in fact, almost always the case .8, 9 Sometimes, the authors of sucha paper will list the important features of each group (such as meanage, sex ratio, markers of disease severity, and so on) in a table toallow you to compare these differences yourself.
Cohort studies
The selection of a comparable control group is one of the mostdifficult decisions facing the authors of an observational (cohort orcase-control) study. Few, if any, cohort studies, for example,succeed in identifying two groups of subjects who are equal in age,gender mix, socioeconomic status, presence of co-existing illness,and so on, with the single difference being their exposure to theagent being studied. In practice, much of the “controlling” incohort studies occurs at the analysis stage, where complexstatistical adjustment is made for baseline differences in keyvariables. Unless this is done adequately, statistical tests ofprobability and confidence intervals (see section 5.5) will bedangerously misleading.10
This problem is illustrated by the various cohort studies on therisks and benefits of alcohol, which have consistently demonstrateda “J-shaped” relationship between alcohol intake and mortality.The best outcome (in terms of premature death) lies with thecohort who are moderate drinkers.11 Self confessed teetotallers, itseems, are significantly more likely to die young than the averageperson who drinks three or four alcoholic drinks a day.
But can we assume that teetotallers are, on average, identical tomoderate drinkers except for the amount they drink? We certainly
HOW TO READ A PAPER
66
can’t. As we all know, the teetotal population includes those who have been ordered to give up alcohol on health grounds(“sick quitters”), those who, for health or other reasons, have cut out a host of additional items from their diet and lifestyle,those from certain religious or ethnic groups which would beunderrepresented in the other cohorts (notably Muslims andSeventh Day Adventists), and those who drink like fish but chooseto lie about it.
The details of how these different features of “teetotalism” werecontrolled for by the epidemiologists are discussed elsewhere.11 Insummary, even when due allowance is made in the analysis forpotential confounding variables in subjects who describe them-selves as non-drinkers, these subjects’ increased risk of prematuremortality appears to remain.
Case-control studies
In case-control studies (in which, as I explained in section 3.7,the experiences of individuals with and without a particular diseaseare analysed retrospectively to identify putative causative events),the process which is most open to bias is not the assessment ofoutcome but the diagnosis of “caseness” and the decision as towhen the individual became a case.
A good example of this occurred a few years ago when a legalaction was brought against the manufacturers of the whoopingcough (pertussis) vaccine, which was alleged to have causedneurological damage in a number of infants.12 In order to answerthe question “Did the vaccine cause brain damage?”, a case-controlstudy had been undertaken in which a “case” was defined as aninfant who, previously well, had exhibited fits or other signssuggestive of brain damage within one week of receiving thevaccine. A control was an infant of the same age and sex taken fromthe same immunisation register, who had received immunisationand who may or may not have developed symptoms at some stage.
New onset of features of brain damage in apparently normalbabies is extremely rare but it does happen and the link with recentimmunisation could conceivably be coincidental. Furthermore,heightened public anxiety about the issue could have biased therecall of parents and health professionals so that infants whoseneurological symptoms predated, or occurred some time after, theadministration of pertussis vaccine might be wrongly classified as
ASSESSING METHODOLOGICAL QUALITY
67

cases. The judge in the court case ruled that misclassification ofthree such infants as “cases” rather than controls led to theoverestimation of the harm attributable to whooping cough vaccineby a factor of three.12 Although this ruling has subsequently beenchallenged, the principle stands – that assignment of “caseness” ina case-control study must be done rigorously and objectively ifsystematic bias is to be avoided.
4.5 Was assessment “blind”?
Even the most rigorous attempt to achieve a comparable controlgroup will be wasted effort if the people who assess outcome (forexample, those who judge whether someone is still clinically inheart failure or who say whether an X-ray is “improved” from lasttime) know which group the patient they are assessing wasallocated to. If you believe that the evaluation of clinical signs andthe interpretation of diagnostic tests such as ECGs and X-rays is100% objective, you haven’t been in the game very long.
The chapter “The clinical examination” in Sackett andcolleagues’ book Clinical epidemiology – a basic science for clinicalmedicine13 provides substantial evidence that when examiningpatients, doctors find what they expect and hope to find. It is rareindeed for two competent clinicians to reach agreement beyondwhat would be expected by chance in more than two cases in everythree for any given aspect of the physical examination orinterpretation of any diagnostic test.
The level of agreement beyond chance between two observerscan be expressed mathematically as the � (Kappa) score, with ascore of 1.0 indicating perfect agreement. � scores for specialistsassessing the height of a patient’s jugular venous pressure,classifying diabetic retinopathy from retinal photographs, andinterpreting a mammogram X-ray were, respectively, 0.42, 0.55,and 0.67.13
The above digression into clinical disagreement should havepersuaded you that efforts to keep assessors “blind” (or, to avoidoffence to the visually impaired, masked) to the group allocation oftheir patients are far from superfluous. If, for example, I knew thata patient had been randomised to an active drug to lower bloodpressure rather than to a placebo, I might be more likely to rechecka reading which was surprisingly high. This is an example of
HOW TO READ A PAPER
68

performance bias which, along with other pitfalls for the unblindedassessor, is listed in Figure 4.1.
An excellent example of controlling for bias by adequate“blinding” was published in the Lancet a few years ago.14 Majeedand colleagues performed a RCT which demonstrated, in contrastwith the findings of several previous studies, that the recovery time(days in hospital, days off work, and time to resume full activity)after laparoscopic removal of the gallbladder (the “keyhole surgery”approach) was no quicker than that associated with traditional openoperation. The discrepancy between this trial and its predecessorsmay have been due to Majeed and colleagues’ meticulous attemptto reduce bias (see Figure 4.1). The patients were not randomiseduntil after induction of general anaesthesia. Neither the patients northeir carers were aware of which operation had been done, since allpatients left the operating theatre with identical dressings (completewith blood stains!).These findings challenge previous authors to askthemselves whether it was expectation bias (see section 7.3) ratherthan swifter recovery which spurred doctors to discharge thelaparoscopic surgery group earlier.
4.6 Were preliminary statistical questions addressed?
As a non-statistician, I tend only to look for three numbers in themethods section of a paper:
1. the size of the sample
2. the duration of follow up
3. the completeness of follow up.
Sample size
One crucial prerequisite before embarking on a clinical trial is toperform a sample size (“power”) calculation. In the words ofstatistician Douglas Altman, a trial should be big enough to have ahigh chance of detecting, as statistically significant, a worthwhileeffect if it exists and thus to be reasonably sure that no benefitexists if it is not found in the trial.15
In order to calculate sample size, the clinician must decide twothings.
ASSESSING METHODOLOGICAL QUALITY
69

• What level of difference between the two groups would constitutea clinically significant effect. Note that this may not be the same asa statistically significant effect.You could administer a new drugwhich lowered blood pressure by around 10 mmHg and theeffect would be a statistically significant lowering of the chancesof developing stroke (i.e. the odds are less than 1 in 20 that thereduced incidence occurred by chance).16 However, if the peoplebeing asked to take this drug had only mildly raised bloodpressure and no other major risk factors for stroke (i.e. they wererelatively young, not diabetic, had normal cholesterol levels, andso on), this level of difference would only prevent around onestroke in every 850 patients treated17 – a clinical difference in riskwhich many patients would classify as not worth the effort oftaking the tablets.
• What the mean and the standard deviation (abbreviated SD; seesection 5.2) of the principal outcome variable is.
If the outcome in question is an event (such as hysterectomy)rather than a quantity (such as blood pressure), the items of datarequired are the proportion of people experiencing the event in thepopulation and an estimate of what might constitute a clinicallysignificant change in that proportion.
Once these items of data have been ascertained, the minimumsample size can be easily computed using standard formulae,nomograms or tables, which may be obtained from publishedpapers,15, 18 textbooks,19 or commercial statistical softwarepackages.20 Thus, the researchers can, before the trial begins, workout how large a sample they will need in order to have a moderate,high or very high chance of detecting a true difference between thegroups. The likelihood of detecting a true difference is known asthe power of the study. It is common for studies to stipulate a powerof between 80% and 90%. Hence, when reading a paper about aRCT, you should look for a sentence which reads something likethis (which is taken from Majeed and colleagues’ cholecystectomypaper described above):
“For a 90% chance of detecting a difference of one night’s stay inhospital using the Mann-Whitney U-test [see Chapter 5, Table 1], 100patients were needed in each group (assuming SD of 2 nights). This
HOW TO READ A PAPER
70

gives a power greater than 90% for detecting a difference in operatingtimes of 15 minutes, assuming a SD of 20 minutes.”14
If the paper you are reading does not give a sample sizecalculation and it appears to show that there is no differencebetween the intervention and control arms of the trial, you shouldextract from the paper (or directly from the authors) theinformation in the two bullet points above and do the calculationyourself. Underpowered studies are ubiquitous in the medicalliterature, usually because the authors found it harder than theyanticipated to recruit their subjects. Such studies typically lead to atype II or ß error, i.e. the erroneous conclusion that an interventionhas no effect. (In contrast, the rarer type I or � error is theconclusion that a difference is significant when in fact it is due tosampling error.)
Duration of follow up
Even if the sample size itself was adequate, a study must becontinued for long enough for the effect of the intervention to bereflected in the outcome variable. If the authors were looking at theeffect of a new painkiller on the degree of postoperative pain, theirstudy may only have needed a follow up period of 48 hours. On theother hand, if they were looking at the effect of nutritionalsupplementation in the preschool years on final adult height, followup should have been measured in decades.
Even if the intervention has demonstrated a significant differencebetween the groups after, say, six months, that difference may notbe sustained. As many dieters know from bitter experience,strategies to reduce obesity often show dramatic results after two orthree weeks but if follow up is continued for a year or more, theunfortunate subjects have (more often than not) put most of theweight back on.
Completeness of follow up
It has been shown repeatedly that subjects who withdraw from(“drop out of”) research studies are less likely to have taken theirtablets as directed, more likely to have missed their interim checkups, and more likely to have experienced side effects on anymedication than those who do not withdraw.13 People who fail tocomplete questionnaires may feel differently about the issue (and
ASSESSING METHODOLOGICAL QUALITY
71

probably less strongly) than those who send them back by returnof post. People on a weight reducing programme are more likely tocontinue coming back if they are actually losing weight.
The reasons why patients withdraw from clinical trials includethe following.
• Incorrect entry of patient into trial (i.e. researcher discoversduring the trial that the patient should not have been randomisedin the first place because he or she did not fulfil the entrycriteria).
• Suspected adverse reaction to the trial drug. Note that youshould never look at the “adverse reaction” rate in theintervention group without comparing it with that on placebo.Inert tablets bring people out in a rash surprisingly frequently!
• Loss of patient motivation (“I don’t want to take these tablets anymore”).
• Withdrawal by clinician for clinical reasons (for example,concurrent illness, pregnancy).
• Loss to follow up (for example, patient moves away).
• Death. Clearly, patients who die will not attend for theiroutpatient appointments, so unless specifically accounted forthey might be misclassified as “dropouts”.This is one reason whystudies with a low follow up rate (say below 70%) are generallyconsidered invalid.
Simply ignoring everyone who has withdrawn from a clinical trialwill bias the results, usually in favour of the intervention. It istherefore standard practice to analyse the results of comparativestudies on an intent to treat basis.21 This means that all data onpatients originally allocated to the intervention arm of the study,including those who withdrew before the trial finished, those whodid not take their tablets, and even those who subsequentlyreceived the control intervention for whatever reason, should beanalysed along with data on the patients who followed the protocolthroughout. Conversely, withdrawals from the placebo arm of thestudy should be analysed with those who faithfully took theirplacebo. If you look hard enough in a paper, you will usually findthe sentence “Results were analysed on an intent to treat basis”,
HOW TO READ A PAPER
72

but you should not be reassured until you have checked andconfirmed the figures yourself.
There are, in fact, a few situations when intent to treat analysisis, rightly, not used. The most common is the efficacy analysis,which is to explain the effects of the intervention itself and istherefore of the treatment actually received. But even if the subjectsin an efficacy analysis are part of a RCT, for the purposes of theanalysis they effectively constitute a cohort study (see section 3.4).
4.7 Summing up
Having worked through the methods section, you should be ableto tell yourself in a short paragraph what sort of study wasperformed, on how many subjects, where the subjects came from,what treatment or other intervention was offered, how long thefollow up period was (or, if a survey, what the response rate was),and what outcome measure(s) were used. You should also, at thisstage, identify what statistical tests, if any, were used to analyse theresults (see Chapter 5). If you are clear about these things beforereading the rest of the paper, you will find the results easier tounderstand, interpret and, if appropriate, reject.You should be ableto come up with descriptions such as:
This paper describes an unblinded randomised trial, concerned withtherapy, in 267 hospital outpatients aged between 58 and 93 years, inwhich four layer compression bandaging was compared with standardsingle layer dressings in the management of uncomplicated venous legulcers. Follow up was six months. Percentage healing of the ulcer wasmeasured from baseline in terms of the surface area of a tracing of thewound taken by the district nurse and calculated by a computerscanning device. Results were analysed using the Wilcoxon matchedpairs test.
This is a questionnaire survey of 963 general practitioners randomlyselected from throughout the UK, in which they were asked their yearof graduation from medical school and the level at which they wouldbegin treatment for essential hypertension. Response options on thestructured questionnaire were ‘90–99 mmHg’, ‘100-109 mmHg’, and‘110 mmHg or greater’. Results were analysed using a Chi squared teston a 3 x 2 table to see whether the threshold for treating hypertensionwas related to whether the doctor graduated from medical school beforeor after 1975.
ASSESSING METHODOLOGICAL QUALITY
73

This is a case report of a single patient with a suspected fatal adversedrug reaction to the newly released hypnotic drug Sleepol.
When you have had a little practice in looking at the methodssection of research papers along the lines suggested in this chapter,you will find that it is only a short step to start using the checklistsin Appendix 1 or the more comprehensive “Users’ guides to themedical literature” referenced in Chapter 3. I will return to manyof the issues discussed here in Chapter 6, in relation to evaluatingpapers on drug trials.
1 Mitchell JR. But will it help my patients with myocardial infarction? BMJ 1982;285: 1140–8.
2 Chalmers I. What I want from medical researchers when I am a patient. BMJ1997; 310: 1315–18.
3 Bero LA, Rennie D. Influences on the quality of published drug studies. Int JTechnol Assess Health Care1996; 12: 209–37.
4 Buyse ME. The case for loose inclusion criteria in clinical trials. Acta ChirurgBelg 1990; 90: 129–31.
5 Phillips AN, Davey Smith G, Johnson MA.Will we ever know how to treat HIVinfection? BMJ 1996; 313: 608–10.
6 Dunning M, Needham G. But will it work doctor? Report of conference held inNorthampton, 22nd and 23rd May 1996. London: King’s Fund, 1996.
7 Rose G, Barker DJP. Epidemiology for the uninitiated, 3rd edn. London: BMJPublications, 1994.
8 Chalmers TC, Celano P, Sacks HS, Smith H. Bias in treatment assignment incontrolled clinical trials. New Engl J Med 1983; 309: 1358–61.
9 Colditz GA, Miller JA, Mosteller JF. How study design affects outcome incomparisons of therapy. I: Medical. Stat Med 1989; 8: 441–54.
10 Brennan P, Croft P. Interpreting the results of observational research: chance isnot such a fine thing. BMJ 1994; 309: 727–30.
11 Maclure M. Demonstration of deductive meta-analysis: alcohol intake and riskof myocardial infarction. Epidemiol Rev 1993; 15: 328–51.
12 Bowie C. Lessons from the pertussis vaccine trial. Lancet 1990; 335: 397–9.13 Sackett DL, Haynes RB, Guyatt GH, Tugwell P. Clinical epidemiology – a basic
science for clinical medicine. London: Little, Brown, 1991: 19–49.14 Majeed AW, Troy G, Nicholl JP et al. Randomised, prospective, single-blind
comparison of laparoscopic versus small-incision cholecystectomy. Lancet 1996;347: 989–94.
15 Altman D. Practical statistics for medical research. London: Chapman and Hall,1991. The nomogram for calculating sample size or power is on page 456.
16 Medical Research Council Working Party. MRC trial of mild hypertension:principal results. BMJ 1985; 291: 97–104.
17 MacMahon S, Rogers A. The effects of antihypertensive treatment on vasculardisease: re-appraisal of the evidence in 1993. J Vasc Med Biol 1993; 4: 265–71.
18 Campbell MJ, Julious SA, Altman DG. Estimating sample size for binary,ordered categorical, and continuous outcomes in two group comparisons. BMJ1995; 311: 1145–8.
19 Machin D, Campbell MJ, Fayers PM, Pinol APY. Sample size tables for clinical
HOW TO READ A PAPER
74

studies, 2nd edn. London: Blackwell Science, 1997.20 Iwane M, Panesky J, Plante K. A user’s review of commercial sample size
software for design of biomedical studies using survival data. Controlled ClinTrials 1997; 18: 65–83.
21 Stewart LA, Parmar MKB. Bias in the analysis and reporting of randomizedcontrolled trials. Int J Technol Assess Health Care 1996; 12: 264–75.
ASSESSING METHODOLOGICAL QUALITY
75

Chapter 5: Statistics forthe non-statistician
5.1 How can non-statisticians evaluate statistical tests?
In this age where medicine leans increasingly on mathematics,no clinician can afford to leave the statistical aspects of a paperentirely to the “experts”. If, like me, you believe yourself to beinnumerate, remember that you do not need to be able to build acar in order to drive one. What you do need to know aboutstatistical tests is which is the best test to use for commonproblems. You need to be able to describe in words what the testdoes and in what circumstances it becomes invalid orinappropriate. Box 5.1 shows some frequently used “tricks of thetrade”, to which we all need to be alert (in our own as well as otherpeople’s practice).
I have found that one of the easiest ways to impress mycolleagues is to let slip a comment such as: “Ah, I see these authorshave performed a one tailed F test. I would have thought a twotailed test would have been more appropriate in thesecircumstances”. As you will see from the notes below, you do notneed to be able to perform the F test yourself to come up withcomments like this, but you do need to understand what its tailsmean.
The summary checklist in Appendix 1, explained in detail in thesections below, constitutes my own method for assessing theadequacy of a statistical analysis, which some readers will find toosimplistic. If you do, please skip this section and turn either to amore comprehensive presentation for the non-statistician, the“Basic statistics for clinicians” series in the Canadian MedicalAssociation Journal,1–4 or to a more mainstream statistical textbook.5
If, on the other hand, you find statistics impossibly difficult, take
76

these points one at a time and return to read the next point onlywhen you feel comfortable with the previous ones. None of thepoints presupposes a detailed knowledge of the actual calculationsinvolved.
The first question to ask, by the way, is “Have the authors usedany statistical tests at all?”. If they are presenting numbers and
STATISTICS FOR THE NON-STATISTICIAN
77
Box 5.1 Ten ways to cheat on statistical tests whenwriting up results
• Throw all your data into a computer and report as significant anyrelationship where “p < 0.05” (see section 5.5a).
• If baseline differences between the groups favour the interventiongroup, remember not to adjust for them (see Section 5.2a).
• Do not test your data to see if they are normally distributed. If youdo, you might get stuck with non-parametric tests, which aren’t asmuch fun (see section 5.2b).
• Ignore all withdrawals (“dropouts”) and non-responders, so theanalysis only concerns subjects who fully complied with treatment(see section 4.6c).
• Always assume that you can plot one set of data against anotherand calculate an “r value” (Pearson correlation coefficient) (seesection 5.4a), and that a “significant” r value proves causation (seesection 5.4b).
• If outliers (points that lie a long way from the others on yourgraph) are messing up your calculations, just rub them out. But ifoutliers are helping your case, even if they appear to be spuriousresults, leave them in (see section 5.3c).
• If the confidence intervals of your result overlap zero differencebetween the groups, leave them out of your report. Better still,mention them briefly in the text but don’t draw them in on thegraph and ignore them when drawing your conclusions (see section5.5b).
• If the difference between two groups becomes significant four anda half months into a six month trial, stop the trial and start writingup. Alternatively if at six months the results are “nearlysignificant”, extend the trial for another three weeks (see section5.2d).
• If your results prove uninteresting, ask the computer to go backand see if any particular subgroups behaved differently. You mightfind that your intervention worked after all in Chinese females aged52 to 61 (see section 5.2d).
• If analysing your data the way you plan to does not give the resultyou wanted, run the figures through a selection of other tests (seesection 5.2c).
claiming that these numbers mean something, without usingstatistical methods to prove it, they are almost certainly skating onthin ice.
5.2 Have the authors set the scene correctly?
Have they determined whether their groups are comparable and, ifnecessary, adjusted for baseline differences?
Most comparative clinical trials include either a table or aparagraph in the text showing the baseline characteristics of thegroups being studied. Such a table should demonstrate that boththe intervention and control groups are similar in terms of age andsex distribution and key prognostic variables (such as the averagesize of a cancerous lump). If there are important differences inthese baseline characteristics, even though these may be due tochance, it can pose a challenge to your interpretation of results. Inthis situation, you can carry out certain adjustments to try to allowfor these differences and hence strengthen your argument. To findout how to make such adjustments, see the section on this topic inDouglas Altman’s book Practical statistics for medical research.6
What sort of data have they got and have they used appropriatestatistical tests?
Numbers are often used to label the properties of things.We canassign a number to represent our height, weight, and so on. Forproperties like these, the measurements can be treated as actualnumbers. We can, for example, calculate the average weight andheight of a group of people by averaging the measurements. Butconsider a different example, in which we use numbers to label theproperty “city of origin”, where 1 = London, 2 = Manchester, 3 =Birmingham, and so on. We could still calculate the average ofthese numbers for a particular sample of cases but we would becompletely unable to interpret the result. The same would apply ifwe labelled the property “liking for x”, with 1 = not at all, 2 = a bit,and 3 = a lot. Again, we could calculate the “average liking” but thenumerical result would be uninterpretable unless we knew that thedifference between “not at all” and “a bit” was exactly the same asthe difference between “a bit” and “a lot”.
All statistical tests are either parametric (i.e. they assume that thedata were sampled from a particular form of distribution, such as a
HOW TO READ A PAPER
78

normal distribution) or non-parametric (i.e. they do not assumethat the data were sampled from a particular type of distribution).In general, parametric tests are more powerful than non-parametricones and so should be used if at all possible.
Non-parametric tests look at the rank order of the values (whichone is the smallest, which one comes next, and so on), and ignorethe absolute differences between them. As you might imagine,statistical significance is more difficult to demonstrate with non-parametric tests and this tempts researchers to use statistics such asthe r value (see section 5.4) inappropriately. Not only is the r value(parametric) easier to calculate than an equivalent non-parametricstatistic such as Spearman’s �, but it is also much more likely togive (apparently) significant results. Unfortunately it will also givean entirely spurious and misleading estimate of the significance ofthe result, unless the data are appropriate to the test being used.More examples of parametric tests and their non-parametricequivalents (if present) are given in Table 5.1.
Another consideration is the shape of the distribution fromwhich the data were sampled. When I was at school, my classplotted the amount of pocket money received against the numberof children receiving that amount. The results formed a histogramthe same shape as Figure 5.1 – a “normal” distribution. (The term“normal” refers to the shape of the graph and is used because manybiological phenomena show this pattern of distribution.) Somebiological variables such as body weight show skew distribution, asshown in Figure 5.2. (Figure 5.2 in fact shows a negative skew,whereas body weight would be positively skewed.The average adultmale body weight is 70 kg and people exist who are 140 kg butnobody weighs less than nothing, so the graph cannot possibly besymmetrical.)
Non-normal (skewed) data can sometimes be transformed to givea normal shape graph by plotting the logarithm of the skewedvariable or performing some other mathematical transformation(such as square root or reciprocal). Some data, however, cannot betransformed into a smooth pattern and the significance of this isdiscussed below. For a further, very readable discussion about thenormal distribution, see Chapter 7 of Martin Bland’s book Anintroduction to medical statistics.7
Deciding whether data are normally distributed is not anacademic exercise, since it will determine what type of statistical
STATISTICS FOR THE NON-STATISTICIAN
79

HOW TO READ A PAPER
80
Parametric test Example of equivalent Purpose of test Examplenon-parametric test
Two sample Mann-Whitney U test Compares two To compare girls’(unpaired) t test independent samples heights with
drawn from the same boys’ heightspopulation
One sample Wilcoxon matched Compares two sets of To compare weight (paired) t test pairs test observations on a of infants before
single sample (tests the and after a feedhypothesis that the mean difference between two measurements is zero)
One way analysis Analysis of variance by Effectively, a To determine of variance using ranks (e.g. Kruskall- generalisation of the whether plasma total sum of Wallis test) paired t or Wilcoxon glucose level is squares (e.g. F test) matched pairs test higher one hour, two
where three or more hours, or three hours sets of observations after a mealare made on a single sample
Two way analysis Two way analysis of As above, but tests the In the above of variance variance by ranks influence (and example, to
interaction) of two determine if different co-variates the results differ in
males and females
No direct �2 test Tests the null To assess whetherequivalent hypothesis that the acceptance into
proportions of medical school is variables estimated more likely if the from two (or more) applicant was born independent samples in the UKare the same
No direct McNemar’s test Tests the null To compare the equivalent hypothesis that the sensitivity and
proportions estimated specificity of twofrom a paired different diagnosticsample are the same tests when applied to
the same sample
Product moment Spearman’s rank Assesses the strength To assess whether correlation correlation coefficient of the straight line and to what extentcoefficient (�) association between plasma HbA1 level is (Pearson’s r) two continuous related to plasma
variables triglyceride level in diabetic patients
Regression by least No direct equivalent Describes the To see how peak squares method numerical relation expiratory flow rate
between two varies with heightquantitative variables,allowing one value to be predicted from the other
Multiple regression No direct equivalent Describes the To determine by least squares numerical relation whether and to what method between a dependent extent a person’s age,
variable and several body fat, and sodium predictor variables intake determine (co-variates) their blood pressure
Table 5.1 Some commonly used statistical tests

tests to use. For example, linear regression (see section 5.4) willgive misleading results unless the points on the scatter graph forma particular distribution about the regression line, i.e. the residuals(the perpendicular distance from each point to the line) shouldthemselves be normally distributed.Transforming data to achieve anormal distribution (if this is indeed achievable) is not cheating; it
STATISTICS FOR THE NON-STATISTICIAN
81
Figure 5.1 Example of a normal curve
Figure 5.2 Example of a skew curve

simply ensures that data values are given appropriate emphasis inassessing the overall effect. Using tests based on the normaldistribution to analyse non-normally distributed data is verydefinitely cheating.
If the statistical tests in the paper are obscure, why have the authorschosen to use them and have they included a reference?
There sometimes seems to be an infinite number of possiblestatistical tests. In fact, most statisticians could survive with aformulary of about a dozen. The rest are small print and should bereserved for special indications. If the paper you are reading appearsto describe a standard set of data wich have been collected in astandard way, but the test used is unpronounceable and not listed in abasic statistics textbook, you should smell a rat.The authors should,in such circumstances, state why they have used this test and give areference (with page numbers) for a definitive description of it.
Have the data been analysed according to the original study protocol?
Even if you are not interested in the statistical justification,common sense should tell you why points 8 and 9 in Box 5.1amount to serious cheating. If you trawl for long enough you willinevitably find some category of patient which appears to have doneparticularly well or badly. However, each time you look to see if aparticular subgroup is different from the rest you greatly increasethe likelihood that you will eventually find one which appears to beso, even though the difference is entirely due to chance.
Similarly, if you play coin toss with someone, no matter how faryou fall behind, there will come a time when you are one ahead.Most people would agree that to stop the game then would not bea fair way to play. So it is with research. If you make it inevitablethat you will (eventually) get an apparently positive result you willalso make it inevitable that you will be misleading yourself aboutthe justice of your case.8 Terminating an intervention trialprematurely for ethical reasons when subjects in one arm are faringparticularly badly is different, and is discussed elsewhere.8
Going back and raking over your data to look for “interestingresults” (retrospective subgroup analysis or, more colloquially, datadredging) can lead to false conclusions.9 In an early study on theuse of aspirin in the prevention of stroke in predisposed patients,the results showed a significant effect in both sexes combined and
HOW TO READ A PAPER
82

a retrospective subgroup analysis appeared to show that the effectwas confined to males.10 This conclusion led to aspirin beingwithheld from women for many years until the results of otherstudies (including a large metaanalysis11) showed this subgroupeffect to be spurious.
This and other examples are given in a paper by Oxman andGuyatt, “A consumer’s guide to subgroup analysis”, whichreproduces a useful checklist for deciding whether apparentdifferences in subgroup response are real.12
5.3 Paired data, tails, and outliers
Were paired tests performed on paired data?
Students often find it difficult to decide whether to use a pairedor unpaired statistical test to analyse their data.There is, in fact, nogreat mystery about this. If you measure something twice on eachsubject (for example, lying and standing blood pressure), you willprobably be interested not just in the average difference in lyingversus standing blood pressure in the entire sample, but in howmuch each individual’s blood pressure changes with position. Inthis situation, you have what is called “paired” data, because eachmeasurement beforehand is paired with a measurement afterwards.
In this example, it is having the same person on both occasionswhich makes the pairings but there are other possibilities (forexample, any two measurements of bed occupancy made of thesame hospital ward). In these situations, it is likely that the two setsof values will be significantly correlated (for example, my bloodpressure next week is likely to be closer to my blood pressure lastweek than to the blood pressure of a randomly selected adult lastweek). In other words, we would expect two randomly selected“paired” values to be closer to each other than two randomlyselected “unpaired” values. Unless we allow for this, by carryingout the appropriate “paired” sample tests, we can end up with abiased estimate of the significance of our results.
Was a two tailed test performed whenever the effect of an interventioncould conceivably be a negative one?
The concept of a test with tails always has me thinking of devilsor snakes, which I guess just reflects my aversion to statistics. Infact, the term “tail” refers to the extremes of the distribution – the
STATISTICS FOR THE NON-STATISTICIAN
83
dark areas in Figure 5.1. Let’s say that that graph represents thediastolic blood pressures of a group of individuals of which arandom sample are about to be put on a low sodium diet. If a lowsodium diet has a significant lowering effect on blood pressure,subsequent blood pressure measurements on these subjects wouldbe more likely to lie within the left hand “tail” of the graph. Hencewe would analyse the data with statistical tests designed to showwhether unusually low readings in this patient sample were likely tohave arisen by chance.
But on what grounds may we assume that a low sodium dietcould only conceivably put blood pressure down, but could neverput it up? Even if there are valid physiological reasons why thatmight be the case in this particular example, it is certainly not goodscience always to assume that you know the direction of the effectwhich your intervention will have. A new drug intended to relievenausea might actually exacerbate it and an educational leafletintended to reduce anxiety might increase it. Hence, your statisticalanalysis should, in general, test the hypothesis that either high orlow values in your dataset have arisen by chance. In the languageof the statisticians, this means you need a two tailed test unless youhave very convincing evidence that the difference can only be inone direction.
Were “outliers” analysed with both common sense and appropriatestatistical adjustments?
Unexpected results may reflect idiosyncrasies in the subject (forexample, unusual metabolism), errors in measurement (for example,faulty equipment), errors in interpretation (for example, misreading ameter reading), or errors in calculation (for example, misplaceddecimal points).Only the first of these is a “real” result which deservesto be included in the analysis. A result which is many orders ofmagnitude away from the others is less likely to be genuine, but it maybe. A few years ago, while doing a research project, I measured anumber of different hormone levels in about 30 subjects. Onesubject’s growth hormone levels came back about 100 times higherthan everyone else’s. I assumed this was a transcription error, so Imoved the decimal point two places to the left. Some weeks later, Imet the technician who had analysed the specimens and he asked“Whatever happened to that chap with acromegaly?”.
Statistically correcting for outliers (for example, to modify their
HOW TO READ A PAPER
84

effect on the overall result) is quite a sophisticated statisticalmanoeuvre. If you are interested, try the relevant section inDouglas Altman’s book.13
5.4 Correlation, regression, and causation
Has correlation been distinguished from regression and has the correlationcoefficient (r value) been calculated and interpreted correctly?
For many non-statisticians, the terms “correlation” and“regression” are synonymous, and refer vaguely to a mental imageof a scatter graph with dots sprinkled messily along a diagonal linesprouting from the intercept of the axes. You would be right inassuming that if two things are not correlated, it will be meaninglessto attempt a regression. But regression and correlation are bothprecise statistical terms which serve quite different functions.14
The r value (Pearson’s product moment correlation coefficient)is among the most overused statistical instruments in the book.Strictly speaking, the r value is not valid unless the followingcriteria are fulfilled.
• The data (or, strictly, the population from which the data aredrawn) should be normally distributed. If they are not, non-parametric tests of correlation should be used instead (see Table5.1).
• The two variables should be structurally independent (that is,one should not be forced to vary with the other). If they are not,a paired t or other paired test should be used instead.
• Only a single pair of measurements should be made on eachsubject, since the measurements made on successive subjectsneed to be statistically independent of each other if we are to endup with unbiased estimates of the population parameters ofinterest.14
• Every r value should be accompanied by a p value, whichexpresses how likely an association of this strength would be tohave arisen by chance (see section 5.5), or a confidence interval,which expresses the range within which the “true” R value islikely to lie (see section 5.5). (Note that lower case “r” representsthe correlation coefficient of the sample, whereas upper case “R”represents the correlation coefficient of the entire population.)
STATISTICS FOR THE NON-STATISTICIAN
85

Remember, too, that even if the r value is an appropriate value tocalculate from a set of data, it does not tell you whether therelationship, however strong, is causal (see below).
What, then, is regression? The term “regression” refers to amathematical equation which allows one variable (the targetvariable) to be predicted from another (the independent variable).Regression, then, implies a direction of influence, although as thenext section will argue, it does not prove causality. In the case ofmultiple regression, a far more complex mathematical equation(which, thankfully, usually remains the secret of the computerwhich calculated it) allows the target variable to be predicted fromtwo or more independent variables (often known as co-variables).
The simplest regression equation, which you may rememberfrom your schooldays, is y = a + bx, where y is the dependentvariable (plotted on the vertical axis), x is the independent variable(plotted on the horizontal axis), and a is the y-intercept. Not manybiological variables can be predicted with such a simple equation.The weight of a group of people, for example, varies with theirheight but not in a linear way. I am twice as tall as my son and threetimes his weight but although I am four times as tall as my newbornnephew I am much more than six times his weight.Weight, in fact,probably varies more closely with the square of someone’s heightthan with height itself (so that a quadratic rather than a linearregression would probably be more appropriate).
Of course, even when you have fed sufficient height–weight datainto a computer for it to calculate the regression equation whichbest predicts a person’s weight from their height, your predictionswould still be pretty poor since weight and height are not all thatclosely correlated. There are other things that influence weight inaddition to height and we could, to illustrate the principle ofmultiple regression, enter data on age, sex, daily calorie intake, andphysical activity level into the computer and ask it how much eachof these co-variables contributes to the overall equation (or model).
The elementary principles described here, particularly the pointson the previous page, should help you to spot whether correlationand regression are being used correctly in the paper you arereading. A more detailed discussion on the subject can be found inMartin Bland’s textbook14 and in the fourth article in the “Basicstatistics for clinicians” series.4
HOW TO READ A PAPER
86

Have assumptions been made about the nature and direction of causality?
Remember the ecological fallacy: just because a town has a largenumber of unemployed people and a very high crime rate, it doesnot necessarily follow that the unemployed are committing thecrimes! In other words, the presence of an association between Aand B tells you nothing at all about either the presence or thedirection of causality. In order to demonstrate that A has caused B(rather than B causing A or A and B both being caused by C), youneed more than a correlation coefficient. Box 5.2 gives somecriteria, originally developed by Sir Austen Bradford Hill, whichshould be met before assuming causality.15
5.5 Probability and confidence
Have “p values” been calculated and interpreted appropriately?
One of the first values a student of statistics learns to calculate isthe p value; that is the probability that any particular outcomewould have arisen by chance. Standard scientific practice, which isentirely arbitrary, usually deems a p value of less than one in 20(expressed as p < 0.05 and equivalent to a betting odds of 20 toone) as “statistically significant” and a p value of less than one in100 (p < 0.01) as “statistically highly significant”.
By definition, then, one chance association in 20 (this must bearound one major published result per journal issue) will appear tobe significant when it isn’t, and one in 100 will appear highlysignificant when it is really what my children call a “fluke”. Hence,
STATISTICS FOR THE NON-STATISTICIAN
87
Box 5.2 Tests for causality
• Is there evidence from true experiments in humans?
• Is the association strong?
• Is the association consistent from study to study?
• Is the temporal relationship appropriate (i.e. did the postulatedcause precede the postulated effect)?
• Is there a dose-response gradient (i.e. does more of the postulatedeffect follow more of the postulated cause)?
• Does the association make epidemiological sense?
• Does the association make biological sense?
• Is the association specific?
• Is the association analogous to a previously proven causal association?

if you must analyse multiple outcomes from your dataset, you needto make a correction to try to allow for this (some authorsrecommend the Bonferoni method16, 17).
A result in the statistically significant range (p < 0.05 or p < 0.01depending on what you have chosen as the cutoff) suggests that theauthors should reject the null hypothesis (i.e. the hypothesis thatthere is no real difference between two groups). But as I haveargued earlier (see section 4.6), a p value in the non-significantrange tells you that either there is no difference between the groupsor there were too few subjects to demonstrate such a difference if itexisted. It does not tell you which.
The p value has a further limitation. Gordon Guyatt andcolleagues, in the first article of their “Basic statistics for clinicians”series on hypothesis testing using p values, conclude:
“Why use a single cut-off point [for statistical significance] when thechoice of such a point is arbitrary? Why make the question of whether atreatment is effective a dichotomy (a yes–no decision) when it would bemore appropriate to view it as a continuum?”.1
For this, we need confidence intervals, which are considered next.
Have confidence intervals been calculated and do the authors’conclusions reflect them?
A confidence interval, which a good statistician can calculate on theresult of just about any statistical test (the t test, the r value, theabsolute risk reduction, the number needed to treat, and thesensitivity, specificity and other key features of a diagnostic test),allows you to estimate for both “positive” trials (those which show astatistically significant difference between two arms of the trial) and“negative” ones (those which appear to show no difference), whetherthe strength of the evidence is strong or weak and whether the study isdefinitive (i.e. obviates the need for further similar studies). Thecalculation of confidence intervals has been covered with great clarityin Gardner and Altman’s book Statistics with confidence18 and theirinterpretation has been covered by Guyatt and colleagues.2
If you repeated the same clinical trial hundreds of times, youwould not get exactly the same result each time. But, on average,you would establish a particular level of difference (or lack ofdifference!) between the two arms of the trial. In 90% of the trialsthe difference between two arms would lie within certain broad
HOW TO READ A PAPER
88

limits and in 95% of the trials it would lie between certain, evenbroader, limits.
Now if, as is usually the case, you only conducted one trial, howdo you know how close the result is to the “real” differencebetween the groups? The answer is you don’t. But by calculating,say, the 95% confidence interval around your result, you will beable to say that there is a 95% chance that the “real” difference liesbetween these two limits. The sentence to look for in a papershould read something like:
“In a trial of the treatment of heart failure, 33% of the patientsrandomised to ACE inhibitors died, whereas 38% of those randomisedto hydralazine and nitrates died. The point estimate of the differencebetween the groups [the best single estimate of the benefit in lives savedfrom the use of an ACE inhibitor] is 5%. The 95% confidence intervalaround this difference is –1.2% to +12%.”
More likely, the results would be expressed in the followingshorthand:
“The ACE inhibitor group had a 5% (95% CI –1.2 – + 12) highersurvival”.
In this particular example, the 95% confidence interval overlapszero difference and, if we were expressing the result as a dichotomy(i.e. Is the hypothesis “proven” or “disproven”?), we would classifyit as a negative trial. Yet as Guyatt and colleagues argue, thereprobably is a real difference and it probably lies closer to 5% thaneither –1.2% or +12%. A more useful conclusion from these resultsis that “All else being equal, an ACE inhibitor is the appropriatechoice for patients with heart failure, but that the strength of thatinference is weak”.2
As section 8.3 argues, the larger the trial (or the larger the pooledresults of several trials), the narrower the confidence interval andtherefore the more likely the result is to be definitive.
In interpreting “negative” trials, one important thing you need toknow is “would a much larger trial be likely to show a significantbenefit?”. To answer this question, look at the upper 95%confidence interval of the result. There is only one chance in 40(i.e. a 21/2% chance, since the other 21/2% of extreme results will liebelow the lower 95% confidence interval) that the real result will bethis much or more. Now ask yourself “Would this level of difference
STATISTICS FOR THE NON-STATISTICIAN
89

be clinically significant?” and if it wouldn’t, you can classify the trialas not only negative but also definitive. If, on the other hand, theupper 95% confidence interval represented a clinically significantlevel of difference between the groups, the trial may be negative butit is also non-definitive.
Until recently, the use of confidence intervals was relativelyuncommon in medical papers. In one survey of 100 articles fromthree top journals (The New England Journal of Medicine, Annals ofInternal Medicine, and Canadian Medical Association Journal), only43% reported any confidence intervals at all, whereas 66% gave ap value.1 The figure is now probably somewhat higher but even so,many authors do not interpret their confidence intervals correctly.You should check carefully in the discussion section to see whetherthe authors have correctly concluded (a) whether and to whatextent their trial supported their hypothesis and (b) whether anyfurther studies need to be done.
5.6 The bottom line (quantifying the risk of benefitand harm)
Have the authors expressed the effects of an intervention in terms of thelikely benefit or harm which an individual patient can expect?
It is all very well to say that a particular intervention produces a“statistically significant difference” in outcome but if I were beingasked to take a new medicine I would want to know how muchbetter my chances would be (in terms of any particular outcome)than they would be if I didn’t take it. Four simple calculations (andI promise you they are simple: if you can add, subtract, multiply,and divide you will be able to follow this section) will enable you toanswer this question objectively and in a way which meanssomething to the non-statistician. The calculations are the relativerisk reduction, the absolute risk reduction, the number needed totreat, and the odds ratio.
To illustrate these concepts, and to persuade you that you needto know about them, let me tell you about a survey which TomFahey and his colleagues conducted in 1995.19 They wrote to 182board members of district health authorities in England (all ofwhom would be in some way responsible for making importanthealth service decisions) and put the following data to them aboutfour different rehabilitation programmes for heart attack victims.
HOW TO READ A PAPER
90
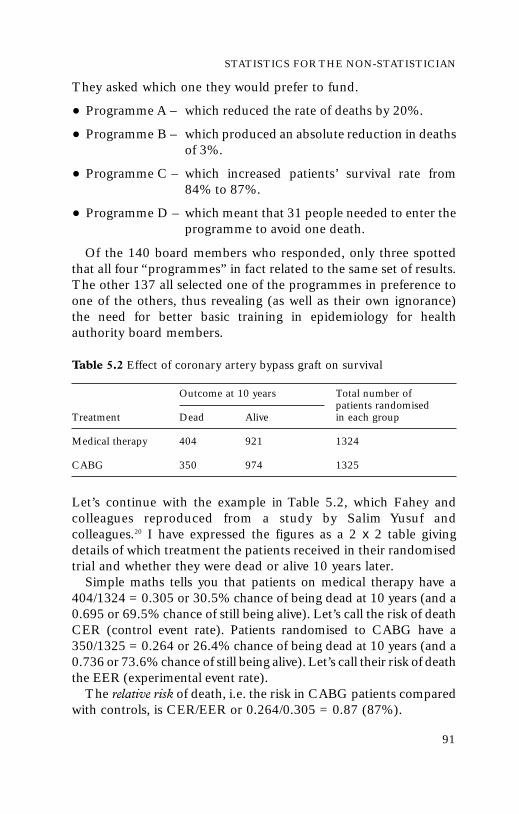
They asked which one they would prefer to fund.
• Programme A – which reduced the rate of deaths by 20%.
• Programme B – which produced an absolute reduction in deathsof 3%.
• Programme C – which increased patients’ survival rate from84% to 87%.
• Programme D – which meant that 31 people needed to enter theprogramme to avoid one death.
Of the 140 board members who responded, only three spottedthat all four “programmes” in fact related to the same set of results.The other 137 all selected one of the programmes in preference toone of the others, thus revealing (as well as their own ignorance)the need for better basic training in epidemiology for healthauthority board members.
Table 5.2 Effect of coronary artery bypass graft on survival
Outcome at 10 years Total number of patients randomised
Treatment Dead Alive in each group
Medical therapy 404 921 1324
CABG 350 974 1325
Let’s continue with the example in Table 5.2, which Fahey andcolleagues reproduced from a study by Salim Yusuf andcolleagues.20 I have expressed the figures as a 2 x 2 table givingdetails of which treatment the patients received in their randomisedtrial and whether they were dead or alive 10 years later.
Simple maths tells you that patients on medical therapy have a404/1324 = 0.305 or 30.5% chance of being dead at 10 years (and a0.695 or 69.5% chance of still being alive). Let’s call the risk of deathCER (control event rate). Patients randomised to CABG have a350/1325 = 0.264 or 26.4% chance of being dead at 10 years (and a0.736 or 73.6% chance of still being alive). Let’s call their risk of deaththe EER (experimental event rate).
The relative risk of death, i.e. the risk in CABG patients comparedwith controls, is CER/EER or 0.264/0.305 = 0.87 (87%).
STATISTICS FOR THE NON-STATISTICIAN
91

The relative risk reduction, i.e. the amount by which the risk ofdeath is reduced by CABG, (CER-EER)/CER = (0.305–0.264)/0.305 = 0.041/0.305 = 13%.
The absolute risk reduction (or risk difference), i.e. the absoluteamount by which CABG reduces the risk of death at 10 years, is0.305�0.264 = 0.041 (41%).
The number needed to treat, i.e. how many patients need a CABGin order to prevent, on average, one additional death by 10 years, isthe reciprocal of the absolute risk reduction, 1/ARR = 1/0.041 = 24.
The final way of expressing the effect of treatment which I wantto introduce here is the odds ratio. Look back at Table 5.2 and youwill see that the “odds” of dying compared to the “odds” ofsurviving for patients in the medical treatment group are 404/921= 0.44, and for patients in the CABG group are 350/974 = 0.36.The ratio of these odds will be 0.44/0.36 = 1.22, which is anotherway of expressing the fact that in this study, patients in the CABGgroup did better.
The general formulae for calculating these “bottom line” effectsof an intervention are reproduced in Appendix 4 and for adiscussion on which of these values is most useful in whichcircumstances, see Jaenschke and colleagues’ article in the “Basicstatistics for clinicians” series3 or Chapter 7 (Deciding on the besttherapy) of Sackett et al’s clinical epidemiology textbook.21
5.7 Summary
It is possible to be seriously misled by taking the statisticalcompetence (and/or the intellectual honesty) of authors for granted.Statistics can be an intimidating science and understanding its finerpoints often calls for expert help. But I hope that this chapter hasshown you that the statistics used in most medical research paperscan be evaluated by the non-expert using a simple checklist such asthat in Appendix 1. In addition, you might like to check the paperyou are reading (or writing) against the common errors given in Box 5.1.
1 Guyatt G, Jaenschke R, Heddle, N, Cook D, Shannon H, Walter S. Basicstatistics for clinicians. 1. Hypothesis testing. Can Med Assoc J 1995; 152: 27–32.
2 Guyatt G, Jaenschke R, Heddle N, Cook D, Shannon H, Walter S. Basicstatistics for clinicians. 2. Interpreting study results: confidence intervals. CanMed Assoc J 1995; 152: 169–73.
HOW TO READ A PAPER
92

3 Jaenschke R, Guyatt G, Shannon H, Walter S, Cook D, Heddle, N. Basicstatistics for clinicians. 3. Assessing the effects of treatment: measures ofassociation. Can Med Assoc J 1995; 152: 351–7.
4 Guyatt G, Walter S, Shannon H, Cook D, Jaenschke R, Heddle N. Basicstatistics for clinicians. 4. Correlation and regression. Can Med Assoc J 1995;152: 497–504.
5 Bland M. An introduction to medical statistics. Oxford: Oxford University Press, 1987.6 Altman D. Practical statistics for medical research. London: Chapman and Hall,
1995: 461–2.7 Bland M. An introduction to medical statistics. Oxford: Oxford University Press,
1987: 112–29.8 Hughes MD, Pocock SJ. Stopping rules and estimation problems in clinical
trials. Stat Med 1987; 7: 1231–42.9 Stewart LA, Parmar MKB. Bias in the analysis and reporting of randomized
controlled trials. Int J Technol Assess Health Care 1996; 12: 264–75.10 Canadian Cooperative Stroke Group. A randomised trial of aspirin and
sulfinpyrazone in threatened stroke. New Engl J Med 1978; 299: 53–9.11 Antiplatelet Triallists Collaboration. Secondary prevention of vascular disease
by prolonged antiplatelet treatment. BMJ 1988; 296: 320–1.12 Oxman AD, Guyatt GH. A consumer’s guide to subgroup analysis. Ann Intern
Med 1992; 116: 79–84.13 Altman D. Practical statistics for medical research. London: Chapman and Hall,
1995: 126–30.14 Bland M. An introduction to medical statistics. Oxford: Oxford University Press,
1987: 188–215.15 Bradford Hill A.The environment and disease: association or causation? Proc R
Soc Med 1965; 58: 295–300. Adapted version is reproduced with permissionfrom Haines A. Multi-practice research: a cohort study. In: Jones R, KinmonthA-L, eds. Critical reading for primary care. Oxford: Oxford University Press,1995: 124.
16 Altman D. Practical statistics for medical research. London: Chapman and Hall,1995: 210–12.
17 Pocock SJ, Geller XPL,Tsiatis AA.The analysis of multiple endpoints in clinicaltrials. Biometrics 1987; 43: 487–98.
18 Gardner MJ, Altman DG, eds. Statistics with confidence: confidence intervals andstatistical guidelines. London: BMJ Publications, 1989.
19 Fahey T, Griffiths S, Peters TJ. evidence based purchasing: understanding theresults of clinical trials and systematic reviews. BMJ 1995; 311: 1050–60.
20 Yusuf S, Zucker D, Peduzzi P et al. Effect of coronary artery bypass surgery onsurvival: overview of ten year results from randomized trials by the CoronaryArtery Surgery Triallists Collaboration. Lancet 1994; 344: 563–70.
21 Sackett DL, Haynes RB, Guyatt GH, Tugwell P. Clinical epidemiology – a basicscience for clinical medicine. London: Little, Brown, 1991: 187–248.
STATISTICS FOR THE NON-STATISTICIAN
93
Chapter 6: Papers thatreport drug trials
6.1 “Evidence” and marketing
If you are a clinical doctor or nurse practitioner (i.e. if youprescribe drugs), the pharmaceutical industry is interested in youand spends a proportion of its multimillion pound annualadvertising budget trying to influence you (see Box 6.1).The mosteffective way of changing the prescribing habits of a clinician is viaa personal representative (known to most of us in the UK as the“drug rep” and to our North American colleagues as the “detailer”),who travels round with a briefcase full of “evidence” in support ofhis or her wares.1 Indeed, as Chapter 12 discusses in more detail, theevidence based medicine movement has learnt a lot from the drugindustry in recent years about changing the behaviour of physiciansand now uses the same sophisticated techniques of persuasion inwhat is known as “academic detailing” of individual healthprofessionals.2
Before you agree to meet a “rep”, remind yourself of some basicrules of research methodology. As sections 3.4 and 3.6 argued,questions about the benefits of therapy should ideally be addressedwith randomised controlled trials. But preliminary questions aboutpharmacokinetics (i.e. how the drug behaves while it is getting toits site of action), particularly those relating to bioavailability,require a straight dosing experiment in healthy (and, if ethical andpracticable, sick) volunteers.
Common (and hopefully trivial) adverse drug reactions may bepicked up, and their incidence quantified, in the RCTs undertakento demonstrate the drug’s efficacy. But rare (and usually moreserious) adverse drug reactions require both pharmacovigilancesurveys (collection of data prospectively on patients receiving a
94

newly licensed drug) and case-control studies (see section 3.5) toestablish association. Ideally, individual rechallenge experiments(where the patient who has had a reaction considered to be causedby the drug is given the drug again in carefully supervisedcircumstances) should be performed to establish causation.3
Pharmaceutical reps do not tell nearly as many lies as they usedto (drug marketing has become an altogether more sophisticatedscience), but they have been known to cultivate a shockingignorance of basic epidemiology and clinical trial design when itsuits them.4 It often helps their case, for example, to present theresults of uncontrolled trials and express them in terms of before
PAPERS THAT REPORT DRUG TRIALS
95
Box 6.1 Ten tips for the pharmaceutical industry:how to present your product in the best light
• Think up a plausible physiological mechanism why the drug worksand become slick at presenting it. Preferably, find a surrogateendpoint that is heavily influenced by the drug, though it may notbe strictly valid (see section 6.3)
• When designing clinical trials, select a patient population, clinicalfeatures, and trial length that reflect the maximum possibleresponse to the drug
• If possible, compare your product only with placebos. If you mustcompare it with a competitor, make sure the latter is given atsubtherapeutic dose
• Include the results of pilot studies in the figures for definitivestudies (“Russian doll publication”), so it looks like more patientshave been randomised than is actually the case
• Omit mention of any trial that had a fatality or serious adverse drugreaction in the treatment group. If possible, don’t publish suchstudies
• Get your graphics department to maximise the visual impact ofyour message. It helps not to label the axes of graphs or saywhether scales are linear or logarithmic. Make sure you do notshow individual patient data or confidence intervals
• Become master of the hanging comparative (“better” – but betterthan what?)
• Invert the standard hierarchy of evidence so that anecdote takesprecedence over randomised trials and metaanalyses
• Name at least three local opinion leaders who use the drug andoffer “starter packs” for the doctor to try
• Present a “cost effectiveness” analysis that shows that yourproduct, even though more expensive than its competitor, “actuallyworks out cheaper” (see section 10.1)

and after differences in a particular outcome measure.5 Referenceback to section 3.6 and a look at the classic Lancet series onplacebo effects6–12 or the more recent overview from the UK HealthTechnology Assessment Programme13 should remind you whyuncontrolled before and after studies are the stuff of teenagemagazines, not hard science.
Dr Andrew Herxheimer, who edited Drug and TherapeuticsBulletin for many years, once undertook a survey of “references”cited in advertisements for pharmaceutical products in the leadingUK medical journals. He tells me that a high proportion of suchreferences cite “data on file” and many more refer to publicationswritten, edited, and published entirely by the industry. Evidencefrom these sources has sometimes (though by no means invariably)been shown to be of lower scientific quality than that whichappears in independent, peer reviewed journals.5 And let’s face it,if you worked for a drug company which had made a majorscientific breakthrough you would probably submit your findingsto a publication such as the Lancet or the New England Journal ofMedicine before publishing them in-house. In other words, youdon’t need to “trash” papers about drug trials because of where theyhave been published, but you do need to look closely at themethods and statistical analysis of such trials.
6.2 Making decisions about therapy
Sackett and colleagues, in their book Clinical epidemiology – abasic science for clinical medicine,14 argue that before starting a patienton a drug, the doctor should:
• identify for this patient the ultimate objective of treatment (cure,prevention of recurrence, limitation of functional disability,prevention of later complications, reassurance, palliation,symptomatic relief, etc.)
• select the most appropriate treatment using all available evidence(this includes addressing the question of whether the patientneeds to take any drug at all)
• specify the treatment target (how will you know when to stoptreatment, change its intensity or switch to some othertreatment?).
HOW TO READ A PAPERHOW TO READ A PAPER
96

For example, in the treatment of high blood pressure, the doctoror nurse practitioner might decide that:
• the ultimate objective of treatment is to prevent (further) target organdamage to brain,eye,heart, kidney,etc. (and thereby prevent death)
• the choice of specific treatment is between the various classes ofantihypertensive drug selected on the basis of randomised,placebo controlled and comparative trials, as well as betweennon-drug treatments such as salt restriction
• the treatment target might be a phase V diastolic blood pressure(right arm, sitting) of less than 90 mmHg or as close to that astolerable in the face of drug side effects.
If these three steps are not followed (as is often the case, forexample in terminal care), therapeutic chaos can result. In a veiledslight on surrogate endpoints, Sackett and his team remind us thatthe choice of specific therapy should be determined by evidence ofwhat does work and not on what seems to work or ought to work.“Today’s therapy”, they warn (p 188), “when derived from biologicfacts or uncontrolled clinical experience, may become tomorrow’sbad joke.”14
6.3 Surrogate endpoints
I have not included this section solely because it is a particularhobby horse of mine. If you are a practising (and non-academic)clinician, your main contact with published papers may well bethrough what gets fed to you by a drug rep. The pharmaceuticalindustry is a slick player at the surrogate endpoint game and I makeno apology for labouring the point that such outcome measuresmust be evaluated very carefully.
I will define a surrogate endpoint as “a variable which is relativelyeasily measured and which predicts a rare or distant outcome of either atoxic stimulus (for example, pollutant) or a therapeutic intervention (forexample, drug, surgical procedure, piece of advice), but which is not itselfa direct measure of either harm or clinical benefit”. The growinginterest in surrogate endpoints in medical research reflects twoimportant features of their use.
• They can considerably reduce the sample size, duration and,therefore, cost of clinical trials.
PAPERS THAT REPORT DRUG TRIALS
97

• They can allow treatments to be assessed in situations where theuse of primary outcomes would be excessively invasive orunethical.
In the evaluation of pharmaceutical products, commonly usedsurrogate endpoints include:
• pharmacokinetic measurements (for example, concentration-time curves of a drug or its active metabolite in the bloodstream)
• in vitro (i.e. laboratory) measures such as the mean inhibitoryconcentration (MIC) of an antimicrobial against a bacterialculture on agar
• macroscopic appearance of tissues (for example, gastric erosionseen at endoscopy)
• change in levels of (alleged) “biological markers of disease” (forexample, microalbuminuria in the measurement of diabetickidney disease15)
• radiological appearance (for example, shadowing on a chest X-ray).
Surrogate endpoints have a number of drawbacks. First, achange in the surrogate endpoint does not itself answer theessential preliminary questions “What is the objective of treatmentin this patient?” and “What, according to valid and reliable researchstudies, is the best available treatment for this condition?”. Second,the surrogate endpoint may not closely reflect the treatment target;in other words, it may not be valid or reliable. Third, the use of asurrogate endpoint has the same limitations as the use of any othersingle measure of the success or failure of therapy – it ignores all theother measures! Overreliance on a single surrogate endpoint as ameasure of therapeutic success usually reflects a narrow or naïveclinical perspective.
Finally, surrogate endpoints are often developed in animalmodels of disease, since changes in a specific variable can bemeasured under controlled conditions in a well defined population.However, extrapolation of these findings to human disease is liableto be invalid.16–18
• In animal studies, the population being studied has fairlyuniform biological characteristics and may be genetically inbred.
HOW TO READ A PAPER
98

• Both the tissue and the disease being studied may vary inimportant characteristics (for example, susceptibility to thepathogen, rate of cell replication) from the parallel condition inhuman subjects.
• The animals are kept in a controlled environment whichminimises the influence of lifestyle variables (for example, diet,exercise, stress) and concomitant medication.
• Giving high doses of chemicals to experimental animals maydistort the usual metabolic pathways and thereby give misleadingresults. Animal species best suited to serve as a surrogate forhumans vary for different chemicals.
The ideal features of a surrogate endpoint are shown in Box 6.2– and microalbuminuria in diabetic kidney disease is a good
PAPERS THAT REPORT DRUG TRIALS
99
Box 6.2 Ideal features of a surrogate endpoint
• The surrogate endpoint should be reliable, reproducible, clinicallyavailable, easily quantifiable, affordable, and exhibit a“dose–response” effect (that is, the higher the level of the surrogateendpoint, the greater the probability of disease)
• It should be a true predictor of disease (or risk of disease) and notmerely express exposure to a co-variable.The relation between thesurrogate endpoint and the disease should have a biologicallyplausible explanation
• It should be sensitive – that is, a “positive” result for the surrogateendpoint should pick up all or most patients at increased risk ofadverse outcome
• It should be specific – that is, a “negative” result should exclude allor most of those without increased risk of adverse outcome
• There should be a precise cutoff between normal and abnormalvalues
• It should have an acceptable positive predictive value – that is, a“positive” result should always or usually mean that the patient thusidentified is at increased risk of adverse outcome (see section 7.2)
• It should have an acceptable negative predictive value – that is, a“negative” result should always or usually mean that the patientthus identified is not at increased risk of adverse outcome (seesection 7.2)
• It should be amenable to quality control monitoring• Changes in the surrogate endpoint should rapidly and accurately
reflect the response to treatment – in particular, levels shouldnormalise in states of remission or cure

example of a marker that fulfils most if not all of these criteria.15 Ifthe rep who is trying to persuade you of the value of the drugcannot justify the endpoints used, you should challenge him or herto produce additional evidence.
One important example of the invalid use of a surrogateendpoint is the CD4 cell count (a measure of one type of whiteblood cell which, when I was at medical school, was known as the“T-helper cell”) in monitoring progression to AIDS in HIV positivesubjects. The CONCORDE trial19 was a RCT comparing earlyversus late initiation of zidovudine therapy in patients who wereHIV positive but clinically asymptomatic. Previous studies hadshown that early initiation of therapy led to a slower decline in theCD4 cell count (a variable which had been shown to fall with theprogression of AIDS) and it was assumed that a higher CD4 cellcount would reflect improved chances of survival.
However, the CONCORDE trial showed that while CD4 cellcounts fell more slowly in the treatment group, the three yearsurvival rates were identical in the two groups. This experienceconfirmed a warning issued earlier by authors suspicious of thevalidity of this endpoint.20 Subsequent research in this field hasattempted to identify a surrogate endpoint that correlates with realtherapeutic benefit, i.e. progression of asymptomatic HIV infectionto clinical AIDS and survival time after the onset of AIDS. A recentreview summarises the story and concludes that a combination ofseveral markers (including percentage of CD4 C29 cells, degree offatigue, age, and haemoglobin level) predicts progression muchbetter than the CD4 count.21
If you think this is an isolated example of the world’s bestscientists all barking up the wrong tree in pursuit of a bogusendpoint, check out the literature on using ventricular prematurebeats (a minor irregularity of the heartbeat) to predict death fromserious heart rhythm disturbance,22, 23 blood levels of antibiotics topredict clinical cure of infection,24 plaques on an MRI scan to chartthe progression of multiple sclerosis,25 and the use of the prostatespecific antigen (PSA) test to measure the response to therapy inprostate cancer (see p 116).26, 27 You might also like to see thefascinating literature on the development of valid and relevantsurrogate endpoints in the field of cancer prevention.28
Clinicians are increasingly sceptical of arguments for using newdrugs, or old drugs in new indications, that are not justified by
HOW TO READ A PAPER
100
direct evidence of effectiveness. Before surrogate endpoints can beused in the marketing of pharmaceuticals, those in the industrymust justify the utility of these measures by demonstrating aplausible and consistent link between the endpoint and thedevelopment or progression of disease.
It would be wrong to suggest that the pharmaceutical industrydevelops surrogate endpoints with the deliberate intention to misleadthe licensing authorities and health professionals. Surrogateendpoints, as I argued in section 6.1, have both ethical and economicimperatives. However, the industry does have a vested interest inoverstating its case on the strength of these endpoints. Given thatmuch of the data relating to the validation of surrogate endpoints arenot currently presented in published clinical papers, and that thedevelopment of such markers is often a lengthy and expensiveprocess, one author has suggested the setting up of a data archivewhich would pool data across studies.29 If, like me, you continuallyfind yourself questioning the validity of surrogate endpoints, youmight like to read more about the subject in a recent review.30
6.4 How to get evidence out of a drug rep
Any doctor who has ever given an audience to a rep who is sellinga non-steroidal antiinflammatory drug will recognise the gastricerosion example.The question to ask him or her is not “What is theincidence of gastric erosion on your drug?” but “What is theincidence of potentially life-threatening gastric bleeding?”. Otherquestions to ask drug reps, reproduced from an article in Drug andTherapeutics Bulletin31 and other sources,1, 5, 14 are listed below.
1. See representatives only by appointment. Choose to see onlythose whose product interests you and confine the interview tothat product.
2. Take charge of the interview. Do not hear out a rehearsed salesroutine but ask directly for the information below.
3. Request independent published evidence from reputable peerreviewed journals.
4. Do not look at promotional brochures, which often containunpublished material, misleading graphs, and selectivequotations.
PAPERS THAT REPORT DRUG TRIALS
101

5. Ignore anecdotal “evidence” such as the fact that a medicalcelebrity is prescribing the product.
6. Using the “STEP” acronym, ask for evidence in four specificareas.
• Safety – i.e. likelihood of long term or serious side effectscaused by the drug (remember that rare but serious adversereactions to new drugs may be poorly documented)
• Tolerability, which is best measured by comparing the pooledwithdrawal rates between the drug and its most significantcompetitor
• Efficacy, of which the most relevant dimension is how theproduct compares with your current favourite
• Price, which should take into account indirect as well asdirect costs (see section 10.3).
7. Evaluate the evidence stringently, paying particular attention tothe power (sample size) and methodological quality of clinicaltrials and the use of surrogate endpoints. Do not accepttheoretical arguments in the drug’s favour (for example,“longer half life”) without direct evidence that this translatesinto clinical benefit.
8. Do not accept the newness of a product as an argument forchanging to it. Indeed, there are good scientific arguments fordoing the opposite.32
9. Decline to try the product via starter packs or by participatingin small scale, uncontrolled “research” studies.
10. Record in writing the content of the interview and return tothese notes if the rep requests another audience.
1 Shaughnessy AF, Slawson DC. Pharmaceutical representatives. BMJ 1996; 312:1494-5.
2 Thomson O’Brien MA, Oxman AD, Haynes RB, Davis DA, Freemantle N,Harvey EL. Educational outreach visits: effects on professional practice andhealth care outcomes. In: The Cochrane Library, issue 1. Oxford: UpdateSoftware, 2000.
3 Sackett DL, Haynes RB, Guyatt GH, Tugwell P. Clinical epidemiology – a basicscience for clinical medicine. London: Little, Brown, 1991: 297–301.
HOW TO READ A PAPER
102

4 Bardelay D. Visits from medical representatives: fine principles, poor practice.Prescriber Int 1995; 4: 120–2.
5 Bero LA, Rennie D. Influences on the quality of published drug studies. Int JTechnol Assess Health Care 1996; 12: 209–37.
6 Kleijnen J, de Craen AJ, van Everdingen J, Krol L. Placebo effect in double-blind clinical trials: a review of interactions with medications. Lancet 1994; 344:1347–9.
7 Joyce CR. Placebo and complementary medicine. Lancet 1994; 344: 1279–81.8 Laporte JR, Figueras A. Placebo effects in psychiatry. Lancet 1994; 344:1206–9.9 Johnson AG. Surgery as a placebo. Lancet 1994; 344: 1140–2.10 Thomas KB. The placebo in general practice. Lancet 1994; 344:1066–7.11 Chaput de Saintonge DM, Herxheimer A. Harnessing placebo effects in health
care. Lancet 1994; 344: 995–8.12 Gotzsche PC. Is there logic in the placebo? Lancet 1994; 344: 925–6.13 Crow R, Gage H, Hampson S, Hart J, Kimber A, Thomas H. The role of
expectancies in the placebo effect and their use in the delivery of health care: asystematic review. Health Technol Assess 1999; 3(3). Available in full text onhttp://www.hta.nhsweb.nhs.uk/
14 Sackett DL, Haynes RB, Guyatt GH, Tugwell P. Clinical epidemiology – a basicscience for clinical medicine. London: Little, Brown, 1991: 187–248.
15 Epstein M, Parving HH, Ruilope LM. Surrogate endpoints and renalprotection: focus on microalbuminuria. Blood Pressure 1997; 2 (suppl): 52–7.
16 Gotzsche P, Liberati A, Torri V, Rosetti L. Beware of surrogate outcomemeasures. Int J Technol Assess Health Care 1996; 12: 238–46.
17 Lipkin M. Summary of recommendations for colonic biomarker studies ofcandidate chemopreventive compounds in phase II clinical trials. J CellularBiochem 1994; 19 (suppl): 94-8.
18 Kimbrough RD. Determining acceptable risks: experimental andepidemiological issues. Clin Chem 1994; 40: 1448–53.
19 CONCORDE Co-ordinating Committee. CONCORDE MRC/ANRSrandomised double-blind controlled trial of immediate and deferred zidovudinein symptom-free HIV infection. Lancet 1994; 343: 871–81.
20 Jacobson MA, Bacchetti P, Kolokathis A et al. Surrogate markers for survival inpatients with AIDS and AIDS related complex treated with zidovudine. BMJ1991; 302: 73–8.
21 Hughes MD, Daniels MJ, Fischl MA, Kim S, Schooley RT. CD4 cell count asa surrogate endpoint in HIV clinical trials: a meta-analysis of studies of theAIDS Clinical Trials Group. AIDS 1998; 12:1823–32.
22 Epstein AE, Hallstrom AO, Rogers WJ et al. Mortality following ventriculararrhythmia suppression by encainide, flecainide and moricizine after myocardialinfarction. JAMA 1993; 270: 2451–5.
23 Lipicky RJ, Packer M. Role of surrogate endpoints in the evaluation of drugs forheart failure. J Am Coll Cardiol 1993; 22 (suppl A): 179–84.
24 Hyatt JM, McKinnon PS, Zimmer GS, Schentag JJ. The importance ofpharmacokinetic/pharmacodynamic surrogate markers to outcome. Focus onantibacterial agents. Clin Pharmacokinet 1995; 28: 143–60.
25 Anonymous. Interferon beta-1b – hope or hype? Drug Therapeut Bull 1996; 34:9–11.
26 Carducci MA, DeWeese TL, Nelson JB. Prostate-specific antigen and othermarkers of therapeutic response. Urologic Clin North Am 2000; 26: 291–302.
27 Schroder FH, Kranse R, Barbet N, Hop WC, Kandra A, Lassus M. Prostate-specific antigen: a surrogate endpoint for screening new agents against prostatecancer? Prostate 2000; 42: 107–15.
PAPERS THAT REPORT DRUG TRIALS
103

28 See entire issue of Journal of Cellular Biochemistry 1994; 19 (suppl).29 Aickin M. If there is gold in the labelling index hills, are we digging in the right
place? J Cellular Biochem 1994; 19 (suppl): 91–3.30 Buyse M, Molenberghs G. Criteria for the validation of surrogate endpoints in
randomized experiments. Biometrics 1998; 54: 1014–29.31 Anonymous. Getting good value from drug reps. Drug Therapeut Bull 1983; 21:
13–15.32 Ferner RE. Newly licensed drugs. BMJ 1996; 313: 1157–8.
HOW TO READ A PAPER
104

Chapter 7: Papers thatreport diagnostic orscreening tests
7.1 Ten men in the dock
If you are new to the concept of validating diagnostic tests and ifalgebraic explanations (“Let’s call this value x ...”) leave you cold, thefollowing example may help you. Ten men are awaiting trial formurder. Only three of them actually committed a murder; the otherseven are innocent of any crime. A jury hears each case and finds sixof the men guilty of murder.Two of the convicted are true murderers.Four men are wrongly imprisoned. One murderer walks free.
This information can be expressed in what is known as a 2 x 2table (Table 7.1). Note that the “truth” (i.e. whether or not themen really committed a murder) is expressed along the horizontaltitle row, whereas the jury’s verdict (which may or may not reflectthe truth) is expressed down the vertical title row.
Table 7.1 2 x 2 table showing outcome of trial for 10 men accused ofmurder
True criminal status
Jury verdict Murderer Not murderer
“Guilty” Rightly convicted 2 men Wrongly convicted 4 men
“Innocent” Wrongly acquitted 1 man Rightly acquitted 3 men
You should be able to see that these figures, if they are typical,reflect a number of features of this particular jury.
• The jury correctly identifies two in every three true murderers.
105

• It correctly acquits three out of every seven innocent people.
• If this jury has found a person guilty, there is still only a one inthree chance that he is actually a murderer.
• If this jury found a person innocent, he has a three in four chanceof actually being innocent.
• In five cases out of every 10 the jury gets the verdict right.
These five features constitute, respectively, the sensitivity,specificity, positive predictive value, negative predictive value, andaccuracy of this jury’s performance. The rest of this chapterconsiders these five features applied to diagnostic (or screening)tests when compared with a “true” diagnosis or gold standard.Section 7.4 also introduces a sixth, slightly more complicated (butvery useful) feature of a diagnostic test – the likelihood ratio. (Afteryou have read the rest of this chapter, look back at this section. Bythen, you should be able to work out that the likelihood ratio of apositive jury verdict in the above example is 1.17, and that of anegative one 0.78. If you can’t, don’t worry – many eminentclinicians have no idea what a likelihood ratio is.)
7.2 Validating diagnostic tests against a gold standard
Our window-cleaner told me the other day that he had beenfeeling thirsty recently and had asked his general practitioner to betested for diabetes, which runs in his family. The nurse in hisgeneral practitioner’s surgery had asked him to produce a urinespecimen and dipped a special stick in it. The stick stayed green,which meant, apparently, that there was no sugar (glucose) in hisurine. This, the nurse had said, meant that he did not havediabetes.
I had trouble explaining to the window-cleaner that the testresult did not necessarily mean this at all, any more than a guiltyverdict necessarily makes someone a murderer. The definition ofdiabetes, according to the World Health Organisation, is a bloodglucose level above 7 mmol/l in the fasting state, or above 11.1mmol/l two hours after a 100 g oral glucose load (the much-dreaded “glucose tolerance test”, where the subject has to glugdown every last drop of a sickly glucose drink and wait two hoursfor a blood test). These values must be achieved on two separate
HOW TO READ A PAPER
106

occasions if the person has no symptoms, but on only one occasionif they have typical symptoms of diabetes (thirst, passing largeamounts of urine, and so on).
These stringent criteria can be termed the gold standard fordiagnosing diabetes. In other words, if you fulfil the WHO criteriayou can call yourself diabetic and if you don’t, you can’t (althoughnote that experts rightly challenge categorical statements such asthis and indeed, since the first edition of this book was publishedthe cutoff values in the gold standard test for diabetes using bloodglucose levels have all changed1). The same cannot be said fordipping a stick into a random urine specimen. For one thing, youmight be a true diabetic but have a high renal threshold; that is,your kidneys conserve glucose much better than most people’s, soyour blood glucose level would have to be much higher than mostpeople’s for any glucose to appear in your urine. Alternatively, youmay be an otherwise normal individual with a low renal threshold,so glucose leaks into your urine even when there isn’t any excess inyour blood. In fact, as anyone with diabetes will tell you, diabetesis very often associated with a negative test for urine glucose.
There are, however, many advantages in using a urine dipstickrather than the full blown glucose tolerance test to “screen” peoplefor diabetes. The test is cheap, convenient, easy to perform andinterpret, acceptable to patients, and gives an instant yes/no result.In real life, people like my window-cleaner may decline to take anoral glucose tolerance test. Even if he was prepared to go ahead withit, his general practitioner might decide that the window-cleaner’ssymptoms did not merit the expense of this relatively sophisticatedinvestigation. I hope you can see that even though the urine testcannot say for sure if someone is diabetic, it has a definite practicaledge over the gold standard.That, of course, is why we use it!
Table 7.2 2 x 2 table notation for expressing the results of a validationstudy for a diagnostic or screening test
Result of gold standard test
Result of screening test Disease positive a + c Disease negative b + d
Test positive a + b True positive a False positive b
Test negative c + d False negative c True negative d
PAPERS THAT REPORT DIAGNOSTIC OR SCREENING TESTS
107

HOW TO READ A PAPER
108
Feature of the test Alternative name Question which the Formula feature addresses (see Table 7.2)
Sensitivity True positive rate How good is this a/a+c(positive in disease) test at picking up
people who have the condition?
Specificity True negative rate How good is this d/b+d(negative in health) test at correctly
excluding people without the condition?
Positive predictive Post-test probability If a person tests a/a+bvalue of a positive test positive, what is the
probability that (s)he has the condition?
Negative predictive Indicates the post- If a person tests d/c+dvalue test probability of a negative, what is the
negative test* probability that (s)he does not have the condition?
Accuracy What proportion of (a+d)/(a+b+c+d)all tests have given the correct result (i.e. true positives and true negatives as a proportion of all results)?
Likelihood ratio How much more Sensitivity/of a positive test likely is a positive (1- specificity)
test to be found in a person with, as opposed to without,the condition?
* The post-test probability of a negative test is (1 - NPV)
Table 7.3 Features of a diagnostic test which can be calculated bycomparing it with a gold standard in a validation study

In order to assess objectively just how useful the urine glucosetest for diabetes is, we would need to select a sample of people (say100) and do two tests on each of them: the urine test (screeningtest), and a standard glucose tolerance test (gold standard). Wecould then see, for each person, whether the result of the screeningtest matched the gold standard. Such an exercise is known as avalidation study.We could express the results of the validation studyin a 2 x 2 table (also known as a 2 x 2 matrix) as in Table 7.2, andcalculate various features of the test as in Table 7.3, just as we didfor the features of the jury in section 7.1.If the values for the various features of a test (such as sensitivity andspecificity) fell within reasonable limits, we would be able to saythat the test was valid (see question 7 below).The validity of urinetesting for glucose in diagnosing diabetes has been looked at byAndersson and colleagues,2 whose data I have used in the examplein Table 7.4. In fact, the original study was performed on 3268subjects, of whom 67 either refused to produce a specimen or, forsome other reason, were not adequately tested. For simplicity’ssake, I have ignored these irregularities and expressed the results interms of a denominator (total number tested) of 1000 subjects.
In actual fact, these data came from an epidemiological survey todetect the prevalence of diabetes in a population; the validation ofurine testing was a side issue to the main study. If the validationhad been the main aim of the study, the subjects selected wouldhave included far more diabetic individuals, as question 2 insection 7.3 below will show. If you look up the original paper, youwill also find that the gold standard for diagnosing true diabetes
PAPERS THAT REPORT DIAGNOSTIC OR SCREENING TESTS
109
Table 7.4 2 x 2 table showing results of validation study of urineglucose testing for diabetes against gold standard of glucose tolerancetest (based on reference 2)
Result of glucose tolerance test
Diabetes positive Diabetes negative27 subjects 973 subjects
Result of urine Glucose present True positive 6 False positive 7test for glucose 13 subjects
Glucose absent False negative 21 True negative 966987 subjects

was not the oral glucose tolerance test but a more unconventionalseries of observations. Nevertheless, the example serves itspurpose, since it provides us with some figures to put through theequations listed in the last column of Table 7.3. We can calculatethe important features of the urine test for diabetes as follows.
• Sensitivity = a/a+c = 6/27 = 22.2%
• Specificity = d/b+d = 966/973 = 99.3%
• Positive predictive value = a/a+b = 6/13 = 46.2%
• Negative predictive value = d/c+d = 966/987 = 97.9%
• Accuracy = (a+d)/(a+b+c+d) = 972/1000 = 97.2%
• Likelihood ratio of a positive test = sensitivity/(1 – specificity) =22.2/0.7 = 32
• Likelihood ratio of a negative test = (1 – sensitivity)/specificity =77.8/99.3 = 0.78
From these features, you can probably see why I did not sharethe window-cleaner’s assurance that he did not have diabetes. Apositive urine glucose test is only 22% sensitive, which means thatthe test misses nearly four-fifths of true diabetics. In the presenceof classic symptoms and a family history, the window-cleaner’sbaseline odds (pretest likelihood) of having the condition are prettyhigh and they are only reduced to about four-fifths of this (thelikelihood ratio of a negative test, 0.78; see section 7.4) after asingle negative urine test. In view of his symptoms, this man clearlyneeds to undergo a more definitive test for diabetes. Note that asthe definitions in Table 7.3 show, if the test had been positive thewindow-cleaner would have good reason to be concerned, sinceeven though the test is not very sensitive (i.e. it is not good atpicking up people with the disease), it is pretty specific (i.e. it is goodat excluding people without the disease).
Students often get mixed up about the sensitivity/specificitydimension of a test and the positive/negative predictive valuedimension. As a rule of thumb, the sensitivity or specificity tells youabout the test in general, whereas the predictive value tells you aboutwhat a particular test result means for the patient in front of you. Hence,sensitivity and specificity are generally used more byepidemiologists and public health specialists whose day to day
HOW TO READ A PAPER
110

work involves making decisions about populations.A screening mammogram (breast X-ray) might have an 80%
sensitivity and a 90% specificity for detecting breast cancer, whichmeans that the test will pick up 80% of cancers and exclude 90% ofwomen without cancer. But imagine you were a GP or practice nurseand a patient comes to see you for the result of her mammogram.Thequestion she will want answered is (if the test has come back positive),“What is the chance that I’ve got cancer?” or (if it has come backnegative) “What is the chance that I can now forget about thepossibility of cancer?”. Many patients (and far too many healthprofessionals) assume that the negative predictive value of a test is100%, i.e. if the test is “normal” or “clear” they think there is nochance of the disease being present – and you only need to read theconfessional stories in women’s magazines (“I was told I had cancerbut tests later proved the doctors wrong”) to find examples of womenwho have assumed that the positive predictive value of a test is 100%.
7.3 Ten questions to ask about a paper which claims tovalidate a diagnostic or screening test
In preparing the tips below, I have drawn on three mainpublished sources: the “Users’ guides to the medical literature”3, 4
and the book by the same authors;5 a more recent article in theJAMA,6 and David Mant’s simple and pragmatic guidelines for“testing a test”.7
Question 1 Is this test potentially relevant to my practice?
This is the “so what?” question which Sackett and colleagues callthe utility of the test.5 Even if this test were 100% valid, accurateand reliable, would it help me? Would it identify a treatabledisorder? If so, would I use it in preference to the test I use now?Could I (or my patients or the taxpayer) afford it? Would mypatients consent to it? Would it change the probabilities forcompeting diagnoses sufficiently for me to alter my treatment plan?If the answers to these questions are all “no”, you may be able toreject the paper without reading further than the abstract orintroduction.
Question 2 Has the test been compared with a true gold standard?
You need to ask, first, whether the test has been compared with
PAPERS THAT REPORT DIAGNOSTIC OR SCREENING TESTS
111

anything at all! Papers have occasionally been written (and, in thepast, published) in which nothing has been done except performthe new test on a few dozen subjects. This exercise may give arange of possible results for the test, but it certainly does notconfirm that the “high” results indicate that the target disorder(the disease you are looking for) is present or that the “low”results indicate that it isn’t.
Next, you should verify that the “gold standard” test used in thesurvey merits the term. A good way of assessing a gold standard isto use the “so what?” questions listed above. For many conditions,there is no absolute gold standard diagnostic test which will say forcertain if it is present or not. Unsurprisingly, these tend to be thevery conditions for which new tests are most actively sought!Hence, the authors of such papers may need to develop and justifya combination of criteria against which the new test is to beassessed. One specific point to check is that the test being validatedhere (or a variant of it) is not being used to contribute to thedefinition of the gold standard.
Question 3 Did this validation study include an appropriate spectrumof subjects?
If you validated a new test for cholesterol in 100 healthy malemedical students, you would not be able to say how the test wouldperform in women, children, older people, those with diseases thatseriously raise the cholesterol level or even those who had neverbeen to medical school! Although few people would be naïveenough to select quite such a biased sample for their validationstudy, one paper found that only 27% of published studies explicitlydefined the spectrum of subjects tested in terms of age, sex,symptoms and/or disease severity, and specific eligibility criteria .6
Defining both the range of participants and the spectrum ofdisease to be included is essential if the values for the differentfeatures of the test are to be worth quoting, i.e. if they are to betransferable to other settings. A particular diagnostic test may,conceivably, be more sensitive in female subjects than males or inyounger rather than older subjects. For the same reasons, asSackett and colleagues stipulate, the subjects on which any test isverified should include those with both mild and severe disease,treated and untreated, and those with different but commonlyconfused conditions.5
HOW TO READ A PAPER
112

Whilst the sensitivity and specificity of a test are virtuallyconstant whatever the prevalence of the condition, the positive andnegative predictive values are crucially dependent on prevalence.This is why general practitioners are, often rightly, sceptical of theutility of tests developed exclusively in a secondary carepopulation, where the severity of disease tends to be greater (seesection 4.2), and why a good diagnostic test (generally used whenthe patient has some symptoms suggestive of the disease inquestion) is not necessarily a good screening test (generally used inpeople without symptoms, who are drawn from a population witha much lower prevalence of the disease).
Question 4 Has work up bias been avoided?
This is easy to check. It simply means, “did everyone who got thenew diagnostic test also get the gold standard, and vice versa?”. Ihope you have no problem spotting the potential bias in studieswhere the gold standard test is only performed on people who havealready tested positive for the test being validated. There are, inaddition, a number of more subtle aspects of work up bias which arebeyond the scope of this book. If you are interested, you could followthe discussion on this subject in Read and colleagues’ paper.6
Question 5 Has expectation bias been avoided?
Expectation bias occurs when pathologists and others whointerpret diagnostic specimens are subconsciously influenced bythe knowledge of the particular features of the case; for example,the presence of chest pain when interpreting an ECG. In thecontext of validating diagnostic tests against a gold standard, thequestion means “Did the people who interpreted one of the testsknow what result the other test had shown on each particularsubject?”. As I explained in section 4.5, all assessments should be“blind” – that is, the person interpreting the test should not begiven any inkling of what the result is expected to be in anyparticular case.
Question 6 Was the test shown to be reproducible both within andbetween observers?
If the same observer performs the same test on two occasions ona subject whose characteristics have not changed, they will getdifferent results in a proportion of cases. All tests show this feature
PAPERS THAT REPORT DIAGNOSTIC OR SCREENING TESTS
113

to some extent, but a test with a reproducibility of 99% is clearly ina different league from one with a reproducibility of 50%. Anumber of factors may contribute to the poor reproducibility of adiagnostic test: the technical precision of the equipment, observervariability (for example, in comparing a colour with a referencechart), arithmetical errors, and so on.
Look back again at section 4.5 to remind yourself of the problemof interobserver agreement. Given the same result to interpret, twopeople will agree in only a proportion of cases, generally expressedas the � score. If the test in question gives results in terms ofnumbers (such as the blood cholesterol level in mmol/l),interobserver agreement is hardly an issue. If, however, the testinvolves reading X-rays (such as the mammogram example insection 4.5) or asking a person questions about their drinkinghabits,8 it is important to confirm that reproducibility betweenobservers is at an acceptable level.
Question 7 What are the features of the test as derived from thisvalidation study?
All the above standards could have been met, but the test mightstill be worthless because the test itself is not valid, i.e. itssensitivity, specificity, and other crucial features are too low. Thatis arguably the case for using urine glucose as a screening test fordiabetes (see section 7.2 above). After all, if a test has a falsenegative rate of nearly 80%, it is more likely to mislead theclinician than assist the diagnosis if the target disorder is actuallypresent.
There are no absolutes for the validity of a screening test, sincewhat counts as acceptable depends on the condition beingscreened for. Few of us would quibble about a test for colourblindness that was 95% sensitive and 80% specific, but nobodyever died of colour blindness. The Guthrie heel prick screeningtest for congenital hypothyroidism, performed on all babies in theUK soon after birth, is over 99% sensitive but has a positivepredictive value of only 6% (in other words, it picks up almost allbabies with the condition at the expense of a high false positiverate),9 and rightly so. It is far more important to pick up everysingle baby with this treatable condition who would otherwisedevelop severe mental handicap than to save hundreds of parentsthe relatively minor stress of a repeat blood test on their baby.
HOW TO READ A PAPER
114

Question 8 Were confidence intervals given for sensitivity, specificity,and other features of the test?
As section 5.5 explained, a confidence interval, which can becalculated for virtually every numerical aspect of a set of results,expresses the possible range of results within which the true valuewill lie. Go back to the jury example in section 7.1. If they hadfound just one more murderer not guilty, the sensitivity of theirverdict would have gone down from 67% to 33% and the positivepredictive value of the verdict from 33% to 20%. This enormous(and quite unacceptable) sensitivity to a single case decision is, ofcourse, because we only validated the jury’s performance on 10cases. The confidence intervals for the features of this jury are sowide that my computer programme refuses to calculate them!Remember, the larger the sample size, the narrower theconfidence interval, so it is particularly important to look forconfidence intervals if the paper you are reading reports a studyon a relatively small sample. If you would like the formula forcalculating confidence intervals for diagnostic test features, seeGardner and Altman’s textbook Statistics with confidence.10
Question 9 Has a sensible “normal range” been derived from theseresults?
If the test gives non-dichotomous (continuous) results – i.e. if itgives a numerical value rather than a yes/no result – someone willhave to say at what value the test result will count as abnormal.Many of us have been there with our own blood pressure reading.We want to know if our result is “okay” or not, but the doctorinsists on giving us a value such as “142/92”. If 140/90 were chosenas the cutoff for high blood pressure, we would be placed in the“abnormal” category, even though our risk of problems from ourblood pressure is very little different from that of a person with ablood pressure of 138/88. Quite sensibly, many practising doctorsadvise their patients, “Your blood pressure isn’t quite right, but itdoesn’t fall into the danger zone. Come back in three months foranother check”. Nevertheless, the doctor must at some stage makethe decision that this blood pressure needs treating with tablets butthat one does not.
Defining relative and absolute danger zones for a continuousphysiological or pathological variable is a complex science, which
PAPERS THAT REPORT DIAGNOSTIC OR SCREENING TESTS
115

should take into account the actual likelihood of the adverseoutcome which the proposed treatment aims to prevent. Thisprocess is made considerably more objective by the use of likelihoodratios (see section 7.4). For an entertaining discussion on thedifferent possible meanings of the word “normal” in diagnosticinvestigations, see Sackett and colleagues’ textbook,5 page 59.
Question 10 Has this test been placed in the context of other potentialtests in the diagnostic sequence for the condition?
In general, we treat high blood pressure simply on the basis ofthe blood pressure reading alone (although we tend to rely on aseries of readings rather than a single value). Compare this with thesequence we use to diagnose stenosis (“hardening”) of thecoronary arteries. First, we select patients with a typical history ofeffort angina (chest pain on exercise). Next, we usually do a restingECG, an exercise ECG, and, in some cases, a radionuclide scan ofthe heart to look for areas short of oxygen. Most patients only cometo a coronary angiogram (the definitive investigation for coronaryartery stenosis) after they have produced an abnormal result onthese preliminary tests.
If you took 100 people off the street and sent them straight for acoronary angiogram, the test might display very different positiveand negative predictive values (and even different sensitivity andspecificity) than it did in the sicker population on which it wasoriginally validated. This means that the various aspects of validityof the coronary angiogram as a diagnostic test are virtuallymeaningless unless these figures are expressed in terms of whatthey contribute to the overall diagnostic work up.
7.4 A note on likelihood ratios
Question 9 above described the problem of defining a normalrange for a continuous variable. In such circumstances, it can bepreferable to express the test result not as “normal” or “abnormal”but in terms of the actual chances of a patient having the targetdisorder if the test result reaches a particular level. Take, forexample, the use of the prostate specific antigen (PSA) test toscreen for prostate cancer. Most men will have some detectablePSA in their blood (say, 0.5 ng/ml) and most of those withadvanced prostate cancer will have very high levels of PSA (above
HOW TO READ A PAPER
116

about 20 ng/ml). But a PSA level of, say, 7.4 ng/ml may be foundin either a perfectly normal man or in someone with early cancer.There simply is not a clean cutoff between normal and abnormal.11
We can, however, use the results of a validation study of the PSAtest against a gold standard for prostate cancer (say a biopsy) to drawup a whole series of 2 x 2 tables. Each table would use a differentdefinition of an abnormal PSA result to classify patients as “normal”or “abnormal”. From these tables, we could generate differentlikelihood ratios associated with a PSA level above each differentcutoff point.Then, when faced with a PSA result in the “grey zone”,we would at least be able to say “This test has not proved that thepatient has prostate cancer, but it has increased [or decreased] theodds of that diagnosis by a factor of x”. (In fact, as I mentioned insection 6.3, the PSA test is not a terribly good discriminator betweenthe presence and absence of cancer, whatever cutoff value is used. Inother words, there is no value for PSA that gives a particularly highlikelihood ratio in cancer detection.)
Although the likelihood ratio is one of the more complicatedaspects of a diagnostic test to calculate, it has enormous practicalvalue and it is becoming the preferred way of expressing andcomparing the usefulness of different tests. As Sackett andcolleagues explain at great length in their textbook,5 the likelihoodratio can be used directly in ruling a particular diagnosis in or out.For example, if a person enters my consulting room with nosymptoms at all, I know that they have a 5% chance of having irondeficiency anaemia, since I know that one person in 20 has thiscondition (in the language of diagnostic tests, this means that thepretest probability of anaemia, equivalent to the prevalence of thecondition, is 0.05).12
Now, if I do a diagnostic test for anaemia, the serum ferritinlevel, the result will usually make the diagnosis of anaemia eithermore or less likely. A moderately reduced serum ferritin level(between 18 and 45 (µg/l) has a likelihood ratio of 3, so the chanceof a patient with this result having iron deficiency anaemia isgenerally calculated as 0.05 x 3 or 0.15 (15%).This value is knownas the post-test probability of the serum ferritin test. (Strictlyspeaking, likelihood ratios should be used on odds rather than onprobabilities, but the simpler method shown here gives a goodapproximation when the pretest probability is low. In this example,a pretest probability of 5% is equal to a pre-test odds of 0.05/0.95
PAPERS THAT REPORT DIAGNOSTIC OR SCREENING TESTS
117

or 0.053; a positive test with a likelihood ratio of 3 gives a post-testodds of 0.158, which is equal to a post-test probability of 14%12).
Figure 7.1 shows a nomogram, adapted by Sackett andcolleagues from an original paper by Fagan,13 for working out post-test probabilities when the pretest probability (prevalence) andlikelihood ratio for the test are known.The lines A, B, and C, drawnfrom a pretest probability of 25% (the prevalence of smoking
HOW TO READ A PAPER
118
Figure 7.1 Using likelihood ratios to calculate the post-test probabilityof someone being a smoker
Pretest Likelihood Post-testprobability ratio probability
Likelihood ratio nomogram

amongst British adults) are respectively the trajectories throughlikelihood ratios of 15, 100, and 0.015 – three different tests fordetecting whether someone is a smoker.14 Actually, test C detectswhether the person is a non-smoker, since a positive result in thistest leads to a post-test probability of only 0.5%.
In summary, as I said at the beginning of this chapter, you canget a long way with diagnostic tests without referring to likelihoodratios. I avoided them myself for years. But if you put aside anafternoon to get to grips with this aspect of clinical epidemiology,I predict that your time will have been well spent.
1 Puavilai G, Chanprasertyotin S, Sriphrapradaeng A. Diagnostic criteria fordiabetes mellitus and other categories of glucose intolerance: 1997 criteria bythe Expert Committee on the Diagnosis and Classification of Diabetes Mellitus(ADA), 1998 WHO consultation criteria, and 1985 WHO criteria. Diabetes ResClin Pract 1999; 44: 21–6.
2 Andersson DKG, Lundblad E, Svardsudd K. A model for early diagnosis ofType 2 diabetes mellitus in primary health care. Diabetic Med 1993; 10: 167–73.
3 Jaeschke R, Guyatt G, Sackett DL. Users’ guides to the medical literature. III.How to use an article about a diagnostic test. A. Are the results of the studyvalid? JAMA 1994; 271: 389–91.
4 Jaeschke R, Guyatt G, Sackett DL. Users’ guides to the medical literature. III.How to use an article about a diagnostic test. B.What were the results and willthey help me in caring for my patients? JAMA 1994; 271: 703–7.
5 Sackett DL, Haynes RB, Guyatt GH, Tugwell P. Clinical epidemiology – a basicscience for clinical medicine. London: Little, Brown, 1991: 51–68.
6 Read MC, Lachs MS, Feinstein AR. Use of methodological standards indiagnostic test research: getting better but still not good. JAMA 1995; 274:645–51.
7 Mant D. Testing a test: three critical steps. In: Jones R, Kinmonth A-L, eds.Critical reading for primary care. Oxford: Oxford University Press, 1995: 183–90.
8 Bush B, Shaw S, Cleary P et al. Screening for alcohol abuse using the CAGEquestionnaire. Am J Med 1987; 82: 231–6.
9 Verkerk PH, Derksen-Lubsen G, Vulsma T, Loeber JG, de Vijlder JJ, VerbruggeHP. Evaluation of a decade of neonatal screening for congenital hypothyroidismin The Netherlands. Ned Tijdschr Geneesk 1993; 137: 2199–205.
10 Gardner MJ, Altman DG, eds. Statistics with confidence: confidence intervals andstatistical guidelines. London: BMJ Publications, 1989.
11 Catalona WJ, Hudson MA, Scardino PT et al. Selection of optimal prostatespecific antigen cutoffs for early diagnosis of prostate cancer: receiver operatorcharacteristic curves. J Urol 1994; 152: 2037–42.
12 Guyatt GH, Patterson C, Ali M et al. Diagnosis of iron deficiency anaemia inthe elderly. Am J Med 1990; 88: 205–9.
13 Fagan TJ. Nomogram for Bayes’ theorem. New Engl J Med 1975; 293: 257–61.14 Anonymous. How good is that test – using the result. Bandolier 1996; 3: 6-8.
PAPERS THAT REPORT DIAGNOSTIC OR SCREENING TESTS
119

Chapter 8: Papers thatsummarise other papers(systematic reviews andmeta-analyses)
8.1 When is a review systematic?
Remember the essays you used to write when you first startedcollege? You would mooch round the library, browsing through theindexes of books and journals. When you came across a paragraphthat looked relevant you copied it out and if anything you founddid not fit in with the theory you were proposing, you left it out.This, more or less, constitutes the methodology of the journalisticreview – an overview of primary studies which have not beenidentified or analysed in a systematic (i.e. standardised andobjective) way. Journalists get paid according to how much theywrite rather than how much they read or how critically theyprocess it, which explains why most of the “new scientificbreakthroughs” you read about in your newspaper today willprobably be discredited before the month is out.
In contrast, a systematic review is an overview of primary studieswhich:
• contains a statement of objectives, materials, and methods
• has been conducted according to explicit and reproduciblemethodology (see Figure 8.1).1
The most enduring and useful systematic reviews, notably thoseundertaken by the Cochrane Collaboration (see section 2.11), areregularly updated to incorporate new evidence.
120

Many, if not most, medical review articles are still written injournalistic form. Professor Paul Knipschild, in Iain Chalmers’ andDoug Altman’s excellent book Systematic reviews,2 describes howNobel prize winning biochemist Linus Pauling used selectivequotes from the medical literature to “prove” his theory thatvitamin C helps you live longer and feel better.3 When Knipschildand his colleagues searched the literature systematically for evidencefor and against this hypothesis, they found that, although one ortwo trials did strongly suggest that vitamin C could prevent theonset of the common cold, there were far more studies which didnot show any beneficial effect.
PAPERS THAT SUMMARISE OTHER PAPERS
121
State objectives of the review of randomised controlled trials and outline eligibility criteria
Search for trials that seem to meet eligibility criteria
Tabulate characteristics of each trial identified and assess itsmethodological quality
Apply eligibility criteria and justify any exclusions
Assemble the most complete dataset feasible, with assistance frominvestigators, if possible
Analyse results of eligible randomised controlled trials by using statistical synthesis of data (meta-analysis) if appropriate and possible
Compare alternative analyses, if appropriate and possible
Prepare a critical summary of the review, stating aims, describingmaterials and methods, and reporting results
Figure 8.1 Method for a systematic review of randomised controlledtrials

Linus Pauling probably did not deliberately intend to deceive hisreaders, but since his enthusiasm for his espoused causeoutweighed his scientific objectivity, he was unaware of the selectionbias influencing his choice of papers. Much work has been done,most notably by Professor Cynthia Mulrow of the University ofTexas Health Science Center, USA, which confirms the sneakyfeeling that were you or I to attempt what Pauling did – i.e. huntthrough the medical literature for “evidence” to support our pettheory – we would make an equally idiosyncratic and unscientificjob of it.4, 5 Mulrow, along with Iain Chalmers at the UK CochraneCentre and Peter Gøtzsche and Andy Oxman of the NordicCochrane Centre (see section 2.11), deserves much of the creditfor persuading the rest of the medical community that flawedsecondary research, exemplified by the journalistic review, is asscientifically dangerous as flawed primary research. Someadvantages of the systematic review are given in Box 8.1.
Experts, who have been steeped in a subject for years and knowwhat the answer “ought” to be, were once shown to be significantlyless able to produce an objective review of the literature in theirsubject than non-experts.6 This would have been of littleconsequence if experts’ opinions could be relied upon to becongruent with the results of independent systematic reviews, but
HOW TO READ A PAPER
122
Box 8.1 Advantages of systematic reviews3
• Explicit methods limit bias in identifying and rejecting studies
• Conclusions are hence more reliable and accurate• Large amounts of information can be assimilated quickly by health
care providers, researchers, and policymakers
• Delay between research discoveries and implementation of effectivediagnostic and therapeutic strategies is potentially reduced (seeChapter 12)
• Results of different studies can be formally compared to establishgeneralisability of findings and consistency (lack of heterogeneity) ofresults (see section 8.4)
• Reasons for heterogeneity (inconsistency in results across studies)can be identified and new hypotheses generated about particularsubgroups (see section 8.4)
• Quantitative systematic reviews (metaanalyses) increase theprecision of the overall result (see sections 4.6 and 8.3)

at the time they most certainly couldn’t.7 These condemningstudies are still widely quoted by people who would replace allsubject experts (such as cardiologists) with search and appraisalexperts (people who specialise in finding and criticising papers onany subject). But no one in more recent years has replicated thefindings; in other words, perhaps we should credit today’s expertswith more of a tendency to base their recommendations on athorough assessment of the evidence! As a general rule, however, ifyou are going to pay someone to seek out the best objectiveevidence of the benefits of anticoagulants in atrial fibrillation, youshould ask someone who is an expert in systematic reviews to workalongside an expert in atrial fibrillation.
To be fair to Linus Pauling, he did mention a number of trialswhose results seriously challenged his theory that vitamin Cprevents the common cold,3 but he described all such trials as“methodologically flawed”. As Knipschild reminds us, so weremany of the trials which Pauling did include in his analysis butbecause their results were consistent with his theory, Pauling was,perhaps subconsciously, less critical of weaknesses in their design.
I mention this to illustrate the point that, when undertaking asystematic review, not only must the search for relevant articles bethorough and objective but the criteria used to reject articles as“flawed” must be explicit and independent of the results of thosetrials. In other words, you don’t trash a trial because all other trialsin this area showed something different (see section 8.4); you trashit because, whatever the results showed, the trial’s objectives ormethods did not meet your inclusion criteria (see section 3.1).
8.2 Evaluating systematic reviews
Question 1 Can you find an important clinical question which thereview addressed?
Look back to Chapter 3, in which I explained the importance ofdefining the question when reading a paper about a clinical trial orother form of primary research. I called this “getting your bearings”since one sure way to be confused about a paper is to fail to ascertainwhat it is about.The definition of a specific answerable question is,if anything, even more important (and even more frequentlyomitted!) when preparing an overview of primary studies. If youhave ever tried to pull together the findings of a dozen or more
PAPERS THAT SUMMARISE OTHER PAPERS
123

clinical papers into an essay, editorial or summary notes for anexamination, you will know that it is all too easy to meander intoaspects of the subject which you never intended to cover.
The question addressed by a systematic review needs to be definedvery precisely, since the reviewer must make a dichotomous (yes/no)decision as to whether each potentially relevant paper will be includedor, alternatively, rejected as “irrelevant”. The question “Doanticoagulants prevent strokes in patients with atrial fibrillation?”sounds pretty specific, until you start looking through the list ofpossible studies to include. Does “atrial fibrillation” include bothrheumatic and non-rheumatic forms (which are known to beassociated with very different risks of stroke) and does it includeintermittent atrial fibrillation (my grandfather, for example, used togo into this arrhythmia for a few hours whenever he drank coffee andwould have counted as a “grey case” in any trial)?
Does “stroke” include both ischaemic stroke (caused by a blockedblood vessel in the brain) and haemorrhagic stroke (caused by aburst blood vessel)? And, talking of burst blood vessels, shouldn’twe be weighing the side effects of anticoagulants against theirpossible benefits? Should true anticoagulants such as heparin andwarfarin be compared with placebo or with other drugs that reducethe clotting tendency of the blood, such as aspirin and relatedproducts? Finally, should the review cover trials on patients whohave already had a previous stroke or transient ischaemic attack (amild stroke which gets better within 24 hours) or should it belimited to trials on patients without these major risk factors for afurther stroke? The “simple” question posed earlier is becomingunanswerable, and we must refine it as follows.
“To assess the effectiveness and safety of warfarin-type anticoagulanttherapy in secondary prevention (i.e. following a previous stroke ortransient ischaemic attack) in patients with non-rheumatic atrialfibrillation: comparison with placebo.”8
Question 2 Was a thorough search done of the appropriatedatabase(s) and were other potentially important sources explored?
As Figure 8.1 illustrates, one of the benefits of a systematicreview is that, unlike a narrative or journalistic review, the author isrequired to tell you where the information in it came from and howit was processed. As I explained in Chapter 2, searching the
HOW TO READ A PAPER
124

Medline database for relevant articles is a very sophisticatedscience and even the best Medline search will miss importantpapers, for which the reviewer must approach the other databaseslisted in section 2.10.
In the search for trials to include in a review, the scrupulousavoidance of linguistic imperialism is a scientific as well as apolitical imperative. As much weight must be given, for example, tothe expressions “Eine Placebo-kontrolierte Doppel-blindstudie”and “une étude randomisée a double insu face au placebo” as to “adouble blind, randomised controlled trial”!9 Furthermore,particularly where a statistical synthesis of results (metaanalysis) iscontemplated, it may be necessary to write and ask the authors ofthe primary studies for raw data on individual patients which werenever included in the published review (see section 8.3).
Even when all this has been done, the systematic reviewer’ssearch for material has hardly begun. As Paul Knipschild and hiscolleagues showed when they searched for trials on vitamin C andcold prevention, their electronic databases only gave them 22 oftheir final total of 61 trials. Another 39 trials were uncovered byhandsearching the manual Index Medicus database (14 trials notidentified previously), searching the references of the trialsidentified in Medline (15 more trials), the references of thereferences (nine further trials), and the references of the referencesof the references (one additional trial not identified by any of theprevious searches).
PAPERS THAT SUMMARISE OTHER PAPERS
125
Box 8.2 Checklist of data sources for a systematic review
• Medline database
• Cochrane controlled clinical trials register (see section 2.11)
• Other medical and paramedical databases (see section 2.10)
• Foreign language literature
• “Grey literature” (theses, internal reports, non-peer reviewedjournals, pharmaceutical industry files)
• References (and references of references, etc.) cited in primarysources
• Other unpublished sources known to experts in the specialty (seekby personal communication)
• Raw data from published trials (seek by personal communication)

Do not be too hard on a reviewer, however, if he or she has notfollowed this counsel of perfection to the letter. After all,Knipschild and his team found that only one of the trials notidentified in Medline met stringent criteria for methodologicalquality and ultimately contributed to their systematic review ofvitamin C in cold prevention.9 An exploration of “grey literature”(see Box 8.2) may be of greater relative importance when lookingat trials outside the medical mainstream such as physiotherapy oralternative medicine.10
Question 3 Was methodological quality assessed and the trialsweighted accordingly?
Chapters 3 and 4 and Appendix 1 of this book provide somechecklists for assessing whether a paper should be rejected outrighton methodological grounds. But given that only around 1% ofclinical trials are said to be beyond criticism in terms ofmethodology, the practical question is how to ensure that a “smallbut perfectly formed” study is given the weight it deserves inrelation to a larger study whose methods are adequate but moreopen to criticism.
Methodological shortcomings which invalidate the results oftrials are often generic (i.e. they are independent of the subject
HOW TO READ A PAPER
126
Box 8.3 Assigning weight to trials in a systematic review
Each trial should be evaluated in terms of its
• Methodological quality—that is, extent to which the design andconduct are likely to have prevented systematic errors (bias) (seesection 4.4)
• Precision—that is, a measure of the likelihood of random errors(usually depicted as the width of the confidence interval around theresult)
• External validity—that is, the extent to which the results aregeneralisable or applicable to a particular target population
(Additional aspects of “quality” such as scientific importance,clinical importance, and literary quality, are rightly given great weight bypeer reviewers and journal editors but are less relevant to the systematicreviewer once the question to be examined has been defined)

matter of the study; see Appendix 1), but there may also beparticular methodological features which distinguish betweengood, medium, and poor quality in a particular field. Hence, one ofthe tasks of a systematic reviewer is to draw up a list of criteria,including both generic and particular aspects of quality, againstwhich to judge each trial. In theory, a composite numerical scorecould be calculated which would reflect “overall methodologicalquality”. In reality, however, care should be taken in developingsuch scores since there is no gold standard for the “true”methodological quality of a trial11 and such composite scores areprobably neither valid nor reliable in practice.12, 13 The variousCochrane Collaborative review groups are in the process ofdeveloping both general and topic specific methods for assigningquality scores to research studies.14–16 Currently, less than half of allpublished meta-analyses contain reproducible criteria for assessingthe quality of the trials that were included and excluded.17
Question 4 How sensitive are the results to the way the review hasbeen done?
If you don’t understand what this question means, look up thetongue in cheek paper by Carl Counsell and colleagues in theChristmas 1994 issue of the BMJ, which “proved” an entirelyspurious relationship between the result of shaking a dice and theoutcome of an acute stroke.18 The authors report a series ofartificial dice rolling experiments in which red, white, and greendice respectively represented different therapies for acute stroke.
Overall, the “trials” showed no significant benefit from the threetherapies. However, the simulation of a number of perfectlyplausible events in the process of metaanalysis – such as theexclusion of several of the “negative” trials through publication bias(see section 3.3), a subgroup analysis which excluded data on reddice therapy (since, on looking back at the results, red diceappeared to be harmful), and other, essentially arbitrary, exclusionson the grounds of “methodological quality” – led to an apparentlyhighly significant benefit of “dice therapy” in acute stroke.
You cannot, of course, cure anyone of a stroke by rolling a dice,but if these simulated results pertained to a genuine medicalcontroversy (such as which groups of postmenopausal womenshould take hormone replacement therapy or whether breechbabies should routinely be delivered by caesarean section), how
PAPERS THAT SUMMARISE OTHER PAPERS
127

would you spot these subtle biases? The answer is that you need towork through the “what ifs”. What if the authors of the systematicreview had changed the inclusion criteria? What if they hadexcluded unpublished studies? What if their “quality weightings”had been assigned differently? What if trials of lowermethodological quality had been included (or excluded)? What ifall the unaccounted for patients in a trial were assumed to havedied (or been cured)?
An exploration of what ifs is known as a sensitivity analysis. If youfind that fiddling with the data like this in various ways makes littleor no difference to the review’s overall results, you can assume thatthe review’s conclusions are relatively robust. If, however, the keyfindings disappear when any of the what ifs change, the conclusionsshould be expressed far more cautiously and you should hesitatebefore changing your practice in the light of them.
Question 5 Have the numerical results been interpreted with commonsense and due regard to the broader aspects of the problem?
As the next section shows, it is easy to be “phased” by the figuresand graphs in a systematic review. But any numerical result, howeverprecise, accurate, “significant” or otherwise incontrovertible, mustbe placed in the context of the painfully simple and (often)frustratingly general question which the review addressed. Theclinician must decide how (if at all) this numerical result, whethersignificant or not, should influence the care of an individual patient.
A particularly important feature to consider when undertakingor appraising a systematic review is the external validity of includedtrials (see Box 8.3). A trial may be of high methodological qualityand have a precise and numerically impressive result but it may, forexample, have been conducted on participants under the age of 60and hence may not be valid for people over 75. The inclusion insystematic reviews of irrelevant studies is guaranteed to lead toabsurdities and reduce the credibility of secondary research, asProfessor Sir John Grimley Evans argued (see section 9.1).19
8.3 Metaanalysis for the non-statistician
If I had to pick one word which exemplifies the fear and loathingfelt by so many students, clinicians, and consumers towardsevidence based medicine, that word would be “metaanalysis”. The
HOW TO READ A PAPER
128

metaanalysis, defined as a statistical synthesis of the numerical resultsof several trials which all addressed the same question, is thestatisticians’ chance to pull a double whammy on you. First, theyphase you with all the statistical tests in the individual papers andthen they use a whole new battery of tests to produce a new set ofodds ratios, confidence intervals, and values for significance.
As I confessed in Chapter 5, I too tend to go into panic mode atthe sight of ratios, square root signs, and half-forgotten Greekletters. But before you consign metaanalysis to the set of newfangledtechniques which you will never understand, remember two things.First, the metaanalyst may wear an anorak but he or she is on yourside. A good metaanalysis is often easier for the non-statistician tounderstand than the stack of primary research papers from which itwas derived, for reasons which I am about to explain. Second, theunderlying statistical techniques used for metaanalysis are exactlythe same as the ones for any other data analysis – it’s just that someof the numbers are bigger. Helpfully, an international advisorygroup have come up with a standard format for meta-analyses (theQUOROM statement,20 analogous to the CONSORT format forrandomised controlled trials I mentioned in Chapter 4).
The first task of the metaanalyst, after following the preliminarysteps for systematic review in Figure 8.1, is to decide which out ofall the various outcome measures chosen by the authors of theprimary studies is the best one (or ones) to use in the overallsynthesis. In trials of a particular chemotherapy regimen for breastcancer, for example, some authors will have published cumulativemortality figures (i.e. the total number of people who have died todate) at cutoff points of three and 12 months, whereas other trialswill have published six month, 12 month, and five year cumulativemortality. The metaanalyst might decide to concentrate on 12month mortality because this result can be easily extracted from allthe papers. He or she may, however, decide that three monthmortality is a clinically important endpoint and would need towrite to the authors of the remaining trials asking for the raw datafrom which to calculate these figures.
In addition to crunching the numbers, part of the metaanalyst’sjob description is to tabulate relevant information on the inclusioncriteria, sample size, baseline patient characteristics, withdrawal(“dropout”) rate, and results of primary and secondary endpointsof all the studies included. If this task has been done properly, you
PAPERS THAT SUMMARISE OTHER PAPERS
129

will be able to compare both the methods and the results of twotrials whose authors wrote up their research in different ways.Although such tables are often visually daunting, they save youhaving to plough through the methods sections of each paper andcompare one author’s tabulated results with another author’s piechart or histogram.
These days, the results of meta-analyses tend to be presented ina fairly standard form.This is partly because metaanalysts often usecomputer software to do the calculations for them,21 and thissoftware includes a standard graphics package which presentsresults as illustrated in Figure 8.2. I have reproduced in the formatof one commonly used software package (with the authors’permission) this pictorial representation (colloquially known as a“forest plot” or “blobbogram”) of the pooled odds ratios of eightRCTs which each compared coronary artery bypass graft (CABG)with percutaneous coronary angioplasty (PTCA) in the treatmentof severe angina.22 The primary (main) outcome in this meta-analysis was death or heart attack within one year.
HOW TO READ A PAPER
130
Figure 8.2 Pooled odds ratios of eight randomised controlled trials ofcoronary artery bypass graft against percutaneous coronary angioplastyshown in MetaView format

The eight trials, each represented by its acronym (for example,CABRI), are listed one below the other on the left hand side of thefigure. The horizontal line corresponding to each trial shows therelative risk of death or heart attack at one year in patientsrandomised to PTCA compared to patients randomised to CABG.The “blob” in the middle of each line is the point estimate of thedifference between the groups (the best single estimate of thebenefit in lives saved by offering CABG rather than PTCA) and thewidth of the line represents the 95% confidence interval of thisestimate (see section 5.5). The black line down the middle of thepicture is known as the “line of no effect” and in this case isassociated with a relative risk (RR) of 1.0. In other words, if thehorizontal line for any trial does not cross the line of no effect, thereis a 95% chance that there is a “real” difference between thegroups.
As sections 4.6 and 5.5 argued, if the confidence interval of theresult (the horizontal line) does cross the line of no effect (i.e. thevertical line), that can mean either that there is no significantdifference between the treatments and/or that the sample size wastoo small to allow us to be confident where the true result lies.Thevarious individual studies give point estimates of the relative risk ofPTCA compared to CABG of between about 0.5 and 5.0, and theconfidence intervals of some studies are so wide that they don’teven fit on the graph.
Now, here comes the fun of metaanalysis. Look at the tinydiamond below all the horizontal lines. This represents the pooleddata from all eight trials (overall relative risk PTCA:CABG =1.08), with a new, much narrower, confidence interval of thisrelative risk (0.79–1.50). Since the diamond firmly overlaps theline of no effect, we can say that there is probably little to choosebetween the two treatments in terms of the primary endpoint(death or heart attack in the first year). Now, in this example, everysingle one of the eight trials also suggested a non-significant effect,but in none of them was the sample size large enough for us to beconfident in that negative result.
Note, however, that this neat little diamond does not mean thatyou might as well offer a PTCA rather than a CABG to everypatient with angina. It has a much more limited meaning – that theaverage patient in the trials presented in this metaanalysis is equallylikely to have met the primary outcome (death or heart attack
PAPERS THAT SUMMARISE OTHER PAPERS
131

within a year) whichever of these two treatments they wererandomised to receive. If you read the paper by Pocock andcolleagues,22 you would find important differences in the groups interms of prevalence of angina and requirement for furtheroperative intervention after the initial procedure. The choice oftreatment should also, of course, take into account how the patientfeels about undergoing major heart surgery (CABG) as opposed tothe relatively minor procedure of PTCA.
In many meta-analyses, “non-significant” trials (i.e. ones which,on their own, did not demonstrate a significant difference betweentreatment and control groups) contribute to a pooled result whichis statistically significant. The most famous example of this, whichthe Cochrane Collaboration adopted as its logo (Figure 8.3), is themetaanalysis of seven trials of the effect of giving steroids tomothers who were expected to give birth prematurely. Only two ofthe seven trials showed a statistically significant benefit (in terms ofsurvival of the infant) but the improvement in precision (i.e. thenarrowing of confidence intervals) in the pooled results, shown bythe narrower width of the diamond compared with the individuallines, demonstrates the strength of the evidence in favour of thisintervention. This metaanalysis showed that infants of steroidtreated mothers were 30–50% less likely to die than infants ofcontrol mothers. This example is discussed further in section 12.1in relation to changing clinicians’ behaviour.
If you have followed the arguments on metaanalysis of publishedtrial results this far, you might like to read up on the moresophisticated technique of metaanalysis of individual patient data,which provides a more accurate and precise figure for the point
HOW TO READ A PAPER
132
Figure 8.3 Cochrane Collaboration Logo

estimate of effect.23 You might also like to seek out the excellentreview series on metaanalysis published in the BMJ a few yearsago,24–29 together with a special supplement to that series on thedifferent software packages now available for metaanalysis, whichwas only published on the Web.21
8.4 Explaining heterogeneity
In everyday language, “homogeneous” means “of uniformcomposition”, and “heterogeneous” means “many differentingredients”. In the language of metaanalysis, homogeneity meansthat the results of each individual trial are compatible with theresults of any of the others. Homogeneity can be estimated at aglance once the trial results have been presented in the formatillustrated in Figures 8.2 and 8.4. In Figure 8.2, the lowerconfidence interval of every trial is below the upper confidenceinterval of all the others (i.e. the horizontal lines all overlap to someextent). Statistically speaking, the trials are homogeneous.Conversely, in Figure 8.4, there are some trials whose lowerconfidence interval is above the upper confidence interval of one ormore other trials (i.e. some lines do not overlap at all).These trialsmay be said to be heterogeneous.
PAPERS THAT SUMMARISE OTHER PAPERS
133
British Regional Heart
Pooling project
BUPA
Gothenburg
MRFIT screeness
Renfrew-Paisley
Whitehall
Honolulu
Central Sweden
Israeli
0 10 20 30 40 50
% Reduction
Figure 8.4 Reduction in risk of heart disease by strategies to lowercholesterol concentration30
British Regional Heart
BUPA
Gothenburg
MRFIT screenees
Renfrew-Paisley
Whitehall
Honolulu
Central Sweden
Israeli
Pooling project

You may have spotted by now (particularly if you have alreadyread section 5.5 on confidence intervals) that pronouncing a set oftrials heterogeneous on the basis of whether their confidenceintervals overlap is somewhat arbitrary, since the confidenceinterval itself is arbitrary (it can be set at 90%, 95%, 99% or indeedany other value). The definitive test involves a slightly moresophisticated statistical manoeuvre than holding a ruler up againstthe blobbogram. The one most commonly used is a variant of thechi square (�2) test (see Table 5.1), since the question addressed is,“Is there greater variation between the results of the trials than iscompatible with the play of chance?”.
The �2 statistic for heterogeneity is explained in more detail bySimon Thompson,30 who offers the following useful rule of thumb:a �2 statistic has, on average, a value equal to its degrees of freedom(in this case, the number of trials in the metaanalysis minus one),so a �2 of 7.0 for a set of eight trials would provide no evidence ofstatistical heterogeneity. (In fact, it would not prove that the trialswere homogeneous either, particularly since the �2 test has lowpower [see section 4.6] to detect small but important levels ofheterogeneity.)
A �2 value much greater than the number of trials in a meta-analysis tells us that the trials which contributed to the analysis aredifferent in some important way from one another. There may, forexample, be known differences in methodology (for example,authors may have used different questionnaires to assess thesymptoms of depression) or known clinical differences in the trialparticipants (for example, one centre might have been a tertiaryreferral hospital to which all the sickest patients were referred).There may, however, be unknown or unrecorded differencesbetween the trials which the metaanalyst can only speculate upon until he or she has extracted further details from the trials’authors. Remember: demonstrating statistical heterogeneity is amathematical exercise and is the job of the statistician butexplaining this heterogeneity (i.e. looking for, and accounting for,clinical heterogeneity) is an interpretive exercise and requiresimagination, common sense, and hands on clinical or researchexperience.
Figure 8.4, which is reproduced with permission from SimonThompson’s chapter on the subject,30 shows the results of 10 trialsof cholesterol lowering strategies. The results are expressed as the
HOW TO READ A PAPER
134

percentage reduction in heart disease risk associated with each 0.6 mmol/l reduction in serum cholesterol level. The horizontallines represent the 95% confidence intervals of each result and it isclear, even without being told the �2 statistic of 127, that the trialsare highly heterogeneous.
To simply “average out” the results of the trials in Figure 8.4would be very misleading. The metaanalyst must return to his orher primary sources and ask, “In what way was trial A differentfrom trial B, and what do trials C, D and H have in common whichmakes their results cluster at one extreme of the figure?”. In thisexample, a correction for the age of the trial subjects reduced �2
from 127 to 45. In other words, much of the “incompatibility” inthe results of these trials can be explained by the fact thatembarking on a strategy (such as a special diet) which successfullyreduces your cholesterol level will be substantially more likely toprevent a heart attack if you are 45 than if you are 85.
This, essentially, is the basis of the grievance of Professor HansEysenck, who has constructed a vigorous and entertaining critiqueof the science of metaanalysis.31 In a world of lumpers and splitters,Eysenck is a splitter and it offends his sense of the qualitative andthe particular (see Chapter 11) to combine the results of studieswhich were done on different populations in different places atdifferent times and for different reasons.
Eysenck’s reservations about metaanalysis are borne out in theinfamously discredited metaanalysis which demonstrated(wrongly) that there was significant benefit to be had from givingintravenous magnesium to heart attack victims. A subsequentmegatrial involving 58000 patients (ISIS-4) failed to find anybenefit whatsoever and the metaanalysts’ misleading conclusionswere subsequently explained in terms of publication bias,methodological weaknesses in the smaller trials, and clinicalheterogeneity.32, 33 (Incidentally, for more debate on the pros andcons of metaanalysis versus megatrials, see LeLorier andcolleagues’ Lancet article.34)
Although Eysenck’s mathematical naïveté is embarrassing (“If amedical treatment has an effect so recondite and obscure as torequire a metaanalysis to establish it, I would not be happy to haveit used on me”), I have a great deal of sympathy for the body of hisargument. As one who tends to side with the splitters, I would putEysenck’s misgivings about metaanalysis high on the list of
PAPERS THAT SUMMARISE OTHER PAPERS
135

required reading for the aspiring systematic reviewer. Indeed, Irecently threw my own hat into the ring when Simon Griffinpublished a metaanalysis of primary studies into the managementof diabetes by primary health care teams.35 Although I have a highregard for Simon as a scientist, I felt strongly that he had not beenjustified in performing a mathematical summation of what Ibelieved were very different studies all addressing slightly differentquestions. As I said in my commentary on his article, “Four applesand five oranges makes four apples and five oranges, not nineappleoranges”.36 But Simon numbers himself among the lumpersand there are plenty of people cleverer than me who have arguedthat he was entirely correct to analyse his data as he did.Fortunately, the two of us have agreed to differ – and on a personallevel we remain friends.
For an authoritative review of the technicalities of integratingheterogeneous pieces of evidence into systematic reviews, see thearticle by Cindy Mulrow and colleagues.37
1 Reproduced from The Cochrane Centre brochure, UK Cochrane Centre,Summertown Pavilion, Middle Way, Oxford OX2 7LG, UK.
2 Chalmers I,Altman DG, eds. Systematic reviews. London: BMJ Publications, 1995.3 Pauling L. How to live longer and feel better. New York: Freeman, 1986.4 Mulrow C. The medical review article: state of the science. Ann Intern Med
1987; 106: 485–8.5 Cook DJ, Mulrow CD, Haynes RB. Systematic reviews: synthesis of best
evidence for clinical decisions. Ann Intern Med 1997; 126: 376–80.6 Oxman AD, Guyatt GH. The science of reviewing research. Ann NY Acad Sci
1993; 703: 125–31.7 Antman EM, Lau J, Kupelnick B, Mosteller F, Chalmers TC. A comparison of
results of meta-analyses of randomised controlled trials and recommendationsof clinical experts. JAMA 1992; 268: 240–8.
8 Koudstaal P. Secondary prevention following stroke or TIA in patients withnon-rheumatic atrial fibrillation: anticoagulant therapy versus control. CochraneDatabase of Systematic Reviews, updated 14 February 1995. Oxford: TheCochrane Library, Issue 2, 2000.
9 Knipschild P. Some examples of systematic reviews. In: Chalmers I, AltmanDG, eds. Systematic reviews. London: BMJ Publications, 1995: 9–16.
10 Knipschild P. Searching for alternatives: loser pays. Lancet 1993; 341: 1135–6.11 Oxman A, ed. Preparing and maintaining systematic reviews. In: Cochrane
Collaboration Handbook, section VI. Oxford: Update Software, 2000.12 Emerson JD, Burdick E, Hoaglin DC et al. An empirical study of the possible
relation of treatment differences to quality scores in controlled randomizedclinical trials. Controlled Clin Trials 1990; 11: 339–52.
13 Moher D, Jadad AR, Tugwell P. Assessing the quality of randomized controlledtrials: current issues and future directions. Int J Technol Assess Health Care 1996;12: 195–208.
HOW TO READ A PAPER
136

14 Bero L, Rennie D. The Cochrane Collaboration: preparing, maintaining, anddisseminating systematic reviews of the effects of health care. JAMA 1995: 274:1935–8.
15 Garner P, Hetherington J. Establishing and supporting collaborative reviewgroups. In: Cochrane Collaboration Handbook, section II. Oxford: UpdateSoftware, 2000.
16 Verhagen AP, de Vet HC, de Bie RA et al. The Delphi list: a criteria list forquality assessment of randomized clinical trials for conducting systematicreviews developed by Delphi consensus. J Clin Epidemiol 1998; 51: 1235–41.
17 Moher D, Cook DJ, Jadad AR et al. Assessing the quality of reports ofrandomised trials: implications for the conduct of meta-analyses. Health TechnolAssess 1999; 3(12). Available in full text on http://www.hta.nhsweb.nhs.uk/.
18 Counsell CE, Clarke MJ, Slattery J, Sandercock PAG. The miracle of DICEtherapy for acute stroke: fact or fictional product of subgroup analysis? BMJ1994; 309: 1677–81.
19 Grimley Evans J. evidence based and evidence-biased medicine. Age Ageing1995; 24: 461–3.
20 Moher D, Cook DJ, Eastwood S, Olkin I, Rennie D, Stroup DF, for the QUOROMGroup. Improving the quality of reports of meta-analyses of randomised controlledtrials: the QUOROM statement. Lancet 1999; 354: 1896-900. Available in full texton http://www.thelancet.com/newlancet/eprint/2/index.html
21 Egger M, Davey Smith G. Meta-analysis software. Electronic publication byBMJ to supplement series on meta-analysis (see references 24–29 below).http://bmj.com/archive/7126/7126ed9.htm
22 Pocock SJ, Henderson RA, Rickards AF et al. Meta-analysis of randomisedtrials comparing coronary angioplasty with bypass surgery. Lancet 1995; 346:1184–9.
23 Clarke MJ, Stewart LA. Obtaining data from randomised controlled trials: howmuch do we need for reliable and informative meta-analyses? In: Chalmers I,Altman DG, eds. Systematic reviews. London: BMJ Publications, 1995: 37–47.
24 Egger M, Davey Smith G. Meta-analysis: potentials and promise. BMJ 1997;315: 1371–4.
25 Davey Smith G, Egger M, Phillips A. Meta-analysis: principles and procedures.BMJ 1997; 315: 1533–7.
26 Davey Smith G, Egger M, Phillips A. Meta-analysis: beyond the grand mean?BMJ 1997; 315: 1610–14.
27 Egger M, Davey Smith G. Meta-analysis: bias in location and selection ofstudies. BMJ 1998; 316: 61–6.
28 Egger M, Schneider M, Davey Smith G. Meta-analysis: spurious precision?Meta-analysis of observational studies. BMJ 1998; 316: 140–4.
29 Davey Smith G, Egger M. Meta-analysis: unresolved issues and futuredevelopments. BMJ 1998; 316: 221–5.
30 Thompson SG. Why sources of heterogeneity in meta-analysis should beinvestigated. In: Chalmers I, Altman DG, eds. Systematic reviews. London: BMJPublications, 1995: 48–63.
31 Eysenck HJ. Problems with meta-analysis. In: Chalmers I, Altman DG, eds.Systematic reviews. London: BMJ Publications, 1995: 64–74.
32 Anon. Magnesium, myocardial infarction, meta-analysis and mega-trials. DrugTherapeut Bull 1995; 33: 25–7.
33 Egger M, Davey Smith G. Misleading meta-analysis: lessons from “an effective,safe, simple” intervention that wasn’t. BMJ 1995; 310: 752–4.
34 LeLorier J, Gregoire G, Benhaddad A, Lapierre J, Derderian F. Discrepanciesbetween meta-analysis and subsequent large randomised controlled trials. New
PAPERS THAT SUMMARISE OTHER PAPERS
137

Engl J Med 1997; 337: 536–42.35 Griffin S. Diabetes care in general practice: meta-analysis of randomised
controlled trials. BMJ 1998; 317: 390–5.36 Greenhalgh T. Meta-analysis is a blunt and potentially misleading instrument
for analysing methods of service delivery. BMJ 1998; 317: 395–6.37 Mulrow C, Langhorne P, Grimshaw J. Integrating heterogeneous pieces of
evidence in systematic reviews. Ann Intern Med 1997; 127: 989–95.
HOW TO READ A PAPER
138

Chapter 9: Papers thattell you what to do(guidelines)
9.1 The great guidelines debate
Never was the chasm between old fashioned clinicians and oldstyle health service managers wider than in their respectiveattitudes to clinical guidelines. Managers (in which I includepoliticians and all those who implement, administer, evaluate, andfinance the actions of clinicians but who do not themselves seepatients) tend to love guidelines. Clinicians, save for the importantminority who actually write them, usually have a strong aversion toguidelines.
Before we carry this political hot potato any further, we need adefinition of guidelines, for which the following will suffice.
139
Box 9.1 Purpose of guidelines
• To make evidence based standards explicit and accessible (but seebelow – few guidelines currently in circulation are truly evidencebased)
• To make decision making in the clinic and at the bedside easier andmore objective
• To provide a yardstick for assessing professional performance
• To delineate the division of labour (for example, between GPs andconsultants)
• To educate patients and professionals about current best practice
• To improve the cost effectiveness of health services
• To serve as a tool for external control

“Guidelines are systematically developed statements to assistpractitioner decisions about appropriate health care for specific clinicalcircumstances.”1
The purposes which guidelines serve are given in Box 9.1. Theimage of the medical buffoon blundering blithely through theoutpatient clinic still diagnosing the same illnesses and prescribingthe same drugs he (or she) learnt about at medical school 40 yearspreviously, and never having read a paper since, knocks the“clinical freedom” argument (i.e. that a doctor’s professionalopinion is beyond reproach) right out of the arena. Suchhypothetical situations are grist to the mill of those who wouldimpose “expert guidelines” on most if not all medical practice andhold to account all those who fail to keep in step.
But the counter argument to the excessive use, and particularlythe compulsive imposition, of clinical guidelines is a powerful oneand it has been expressed very eloquently by Professor JohnGrimley Evans.
HOW TO READ A PAPER
140
Box 9.2 Drawbacks of guidelines (real and perceived)
• Guidelines may be intellectually suspect and reflect “expertopinion”, which may formalise unsound practice
• By reducing medical practice variation they may standardise to“average” rather than best practice
• They inhibit innovation and prevent individual cases from beingdealt with discretely and sensitively
• They could, theoretically, be used medicolegally (both in and out ofcontext) to dictate what a competent practitioner “would havedone” in particular circumstances
• Guidelines developed at national or regional level may not reflectlocal needs or have the ownership of local practitioners
• Guidelines developed in secondary care may not reflectdemographic, clinical or practical differences between this sectorand the primary care setting
• Guidelines may produce undesirable shifts in the balance of powerbetween different professional groups (for example, betweenclinicians and academics or purchasers and providers); hence,guideline development may be perceived as a political act

“There is a fear that in the absence of evidence clearly applicable to thecase in hand a clinician might be forced by guidelines to make use ofevidence which is only doubtfully relevant, generated perhaps in adifferent grouping of patients in another country at some other time andusing a similar but not identical treatment. This is evidence-biasedmedicine; it is to use evidence in the manner of the fabled drunkard whosearched under the street lamp for his door key because that is wherethe light was, even though he had dropped the key somewhere else.”2
Grimley Evans’ fear, which every practising clinician shares butfew can articulate, is that politicians and health service managerswho have jumped on the evidence based medicine bandwagon willuse guidelines to decree the treatment of diseases rather than ofpatients.They will, it is feared, make judgements about people andtheir illnesses subservient to published evidence that anintervention is effective “on average”. This, and other real andperceived disadvantages of guidelines, are given in Box 9.2, whichhas been compiled from a number of sources.3–10
The mushrooming guidelines industry owes its success at least inpart to a growing “accountability culture” that is now (many argue)being set in statute in many countries. In the UK National HealthService, all doctors, nurses, pharmacists, and other healthprofessionals now have a contractual duty to provide clinical carebased on best available research evidence.11 Officially produced orsanctioned guidelines are a way of both supporting and policingthat laudable goal. Whilst the medicolegal implications of“official”guidelines have rarely been tested in the UK,12 US courtshave ruled that guideline developers can be held liable for faultyguidelines and that doctors cannot pass off their liability for poorclinical performance by claiming that adherence to guidelinescorrupted their judgement.4
9.2 Do guidelines change clinicians’ behaviour?
An early systematic review of randomised trials and “other robustdesigns” by Grimshaw and Russell13 demonstrated that, in theresearch setting (in which participants were probably highly selectedand evaluation was an explicit part of guideline introduction), allbut four of 59 published studies demonstrated improvements – i.e.changes in line with the guideline recommendations – in the processof care (i.e. what doctors did), and all but two of the 11 studies
PAPERS THAT TELL YOU WHAT TO DO
141

which measured outcome (i.e. what happened to the patients)reported significant improvements in the group using guidelinescompared to the “usual care” group. Grimshaw subsequently set upa special subgroup of the Cochrane Collaboration (see section 2.11)to review and summarise emerging research on the use of guidelinesand other related issues in improving professional practice.You canfind details of the Effective Practice and Organisation of Care(EPOC) Group on the Cochrane website.14
EPOC and other groups who research the effectiveness ofguidelines would probably be the first to emphasise that, despite thebroadly positive findings of the research studies, guidelines do notnecessarily improve either performance or outcome. Both Grimshawand Russell13 and others15, 16 found wide variation in the size of theimprovements in performance achieved by clinical guidelines. Theformer authors concluded that the probability of a guideline beingeffective depended on three factors which are summarised in Table9.1: the development strategy (where and how the guidelines wereproduced), the dissemination strategy (how they were brought tothe attention of clinicians), and the implementation strategy (howthe clinician was prompted to follow them).
Table 9.1 Classification of clinical guidelines in terms of probability ofbeing effective (after Grimshaw and Russell13)
Probability of Development Dissemination Implementationbeing effective strategy strategy strategy
High Internal Specific educational Patient specificintervention (for reminder at timeexample, problem of consultationbased learningpackage)
Above average Intermediate Continuing Patient specificeducation (for feedbackexample, lecture)
Below average External, local Mailing targeted General feedbackgroups
Low External, Publication in General remindernational journal
HOW TO READ A PAPER
142

Table 9.1, in a nutshell, tells us that the most effective guidelinesare developed locally by the people who are going to use them,introduced as part of a specific educational intervention, andimplemented via a patient specific prompt that appears at the timeof the consultation. Grimshaw’s conclusions were initiallymisinterpreted by some people as implying that there was no placefor nationally developed guidelines since only locally developedones had any impact. In fact, whilst local adoption and ownershipis undoubtedly crucial to the success of a guideline programme,local teams would be foolish not to draw on the range ofexpensively produced resources of evidence based national andinternational recommendations.17
Subsequent publications have identified a number of barriers tothe adoption of guidelines in practice.6, 7, 8, 18 These include:
• (apparent) disagreements amongst experts about the quality ofevidence (“Well, if they can’t agree among themselves . . .”)
• lack of appreciation of evidence by practitioners (“That’s all verywell, but when I trained we were always taught to hold back on steroidsfor asthma”)
• defensive medicine (“I’ll check all the tests anyway – belt andbraces”)
• strategic and cost constraints (“We can’t afford to replace theequipment”)
• specific practical constraints (“Where on earth did I put thoseguidelines?”)
• failure of patients to accept procedures (“Mrs Brown insists sheonly needs a smear every five years”)
• competing influences of other non-medical factors (“When we getthe new computer system up and running . . .”)
• lack of appropriate, patient specific feedback on performance (“Iseem to be treating this condition OK”).
For a more detailed discussion on the barriers to implementingguidelines, see Grimshaw and Russell’s comprehensive discussion ofthe subject,19 the review on developing17 and using20 guidelines fromthe BMJ’s 1999 series on guidelines, and original research by otherwriters.15, 21 In a nutshell, the successful introduction of guidelinesneeds “careful attention to the principles of change management: in
PAPERS THAT TELL YOU WHAT TO DO
143

particular, . . . leadership, energy, avoidance of unnecessaryuncertainty, good communication, and, above all, time”.8
9.3 Questions to ask about a set of guidelines
Like all published articles, guidelines would be easier to evaluateif they were presented in a standardised format. Box 9.3reproduces a suggested structured abstract for clinical guidelines22
but since few published guidelines currently follow such a format,you will probably have to scan the full text for answers to thequestions below. In preparing the list which follows, I have drawnon a number of previously published checklists and discussiondocuments.8, 15, 18, 20, 23, 24, 25
Question 1 Did the preparation and publication of these guidelinesinvolve a significant conflict of interest?
I will resist labouring the point, but a drug company that makes
HOW TO READ A PAPER
144
Box 9.3 Proposed format for structured abstracts ofclinical practice guidelines22
• Objective – The primary objective of the guideline, including thehealth problem and the targeted patients, providers, and settings
• Options – The clinical practice options considered in formulatingthe guideline
• Outcomes – Significant health and economic outcomes consideredin comparing alternative practices
• Evidence – How and when evidence was gathered, selected, andsynthesised
• Values – Disclosure of how values were assigned to potentialoutcomes of practice options and who participated in the process
• Benefits, harms, and costs – The type and magnitude of benefits,harms, and costs expected for patients from guidelineimplementation
• Recommendations – Summary of key recommendations
• Validation – Report of any external review, comparison with otherguidelines or clinical testing of guideline use
• Sponsors – Disclosure of the people who developed, funded orendorsed the guideline

hormone replacement therapy or a research professor whose life’swork has been spent perfecting this treatment might be tempted torecommend it for wider indications than the average clinician.
Question 2 Are the guidelines concerned with an appropriate topic,and do they state clearly the goal of ideal treatment in terms of healthand/or cost outcome?
Key questions in relation to choice of topic, reproduced from anarticle in the BMJ,26 are given in Box 9.4.
A guideline which says “do this” without telling the practitionerwhy such an action is desirable is bad psychology as well as slackscience.The intended outcome if the guideline is followed might bebetter patient survival, lower complication rates, increased patientsatisfaction or savings in direct or indirect costs (see section 10.2).Whatever it is, it would be nice to know.
Question 3 Was the guideline development panel headed by a leadingexpert in the field and was a specialist in the methods of secondaryresearch (e.g. metaanalyst, health economist) involved?
If a set of guidelines has been prepared entirely by a panel ofinternal “experts”, you should, paradoxically, look at themparticularly critically since researchers have been shown to be lessobjective in appraising evidence in their own field of expertise thanin someone else’s.27 The involvement of an outsider (an expert inguideline development rather than in the particular clinical topic)
PAPERS THAT TELL YOU WHAT TO DO
145
Box 9.4 Key questions on choice of topic for guidelinedevelopment26
• Is the topic high volume, high risk, high cost?
• Are there large or unexplained variations in practice?
• Is the topic important in terms of the process and outcome ofpatient care?
• Is there potential for improvement?
• Is the investment of time and money likely to be repaid?
• Is the topic likely to hold the interest of team members?
• Is consensus likely?
• Will change benefit patients?
• Can change be implemented?

to act as arbiter and methodological adviser will, hopefully, makethe process more objective.
Question 4 Have all the relevant data been scrutinised and do theguidelines’ conclusions appear to be in keeping with the data?
On the most basic level, was the literature analysed at all or arethese guidelines simply a statement of the preferred practice of aselected panel of experts (i.e. consensus guidelines)? If theliterature was looked at, was a systematic search done and if so, didit follow the methodology described in section 8.2? Were all papersunearthed by the search included or was an explicit scoring systemused to reject those of poor methodological quality and give thoseof high quality the extra weight they deserved?
Of course, up to date systematic reviews should ideally be theraw material for guideline development.28 But in many cases, asearch for rigorous and relevant research on which to baseguidelines proves fruitless and the authors, unavoidably, resort to“best available” evidence or expert opinion. Given that in manyclinical areas, the opinion of experts is still the best “evidence”around, guideline developers should adopt rigorous methods toensure that it isn’t just the voice of the expert who talks for longestin the meetings that drives the recommendations. Paul Shekellefrom the RAND Corporation in the USA has undertaken someexciting research into methods for improving the rigour ofconsensus recommendations so as to ensure, for example, that anappropriate mix of experts is chosen, everyone reads the availableresearch evidence, everyone gets an equal vote, all points ofcontention (raised anonymously) are fully discussed, and theresulting recommendations indicate the extent of agreement anddissent between the panel.29, 30, 31 The UK Health TechnologyAssessment Programme has produced a valuable overview of thestrengths and limitations of consensus methods which is availablein full text on the Internet.32
Question 5 Do the guidelines address variations in medical practiceand other controversial areas (e.g. optimum care in response to genuineor perceived underfunding)?
It would be foolish to make dogmatic statements about idealpractice without reference to what actually goes on in the realworld. There are many instances where some practitioners are
HOW TO READ A PAPER
146

marching to an altogether different tune from the rest of us (seesection 1.2) and a good guideline should face such realities head onrather than hoping that the misguided minority will fall into step bydefault.
Another thorny issue which guidelines should tackle head on iswhere essential compromises should be made if financialconstraints preclude “ideal” practice. If the ideal, for example, is tooffer all patients with significant coronary artery disease a bypassoperation (at the time of writing it isn’t, but never mind), and thehealth service can only afford to fund 20% of such procedures, whoshould be pushed to the front of the queue?
Question 6 Are the guidelines valid and reliable?
In other words, can you trust them, and if a different guidelinedevelopment panel addressed the same question, would they comeup with the same guidelines? These, of course, are the two $64 000questions.The academic validity of guidelines depends on whetherthey are supported by high quality research studies and how strongthe evidence from those studies is. In particular, issues ofprobability and confidence should have been dealt with acceptably(see section 4.6).
Question 7 Are the guidelines clinically relevant, comprehensive, andflexible?
In other words, are they written from the perspective of thepractising doctor, nurse, midwife, physiotherapist, and so on anddo they take account of the type of patients he or she is likely to see,and in what circumstances? Perhaps the most frequent source oftrouble here is when guidelines developed in secondary care andintended for use in hospital outpatients (who tend to be at thesicker end of the clinical spectrum) are passed on to the primaryhealth care team to be used in the primary care setting where, ingeneral, patients are less ill and may well need fewer investigationsand less aggressive management. This issue is discussed in section7.2 in relation to the different utility of diagnostic and screeningtests in different populations.
Guidelines should cover all, or most, clinical eventualities. Whatif the patient is intolerant of the recommended medication? Whatif you can’t send off all the recommended blood tests? What if thepatient is very young, very old or suffers from a co-existing illness?
PAPERS THAT TELL YOU WHAT TO DO
147

These, after all, are the patients who prompt most of us to reach forour guidelines, while the more “typical” patient tends to bemanaged without recourse to written instructions.
Flexibility is a particularly important consideration for nationaland regional bodies who set themselves up to develop guidelines. Ithas been repeatedly demonstrated that ownership of guidelines bythe people who are intended to use them locally is crucial towhether or not the guidelines are actually used.6, 7, 13 If there is nofree rein for practitioners to adapt them to meet local needs andpriorities, a set of guidelines will probably never get taken out ofthe drawer.
Question 8 Do the guidelines take into account what is acceptable to,affordable by, and practically possible for patients?
There is an apocryphal story of a physician in the 1940s (a timewhen no effective medicines for high blood pressure were available)who discovered that restricting the diet of hypertensive patients toplain, boiled, unsalted rice dramatically reduced their bloodpressure and also reduced the risk of stroke. The story goes,however, that the diet made the patients so miserable that a lot ofthem committed suicide.
This is an extreme example but I have seen guidelines fortreating constipation in the elderly which offered no alternative tothe combined insults of large amounts of bran and twice dailysuppositories. Small wonder that the district nurses who wereissued with them (for whom I have a good deal of respect) havegone back to giving castor oil.
For a further discussion on how to incorporate the needs andpriorities of patients in guideline development, see a 1995 reportfrom the College of Health.33
Question 9 Did the guidelines include recommendations for their owndissemination, implementation, and regular review?
Given the well documented gap between what is known to begood practice and what actually happens,15, 19, 34 and the barriers tothe successful implementation of guidelines discussed in section9.2, it would be in the interests of those who develop guidelines tosuggest methods of maximising their use. If this objective wereincluded as standard in the “Guidelines for good guidelines”, theguideline writers’ output would probably include fewer ivory tower
HOW TO READ A PAPER
148

recommendations and more that are plausible, possible, andcapable of being explained to patients.
1 Field, MJ, Lohr KN. Clinical practice guidelines: direction of a new agency.Washington DC: Institute of Medicine, 1990.
2 Grimley Evans J. evidence based and evidence-biased medicine. Age Ageing.1995; 24: 461–3.
3 Edwards P, Jones S, Shale D, Thursz M. Shared care – a model for clinicalmanagement. Oxford: Radcliffe Medical Press, 1996.
4 Hurwitz B. Clinical guidelines and the law: advice, guidance or regulation? JEval Clin Pract 1995; 1: 49–60.
5 Chalmers I. Why are opinions about the effects of health care so often wrong?Medicolegal J 1993; 62: 116–30.
6 Delamothe T.Wanted: guidelines that doctors will follow. BMJ 1993; 307: 218.7 Greenhalgh PM. Shared care for diabetes – a systematic review. London: Royal
College of General Practitioners, 1994 (Occasional Paper 67).8 Ayers P, Renvoize T, Robinson M. Clinical guidelines: key decisions for acute
service providers. Br J Health Care Manage 1995; 1: 547–51.9 Newton J, Knight D,Woolhead G. General practitioners and clinical guidelines:
a survey of knowledge, use and beliefs. Br J Gen Pract 1996; 46: 513–17.10 Woolf SH, Grol R, Hutchinson A, Eccles M, Grimshaw J. Clinical guidelines:
potential benefits, limitations, and harms of clinical guidelines. BMJ 1999; 318:527–30.
11 Department of Health. A first class service: quality in the new NHS. London:TheStationery Office, 1998.
12 Hurwitz B. Clinical guidelines: legal and political considerations of clinicalpractice guidelines. BMJ 1999; 318: 661–4.
13 Grimshaw JM, Russell IT. Effect of clinical guidelines on medical practice. Asystematic review of rigorous evaluations. Lancet 1993; 342: 1317–22.
14 EPOC abstracts can be found via the public-access site listing all Cochraneabstracts on http://hiru.mcmaster.ca/cochrane/cochrane/revabstr/abidx.htm.
15 Lomas J, Haynes RB. A taxonomy and critical review of tested strategies for theapplication of clinical practice recommendations. From “official” to“individual” clinical policy. Am J Prevent Med 1987; 4: 77–94.
16 Thomas L, Cullum N, McColl E, Rousseau N, Soutter J, Steen N. Guidelinesin professions allied to medicine (Cochrane Review). In: The Cochrane Library,Issue 2. Oxford: Update Software, 2000.
17 Shekelle PG, Woolf SH, Eccles M, Grimshaw J. Clinical guidelines: developingguidelines. BMJ 1999; 318: 593–6.
18 Report from General Practice 26. The development and implementation of clinicalguidelines. London: Royal College of General Practitioners, 1995.
19 Grimshaw JM, Russell IT. Achieving health gain through guidelines II: ensuringguidelines change medical practice. Qual Health Care 1994; 3: 45–52.
20 Feder G, Eccles M, Grol R, Griffiths C, Grimshaw J. Clinical guidelines: usingclinical guidelines. BMJ 1999; 318: 728–30.
21 Oxman A. No magic bullets: a systematic review of 102 trials of interventions to helphealth professionals deliver services more effectively and efficiently. London: NorthEast Thames Regional Health Authority, 1994.
22 Hayward RSA, Wilson MC, Tunis SR, Bass EB, Rubin HR, Haynes RB. Moreinformative abstracts of articles describing clinical practice guidelines. AnnIntern Med 1993; 118: 731–7.
PAPERS THAT TELL YOU WHAT TO DO
149

23 Hayward RSA,Wilson MC,Tunis SR, Bass EB, Guyatt G. Users’ guides to themedical literature. VIII. How to use clinical practice guidelines. A. Are therecommendations valid? JAMA 1995; 274: 570–4.
24 Wilson MC, Hayward RS, Tunis SR, Bass EB, Guyatt G. Users’ guides to themedical literature. VIII. How to use clinical practice guidelines. B. Will therecommendations help me in caring for my patients? JAMA 1995; 274: 1630–2.
25 Effective Health Care Bulletin. Implementing clinical guidelines: can guidelines beused to improve clinical practice? Leeds: University of Leeds, 1994.
26 Thomson R, Lavender M, Madhok R. How to ensure that guidelines areeffective. BMJ 1995; 311: 237–42.
27 Cook DJ, Mulrow CD, Haynes RB. Systematic reviews: synthesis of bestevidence for clinical decisions. Ann Intern Med 1997; 126: 376–80.
28 Cook DJ, Greengold NL, Ellrodt AG, Weingarten SR. The relation betweensystematic reviews and practice guidelines. Ann Intern Med 1997; 127: 210–16.
29 Shekelle PG, Kahan JP, Bernstein SJ, Leape LL, Kamberg CJ, Park RE. Thereproducibility of a method to identify the overuse and underuse of medicalprocedures. New Engl J Med 1998; 338: 1888–95.
30 Shekelle PG, Roland M. Measuring quality in the NHS: lessons from across theAtlantic. Lancet 1998; 352: 163–4.
31 Campbell SM, Hann M, Roland MO, Quayle JA, Shekelle PG. The effect ofpanel membership and feedback on ratings in a two-round Delphi survey:results of a randomized controlled trial. Med Care 1999; 37: 964–8.
32 Murphy MK, Black NA, Lamping DL et al. Consensus development methodsand their use in clinical guideline development. Health Technol Assess 1998; 2(3).Available in full text on http://www.hta.nhsweb.nhs.uk/
33 Kelson M. Consumer involvement initiatives in clinical audit and outcomes.A reviewof developments and issues in the identification of good practice. London: College ofHealth, 1995.
34 Haines AP. The science of perpetual change. Br J Gen Pract 1996; 46: 115–19.
HOW TO READ A PAPER
150

Chapter 10: Papers thattell you what things cost(economic analyses)
10.1 What is economic analysis?
An economic analysis can be defined as one that involves the useof analytical techniques to define choices in resource allocation. Most ofwhat I have to say on this subject comes from advice prepared byProfessor Michael Drummond’s team for authors and reviewers ofeconomic analyses1 and three of the “Users’ guides to the medicalliterature” series,2, 3, 4 as well as the excellent pocket sized summaryby Jefferson and colleagues,5 all of which emphasise the importanceof setting the economic questions about a paper in the context ofthe overall quality and relevance of the study (see section 10.3).
The first economic evaluation I ever remember was a TVadvertisement in which the pop singer Cliff Richard tried to persuadea housewife that the most expensive brand of washing up liquid on themarket “actually works out cheaper”. It was, apparently, stronger onstains, softer on the hands, and produced more bubbles per pennythan “a typical cheap liquid”. Although I was only nine at the time, Iwas unconvinced.Which “typical cheap liquid” was the product beingcompared with? How much stronger on stains was it? Why should theeffectiveness of a washing up liquid be measured in terms of bubblesproduced rather than plates cleaned?
Forgive me for sticking with this trivial example but I’d like touse it to illustrate the four main types of economic evaluationwhich you will find in the literature (see Table 10.1 for theconventional definitions).
151

Table 10.1 Types of economic analysis
Type of Outcome Conditions of use Exampleanalysis measure
Cost No outcome Used when the effect Comparing the price minimisation measure of both interventions of a brand name drug analysis is known (or may be with that of its generic
assumed) to be equivalent when identical bioequivalence has
been demonstrated
Cost Natural units Used when the effect Comparing two effectiveness (for example, of the interventions preventive treatments analysis life years can be expressed in for an otherwise fatal
gained) terms of one main conditionvariable
Cost utility Utility units Used when the effect Comparing the analysis (for example, of the interventions on benefits of two
quality health status has two treatments for varicoseadjusted life or more important veins in terms of years) dimensions (for surgical result,
example, benefits and cosmetic appearance,side effects of drugs) and risk of serious
adverse event (for example, pulmonary embolus)
Cost benefit Monetary Used when it is For a purchasinganalysis units (for desirable to compare authority, to decide
example, an intervention for whether to fund aestimated cost one condition with heart transplantation of loss in an intervention for a programme or a stroke productivity) different condition rehabilitation ward
• Cost minimisation analysis. Sudso costs 47p per bottle whereasJiffo costs 63p per bottle.
• Cost effectiveness analysis. Sudso gives you 15 more clean platesper wash than Jiffo.
• Cost utility analysis. In terms of quality adjusted housewife hours(a composite score reflecting time and effort needed to scrubplates clean and hand roughness caused by the liquid), Sudsoprovides 29 units per pound spent whereas Jiffo provides 23 units.
• Cost benefit analysis.The net overall cost (reflecting direct cost ofthe product, indirect cost of time spent washing up, and estimatedfinancial value of a clean plate relative to a slightly grubby one) ofSudso per day is 7.17p, while that of Jiffo is 9.32p.
HOW TO READ A PAPER
152

You should be able to see immediately that the most sensibleanalysis to use in this example is cost effectiveness analysis. Costminimisation analysis (see Table 10.1) is inappropriate since Sudsoand Jiffo do not have identical effectiveness. Cost utility analysis isunnecessary since, in this example, we are interested in very littleelse apart from the number of plates cleaned per unit of washingup liquid; in other words, our outcome has only one importantdimension. Cost benefit analysis is, in this example, an absurdlycomplicated way of telling you that Sudso cleans more plates perpenny.
There are, however, many situations where health professionals,particularly those who purchase health care from real cash limitedbudgets, must choose between interventions for a host of differentconditions whose outcomes (such as cases of measles prevented,increased mobility after a hip replacement, reduced risk of deathfrom heart attack or likelihood of giving birth to a live baby) cannotbe directly compared with one another. Controversy surrounds notjust how these comparisons should be made (see section 10.2) butalso who should make them, and to whom the decision makers forthe “rationing” of health care should be accountable. Theseessential, fascinating, and frustrating questions are beyond thescope of this book but if you are interested I would recommend youlook up the references listed at the end of this chapter.6–14
10.2 Measuring the costs and benefits of healthinterventions
Not long ago, I was taken to hospital to have my appendixremoved. From the hospital’s point of view, the cost of my careincluded my board and lodging for five days, a proportion ofdoctors’ and nurses’ time, drugs and dressings, and investigations(blood tests and a scan). Other direct costs (see Box 10.1) includedmy general practitioner’s time for attending me in the middle of thenight and the cost of the petrol my husband used when visiting me(not to mention the grapes and flowers).
In addition to this, there were the indirect costs of my loss inproductivity. I was off work for three weeks and my domestic dutieswere temporarily divided between various friends, neighbours, anda nice young girl from a nanny agency. And, from my point of view,there were several intangible costs, such as discomfort, loss of
PAPERS THAT TELL YOU WHAT THINGS COST
153

independence, the allergic rash I developed on the medication, andthe cosmetically unsightly scar which I now carry on my abdomen.
As Box 10.1 shows, these direct, indirect, and intangible costsconstitute one side of the cost–benefit equation. On the benefitside, the operation greatly increased my chances of staying alive. Inaddition, I had a nice rest from work and, to be honest, I ratherenjoyed all the attention and sympathy. (Note that the “socialstigma” of appendicitis can be a positive one. I would be less likelyto brag about my experience if my hospital admission had beenprecipitated by, say, an epileptic fit or a nervous breakdown, whichhave negative social stigmata.)
In the appendicitis example, few patients (and even fewerpurchasers) would perceive much freedom of choice in deciding toopt for the operation. But most health interventions do notconcern definitive procedures for acutely life threatening diseases.Most of us can count on developing at least one chronic, disabling,and progressive condition such as ischaemic heart disease, highblood pressure, arthritis, chronic bronchitis, cancer, rheumatism,prostatic hypertrophy or diabetes. At some stage, almost all of uswill be forced to decide whether having a routine operation, takinga particular drug or making a compromise in our lifestyle (reducingour alcohol intake or sticking to a low-fat diet) is “worth it”.
HOW TO READ A PAPER
154
Box 10.1 Examples of costs and benefits of healthinterventions
Costs BenefitsDirect Economic “Board and lodging” Prevention of expensive to treat illness Drugs, dressings, etc. Avoidance of hospital admissionInvestigations Return to paid work Staff salaries
Indirect ClinicalWork days lost Postponement of death or disabilityValue of “unpaid” Relief of pain, nausea, breathlessness, etc.work Improved vision, hearing, muscular strength, etc.
Intangible Quality of lifePain and suffering Increased mobility and independenceSocial stigma Improved wellbeing
Release from sick role

It is fine for informed individuals to make choices about theirown care by gut reaction (“I’d rather live with my hernia than becut open” or “I know about the risk of thrombosis but I want tocontinue to smoke and stay on the pill”). But when the choices areabout other people’s care, subjective judgements are the last thingthat should enter the equation. Most of us would want the plannersand policymakers to use objective, explicit, and defensible criteriawhen making decisions such as “No, Mrs Brown may not have akidney transplant”.
One important way of addressing the “What’s it worth?”question for a given health state (such as having poorly controlleddiabetes or asthma) is to ask someone in that state how they feel. Anumber of questionnaires have been developed which attempt tomeasure overall health status, such as the Nottingham HealthProfile, the SF-36 general health questionnaire (widely used in theUK) and the McMaster Health Utilities Index Questionnaire(popular in North America).15
In some circumstances, disease specific measures of wellbeingare more valid than general measures. For example, answering“yes” to the question “Do you get very concerned about the foodyou are eating?” might indicate anxiety in someone withoutdiabetes but normal self-care attitudes in someone with diabetes.16
There has also been an upsurge of interest in patient specificmeasures of quality of life, to allow different patients to placedifferent values on particular aspects of their health and wellbeing.Of course, when quality of life is being analysed from the point ofview of the patient, this is a sensible and humane approach.However, the health economist tends to make decisions aboutgroups of patients or populations, in which case patient specific,and even disease specific, measures of quality of life have limitedrelevance. If you would like to get up to speed in the ongoingdebate on how to measure health related quality of life, take timeto look up some of the references listed at the end of thischapter.15, 17–25
The authors of standard instruments for measuring quality of life(such as the SF-36) have often spent years ensuring they are valid(i.e. they measure what we think they are measuring), reliable (they doso every time), and responsive to change (i.e. if an interventionimproves or worsens the patient’s health, the scale will reflect that).For this reason, you should be highly suspicious of a paper which
PAPERS THAT TELL YOU WHAT THINGS COST
155
eschews these standard instruments in favour of the authors’ ownrough and ready scale (“Functional ability was classified as good,moderate or poor according to the clinician’s overall impression” or“We asked patients to score both their pain and their overall energylevel from one to ten, and added the results together”). Note also thateven instruments which have apparently been well validated often donot stand up to rigorous evaluation of their psychometric validity.17
Another way of addressing the “What’s it worth?” of particularhealth states is through health state preference values, i.e. the valuewhich, in a hypothetical situation, a healthy person would place ona particular deterioration in their health or which a sick personwould place on a return to health. There are three main methodsof assigning such values.26
• Rating scale measurements – the respondent is asked to make amark on a fixed line, labelled, for example, “perfect health” atone end and “death” at the other, to indicate where he or shewould place the state in question (for example, being wheelchairbound from arthritis of the hip).
• Time trade-off measurements – the respondent is asked to considera particular health state (for example, infertility) and estimatehow many of their remaining years in full health they wouldsacrifice to be “cured” of the condition.
• Standard gamble measurements – the respondent is asked toconsider the choice between living for the rest of their life in aparticular health state and taking a “gamble” (for example, anoperation) with a given odds of success which would return themto full health if it succeeded but kill them if it failed. The oddsare then varied to see at what point the respondent decides thegamble is not worth taking.
The quality adjusted life year or QALY can be calculated bymultiplying the preference value for that state with the time thepatient is likely to spend in that state. The results of cost benefitanalyses are usually expressed in terms of “cost per QALY”, someexamples of which are shown in Box 10.2.27
I find it almost impossible to discuss QALYs without my bloodstarting to boil (and I am not alone in feeling this way28). Anymeasure of health state preference values is, at best, a reflection ofthe preferences and prejudices of the individuals who contributed
HOW TO READ A PAPER
156

to its development. Indeed, it is possible to come up with differentvalues for QALYs depending on how the questions from whichhealth state preference values are derived were posed.29
As medical ethicist John Harris has pointed out, QALYs are, likethe society which produces them, inherently ageist, sexist, racist,and loaded against those with permanent disabilities (since even acomplete cure of an unrelated condition would not restore theindividual to “perfect health”). Furthermore, QALYs distort ourethical instincts by focusing our minds on life years rather thanpeople’s lives. A disabled premature infant in need of an intensivecare cot will, argues Harris, be allocated more resources than itdeserves in comparison with a 50 year old woman with cancer,since the infant, were it to survive, would have so many more lifeyears to quality adjust.30
There is an increasingly confusing array of alternatives to theQALY. Some of the ones that were in vogue when this book wentto press include the following.
• Healthy years equivalent or HYE, a QALY type measure thatincorporates the individual’s likely improvement or deteriorationin health status in the future.31
• Willingness to pay (WTP) or willingness to accept (WTA) –measures of how much people would be prepared to pay to gaincertain benefits or avoid certain problems.5
• Healthy life years or HeLY – which incorporates the risk ofmortality (death) and morbidity (sickness) into a single number.32
PAPERS THAT TELL YOU WHAT THINGS COST
157
Box 10.2 Cost per QALY (1990 figures)
Cholesterol testing and diet therapy £220
Advice to stop smoking from patient’s own doctor £270
Hip replacement for arthritis £1180
Kidney transplant £4710
Breast cancer screening £5780
Cholesterol testing and drug treatment if indicated
(ages 25–39) £14 150
Neurosurgery for malignant brain tumours £107 780

• Disability adjusted life year or DALY – used mainly in thedeveloping world to assess the overall burden of chronic diseaseand deprivation,33, 34 an increasingly used measure that is notwithout its critics.35
• TWiST (time spent without symptoms of disease and toxicity oftreatment) and Q-TWiST (quality adjusted TWiST)!36
My personal advice on all these measures is to look carefully atwhat goes into the number that is supposed to be an “objective”indicator of a person’s (or population’s) health status and at howthe different measures might differ according to different diseasestates. In my view, they all have potential uses but none of them isan absolute or incontrovertible measure of health or illness! (Note,also, that I do not claim to be an expert on any of these measuresor on how to calculate them, which is why I have offered a generouslist of additional references at the end of this chapter.)
There is, however, another form of analysis which, although itdoes not abolish the need to place arbitrary numerical values on lifeand limb, avoids the buck stopping with the unfortunate healtheconomist. This approach, known as cost consequences analysis,presents the results of the economic analysis in a disaggregatedform. In other words, it expresses different outcomes in terms oftheir different natural units (i.e. something real such as months ofsurvival, legs amputated or take home babies), so that individualscan assign their own values to particular health states beforecomparing two quite different interventions (for example,infertility treatment versus cholesterol lowering, as in the exampleI mentioned in Chapter 1). Cost consequences analysis allows forthe health state preference values of both individuals and society tochange with time and is particularly useful when these are disputedor likely to change.This approach may also allow the analysis to beused by different groups or societies from the ones on which theoriginal trial was performed.
10.3 Ten questions to ask about an economic analysis
The elementary checklist which follows is based largely on thesources mentioned in the first paragraph of this chapter. I stronglyrecommend that for a more definitive list, you check out these sources,especially the official recommendations by the BMJ working group.1
HOW TO READ A PAPER
158

Question 1 Is the analysis based on a study which answers a clearlydefined clinical question about an economically important issue?
Before you attempt to digest what a paper says about costs,quality of life scales or utilities, make sure that the trial beinganalysed is scientifically relevant and capable of giving unbiasedand unambiguous answers to the clinical question posed in itsintroduction (see Chapter 4). Furthermore, if there is clearly littleto choose between the interventions in terms of either costs orbenefits, a detailed economic analysis is probably pointless.
Question 2 Whose viewpoint are costs and benefits being consideredfrom?
From the patient’s point of view, he or she generally wants to getbetter as quickly as possible. From the Treasury’s point of view, themost cost effective health intervention is one that returns all citizenspromptly to taxpayer status and, when this status is no longertenable, causes immediate sudden death. From the drug company’spoint of view, it would be difficult to imagine a cost–benefit equationwhich did not contain one of the company’s products and from aphysiotherapist’s point of view, the removal of a physiotherapyservice would never be cost effective. There is no such thing as aneconomic analysis which is devoid of perspective. Most assume theperspective of the health care system itself, although some take intoaccount the hidden costs to the patient and society (for example,due to work days lost). There is no “right” perspective for aneconomic evaluation but the paper should say clearly whose costsand whose benefits have been counted “in” and “out”.
Question 3 Have the interventions being compared been shown to beclinically effective?
Nobody wants cheap treatment if it doesn’t work.The paper youare reading may simply be an economic analysis, in which case itwill be based on a previously published clinical trial, or it will be aneconomic evaluation of a new trial whose clinical results arepresented in the same paper. Either way, you must make sure thatthe intervention that “works out cheaper” is not substantially lesseffective in clinical terms than the one that stands to be rejected onthe grounds of cost. (Note, however, that in a resource limitedhealth care system, it is often very sensible to use treatments that
PAPERS THAT TELL YOU WHAT THINGS COST
159

are a little less effective when they are a lot less expensive than thebest on offer!)
Question 4 Are the interventions sensible and workable in the settingswhere they are likely to be applied?
A research trial that compares one obscure and unaffordableintervention with another will have little impact on medicalpractice. Remember that standard current practice (which may be“doing nothing”) should almost certainly be one of the alternativescompared. Too many research trials look at intervention packageswhich would be impossible to implement in the non-researchsetting (they assume, for example, that general practitioners willown a state of the art computer and agree to follow a protocol, thatinfinite nurse time is available for the taking of blood tests or thatpatients will make their personal treatment choices solely on thebasis of the trial’s conclusions).
Question 5 Which method of analysis was used, and was thisappropriate?
This decision can be summarised as follows (see section 10.2).
• If the interventions produced identical outcomes ➯ costminimisation analysis
• If the important outcome is unidimensional ➯ cost effectivenessanalysis
• If the important outcome is multidimensional ➯ cost utilityanalysis
• If the outcomes can be expressed meaningfully in monetaryterms (i.e. if it is possible to weigh the cost–benefit equation forthis condition against the cost–benefit equation for anothercondition) ➯ cost benefit analysis
• If a cost benefit analysis would otherwise be appropriate but thepreference values given to different health states are disputed orlikely to change ➯ cost consequences analysis
Question 6 How were costs and benefits measured?
Look back at section 10.2, where I outlined some of the costsassociated with my appendix operation. Now imagine a morecomplicated example – the rehabilitation of stroke patients into
HOW TO READ A PAPER
160

their own homes with attendance at a day centre compared with astandard alternative intervention (rehabilitation in a long stayhospital). The economic analysis must take into account not justthe time of the various professionals involved, the time of thesecretaries and administrators who help run the service, and thecost of the food and drugs consumed by the stroke patients, butalso a fraction of the capital cost of building the day centre andmaintaining a transport service to and from it.
There are no hard and fast rules for deciding which costs toinclude. If calculating “cost per case” from first principles,remember that someone has to pay for heating, lighting, personnelsupport, and even the accountants’ bills of the institution. Ingeneral terms, these “hidden costs” are known as overheads andgenerally add an extra 30–60% onto the cost of a project.The taskof costing things like operations and outpatient visits in the UK iseasier than it used to be because these experiences are now boughtand sold within the NHS at a price which reflects (or shouldreflect) all overheads involved. Be warned, however, that unit costsof health interventions calculated in one country often bear norelation to those of the same intervention elsewhere, even whenthese costs are expressed as a proportion of GNP.
Benefits such as earlier return to work for a particular individualcan, on the face of it, be measured in terms of the cost of employingthat person at his or her usual daily rate. This approach has theunfortunate and politically unacceptable consequence of valuingthe health of professional people higher than that of manualworkers, homemakers or the unemployed and that of the whitemajority higher than that of (generally) lower paid minority ethnicgroups. It might therefore be preferable to derive the cost of sickdays from the average national wage.
In a cost effectiveness analysis, changes in health status will beexpressed in natural units (see section 10.2). But just because theunits are natural does not automatically make them appropriate. Forexample, the economic analysis of the treatment of peptic ulcer bytwo different drugs might measure outcome as “proportion of ulcershealed after a six-week course”. Treatments could be comparedaccording to the cost per ulcer healed. However, if the relapse rateson the two drugs were very different, drug A might be falselydeemed “more cost effective” than drug B. A better outcomemeasure here might be “ulcers which remained healed at one year”.
PAPERS THAT TELL YOU WHAT THINGS COST
161

In cost benefit analysis, where health status is expressed in utilityunits such as QALYs, you would, if you were being really rigorousabout evaluating the paper, look back at how the particular utilitiesused in the analysis were derived (see section 10.2). In particular,you will want to know whose health preference values were used –those of patients, doctors, health economists or the government.
For a more detailed and surprisingly readable account of how to“cost” different health care interventions, see the report from theUK Health Technology Assessment programme.37
Question 7 Were incremental, rather than absolute, benefits considered?
This question is best illustrated by a simple example. Let’s saydrug X, at £100 per course, cures 10 out of every 20 patients. Itsnew competitor, drug Y, costs £120 per course and cures 11 out of20 patients.The cost per case cured with drug X is £200 (since youspent £2000 curing 10 people) and the cost per case cured withdrug Y is £218 (since you spent £2400 curing 11 people).
The incremental cost of drug Y, i.e. the extra cost of curing theextra patient, is not £18 but £400, since this is the total amountextra that you have had to pay to achieve an outcome over and abovewhat you would have achieved by giving all patients the cheaperdrug.This striking example should be borne in mind the next timea pharmaceutical representative tries to persuade you that his or herproduct is “more effective and only marginally more expensive”.
Question 8 Was the “here and now” given precedence over the distantfuture?
A bird in the hand is worth two in the bush. In health as well asmoney terms, we value a benefit today more highly than we valuea promise of the same benefit in five years’ time.When the costs orbenefits of an intervention (or lack of the intervention) will occursome time in the future, their value should be discounted to reflectthis. The actual amount of discount that should be allowed forfuture, as opposed to immediate, health benefit is pretty arbitrarybut most analyses use a figure of around 5% per year.
Question 9 Was a sensitivity analysis performed?
Let’s say a cost benefit analysis comes out as saying that herniarepair by day case surgery costs £1150 per QALY whereas traditionalopen repair, with its associated hospital stay, costs £1800 per QALY.
HOW TO READ A PAPER
162

But, when you look at how the calculations were done, you aresurprised at how cheaply the laparoscopic equipment has beencosted. If you raise the price of this equipment by 25%, does day casesurgery still come out dramatically cheaper? It may or it may not.
Sensitivity analysis, or exploration of “what ifs”, was described insection 8.2 in relation to metaanalysis. Exactly the same principlesapply here: if adjusting the figures to account for the full range ofpossible influences gives you a totally different answer, you shouldnot place too much reliance on the analysis. For a good example ofa sensitivity analysis on a topic of both scientific and politicalimportance, see Pharoah and Hollingworth’s paper on the costeffectiveness of lowering cholesterol (which addresses the difficultissue of who should receive, and who should be denied, effectivebut expensive cholesterol lowering drugs).38
Question 10 Were “bottom line” aggregate scores overused?
In section 10.2, I introduced the notion of cost consequencesanalysis, in which the reader of the paper can attach his or her ownvalues to different utilities. In practice, this is an unusual way ofpresenting an economic analysis and, more commonly, the readeris faced with a cost utility or cost benefit analysis which gives acomposite score in unfamiliar units which do not translate readilyinto exactly what gains and losses the patient can expect. Thesituation is analogous to the father who is told “Your child’sintelligence quotient is 115”, when he would feel far betterinformed if he were presented with the disaggregated data: “Johnnycan read, write, count, and draw pretty well for his age”.
10.4 Conclusion
I hope this chapter has shown that the critical appraisal of aneconomic analysis rests as crucially on asking questions such as“Where did those numbers come from?” and “Have any numbersbeen left out?” as on checking that the sums themselves werecorrect.Whilst few papers will fulfil all the criteria listed in section10.3 and summarised in Appendix 1, you should, after reading thechapter, be able to distinguish an economic analysis of moderate orgood methodological quality from one which slips “throwawaycostings” (“drug X costs less than drug Y; therefore it is more costeffective”) into its results or discussion section.
PAPERS THAT TELL YOU WHAT THINGS COST
163

1 Drummond MF, Jefferson TO on behalf of the BMJ Economic EvaluationWorking Party. Guidelines for authors and peer reviewers of economicsubmissions for the BMJ. BMJ 1996; 313: 275–83.
2 Guyatt GH, Naylor CD, Juniper E, Heyland DK, Jaeschke R, Cook DJ. Users’guides to the medical literature. XII. How to use articles about health-relatedquality of life. JAMA 1997; 277: 1232–7.
3 Drummond MF, Richardson WS, O’Brien BJ, Levine M, Heyland D. Users’guides to the medical literature. XIII. How to use an article on economic analysisof clinical practice.A.Are the results of the study valid? JAMA 1997; 277: 1552–7.
4 O’Brien BJ, Heyland D, Richardson WS, Levine M, Drummond MF. Users’guides to the medical literature. XIII. How to use an article on economicanalysis of clinical practice. B. What are the results and will they help me incaring for my patients? JAMA 1997; 277: 1802–6.
5 Jefferson T, Demicheli V, Mugford M. Elementary economic evaluation in healthcare. London: BMJ Publications, 1996.
6 New B. The rationing debate. Defining a package of healthcare services theNHS is responsible for. The case for. BMJ 1997; 314: 503–5.
7 Klein R. The rationing debate. Defining a package in healthcare services theNHS is responsible for. The case against. BMJ 1997; 314: 506–9.
8 Culyer AJ. The rationing debate: maximising the health of the wholecommunity. The case for. BMJ 1997; 314: 667–9.
9 Harris J. The rationing debate: maximising the health of the whole community.The case against: what the principal objective of the NHS should really be. BMJ1997; 314: 669–72.
10 Williams A, Evans JG.The rationing debate. Rationing health care by age. BMJ1997; 314: 820–5.
11 Lenaghan J. The rationing debate. Central government should have a greaterrole in rationing decisions. The case for. BMJ 1997; 314: 967–70.
12 Harrison S. The rationing debate. Central government should have a greaterrole in rationing decisions. The case against. BMJ 1997; 314: 970–3.
13 Doyal L. The rationing debate. Rationing within the NHS should be explicit.The case for. BMJ 1997; 314: 1114–18.
14 Coast J.The rationing debate. Rationing within the NHS should be explicit.Thecase against. BMJ 1997; 314: 1118–22.
15 Bowling A. Measuring health. Milton Keynes: Open University Press, 1997.16 Bradley C, ed. Handbook of psychology and diabetes. London: Harwood Academic
Publishers, 1994.17 Gill TM, Feinstein AR. A critical appraisal of quality-of-life measurements.
JAMA 1994; 272: 619–26.18 Wilson IB, Cleary PD. Linking clinical variables with health-related quality of
life. A conceptual model of patient outcomes. JAMA 1995; 273: 59–65.19 Fallowfield LJ. Assessment of quality of life in breast cancer. Acta Oncol 1995;
34: 689–94.20 Hickey AM, Bury G, O’Boyle CA, Bradley F, O’Kelley FD, Shannon W. A new
short-form individual quality of life measure (SEIQoL-DW). Application in acohort of individuals with HIV/AIDS. BMJ 1996; 313: 29–33.
21 Laupacis A,Wong C, Churchill D.The use of generic and specific quality-of-lifemeasures in hemodialysis patients treated with erythropoietin. Controlled ClinTrials 1991; 12 (suppl): 168S–179S.
22 Tugwell P, Bombardier C, Buchanan WW et al. Methotrexate in rheumatoidarthritis. Impact on quality of life assessed by traditional standard-item andindividualized patient preference health status questionnaires. Arch Intern Med1990; 150: 59–62.
HOW TO READ A PAPER
164

23 Cairns J. Measuring health outcomes. BMJ 1996; 313: 6.24 Gill TM, Feinstein AR. A critical appraisal of the quality of quality of life
measurements. JAMA 1994; 272: 619–26.25 Guyatt GH, Cook DJ. Health status, quality of life, and the individual patient.
A commentary on: Gill TM, Feinstein AR. A critical appraisal of the quality ofquality of life measurements. JAMA 1994; 272: 630–1.
26 Brazier J, Deverill M, Green C, Harper R, Booth A. A review of the use of healthstatus measures in economic evaluation. Health Technol Assess 1999; 3(9).Available in full text on http://www.hta.nhsweb.nhs.uk/
27 Ham C. Priority setting in the NHS. Br J Health Care Manage 1995; 1: 27–9.28 Naylor CD. Cost-effectiveness analysis: are the outputs worth the inputs? ACP
Journal Club 1996; 124: a12–14.29 Weinberger M, Oddone EZ, Samsa G, Landsman P. Are health-related quality
of life measures affected by the mode of administration? J Clin Epidemiol 1996;49: 135–40.
30 Harris J. QALYfying the value of life. J Med Ethics 1987; 13: 117–23.31 Gafni A. Alternatives to the QALY measure for economic evaluations.
Supportive Care Cancer 1997; 5: 105–11.32 Hyder AA, Rotllant G, Morrow RH. Measuring the burden of disease: healthy
life-years. Am J Pub Health 1998; 88: 196–202.33 Ustun TB, Rehm J, Chatterji S et al. Multiple-informant ranking of the disabling
effects of different health conditions in 14 countries. WHO/NIH Joint ProjectCAR Study Group. Lancet 1999; 354: 111–15.
34 Gwatkin DR, Guillot M, Heuveline P. The burden of disease among the globalpoor. Lancet 1999; 354: 586–9.
35 Arnesen T, Nord E. The value of DALY life: problems with ethics and validityof disability adjusted life years. BMJ 1999; 319: 1423–5.
36 Billingham LJ, Abrams KR, Jones DR. Methods for the analysis of quality-of-life and survival data in health technology assessment. Health Technol Assess1999; 3(10). Available in full text on http://www.hta.nhsweb.nhs.uk/
37 Johnston K, Buxton MJ, Jones DR, Fitzpatrick R. Assessing the costs ofhealthcare technologies in clinical trials. Health Technol Assess 1999; 3(6).Available in full text on http://www.hta.nhsweb.nhs.uk/
38 Pharoah PDP, Hollingworth W. Cost-effectiveness of lowering cholesterolconcentration with statins in patients with and without pre-existing coronaryheart disease: life table method applied to health authority population. BMJ1996; 312: 1443–8.
PAPERS THAT TELL YOU WHAT THINGS COST
165

Chapter 11: Papers thatgo beyond numbers(qualitative research)
11.1 What is qualitative research?
The pendulum is swinging. Fifteen years ago, when I took up myfirst research post, a work weary colleague advised me: “Findsomething to measure, and keep on measuring it until you’ve got aboxful of data. Then stop measuring and start writing up”. “Butwhat should I measure?”, I asked. “That”, he said cynically,“doesn’t much matter.”
This true example illustrates the limitations of an exclusivelyquantitative (counting and measuring) perspective in research.Epidemiologist Nick Black has argued that a finding or a result ismore likely to be accepted as a fact if it is quantified (expressed innumbers) than if it is not.1 There is little or no scientific evidence,for example, to support the well known “facts” that one couple in10 is infertile, one man in 10 is homosexual, and the incidence ofcoronary heart disease was rising but is now falling. Yet, observesBlack, most of us are happy to accept uncritically such simplified,reductionist, and blatantly incorrect statements so long as theycontain at least one number.
Qualitative researchers seek a deeper truth. They aim to “studythings in their natural setting, attempting to make sense of, orinterpret, phenomena in terms of the meanings people bring tothem”,2 and they use “a holistic perspective which preserves thecomplexities of human behaviour”.1
Interpretive or qualitative research was for years the territory ofthe social scientists. It is now increasingly recognised as being notjust complementary to but, in many cases, a prerequisite for the
166

quantitative research with which most of us who trained in thebiomedical sciences are more familiar. Certainly, the view that thetwo approaches are mutually exclusive has itself become“unscientific” and it is currently rather trendy, particularly in thefields of primary care and health services research, to say that youare doing some qualitative research – and since the first edition ofthis book was published, qualitative research has even becomemainstream within the evidence based medicine movement.3, 4, 5
Dr Cecil Helman, author of a leading textbook on theanthropological aspects of health and illness,6 told me the followingstory to illustrate the qualitative quantitative dichotomy. A smallchild runs in from the garden and says, excitedly, “Mummy, theleaves are falling off the trees”. “Tell me more,” says his mother.“Well, five leaves fell in the first hour, then ten leaves fell in thesecond hour . . .” That child will become a quantitative researcher.
A second child, when asked “tell me more”, might reply, “Well,the leaves are big and flat, and mostly yellow or red, and they seemto be falling off some trees but not others. And mummy, why didno leaves fall last month?” That child will become a qualitativeresearcher.
Questions such as “How many parents would consult their generalpractitioner when their child has a mild temperature?” or “Whatproportion of smokers have tried to give up?” clearly need answeringthrough quantitative methods. But questions like “Why do parentsworry so much about their children’s temperature?” and “What stopspeople giving up smoking?” cannot and should not be answered byleaping in and measuring the first aspect of the problem that we (theoutsiders) think might be important. Rather, we need to hang out,listen to what people have to say, and explore the ideas and concernswhich the subjects themselves come up with. After a while, we maynotice a pattern emerging, which may prompt us to make ourobservations in a different way.We may start with one of the methodsshown in Box 11.1, and go on to use a selection of others.
Box 11.2, which is reproduced with permission from Nick Maysand Catherine Pope’s introductory book Qualitative research inhealth care,7 summarises (indeed overstates) the differencesbetween the qualitative and quantitative approaches to research. Inreality, there is a great deal of overlap between them, theimportance of which is increasingly being recognised.8, 9
PAPERS THAT GO BEYOND NUMBERS
167

As section 3.2 explains, quantitative research should begin withan idea (usually articulated as a hypothesis) which then, throughmeasurement, generates data and, by deduction, allows a conclusionto be drawn. Qualitative research is different. It begins with an
HOW TO READ A PAPER
168
Box 11.1 Examples of qualitative research methods
Documents Study of documentary accounts of events,such as meetings
Passive observation Systematic watching of behaviour and talkin naturally occurring settings
Participant observation Observation in which the researcher alsooccupies a role or part in the setting inaddition to observing
In-depth interviews Face to face conversation with the purposeof exploring issues or topics in detail. Doesnot use preset questions but is shaped by adefined set of topics
Focus groups Method of group interview that explicitlyincludes and uses the group interaction togenerate data
Box 11.2 Qualitative versus quantitative research – theoverstated dichotomy7
Qualitative Quantitative
Social theory Action Structure
Methods Observation, interview Experiment, survey
Question What is X? How many Xs?(classification) (enumeration)
Reasoning Inductive Deductive
Sampling method Theoretical Statistical
Strength Validity Reliability
intention to explore a particular area, collects “data” (i.e.observations and interviews), and generates ideas and hypothesesfrom these data largely through what is known as inductivereasoning.7 The strength of the quantitative approach lies in itsreliability (repeatability), i.e. the same measurements should yieldthe same results time after time. The strength of qualitativeresearch lies in validity (closeness to the truth), i.e. good qualitativeresearch, using a selection of data collection methods, really shouldtouch the core of what is going on rather than just skimming thesurface. The validity of qualitative methods is greatly improved bythe use of more than one method (see Box 11.1) in combination, aprocess known as triangulation, and by more than one researcheranalysing the same data independently.
Those who are ignorant about qualitative research often believethat it constitutes little more than hanging out and watching leavesfall. It is beyond the scope of this book to take you through thesubstantial literature on how to (and how not to) proceed whenobserving, interviewing, leading a focus group, and so on. Butsophisticated methods for all these techniques certainly exist and ifyou are interested I suggest you try the introductory7, 10, 11 or moredetailed2, 12 texts listed at the end of this chapter.
Qualitative methods really come into their own when researchinguncharted territory, i.e. where the variables of greatest concern arepoorly understood, ill defined, and cannot be controlled.1, 13 In suchcircumstances, the definitive hypothesis may not be arrived at untilthe study is well under way. But it is in precisely thesecircumstances that the qualitative researcher must ensure that(s)he has, at the outset, carefully delineated a particular focus ofresearch and identified some specific questions to try to answer(see Question 1 in section 11.2 below).The methods of qualitativeresearch allow for and even encourage2 modification of the researchquestion in the light of findings generated along the way. (Incontrast, as section 5.2 showed, sneaking a look at the interimresults of a quantitative study is statistically invalid!)
The so-called iterative approach (altering the research methodsand the hypothesis as you go along) employed by qualitativeresearchers shows a commendable sensitivity to the richness andvariability of the subject matter. Failure to recognise the legitimacyof this approach has, in the past, led critics to accuse qualitativeresearchers of continually moving their own goalposts.Whilst these
PAPERS THAT GO BEYOND NUMBERS
169

criticisms are often misguided, there is, as Nicky Britten andcolleagues have observed, a real danger “that the flexibility [of theiterative approach] will slide into sloppiness as the researcherceases to be clear about what it is (s)he is investigating”.13 Theywarn that qualitative researchers must, therefore, allow periodsaway from their fieldwork for reflection, planning, and consultationwith colleagues.
11.2 Evaluating papers that describe qualitativeresearch
By its very nature, qualitative research is non-standard,unconfined, and dependent on the subjective experience of boththe researcher and the researched. It explores what needs to beexplored and cuts its cloth accordingly. It is debatable, therefore,whether an all-encompassing critical appraisal checklist along thelines of the “Users’ guides to the medical literature” (see references8–32 in Chapter 3) could ever be developed. My own view, andthat of a number of individuals who have attempted or arecurrently working on this very task,7, 12, 13, 14 is that such a checklistmay not be as exhaustive or as universally applicable as the variousguides for appraising quantitative research, but that it is certainlypossible to set some ground rules. The list which follows has beendistilled from the published work cited earlier2, 7, 13 and also fromdiscussions with Dr Rod Taylor of Exeter University, who hasworked with the CASP Project on a more detailed and extensivecritical appraisal guide for qualitative papers.
Question 1 Did the paper describe an important clinical problemaddressed via a clearly formulated question?
In section 3.2, I explained that one of the first things you shouldlook for in any research paper is a statement of why the researchwas done and what specific question it addressed. Qualitativepapers are no exception to this rule: there is absolutely no scientificvalue in interviewing or observing people just for the sake of it.Papers which cannot define their topic of research more closelythan “We decided to interview 20 patients with epilepsy” inspirelittle confidence that the researchers really knew what they werestudying or why.
You might be more inclined to read on if the paper stated in its
HOW TO READ A PAPER
170

introduction something like, “Epilepsy is a common andpotentially disabling condition, and up to 20% of patients do notremain fit free on medication. Antiepileptic medication is known tohave unpleasant side effects, and several studies have shown that ahigh proportion of patients do not take their tablets regularly. Wetherefore decided to explore patients’ beliefs about epilepsy andtheir perceived reasons for not taking their medication”.
As I explained in section 11.1, the iterative nature of qualitativeresearch is such that the definitive research question may not beclearly focused at the outset of the study but, as Britten andcolleagues point out, it should certainly have been formulated bythe time the report is written!
Question 2 Was a qualitative approach appropriate?
If the objective of the research was to explore, interpret or obtaina deeper understanding of a particular clinical issue, qualitativemethods were almost certainly the most appropriate ones to use. If,however, the research aimed to achieve some other goal (such asdetermining the incidence of a disease or the frequency of anadverse drug reaction, testing a cause and effect hypothesis orshowing that one drug has a better risk–benefit ratio than another),qualitative methods are clearly inappropriate! If you think a case-control, cohort study or randomised trial would have been bettersuited to the research question posed in the paper than thequalitative methods that were actually used, you might like tocompare that question with the examples in section 3.3 to confirmyour hunch.
Question 3 How were (a) the setting and (b) the subjects selected?
Look back at Box 11.2, which contrasts the statistical samplingmethods of quantitative research with theoretical ones of qualitativeresearch. Let me explain what this means. In the earlier chapters ofthis book, particularly section 4.2, I emphasised the importance, inquantitative research, of ensuring that a truly random sample ofsubjects is recruited. A random sample will ensure that the resultsreflect, on average, the condition of the population from which thatsample was drawn.
In qualitative research, however, we are not interested in an “onaverage” view of a patient population.We want to gain an in-depthunderstanding of the experience of particular individuals or groups
PAPERS THAT GO BEYOND NUMBERS
171

and we should therefore deliberately seek out individuals or groupswho fit the bill. If, for example, we wished to study the experienceof non-English speaking British Punjabi women when they gavebirth in hospital (with a view to tailoring the interpreter/advocacyservice more closely to the needs of this patient group), we wouldbe perfectly justified in going out of our way to find women whohad had a range of different birth experiences – an induceddelivery, an emergency caesarean section, a delivery by a medicalstudent, a late miscarriage, and so on.
We would also wish to select some women who had had sharedantenatal care between an obstetrician and their generalpractitioner and some women who had been cared for bycommunity midwives throughout the pregnancy. In this example, itmight be particularly instructive to find women who had had theircare provided by male doctors, even though this would be arelatively unusual situation. Finally, we might choose to studypatients who gave birth in the setting of a large, modern, “high-tech” maternity unit as well as some who did so in a smallcommunity hospital. Of course, all these specifications will give us“biased” samples but that is exactly what we want.
Watch out for qualitative research where the sample has beenselected (or appears to have been selected) purely on the basis ofconvenience. In the above example, taking the first dozen Punjabipatients to pass through the nearest labour ward would be theeasiest way to notch up interviews, but the information obtainedmay be considerably less helpful.
Question 4 What was the researcher’s perspective and has this beentaken into account?
Given that qualitative research is necessarily grounded in real lifeexperience, a paper describing such research should not be“trashed” simply because the researchers have declared a particularcultural perspective or personal involvement with the subjects ofthe research. Quite the reverse: they should be congratulated fordoing just that. It is important to recognise that there is no way ofabolishing, or fully controlling for, observer bias in qualitativeresearch. This is most obviously the case when participantobservation (see Box 11.1) is used but it is also true for other formsof data collection and of data analysis.
If, for example, the research concerns the experience of
HOW TO READ A PAPER
172

asthmatic adults living in damp and overcrowded housing and theperceived effect of these surroundings on their health, the datagenerated by techniques such as focus groups or semistructuredinterviews are likely to be heavily influenced by what the interviewerbelieves about this subject and by whether he or she is employed bythe hospital chest clinic, the social work department of the localauthority or an environmental pressure group. But since it isinconceivable that the interviews could have been conducted bysomeone with no views at all and no ideological or culturalperspective, the most that can be required of the researchers is thatthey describe in detail where they are coming from so that theresults can be interpreted accordingly.
Question 5 What methods did the researcher use for collecting dataand are these described in enough detail?
I once spent two years doing highly quantitative, laboratorybased experimental research in which around 15 hours of everyweek were spent filling or emptying test tubes. There was astandard way to fill the test tubes, a standard way to spin them inthe centrifuge, and even a standard way to wash them up. When Ifinally published my research, some 900 hours of drudgery wassummed up in a single sentence: “Patients’ serum rhubarb levelswere measured according to the method described by Bloggs andBloggs [reference to Bloggs and Bloggs’ paper on how to measureserum rhubarb]”.
I now spend quite a lot of my time doing qualitative research andI can confirm that it’s infinitely more fun. I and my research teamspent an interesting few years devising a unique combination oftechniques to measure the beliefs, hopes, fears, and attitudes ofdiabetic patients from a particular minority ethnic group (BritishSylhetis). We had to develop, for example, a valid way ofsimultaneously translating and transcribing interviews which wereconducted in Sylheti, a complex dialect of Bengali which has nowritten form.We found that patients’ attitudes appear to be heavilyinfluenced by the presence in the room of certain of their relatives,so we contrived to interview some patients in both the presenceand the absence of these key relatives.
I could go on describing the methods we devised to address thisparticular research issue15 but I have probably made my point: themethods section of a qualitative paper often cannot be written in
PAPERS THAT GO BEYOND NUMBERS
173

shorthand or dismissed by reference to someone else’s researchtechniques. It may have to be lengthy and discursive since it istelling a unique story without which the results cannot beinterpreted. As with the sampling strategy, there are no hard andfast rules about exactly what details should be included in thissection of the paper. You should simply ask “Have I been givenenough information about the methods used?” and if you have, useyour common sense to assess “Are these methods a sensible andadequate way of addressing the research question?”.
Question 6 What methods did the researcher use to analyse the dataand what quality control measures were implemented?
The data analysis section of a qualitative research paper is wheresense can most readily be distinguished from nonsense. Havingamassed a thick pile of completed interview transcripts or fieldnotes, the genuine qualitative researcher has hardly begun. It issimply not good enough to flick through the text looking for“interesting quotes” which support a particular theory. Theresearcher must find a systematic way of analysing his or her dataand, in particular, must seek examples of cases which appear tocontradict or challenge the theories derived from the majority.
One way of doing this is via content analysis: drawing up a list ofcoded categories and “cutting and pasting” each segment oftranscribed data into one of these categories.This can be done eithermanually or, if large amounts of data are to be analysed, via atailormade computer database. The statements made by all thesubjects on a particular topic can then be compared with one anotherand more sophisticated comparisons can be made, such as “Didpeople who made statement A also tend to make statement B?”.
A good qualitative research paper may show evidence of “qualitycontrol”; that is, the data (or at least a sample of them) will havebeen analysed by more than one researcher to confirm that they areboth assigning the same meaning to them. In analysing my ownresearch into health beliefs in diabetic patients, three of us looked inturn at a typed interview transcript and assigned codings toparticular statements.We then compared our decisions and argued(sometimes heatedly) about our disagreements. Our analysisrevealed differences in the interpretation of certain statementswhich we were unable to fully resolve; in other words, our inabilityto “wrap up” all aspects of the interpretation was itself an important
HOW TO READ A PAPER
174

item of data.15 All this is legitimate methodology for analysingqualitative data. What is not legitimate is to assume that there is asingle “right” way to interpret the data. Having said that, there aresome researchers who feel strongly that only the person mostimmersed in the fieldwork has genuine insight into the meaning ofthe data; in other words, interpretation should not be “triangulated”by all and sundry simply to give a show of improving validity.
Question 7 Are the results credible and if so, are they clinicallyimportant?
We obviously cannot assess the credibility of qualitative resultsvia the precision and accuracy of measuring devices, nor theirsignificance via confidence intervals and numbers needed to treat.It takes little more than plain common sense to determine whetherthe results are sensible and believable and whether they matter inpractice.
One important aspect of the results section to check is whetherthe authors cite actual data. Claims such as “General practitionersdid not usually recognise the value of audit” would be infinitelymore credible if one or two verbatim quotes from the intervieweeswere reproduced to illustrate them. The results should beindependently and objectively verifiable – after all, a subject eithermade a particular statement or (s)he did not – and all quotes andexamples should be indexed so that they can be traced back to anidentifiable subject and setting.
Question 8 What conclusions were drawn and are they justified bythe results?
A quantitative research paper, presented in standard IMRADformat (see section 3.1), should clearly distinguish the study’sresults (usually a set of numbers) from the interpretation of thoseresults. The reader should have no difficulty separating what theresearchers found from what they think it means. In qualitativeresearch, however, such a distinction is rarely possible since theresults are by definition an interpretation of the data.
It is therefore necessary, when assessing the validity of qualitativeresearch, to ask whether the interpretation placed on the dataaccords with common sense and is relatively untainted withpersonal or cultural perspective. This can be a difficult exercise,because the language we use to describe things tends to imply
PAPERS THAT GO BEYOND NUMBERS
175

meanings and motives which the subjects themselves may notshare. Compare, for example, the two statements, “Three womenwent to the well to get water” and “Three women met at the welland each was carrying a pitcher”.
It is becoming a cliché that the conclusions of qualitative studies,like those of all research, should be “grounded in evidence”; that is,that they should flow from what the researchers found in the field.Mays and Pope suggest three useful questions for determiningwhether the conclusions of a qualitative study are valid.
• How well does this analysis explain why people behave in the waythey do?
• How comprehensible would this explanation be to a thoughtfulparticipant in the setting?
• How well does the explanation cohere with what we already know?16
Question 9 Are the findings of the study transferable to other clinicalsettings?
One of the most common criticisms of qualitative research is thatthe findings of any qualitative study pertain only to the limitedsetting in which they were obtained. In fact, this is not necessarilyany truer of qualitative research than of quantitative research. Lookback at the example of British Punjabi women I described inQuestion 3. You should be able to see that the use of a truetheoretical sampling frame greatly increases the transferability of theresults over a “convenience” sample.
11.3 Conclusion
Doctors have traditionally placed high value on number baseddata, which may in reality be misleading, reductionist, andirrelevant to the real issues.The increasing popularity of qualitativeresearch in the biomedical sciences has arisen largely becausequantitative methods provided either no answers or the wronganswers to important questions in both clinical care and servicedelivery.1 If you still feel that qualitative research is necessarilysecond rate by virtue of being a “soft” science, you should be awarethat you are out of step with the evidence.4, 5
In 1993, Catherine Pope and Nicky Britten presented at aconference a paper entitled “Barriers to qualitative methods in the
HOW TO READ A PAPER
176

medical mindset”, in which they showed their collection ofrejection letters from biomedical journals.17 The letters revealed astriking ignorance of qualitative methodology on the part ofreviewers. In other words, the people who had rejected the papersoften appeared to be incapable of distinguishing good qualitativeresearch from bad.
Somewhat ironically, poor quality qualitative papers now appearregularly in some medical journals, who appear to have undergonean about face in editorial policy since Pope and Britten’s exposureof the “medical mindset”. I hope, therefore, that the questionslisted above, and the references below, will assist reviewers in bothcamps: those who continue to reject qualitative papers for thewrong reasons and those who have climbed on the qualitativebandwagon and are now accepting such papers for the wrongreasons! Note, however, that the critical appraisal of qualitativeresearch is a relatively underdeveloped science and the questionsposed in this chapter are still being refined.
1 Black N. Why we need qualitative research. J Epidemiol Commun Health 1994;48: 425–6.
2 Denzin NK, Lincoln YS, eds. Handbook of qualitative research. London: SagePublications, 1994.
3 Green J, Britten N. Qualitative research and evidence based medicine. BMJ1998; 316: 1230–2.
4 Giacomini MK, Cook DJ. A user’s guide to qualitative research in health care.Part I. Are the results of the study valid? JAMA 2000; 357–62.
5 Giacomini MK, Cook DJ. A user’s guide to qualitative research in health care:Part II. What are the results and how do they help me care for my patients?JAMA 2000; 478–82.
6 Helman C. Culture, health and illness, 4th edn. London: ButterworthHeinemann, 2000.
7 Mays N, Pope C, eds. Qualitative research in health care, 2nd edn. London: BMJPublications, 2000.
8 Abell P. Methodological achievements in sociology over the past few decadeswith specific reference to the interplay of qualitative and quantitative methods.In: Bryant C, Becker H, eds. What has sociology achieved? London: Macmillan,1990.
9 Bradley F, Wiles R, Kinmonth AL, Mant D, Gantley M. Development andevaluation of complex interventions in health services research: case study of theSouthampton Heart Integrated Care Project (SHIP). The SHIP CollaborativeGroup. BMJ 1999; 318: 711–15.
10 Pope C, Mays N. Qualitative research in health care: assessing quality inqualitative research. BMJ 2000; 320: 50–2.
11 Pope C, Ziebland S, Mays N. Qualitative research in health care: analysingqualitative data. BMJ 2000; 320: 114–16.
12 Murphy E, Dingwall R, Greatbatch D, Parker S, Watson P. Qualitative research
PAPERS THAT GO BEYOND NUMBERS
177

methods in health technology assessment: a review of the literature. Health TechnolAssess 1998; 2(16). Available in full text on http://www.hta.nhsweb.nhs.uk/.
13 Britten N, Jones R, Murphy E, Stacy R. Qualitative research methods in generalpractice and primary care. Fam Pract 1995; 12: 104–14.
14 Taylor R, personal communication.15 Greenhalgh T, Chowdhury AM, Helman C. Health beliefs and folk models of
diabetes in British Bangladeshis: a qualitative study. BMJ 1998; 316: 978–83.16 Mays N, Pope C, eds. Qualitative research in health care, 2nd edn. London: BMJ
Publications, 2000: 15.17 Pope C, Britten N. The quality of rejection: barriers to qualitative methods in
the medical mindset. Paper presented at BSA Medical Sociology Group annualconference, September 1993.
HOW TO READ A PAPER
178
Chapter 12:Implementing evidencebased findings
12.1 Surfactants versus steroids: a case study inadopting evidence based practice
Health professionals’ failure to practise in accordance with thebest available evidence cannot be attributed entirely to ignorance orstubbornness. Consultant paediatrician Dr Vivienne van Somerenhas described an example that illustrates many of the additionalbarriers to getting research evidence into practice: the prevention ofneonatal respiratory distress syndrome in premature babies.1
It was discovered back in 1957 that babies born more than sixweeks early may get into severe breathing difficulties because of lackof a substance called surfactant (which lowers the surface tensionwithin the lung alveoli and reduces resistance to expansion) in theirlungs. Pharmaceutical companies began research in the 1960s todevelop an artificial surfactant that could be given to the infant toprevent the life threatening syndrome developing but it was not untilthe mid-1980s that an effective product was developed.
By the late 1980s a number of randomised trials had taken placeand a metaanalysis published in 1990 suggested that the benefits ofartificial surfactant greatly outweighed its risks. In 1990 a 6000patient trial (OSIRIS) was begun which involved almost all the majorneonatal intensive care units in the UK. The manufacturer wasawarded a product licence in 1990 and by 1993, practically everyeligible premature infant in the UK was receiving artificial surfactant.
Another treatment had also been shown a generation ago toprevent neonatal respiratory distress syndrome: administration of
179

the steroid drug dexamethasone to mothers in premature labour.Dexamethasone worked by accelerating the rate at which the fetallung reached maturity. Its efficacy had been demonstrated inexperimental animals in 1969 and in clinical trials on humans,published in the prestigious journal Pediatrics, as early as 1972.Yetdespite a significant beneficial effect being confirmed in a numberof further trials and a metaanalysis published in 1990, the take upof this technology was astonishingly slow. It was estimated in 1995that only 12–18% of eligible mothers currently received thistreatment in the USA.2
The quality of the evidence and the magnitude of the effect weresimilar for both these interventions.3, 4 Why were the paediatriciansso much quicker than the obstetricians at implementing anintervention which prevented avoidable deaths? Dr van Somerenhas considered a number of factors, listed in Table 12.1.1 The effectof artificial surfactant is virtually immediate and the doctoradministering it witnesses directly the “cure” of a terminally sickbaby. Pharmaceutical industry support for a large (and, arguably,scientifically unnecessary) trial ensured that few consultantpaediatricians appointed in the early 1990s would have escapedbeing introduced to the new technology.
In contrast, steroids, particularly for pregnant women, wereunfashionable and perceived by patients to be “bad for you”. Indoctors’ eyes, dexamethasone treatment was old hat for a host ofunglamorous diseases, notably cancer, and the scientificmechanism for its effect on fetal lungs was not readily understood.Most poignantly of all, an obstetrician would rarely get a chance towitness directly the life saving effect on an individual patient.
The above example is far from isolated. Effective health carestrategies frequently take years to catch on,5 even amongst theexperts who should be at the cutting edge of practice.6 It wouldappear that for a new technology to be adopted readily byindividual health professionals, a number of conditions must besatisfied. The evidence should be unequivocal and of high quality(preferably from large RCTs with well defined, clinically importantendpoints); the user of the technology must personally believe thatit is effective; he or she should have the opportunity to try out theintervention in controlled circumstances; possible adverse effects ofthe technology should be placed in proportion to the likelybenefits; and clinical conflicts of interest (for example, an
HOW TO READ A PAPER
180
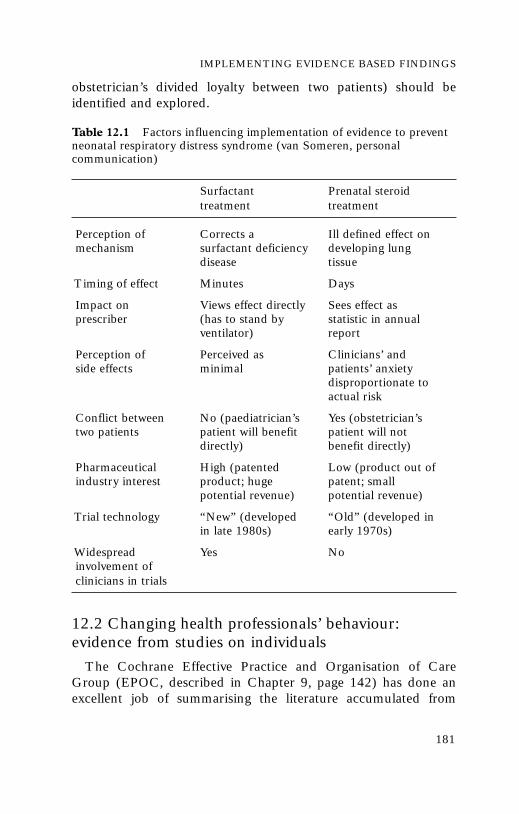
obstetrician’s divided loyalty between two patients) should beidentified and explored.
12.2 Changing health professionals’ behaviour:evidence from studies on individuals
The Cochrane Effective Practice and Organisation of CareGroup (EPOC, described in Chapter 9, page 142) has done anexcellent job of summarising the literature accumulated from
IMPLEMENTING EVIDENCE BASED FINDINGS
181
Surfactant Prenatal steroid treatment treatment
Perception of Corrects a Ill defined effect onmechanism surfactant deficiency developing lung
disease tissue
Timing of effect Minutes Days
Impact on Views effect directly Sees effect as prescriber (has to stand by statistic in annual
ventilator) report
Perception of Perceived as Clinicians’ and side effects minimal patients’ anxiety
disproportionate to actual risk
Conflict between No (paediatrician’s Yes (obstetrician’s two patients patient will benefit patient will not
directly) benefit directly)
Pharmaceutical High (patented Low (product out of industry interest product; huge patent; small
potential revenue) potential revenue)
Trial technology “New” (developed “Old” (developed in in late 1980s) early 1970s)
Widespread Yes Noinvolvement of clinicians in trials
Table 12.1 Factors influencing implementation of evidence to preventneonatal respiratory distress syndrome (van Someren, personalcommunication)

research trials on what is and is not effective in changingprofessional practice, both in promoting effective innovations andin encouraging professionals to resist “innovations” that areineffective or harmful. A major EPOC review was recentlypublished in an excellent book edited by Andy Haines and AnnaDonald.7 Its main findings were that:
• Consistently effective methods include educational outreach visits(academic detailing), reminders or prompts (manual orcomputerised) issued at the time of the consultation,multifaceted interventions (a “belt and braces” combination oftwo or more methods), and interactive educational meetings.
• Sometimes effective methods included audit and feedback (anysummary of clinical performance given back to individualclinicians), local opinion leaders (see below), and patientmediated interventions (such as information leaflets or patientheld prompts).
• Little or no effect was found with didactic educational meetings orthe distribution of printed guidelines.
The different individual methods are considered in more detailbelow.
Ineffective: didactic education
Until relatively recently, education (at least in relation to thetraining of doctors) was more or less synonymous with the didactictalk and chalk sessions that most of us remember from school andcollege. The “bums on seats” approach to postgraduate education(filling lecture theatres up with doctors or nurses and wheeling onan “expert” to impart pearls of wisdom) is relatively cheap andconvenient for the educators but is largely ineffective in producingsustained behaviour change in practice.8, 9 Indeed, one studydemonstrated that the number of reported CME (continuingmedical education) hours attended was inversely correlated withdoctors’ competence!10
Mostly effective: interactive, hands on education
Encouragingly, the most powerful drive to learn amongst healthprofessionals is probably not external sticks and carrots but thedesire to be more competent in treating patients.11 The major
HOW TO READ A PAPER
182

changes currently under way in medical and nursing education inthe UK (and many other countries) strongly support the use ofhands on methods structured around real clinical problems(“problem based learning”)12 and strategies to link professionals’learning with the needs of the service,13 improved teamwork,14 andorganisational development.15
Ineffective:“standard issue” guidelines and protocols
Another overview by EPOC supports the common senseimpression that producing and disseminating written guidelines,protocols, and policies does not generally change behaviour unlessaccompanied by other measures as well.16 The underlying reasonsfor the gap between evidence and practice have been fairly welldescribed,16–18 and include:
• lack of knowledge (the guideline or protocol remains unread ormisunderstood)
• lack of confidence (the clinician does not “believe in” therecommendation)
• fear of legal or patient pressure or loss of income
• lack of a physical skill (e.g. inability to inject a joint or operate viaan endoscope)
• inadequate resources (e.g. a limited budget for drug prescribing,non-availability of key equipment such as an MRI scanner)
• failure to remember to carry out a procedure or task, due topressure of work or old habits, which tend to die hard.
In one large study, the main factors associated with successfullyfollowing a guideline or protocol were the practitioner’s perceptionthat it was uncontroversial (68% compliance vs 35% if it wasperceived to be controversial), evidence based (71% vs 57% if not),contained explicit recommendations (67% vs 36% if therecommendations were vague), and required no change to existingroutines (67% vs 44% if a major change was recommended).17
Mostly effective: locally produced and owned protocols
The importance of ownership (i.e. the feeling of those being askedto play by new rules that they have been involved in drawing upthose rules) was emphasised in section 9.2 (see in particular Table9.1, page 142) in relation to clinical guidelines.There is an extensive
IMPLEMENTING EVIDENCE BASED FINDINGS
183

management theory literature to support the common sense notionthat professionals will oppose changes that they perceive asthreatening to their livelihood (i.e. income), self-esteem, sense ofcompetence or autonomy. It stands to reason, therefore, thatinvolving health professionals in setting the standards against whichthey are going to be judged generally produces greater changes inpatient outcomes than occur if they are not involved.18
Other studies have shown that nationally produced recommendations are more likely to be adopted locally if they areadapted to reflect local needs and priorities (for example, bydeleting sections not applicable locally and adding informationabout relevant local services) and made accessible (for example,via a wallchart or by inserting a summary in a widely usedhandbook such as a house officers’ formulary). The integration ofevidence based recommendations with the realities of localservices can often be successfully achieved via written,multiprofessional “care pathways” for particular conditions whichstate not only what intervention is needed at different stages in thecourse of the condition but also whose responsibility it is toundertake the task and to follow up if it gets missed.19, 20
Mostly effective: high quality decision support
There is a growing literature on the use of high technologystrategies such as computerised decision support systems thatincorporate the research evidence and can be accessed by the busypractitioner at the touch of a button. Dozens of these systems arecurrently being developed and since the last edition of this book, amajor systematic review has been published,21 which is summarisedin a book chapter by Paul Taylor and Jeremy Wyatt.22 Briefly, thereview found that overall, around two thirds of studies ofcomputerised decision support demonstrated improved performance, with the best results being in drug dosing and activeclinical care (for example, management of asthma) and the worstresults in diagnosis. An important criticism of decision supportsystems, however, is that the information on which their “advice” isbased may not necessarily be evidence based!22
Computerised “prompts” that appear during the consultation orat other crucial points in the decision making sequence are one ofthe most effective methods for achieving behaviour change. Butanecdotally, clinicians frequently complain that the computer systems
HOW TO READ A PAPER
184

they work with are cumbersome, address the wrong questions orprovide unworkable recommendations. As Taylor and Wyatt suggest,“Poor design and a failure to consider the practicalities of clinicalsettings have perhaps hindered the take up of decision supportsystems, but such systems could never be designed to fit seamlesslyinto existing ways of working”.22 In other words, given the evidence ofimproved patient care with good decision support systems, weclinicians should probably make more effort than we currently do toaccommodate them within our practice.
Sometimes effective: audit and feedback
Audit is a cycle of setting standards, measuring performance,changing practice to work towards the standard, and measuring thechange. Feedback consists of telling the physician how his or herperformance (for example, number of hysterectomies performed perhead of population, total cost of drugs prescribed per month, and soon) over time compares either with a group norm (such as the levelsachieved by fellow physicians) or with an external standard (such asexpert consensus). Studies in this area have been directed mainly atreducing the number of inappropriate diagnostic tests ordered byjunior doctors or improving drug prescribing in either generalpractice or hospitals.7
Most studies of clinical audit provide modest but undramaticevidence of improvement in clinician performance with this method23
but one wonders how much publication bias there is in this finding (Ipersonally would never publish an audit that showed I’d got worsedespite trying to improve!).The EPOC review is highly critical of thequality of the studies and hardly any of the primary studies publishedso far have measured the impact on patients.23
Studies of feedback to clinicians on their performance suggestthat this method is only effective in changing practice if:
• the health professional already accepts that his or her practiceneeds to change
• the health professional has the resources and authority toimplement the required changes
• the feedback is offered in “real time” (i.e. at the time when thepractice is being implemented) rather than retrospectively.7, 23
Both audit and feedback work better as part of a multifaceted
IMPLEMENTING EVIDENCE BASED FINDINGS
185

intervention, for example, when combined with an interactiveeducation programme.7
Sometimes effective: social influence strategies
One method of “education” which the pharmaceutical industryhas shown to be highly effective is one to one contact betweendoctors and company representatives (known in the USA asdetailers), whose influence on clinical behaviour may be sodramatic that they have been dubbed the “stealth bombers” ofmedicine.24 In the USA, this tactic has been harnessed by thegovernment in what is known as academic detailing: the educatorbooks in to see the physician in the same way as industryrepresentatives but in this case the “rep” provides objective,complete and comparative information about a range of differentdrugs and encourages the clinician to adopt a critical approach tothe evidence. Such a strategy can achieve dramatic short termchanges in practice25 but may be ineffective if the educator attendsonly briefly and fails to ascertain the perspective of the clinicianbefore attempting to influence it.26
Academic detailing is one example of a general behaviour changepolicy known as social influence, in which the practitioner ispersuaded that his or her current practice is out of step with that ofcolleagues or experts.27, 28 Social influence policies also include useof the mass media, processes where members of a group or networkinfluence one another,29 and those where local opinion leaders –officially defined as individuals nominated by their colleagues aseducationally influential – are used as a mouthpiece for policychange.30 A recent EPOC review confirms that such individuals areoften, but not always, effective in acting as the vehicle for evidencebased change in practice.31 A systematic review by Andy Oxmanand colleagues provides some overall support for social influencemethods but gives several examples of so-called social influencepolicies that, in reality, failed to influence.32
Sometimes effective: patient led strategies
One important method of initiating change in the behaviour ofhealth professionals is pressure from patients and the general public. Anumber of organisations now produce evidence based informationleaflets for patients; for example, the “Effectiveness matters” seriesbased on the Effective health care bulletin from the Centre for
HOW TO READ A PAPER
186

Reviews and Dissemination in York,33 the MIDIRS booklet Throughthe maze,34 which is based, among other sources, on the CochranePregnancy and Childbirth Database, or the leaflet by the charityDiabetes UK “What diabetic care to expect”.35 A number ofelectronic information aids on particular conditions are nowavailable either as interactive video discs36 or over the Internet37 butthe evidence that such tools can significantly improve theproportion of decisions that are evidence based (as opposed to justunderstood and agreed by the patient) is still in doubt.38
The power of informed patient choice can also be harnessedmore directively; for example, through the “prompted care” modelof diabetes care, where patients are sent a structured checklist oftasks (such as blood pressure monitoring and inspection of feet)every six months and advised to ask their doctor to complete it.39
For an overview of the patient’s perspective in evidence basedhealth care and examples of how the informed user can shape thebehaviour of professionals, see the chapter by Sandy Oliver andcolleagues38 and the book by Fulford and colleagues Essentialpractice in patient-centred care.40
Sometimes effective: rules and incentives
Administrative strategies for influencing clinicians’ behaviourinclude, at one extreme, changes in the law (for example, withdrawingthe product licence for a drug) or institutional policy (such as theimposition of a restricted formulary of drugs and equipment). Morecommonly, they involve introducing barriers to undesired practice(such as requiring the approval of a specialist when ordering certaintests) or reducing barriers to desired practice (such as altering orderforms to reflect the preferred dosing interval for antibiotics).41
Financial incentives may be set up to prompt health professionalsto perform more of a desired intervention (such as the UK “target”system for cervical smears by general practitioners42) or less of anundesired one (such as changing a fee for service remunerationpolicy for clinic doctors to a flat rate salary43).
Such strategies, however, may run counter to the philosophy ofinvolving professionals in setting standards and gaining theirownership of the changes. In addition, whilst the evidence thatadministrative and financial strategies achieve changes in behaviouris strong, these changes may generate much resented “hassle” andare not always translated into desired patient outcomes.7 A
IMPLEMENTING EVIDENCE BASED FINDINGS
187

restrictive policy to minimise “unnecessary” drug prescribing inthe elderly, for example, achieved its limited objective of reducingexpenditure on medication but was associated with increased ratesof admission to nursing homes.44 This illustrates the importantpoint that implementing evidence based practice is not an all ornone, unidimensional achievement, as I have argued elsewhere.45
In summary, there is no shortage of strategies for changing thebehaviour of health professionals, an increasing number of whichhave now been rigorously evaluated. As Oxman and colleaguesconcluded after reviewing 102 published studies on different waysto influence the behaviour of clinicians, “There are no ‘magicbullets’ for improving the quality of health care, but there is a widerange of interventions available that, if used appropriately, couldlead to important improvements in professional practice andpatient outcomes.”32 Although many new studies and systematicreviews have been published since Oxman penned these words,they still reflect the gist of the evidence on this fascinating topic.
12.3 Managing change for effective clinical practice:evidence from studies on organisational change
A number of projects in the UK have looked systematically at theimplementation of evidence based findings in health careorganisations. These include:
• GRiPP (Getting Research into Practice and Purchasing), led bythe Anglia and Oxford Regional Health Authority46
• PACE (Promoting Action on Clinical Effectiveness), led by theKing’s Fund47
• PLIP (Purchaser Led Implementation Projects), led by theNorth Thames Regional Office.48
All these projects were founded on the view that it was notsensible to rely on one course of action – such as producing a set ofclinical guidelines – but rather that the overall process had to bemanaged using a wide variety of ways and means includingincentives, educational programmes, academic detailing, localguidelines development, and so on. A number of separate projectswere initiated through these overall programmes. GRiPP includedthe use of steroids in preterm delivery, the management of services
HOW TO READ A PAPER
188

for stroke patients, the use of dilatation and curettage (D & C) inwomen with heavy periods, and insertion of grommets into childrenwith glue ear.The 12 PACE projects included initiatives to improvehypertension management by GPs and leg ulcer care within anacute hospital. The PLIP projects were similarly topic basedinitiatives, including promoting secondary prevention of coronaryheart disease in primary care and introduction of guidelines for theeradication of the ulcer causing bacterium H. pylori.
The lessons in Boxes 12.1 (from GRiPP), 12.2 (from PACE) and12.3 (from PLIP) were the result of a rigorous evaluation processundertaken by the different participating groups.47–49
12.4 The evidence based organisation: a question ofculture
A publication by the UK National Association of HealthAuthorities and Trusts (NAHAT) entitled “Acting on theevidence” observes that:
IMPLEMENTING EVIDENCE BASED FINDINGS
189
Box 12.1 Lessons from the GRiPP (Getting Researchinto Practice and Purchasing) project49
1. Prerequisites for implementing changes in clinical practice arenationally available research evidence and clear, robust and localjustification for change.
2. There should be consultation and involvement of all interestedparties, led by a respected product champion.
3. The knock-on effect of change in one sector (e.g. acute services)onto others (e.g. general practice or community care) should beaddressed.
4. Information about current practice and the effect of changeneeds to be available.
5. Relationships between purchasers and providers need to be good.6. Contracts (e.g. between purchasers and providers) are best used
to summarise agreement that has already been negotiatedelsewhere, not to table points for discussion.
7. Implementing evidence may not save money.8. Implementing evidence takes more time than is usually anticipated.

“However hard the organisations responsible for producing . . .effectiveness information try, they cannot change practice themselves.Only health authorities and trusts, and the managers and clinicians whowork within them, have the power (and the responsibility) to translatethe evidence into real, meaningful and lasting improvements in patientcare.”49
HOW TO READ A PAPER
190
Box 12.2 Barriers to change identified in the PACE(Promoting Action on Clinical Effectiveness) projects47
1. Lack of perception of relevance. Practitioners believe there is noneed to change and/or that their practice is already evidencebased.
2. Lack of resources. Stakeholders feel they do not have the time ormoney to become involved.
3. Short term outlook. Stakeholders are driven by short termincentives, e.g. an annual contracting round, which may conflictwith the timescale needed for effecting change.
4. Conflicting priorities. Stakeholders have other demands on theirenergies, such as reducing waiting lists or dealing with specificcomplaints.
5. Difficulty in measuring outcomes. Health outcomes are notoriouslydifficult to measure, yet many stakeholders mistakenly seek tomeasure the success of the project in terms of bottom line healthgains.
6. Lack of necessary skills. Unfamiliar skills may be needed foreffective clinical practice, such as those for searching and criticalappraisal of research.
7. No history of multidisciplinary working. Members of differentdisciplines may not be used to working together in acollaborative fashion.
8. Inadequate or ambiguous evidence. If the validity or relevance ofthe research literature itself is open to question, change will(perhaps rightly) be more difficult to achieve.
9. Perverse incentives. Stakeholders may be pulled in a differentdirection from that required for clinical effectiveness, e.g. by adrug company “research” project or because of an outdated itemof service payment scheme.
10. Intensity of contribution required. Changing practice requires a lotof enthusiasm, hard work, and long term vision on the part ofthe project leaders.

IMPLEMENTING EVIDENCE BASED FINDINGS
191
Box 12.3 Lessons from PLIP (Purchaser LedImplementation Projects)48
1. Find organisations and individuals that are ready. The “soil” must befertile for the seeds to germinate. Much effort will be wasted, andproject workers will become demoralised, if organisations areoffered an idea whose time has not yet come.
2. Pick a good topic. The ideal topic for a change programme is locallyrelevant, based on sound evidence, and able to demonstratetangible benefits in a short time.
3. Appoint the right project worker and give them protected time. Drive,personality, motivation, enthusiasm, and non-threatening style arenecessary (but not sufficient) characteristics for success. Anoverworked project worker with conflicting demands on their timeand a limited contract is likely to get distracted and start lookingfor another job.
4. Locate the project worker within the sphere you want to influence. If theproject is located, for example, in primary care, the project workerneeds to be based there. Being seen to be independent ofstatutory bodies and commercial companies can add credibilityand increase goodwill.
5. Build on existing structures and systems. If bodies (such as auditadvisory groups or educational consortia) already exist and arearranging events, plug into these rather than setting up a separateprogramme.
6. Get key stakeholders on board. Genuine commitment from the“movers and shakers”, including funders, opinion leaders, andthose in “political” positions, is crucial.
7. Engage in a constant process of review. Taking time out to reflect onquestions such as “What worked?” “What didn’t?” “What have welearnt?”, “Where do we go now?”, “What would happen if we doX?” and so on is difficult but greatly helps to keep the project onthe road.
8. Tailor your approach. Flexibility and responsiveness are particularlyimportant when things seem to be going badly; for example, whenpeople say they have insufficient time or resources to deliver on atask. Think of ways of doing things differently, extend deadlines,compromise on the task, offer an extra pair of hands, and so on.
9. Promote teamwork. If a project rests entirely on the enthusiasm of akey individual, it will almost certainly flounder when thatindividual moves on. Getting at least two people to takeresponsibility, and building a wider team who know and careabout the project, will help ensure sustainability.

The report recognises that the task of educating and empoweringmanagers and clinical professionals to use evidence as part of theireveryday decision making is massive and offers advice for anyorganisation wishing to promote the principles of evidence basedpractice. An action checklist for health care organisations workingtowards an evidence based culture for clinical and purchasingdecisions, listed at the end of Appendix 1, is reproduced from theNAHAT report.49
First and foremost, key players within the organisation,particularly chief executives, board members, and senior clinicians,must create an evidence based culture where decision making isexpected to be based on the best available evidence. High quality, upto date information sources (such as the Cochrane electroniclibrary and the Medline database) should be available in everyoffice and staff given protected time to access them. Ideally, usersshould only have to deal with a single access point for all availablesources. Information on the clinical and cost effectiveness ofparticular technologies should be produced, disseminated andused together. Individuals who collate and disseminate thisinformation within the organisation need to be aware of who willuse it and how it will be applied and tailor their presentationaccordingly. They should also set standards for, and evaluate, thequality of the evidence they are circulating.
Individuals on the organisation’s internal mailing list foreffectiveness information need training and support if they are tomake the best use of this information. The projects described insection 12.3 provided important practical lessons, but there ismuch still to learn about the practicalities of implementingevidence within large (and small) organisations. As the NAHATreport emphasises, separately funded pilot projects on specificclinical issues such as those in GRiPP, PACE or PLIP are useful fordemonstrating that change is possible and offering on the jobtraining in implementing evidence, but health authorities andtrusts must now move on from this experimental phase and worktowards a culture in which clinical and cost effectiveness are partof the routine dialogue between purchasers and providers, andbetween managers and clinicians.
But changing organisational culture is no simple task. One keystep is to create an environment in which the enthusiasm andexpertise of the change agents can be harnessed rather than stifled
HOW TO READ A PAPER
192

in the organisation as a whole. As Davies and Nutley have pointedout, “Learning is something achieved by individuals, but ‘learningorganisations’ can configure themselves to maximise, mobilise, andretain this learning potential”.50 Drawing on the work of Senge,51
they offer five key features of a learning organisation.
1. Encouragement to move beyond traditional professional ordepartmental boundaries (an approach Senge called “opensystems thinking”).
2. Attention to individuals’ personal learning needs.
3. Learning in teams, since it is largely through teams thatorganisations achieve their objectives.
4. Changing the way people conceptualise issues, hence allowingnew, creative approaches to old problems.
5. A shared vision with coherent values and clear strategic direction,so that staff willingly pull together towards a common goal.
12.5 Theories of change
So much of the literature on implementing evidence in the realworld of clinical practice is in the form of practical checklists or the“Ten tips for success” type format. Checklists and tips, as you cansee from Boxes 12.1, 12.2 and 12.3 and Appendix 1, can beenormously useful, but such lists can leave you hungry for somecoherent conceptual models on which to hang your own real lifeexperiences, especially since, as the other chapters in this booksuggest, the messages of evidence based medicine are themselvesfounded on a highly coherent (some would argue too coherent!)underpinning theory. As a conference delegate once said to me,“We need a Dave Sackett of change management”.
But the management literature offers not one but several dozendifferent conceptual frameworks for looking at change, leaving thenon-expert confused about where to start. It was my attempt tomake sense of this multiplicity of theories that led me to write aseries of six articles published recently in the British Journal ofGeneral Practice and entitled “Theories of change”. In thesearticles, I explored six different models of professional andorganisational change in relation to effective clinical practice.
IMPLEMENTING EVIDENCE BASED FINDINGS
193

1. Adult learning theory – the notion that adults learn via a cycle ofthinking and doing.This explains why instructional education is soconsistently ineffective (see p 182) and why hands on practicalexperience with the opportunity to reflect and discuss withcolleagues is the fundamental basis for both learning and change.52
2. Psychoanalytic theory – Freud’s famous concept of theunconscious, which influences (and sometimes overrides) ourconscious, rational self. People’s resistance to change can some-times have powerful and deeprooted emotional explanations.53
3. Group relations theory – based on studies by specialists atLondon’s Tavistock Clinic on how teams operate (or fail tooperate) in the work environment. Relationships both withinthe team and between the team and its wider environment canact as barriers to (or catalysts of) change.54
4. Anthropological theory – the notion that organisations havecultures, i.e. ways of doing things and of thinking aboutproblems that are, in general, highly resistant to change. Arelatively minor proposed change towards evidence basedpractice (such as requiring consultants to look up evidenceroutinely on the Cochrane database) may in reality be highlythreatening to the culture of the organisation (in which, forexample, the “consultant opinion” has traditionally carried analmost priestly status).55
5. Organisational strategy – the notion that “mainstreaming” a changewithin an organisation requires more than one person’s desire forit to happen. The vision for change must be shared amongst acritical mass of staff and must usually be accompanied bysystematic changes to the visible structures of the organisation, tothe roles and responsibilities of key individuals, and to informationand communication systems.56
6. Complexity theory – the notion that large organisations (such as theUK National Health Service) depend crucially on the dynamic,evolving, and local relationships and communication systemsbetween individuals. Supporting key interpersonal relationshipsand improving the quality and timeliness of information availablelocally are often more crucial factors in achieving sustainedchange than “top down” directives or overarching national orregional programmes.57
HOW TO READ A PAPER
194

I am not alone in my search for useful theories to explain andpromote change. One of the problems in the “instructional” approachto professional behaviour change is the assumption that peoplebehave in a particular way because (and only because) they lackknowledge and that imparting knowledge will therefore changebehaviour. Theresa Marteau and colleagues’ short and authoritativecritique shows that this model has neither theoretical coherence norempirical support.58 Information, they conclude, may be necessary forprofessional behaviour change but it is rarely if ever sufficient.Psychological theories that might inform the design of more effectiveeducational strategies, suggest Marteau and colleagues, include:
• behavioural learning – the notion that behaviour is more likely tobe repeated if it is associated with rewards and less likely if it ispunished
• social cognition – when planning an action, individuals askthemselves “Is it worth the cost?”, “What do other people thinkabout this?” and “Am I capable of achieving it?”
• stages of change models – in which all individuals are considered tolie somewhere on a continuum of readiness to change from noawareness that there is a need to change through to sustainedimplementation of the desired behaviour.58
There are, as I have said, many additional theories that might comein useful when identifying barriers and bridges to achieving bestclinical practice. The most important advice might be “Don’t try toexplain or predict a complex universe using only one of them!”.
12.6 Priorities for further research on theimplementation process
Following the success of GRiPP, the UK Department of Healthidentified further studies into the implementation of evidencebased policy as a major spoke of its research and developmentstrategy59 and made training in research methodology a statutoryrequirement for all doctors undergoing higher professionaltraining.60 The 20 priority areas in which new research proposalswere specifically invited by the NHS Central Research andDevelopment Committee include the following questions.61
• Who are the players in the implementation process? Research is
IMPLEMENTING EVIDENCE BASED FINDINGS
195

needed to examine the relative roles of individuals, professionals,purchasers, providers, the public, the media, commercialorganisations, and policymakers in the implementation process.
• What are the levers of change and barriers to change? Researchcould investigate the effectiveness in achieving change ofcontracts (as used in the UK internal market), financialincentives, professional and regulatory pressures, organisationalincentives and disincentives, and structural issues.
• What interventions can be used to bring about change? A range ofinterventions could be explored, including the use of guidelines,clinical audit, feedback, outreach visits, consensus buildingprocesses, opinion leaders, patient pressures, process redesign,and decision support or reminder systems.
• How does the nature of the evidence affect the implementation process?Additional studies are required into the nature of the evidenceunderlying current and proposed clinical practices, theavailability, strength, and relevance of RCT evidence, the use ofobservational information, qualitative data, and other non-RCTevidence, the integration of evidence from disparate sources, andthe transfer of evidence from one setting to another.
Studies to address these issues are currently ongoing in the UK.
1 Van Someren V. Changing clinical practice in the light of the evidence: twocontrasting stories from perinatology. In: Haines A, Donald A, eds. Gettingresearch findings into practice. London: BMJ Publications, 1998: 143–51.
2 Anonymous. Effect of corticosteroids for fetal maturation on perinataloutcomes. NIH Consensus Development Panel on the Effect of Corticosteroidsfor Fetal Maturation on Perinatal Outcomes. JAMA 1995; 273: 413–8.
3 Crowley P. Corticosteroids prior to preterm delivery (updated January 1996).Cochrane Database of Systematic Reviews. London: BMJ Publications, 1996.
4 Halliday HL. Overview of clinical trials comparing natural and syntheticsurfactants. Biol Neonate 1995; 67 (suppl 1): 32–47.
5 Haines A, Donald A. Looking forward: getting research findings into practice:making better use of research findings. BMJ 1998; 317: 72–5.
6 Antmann EM, Lau J, Kupelnick B et al. A comparison of the results of meta-analyses of randomised controlled trials and recommendations of clinicalexperts. JAMA 1992; 268: 240–8.
7 Bero L, Grilli R, Grimshaw J, Harvey E, Oxman A, Thomson MA. Closing thegap between research and practice. In: Haines A, Donald A, eds. Getting researchfindings into practice. London: BMJ Publications, 1998: 27–35.
8 Davis DA, Thomson MA, Oxman AD. Changing physician performance: asystematic review of the effect of CME strategies. JAMA 1995; 274: 700–5.
HOW TO READ A PAPER
196

9 Stanton F, Grant J. The effectiveness of continuing professional development.London: Joint Centre for Medical Education, Open University, 1997.
10 Caulford PG, Lamb SB, Kaigas TB, Hanna E, Norman GR, Davis DA.Physician incompetence: specific problems and predictors. Acad Med 1993; 270(suppl): 16–18.
11 Fox RD. Changing and learning in the lives of physicians. New York: Praeger, 1989.12 Vernon DT, Blake RL. Does problem-based learning work? A meta-analysis of
evaluative research. Acad Med 1993; 68: 550–63.13 Bashook PG, Parboosingh J. Continuing medical education: recertification and
the maintenance of competence. BMJ 1998; 316: 545–8.14 Elwyn G. Professional and practice development plans for primary care teams.
BMJ 1998; 316: 1619–20. See also ensuing correspondence in BMJ 1998; 317:1454–5.
15 Koeck C. Time for organisational development in healthcare organisations.BMJ 1998; 317: 1267–8.
16 Freemantle N, Harvey EL, Wolf F, Grimshaw JM, Grilli R, Bero LA. Printededucational materials: effects on professional practice and health careoutcomes. In: The Cochrane Library, Issue 1. Oxford: Update Software, 2000.
17 Grol R, Dalhuijsen J, Thomas S, Veld C, Rutten G, Mokkink H. Attributes ofclinical guidelines that influence use in general practice: observational study.BMJ 1998; 317: 858–61.
18 Report from General Practice 26. The development and implementation of clinicalguidelines. London: Royal College of General Practitioners, 1995.
19 Robins A, Gallagher A, Rossiter MA, Lloyd BW. Evaluation of joint medical andnursing notes with pre-printed prompts. Qual Health Care 1997; 6: 192–3.
20 Riley K. Care pathways: paving the way. Health Services J 1998; 26/3/98: 30–1.21 Hunt DL, Haynes RB, Hanna SE, Smith K. Effects of computer-based clinical
decision support systems on physician performance and patient outcomes: asystematic review. JAMA 1998; 280: 1339–46.
22 Taylor P,Wyatt J. Decision support. In: Haines A, Donald A, eds. Getting researchfindings into practice. London: BMJ Publications 1998: 86–98.
23 Thompson O’Brien MA, Oxman AD, Davis DA, Haynes RB, Freemantle N,Harvey EL. Audit and feedback: effects on professional practice and health careoutcomes. In: The Cochrane Library, Issue 1. Oxford: Update Software, 2000.
24 Shaughnessy AF, Slawson DC. Pharmaceutical representatives. BMJ 1996; 312:1494–5.
25 Avorn J, Soumerai SB. A new approach to reducing suboptimal drug use.JAMA 1983; 250: 1728–32.
26 Ray WA. Reducing antipsychotic drug prescribing for nursing-home patients: acontrolled trial of the effect of an educational visit. Am J Pub Health 1987; 77:1448–50.
27 Wyatt J, Paterson-Brown S, Johanson R, Altman DG, Bradburn M, Fisk N.Trialof outreach visits to enhance use of systematic reviews in 25 obstetric units.BMJ 1998; 317: 1041–6.
28 Thompson O’Brien MA, Oxman AD, Haynes RB, Davis DA, Freemantle N,Harvey EL. Educational outreach visits: effects on professional practice andhealth care outcomes. In: The Cochrane Library, Issue 1. Oxford: UpdateSoftware, 2000.
29 Barnes RD, Bell S. Interpractice visits by general practitioners. Aust FamPhysician 1994; 23: 1922–8.
30 Lomas J, Enkin M, Anderson GM, Hannah WJ, Vadya E, Singer J. Opinionleaders vs audit and feedback to implement practice guidelines: delivery afterprevious cesarean section. JAMA 1991; 265: 2202–7.
IMPLEMENTING EVIDENCE BASED FINDINGS
197

31 Thompson O’Brien MA, Oxman AD, Haynes RB, Davis DA, Freemantle N,Harvey EL. Local opinion leaders: effects on professional practice and health careoutcomes. In: The Cochrane Library, Issue 1. Oxford: Update Software, 2000.
32 Oxman A, Davis D, Haynes RB, Thomson MA. No magic bullets: a systematicreview of 102 trials of interventions to help health professionals deliver servicesmore effectively or efficiently. Can Med Assoc J 1995; 153: 1423–43.
33 Effective Health Care Bulletins. Published by Universities of Leeds and York.Nuffield Institute for Health, 71-75 Clarendon Rd, Leeds LS2 9PL.
34 National Childbirth Trust, King’s Fund. Through the maze: a comprehensive guideto sources of research-based information on pregnancy, birth and post-natal care.Obtainable from the National Childbirth Trust, Alexandra House, OldhamTerrace, Acton, London W3 6HN, price £3.Website http://www.nct-online.org.
35 British Diabetic Association. What diabetic care to expect. Obtainable fromBritish Diabetic Association, 10 Queen Anne St, London WC1.
36 Kasper J, Mulley A, Wennberg J. Developing shared decision-makingprogrammes to improve the quality of health care. Qual Rev Bull 1992; 18:182–90.
37 Coiera E. The Internet’s challenge to health care provision. BMJ 1996; 312:3–4.
38 Oliver S, Entwhistle V, Hodnett E. Roles for lay people in the implementationof health care research. In: Haines A, Donald A, eds. Getting research findings intopractice. London: BMJ Publications 1998: 43–51.
39 Hurwitz B, Goodman C,Yudkin J. Prompting the care of non-insulin dependent(type II) diabetic patients in an inner city area: one model of community care.BMJ 1993; 306: 624–30.
40 Fulford KWM, Ersser S, Hope T. Essential practice in patient-centred care.Oxford: Blackwell Science, 1996.
41 Avorn J, Soumerai SB,Taylor W,Wessels MR, Janousek J,Weiner M. Reductionof incorrect antibiotic dosing through a structured educational order form. ArchIntern Med 1988; 148: 1720–4.
42 Ridsdale L. evidence based general practice: a critical reader. London: WBSaunders, 1995: 59–76.
43 Hickson GB, Altemeier WA, Perrin JM. Physician reimbursement by salary orfee-for-service: effect on physician practice behaviour in a randomisedprospective trial. Pediatrics 1987; 80: 344–50.
44 Soumerai SB, Ross-Degnan D, Avorn J, McLaughlin TJ, Choodnovskiy I.Effects of Medicaid drug-payment limits on admission to hospitals and nursinghomes. New Engl J Med 1991; 325: 1072–7.
45 Greenhalgh T. “Is my practice evidence based?” (editorial) BMJ 1996; 313:957–8.
46 Dunning M, McQuay H, Milne R. Getting a GRiPP. Health Services J 1994;104: 18–20.
47 Dunning M, Abi-aad G, Gilbert D, Gillam S, Livett H. Turning evidence intoeveryday practice. London: King’s Fund, 1999.
48 Evans D, Haines A, eds. Implementing evidence based changes in healthcare.Oxford: Radcliffe Medical Press, 2000.
49 Appleby J, Walshe K, Ham C. Acting on the evidence: a review of clinicaleffectiveness: sources of information, dissemination and implementation. Birmingham:NAHAT, 1995.
50 Davies HTO, Nutley SM. Developing learning organisations in the new NHS.BMJ 2000; 320: 998–1001.
51 Senge P. The fifth discipline: the art and practice of the learning organisation. NewYork: Doubleday, 1994.
HOW TO READ A PAPER
198

52 Greenhalgh T. Change and the individual 1: adult learning theory. Br J GenPract 2000; 50: 76–7.
53 Greenhalgh T. Change and the individual 2: psychoanalytic theory. Br J GenPract 2000; 50:164–5.
54 Greenhalgh T. Change and the team: group relations theory. Br J Gen Pract2000; 50: 252–3.
55 Greenhalgh T. Change and the organisation 1: culture and context. Br J GenPract 2000; 50: 340–1.
56 Greenhalgh T. Change and the organisation 2: strategy. Br J Gen Pract 2000; 50:424–5.
57 Greenhalgh T. Change and complexity: the rich picture. Br J Gen Pract 2000;50: 514–15.
58 Marteau T, Snowden A, Armstrong D. Implementing research findings inpractice: beyond the information deficit model. In: Haines A, Donald A, eds.Getting research findings into practice. London: BMJ Publications, 1998: 36–42
59 Department of Health. Research for health. London: HMSO, 1993.60 Research and Development Task Force. Supporting research and development in
the NHS (Culyer Report). London: HMSO, 1994.61 Advisory Group to the NHS Central Research and Development Committee.
An agenda for the evaluation of methods to promote the implementation of researchfindings in the NHS. Leeds: Department of Health, 1995.
IMPLEMENTING EVIDENCE BASED FINDINGS
199

Appendix 1: Checklistsfor finding, appraising,and implementingevidence
Unless otherwise stated, these checklists can be applied torandomised controlled trials, other controlled clinical trials, cohortstudies, case-control studies or any other research evidence.
Is my practice evidence based? A context sensitivechecklist for individual clinical encounters (see Chapter 1)
1. Have I identified and prioritised the clinical, psychological, social,and other problem(s), taking into account the patient’s perspective?
2. Have I performed a sufficiently competent and completeexamination to establish the likelihood of competing diagnoses?
3. Have I considered additional problems and risk factors whichmay need opportunistic attention?
4. Have I, where necessary, sought evidence (from systematicreviews, guidelines, clinical trials, and other sources) pertainingto the problems?
5. Have I assessed and taken into account the completeness,quality, and strength of the evidence?
6. Have I applied valid and relevant evidence to this particular setof problems in a way that is both scientifically justified andintuitively sensible?
200

7. Have I presented the pros and cons of different options to thepatient in a way they can understand, and incorporated thepatient’s utilities into the final recommendation?
8. Have I arranged review, recall, referral or other further care asnecessary?
Checklist for searching Medline or the Cochranelibrary (see Chapter 2)1. To look for an article you know exists, search by textwords (in
title, abstract or both) or use field suffixes for author, title,institution, journal, and publication year.
2. For a maximally sensitive search on a subject, search under bothMeSH headings (exploded) and textwords (title and abstract),then combine the two using the Boolean operator “or”.
3. For a focused (specific) search on a clear-cut topic, performtwo or more sensitive searches as in (2), and combine themusing the Boolean operator “and”.
4. To find articles which are likely to be of high methodologicalquality, insert an evidence based qualifying string fortherapeutic interventions, aetiology, diagnostic procedures orepidemiology (see Appendix 2) and/or use maximally sensitivesearch strategies for randomised trials, systematic reviews, andmeta-analyses (see Appendix 3).
5. Refine your search as you go along. For example, to excludeirrelevant material, use the Boolean operator “not”.
6. Use subheadings only when this is the only practicable way oflimiting your search, since manual indexers are fallible andmisclassifications are common.
7. When limiting a large set, browse through the last 50 or soabstracts yourself rather than expecting the software to pick thebest half dozen.
Checklist to determine what a paper is about (see Chapter 3)
1. Why was the study done (what clinical question did it address)?
2. What type of study was done?
APPENDIX 1
201

• Primary research (experiment, randomised controlled trial,other controlled clinical trial, cohort study, case-controlstudy, cross-sectional survey, longitudinal survey, case reportor case series)?
• Secondary research (simple overview, systematic review,metaanalysis, decision analysis, guideline development,economic analysis)?
3. Was the study design appropriate to the broad field of researchaddressed (therapy, diagnosis, screening, prognosis, causation)?
4. Was the study ethical?
Checklist for the methods section of a paper (see Chapter 4)
1. Was the study original?
2. Who is the study about?
• How were subjects recruited?
• Who was included in, and who was excluded from, the study?
• Were the subjects studied in “real life” circumstances?
3. Was the design of the study sensible?
• What intervention or other manoeuvre was being considered?
• What outcome(s) were measured, and how?
4. Was the study adequately controlled?
• If a “randomised trial”, was randomisation truly random?
• If a cohort, case-control or other non-randomisedcomparative study, were the controls appropriate?
• Were the groups comparable in all important aspects exceptfor the variable being studied?
• Was assessment of outcome (or, in a case-control study,allocation of caseness) “blind”?
5. Was the study large enough, and continued for long enough, andwas follow-up complete enough, to make the results credible?
HOW TO READ A PAPER
202

Checklist for the statistical aspects of a paper (see Chapter 5)
1. Have the authors set the scene correctly?
• Have they determined whether their groups are comparableand, if necessary, adjusted for baseline differences?
• What sort of data have they got and have they usedappropriate statistical tests?
• If the statistical tests in the paper are obscure, why have theauthors chosen to use them?
• Have the data been analysed according to the original studyprotocol?
2. Paired data, tails, and outliers
• Were paired tests performed on paired data?
• Was a two tailed test performed whenever the effect of anintervention could conceivably be a negative one?
• Were outliers analysed with both common sense andappropriate statistical adjustments?
3. Correlation, regression, and causation
• Has correlation been distinguished from regression and hasthe correlation coefficient (“r value”) been calculated andinterpreted correctly?
• Have assumptions been made about the nature and directionof causality?
4. Probability and confidence
• Have “p values” been calculated and interpreted appropriately?
• Have confidence intervals been calculated and do the authors’conclusions reflect them?
5. Have the authors expressed their results in terms of the likelyharm or benefit which an individual patient can expect, such as:
• relative risk reduction?
• absolute risk reduction?
• number needed to treat?
• odds ratio?
APPENDIX 1
203

Checklist for material provided by a pharmaceuticalcompany representative (see Chapter 6)
1. Does this material cover a subject which interests me and isclinically important in my practice?
2. Has this material been published in independent peer reviewedjournals? Has any significant evidence been omitted from thispresentation or withheld from publication?
3. Does the material include high level evidence such assystematic reviews, meta-analyses or double blind randomisedcontrolled trials against the drug’s closest competitor given atoptimal dosage?
4. Have the trials or reviews addressed a clearly focused,important and answerable clinical question which reflects aproblem of relevance to patients? Do they provide evidence onsafety, tolerability, efficacy, and price?
5. Has each trial or metaanalysis defined the condition to betreated, the patients to be included, the interventions to becompared, and the outcomes to be examined?
6. Does the material provide direct evidence that the drug willhelp my patients live a longer, healthier, more productive, andsymptom-free life?
7. If a surrogate outcome measure has been used, what is theevidence that it is reliable, reproducible, sensitive, specific, atrue predictor of disease, and rapidly reflects the response totherapy?
8. Do trial results indicate whether (and how) the effectiveness ofthe treatments differed and whether there was a difference inthe type or frequency of adverse reactions? Are the resultsexpressed in terms of numbers needed to treat and are theyclinically as well as statistically significant?
9. If large amounts of material have been provided by therepresentative, which three papers provide the strongestevidence for the company’s claims?
HOW TO READ A PAPER
204

Checklist for a paper which claims to validate adiagnostic or screening test (see Chapter 7)
1. Is this test potentially relevant to my practice?
2. Has the test been compared with a true gold standard?
3. Did this validation study include an appropriate spectrum ofsubjects?
4. Has work up bias been avoided?
5. Has observer bias been avoided?
6. Was the test shown to be reproducible both within and betweenobservers?
7. What are the features of the test as derived from this validationstudy?
8. Were confidence intervals given for sensitivity, specificity, andother features of the test?
9. Has a sensible “normal range” been derived from these results?
10. Has this test been placed in the context of other potential testsin the diagnostic sequence for the condition?
Checklist for a systematic review or metaanalysis (see Chapter 8)
1. Did the review address an important clinical question?
2. Was a thorough search done of the appropriate database(s) andwere other potentially important sources explored?
3. Was methodological quality assessed and the trials weightedaccordingly?
4. How sensitive are the results to the way the review has been done?
5. Have the numerical results been interpreted with commonsense and due regard to the broader aspects of the problem?
APPENDIX 1
205

Checklist for a set of clinical guidelines (see Chapter 9)
1. Did the preparation and publication of these guidelines involvea significant conflict of interest?
2. Are the guidelines concerned with an appropriate topic and dothey state clearly the goal of ideal treatment in terms of healthand/or cost outcome?
3. Was the guideline development panel headed by a leadingexpert in the field (ideally it should not be) and was a specialistin the methodology of secondary research (e.g. metaanalyst,health economist) involved?
4. Have all the relevant data been scrutinised and do theguidelines’ conclusions appear to be in keeping with the data?
5. Do they address variations in medical practice and othercontroversial areas (e.g. optimum care in response to genuineor perceived underfunding)?
6. Are the guidelines valid and reliable?
7. Are they clinically relevant, comprehensive, and flexible?
8. Do they take into account what is acceptable to, affordable by,and practically possible for patients?
9. Do they include recommendations for their own dissemination,implementation, and periodic review?
Checklist for an economic analysis (see Chapter 10)
1. Is the analysis based on a study which answers a clearly definedclinical question about an economically important issue?
2. Whose viewpoint are costs and benefits being considered from?
3. Have the interventions being compared been shown to beclinically effective?
4. Are the interventions sensible and workable in the settingswhere they are likely to be applied?
5. Which method of economic analysis was used and was thisappropriate?
HOW TO READ A PAPER
206

• If the interventions produced identical outcomes ➯ costminimisation analysis
• If the important outcome is unidimensional ➯ costeffectiveness analysis
• If the important outcome is multidimensional ➯ cost utilityanalysis
• If the cost–benefit equation for this condition needs to becompared with cost–benefit equations for different conditions➯ cost benefit analysis
• If a cost benefit analysis would otherwise be appropriate butthe preference values given to different health states aredisputed or likely to change ➯ cost consequences analysis
6. How were costs and benefits measured?
7. Were incremental, rather than absolute, benefits compared?
8. Was health status in the “here and now” given precedence overhealth status in the distant future?
9. Was a sensitivity analysis performed?
10. Were “bottom line” aggregate scores overused?
Checklist for a qualitative research paper (see Chapter 11)
1. Did the article describe an important clinical problemaddressed via a clearly formulated question?
2. Was a qualitative approach appropriate?
3. How were (a) the setting and (b) the subjects selected?
4. What was the researcher’s perspective and has this been takeninto account?
5. What methods did the researcher use for collecting data andare these described in enough detail?
6. What methods did the researcher use to analyse the data andwhat quality control measures were implemented?
7. Are the results credible and, if so, are they clinically important?
APPENDIX 1
207

8. What conclusions were drawn and are they justified by theresults?
9. Are the findings of the study transferable to other clinicalsettings?
Checklist for health care organisations workingtowards an evidence based culture for clinical andpurchasing decisions (see Chapter 12)
1. Leadership. How often has effectiveness information orevidence based medicine been discussed at board meetings inthe last 12 months? Has the board taken time out to learnabout developments in clinical and cost effectiveness?
2. Investment. What resources is the organisation investing infinding and using clinical effectiveness information? Is there aplanned approach to promoting evidence based medicinewhich is properly resourced and staffed?
3. Using available resources. What action has been taken by theorganisation in response to official directives requiringorganisational support for evidence based practice? What haschanged in the organisation as a result?
4. Implementation.Who is responsible for receiving, acting on, andmonitoring the implementation of Effective Health Carebulletins? What action has been taken on each of the bulletinsissued to date?
5. Clinical guidelines. Who is responsible for receiving, acting on,and monitoring clinical practice guidelines? Do thosearrangements ensure that both managers and clinicians playtheir part in guideline development and implementation?
6. Training. Has any training been provided to staff within theorganisation (both clinical and non-clinical) on appraising andusing evidence of effectiveness to influence clinical practice?
7. Contracts. How often does clinical and cost effectivenessinformation form an important part of contract negotiationand agreement? How many contracts contain terms which setout how effectiveness information is to be used?
HOW TO READ A PAPER
208

8. Incentives.What incentives – both individual and organisational– exist to encourage the practice of evidence based medicine?What disincentives exist to discourage inappropriate practiceand unjustified variations in clinical decision making?
9. Information systems. Is the potential of existing informationsystems to monitor clinical effectiveness being used to the full?Is there a business case for new information systems to addressthe task and is this issue being considered when IT purchasingdecisions are made?
10. Clinical audit. Is there an effective clinical audit programmethroughout the organisation, capable of addressing issues ofclinical effectiveness and bringing about appropriate changes inpractice?
APPENDIX 1
209

Appendix 2: Evidencebased quality filters foreveryday use
1 Therapeutic interventions (What works?)
1 exp clinical trials
2 exp research design
3 randomised controlled trial.pt
4 clinical trial.pt.
5 (single or double or treble or triple).tw
6 (mask$ or blind$).tw
7 5 and 6
8 placebos/ or placebo.tw
9 1 or 2 or 3 or 4 or 7 or 8
2 Aetiology (What causes it? What are the risk factors?)
1 exp causality
2 exp cohort studies
3 exp risk
4 1 or 2 or 3
210

3 Diagnostic procedures
1 exp “sensitivity and specificity”
2 exp diagnostic errors
3 exp mass screening
4 1 or 2 or 3
4 Epidemiology
1 sn.xs
(this would find all articles indexed under any MeSH term withany of “statistics”, “epidemiology”, “ethnology” or “mortality” assubheadings)
APPENDIX 2
211

Appendix 3: Maximallysensitive search strings(to be used mainly forresearch)
1 Maximally sensitive qualifying string forrandomised controlled trials
1 RANDOMISED CONTROLLED TRIAL.pt
2 CONTROLLED CLINICAL TRIAL.pt
3 RANDOMISED CONTROLLED TRIALS.sh
4 RANDOM ALLOCATION.sh
5 DOUBLE-BLIND METHOD.sh
6 SINGLE-BLIND METHOD.sh
7 or/1-6
8 ANIMAL.sh not HUMAN.sh
9 7 not 8
10 CLINICAL TRIAL.pt
11 exp CLINICAL TRIALS
12 (clin$ adj25 trial$).ti,ab
13 ((single or double or treble or triple) adj25 (blind$ ormas$)).ti,ab
14. PLACEBOS.sh
212

15 placebo$.ti,ab
16 random$.ti,ab
17 RESEARCH DESIGN.sh
18 or/10-17
19 18 not 8
20 19 not 9
21 COMPARATIVE STUDY.sh
22 exp EVALUATION STUDIES/
23 FOLLOW UP STUDIES.sh
24 PROSPECTIVE STUDIES.sh
25 (control$ or prospectiv$ or volunteer$).ti,ab
26 or/21-25
27 26 not 8
28 27 not (9 or 20)
29 9 or 20 or 28
In these examples, upper case denotes controlled vocabulary andlower case denotes free text terms. Search statements 8, 9, 19 and27 could be omitted if your search seems to be taking anunacceptably long time to run.
2 Maximally sensitive qualifying string for identifyingsystematic reviews
1 REVIEW, ACADEMIC.pt
2 REVIEW, TUTORIAL.pt
3 META-ANALYSIS.pt
4 META-ANALYSIS.sh
5 systematic$ adj25 review$
6 systematic$ adj25 overview$
7 meta-analy$ or metaanaly$ or (meta analy$)
APPENDIX 3
213

8 or/1-7
9 ANIMAL.sh not HUMAN.sh
10 8 not 9
(search statements 9 and 10 could be omitted if your search seemsto be taking an unacceptably long time to run)
HOW TO READ A PAPER
214

Appendix 4: Assessingthe effects of anintervention
Outcome event Total
Yes No
Control group a b a + b
Experimental group c d c + d
Control event rate = risk of outcome event in control group =CER = a/(a+b)
Experimental event rate = risk of outcome event in experimentalgroup = EER = c/(c+d)
Relative risk = CER/EER
Absolute risk reduction (ARR) = CER – EER
Relative risk reduction (RRR) = (CER – EER)/CER
Number needed to treat (NNT) = 1/ARR = 1/(CER – EER)
Odds ratio for a particular outcome event =
= (a/b)/(c/d)
= ad/bc
*The outcome event can be desirable (e.g. cure) or undesirable(e.g. an adverse drug reaction). In the latter case, it is semanticallypreferable to refer to the relative or absolute risk increase.
215
odds of outcome event vs odds of no event in control groupodds of outcome event vs odds of no outcome event in experimental group

Abridged Index Medicus (AIM journals)28
absolute risk reduction (risk difference)90–92
academic detailing 186accuracy 108, 110adjacent words 29adult learning theory 194aetiology, see causationAgency for Health Care Policy and
Research (AHCPR) 36AIDSDRUGS 35AIDSLINE 34, 35AIDSTRIALS 35Allied and Complementary Medicine
(AMED) 34American Association of Health Plans
(AAHP) 36American Journal of Medical Genetics 22American Medical Association (AMA)
36American Psychological Association 36anecdotes 5–6animal studies 98–9Annals of Internal Medicine 90anthropological theory 194association 87audit 185
Bandolier 34baseline characteristics 78behavioural learning 195bias 46, 47, 48
detection 65exclusion 65expectation 69, 113inclusion 48performance 65, 68–9 publication 48recruitment 61selection 65, 122systematic 64–8work up 113
blind testing 44, 68–9, 113blobbograms 130–31BMA library 17
local holdings 27Boolean logic 17
“and” operator 19“not” operator 29“or” operator 19
British Journal of General Practice 193British Medical Journal (BMJ) 19, 22,
39
Canadian Medical Association Journal76, 90
Cancer-CD 34CANCERLIT 34case-control studies 51–2
systematic bias 67–8case reports 53–4case series 53–4causation (aetiology)
evidence-based quality filters 210research studies 45, 51–2tests for 87
Centre for Reviews and Dissemination(York) 186–7
checklists 41, 74, 200–209 Chi square test 81, 134–5CINAHL 34clinical decisions, see decision makingclinical effectiveness, see effectivenessclinical examination 68clinical questions 1–3, 8–11clinical significance 70clinical trials 43Cochrane Collaboration 37, 120, 127
logo 132Cochrane Controlled Trials Register
(CCTR) 35, 37Cochrane Database of Systematic
Reviews (CDSR) 16, 35, 37Cochrane Effective Practice and
Organisation of Care (EPOC) Group 142, 181–2, 183, 185, 186
Cochrane Library 35, 36–8Cochrane Library Users Group 38Cochrane Pregnancy and Childbirth
Database 187Cochrane Review Methodology
Database (CRMD) 35, 37cohort studies 50–51
systematic bias 66–7complexity theory 194
216
Index

CONCORDE trial 100confidence intervals 88–90, 115, 133–4continuing medical education (CME)
182–3correlation coefficient (r value) 81,
85–6cost benefit analysis 152–8, 162cost consequences analysis 158, 163cost effectiveness analysis 2, 152–3,
161cost minimisation analysis 7–8, 152–3 cost utility analysis 152–3 costs
direct 153–4 discounted 162hidden 161incremental 162indirect 153–4 intangible 153–4
co-variables 86critical appraisal 2, 3, 8, 39–41, 62–4crossover 44cross-sectional surveys 49, 52–3Current Contents 35
data dredging 82–3Database of Abstracts of Reviews of
Effectiveness (DARE) 35, 36, 37decision analyses 43decision making
by anecdote 5–6by cost minimisation 7–8decision trees 11drug treatment 96–7by expert opinion (eminence basedmedicine) 7, 9patient’s perspective 11by press cutting 6–7
decision support systems 184–5decision trees 11detection bias 65developmental checks 12diagnostic (screening) tests 105–19
checklist 205confidence intervals 115contextual validity 116evidence-based quality filters 211expectation bias 113gold standard tests 107, 111–12likelihood ratios 116–19 normal range 115–16reproducibility 113–14research studies 45, 49
sensitivity 108, 110–11, 114specificity 108, 110–11, 114subject (patient) spectrum 112–13utility 111validation studies 106–16work up bias 113
disability adjusted life years (DALYs)158
double blind 44drop out 71–3Drug and Therapeutics Bulletin 96, 101drug treatment, see pharmaceutical
industry; treatmentdrug trials 94–102
economic analyses 43, 151–63checklist 158–63, 206–7choice of method 160clinical effectiveness 159–60cost benefit analysis 152–8, 162cost consequences analysis 158, 163cost effectiveness analysis 2, 152–3,
161cost minimisation analysis 7–8,
152–3cost utility analysis 152–3costing interventions 160–62costs, see costsperspective 159relevance 159sensitivity analysis 162–3types 152–3utility 160
Effective Health Care Bulletin 186–7effectiveness
assessing 215economic analyses 159–60efficacy analysis 73guidelines 141–2
Embase 34, 35English National Board health care
database 35epidemiology 211ethics
committees 55and cost minimisation 7–8randomised controlled trials 49research studies 55treatment 22–5
evaluation 2evidence-based medicine 1–12
checklists 200–209 criticisms of 3–8
INDEX
217

definitions 1implementation, see implementationlearning needs 8and mathematics 1patient led strategies 186–7and practice 4process 1–3Sackettís five-stage model 2–3, 11studies of 4–5websites 3
Evidence-Based Medicine (journal) 2evidence-based policy 11evidence-based quality filters 33
checklist 210–11Excerpta Medica database (Embase) 34,
35exclusion bias 65expectation bias 69, 113experiments 43exploded terms 24–5, 31–2
F test 81factorial design 44feedback 185–6field suffixes 17–22focused searching 16, 22–5follow up 71–3forest plots (blobbograms) 130–31fuzzy logic 17
gold standard tests 107, 111–12grey literature 125, 126GRiPP (Getting Research into Practice
and Purchasing) 188–9, 192, 195group relations theory 194guidelines 43, 139–49
barriers to adoption 143–4checklist 206choice of topic 145conflict of interest 144–5consensus 146definition 140drawbacks 140–41effectiveness 141–4flexibility 148format 144and ideal practice 146–7implementation 148–9local 183–4objectivity 145–6patients’ needs 148purposes 139–40 relevance 147–8
reliability 147standardised 183utility 147–8validity 147
health state preference values 156health status questionnaires 155HealthSTAR 35healthy life years (HeLYs) 157healthy years equivalents (HYEs) 157Heart Outcomes Prevention Evaluation
(HOPE) study 22heterogeneity 133–6hierarchies of evidence 54histograms 79homogeneity 133hypothesis testing 41–2, 45, 88hypotheticoeducative approach 42, 47
implementation 2, 179–96academic detailing 186audit 185barriers to change 189–93case studies 179–81changing health professionals’
behaviour 181–8checklist 208–9 decision support systems 184–5education 182–3feedback 185–6guidelines, see guidelinesincentives 187–8information sources 192organisational change 188–9organisational culture 189–93patient led strategies 186–7research priorities 195–6rules 187social influence strategies 186theories of change 193–5training 192–3
IMRAD format 39, 175inception cohorts 49, 50incidence 50inclusion bias 48independent variables 86Index Medicus 16, 125inductive reasoning 169institution fields 20intent to treat 72–3Internet Grateful Med 34, 35interobserver agreement 68, 114
HOW TO READ A PAPER
218

Journal of the American MedicalAssociation (JAMA) 19, 22, 41
Journal of Family Practice 3journalistic review 120, 122
Kappa score 68, 114King’s Fund 36Knowledge Finder (Aries Systems Inc)
16, 17Kruskall-Wallis test 81
Lancet 69, 96likelihood ratios 108, 110, 116–19 limit set option 22, 25–8linear regression 80literature searches 2, 15–38
evidence-based quality filters 33field suffixes 17–22focused searching 16, 22–5institution fields 20permuted index option 32reading 15–16refining 29review articles 27subheadings 25–8, 30systematic reviews 124–6textwords, see textword searches
local holdings 27
McMaster Health Utilities IndexQuestionnaire 155
McNemar’s test 81maintenance organisations 28Mann-Whitney U test 81maximally sensitive search strings
212–14mean deviation 70Medline database 16–36, 125MeSH (medical subject heading) terms
17, 21, 23–5permuted index option 32subheadings 26–7, 30tree command 32
meta-analyses 43, 47, 59–60, 128–33checklist 205
methods 39–41assessing quality 59–74, 126checklist 202critical appraisal 2, 3, 8, 39–41, 62–4qualitative research 168, 173–4statistics 69–73systematic reviews 121
MIDIRS 187
multiple regression 81, 86
National Association of HealthAuthorities and Trusts (NAHAT)
189–93National Guideline Clearinghouse
(US) 35–6National Library of Medicine (US) 16National Research Register (UK) 36negative predictive value 108, 110–11 New England Journal of Medicine 22,
90, 96NHS Central Research and
Development Committee 195NHS economic evaluation database 35NHS health technology assessment
database 35non-randomised controlled clinical
trials 46systematic bias 64–6
normal distribution 79–80, 82, 83–4normal range 115–16Nottingham Health Profile 155null hypothesis 42, 88number needed to treat (NNT) 6, 92nursing and allied health database
(CINAHL) 34
odds ratios 92one sample (paired) t test 81, 83one way analysis of variance test 81organisational strategy 194originality 59–60OSIRIS trial 179other controlled clinical trials 46outcomes 10, 70
measurement 62–4overviews 43OVID (Ovid Technologies) 16, 17
field suffixes 18–22MeSH terms 23subheadings 26truncation symbol 20
Oxford Centre for Evidence-BasedMedicine 45website 3
p value 85, 87–8PACE (Promoting Action in Clinical
Effectiveness) 188–9, 190, 192 paired (matched) comparison 44paired data 81, 83parallel group comparison 44
INDEX
219

patient led strategies 186–7Patient Oriented Evidence that Matters
(POEMS) website 3Pearson’s product moment correlation
coefficient test (r value) 81, 85–6peer review 40–41performance bias 65, 68–9permuted index option 32pharmaceutical industry
academic detailing 186 advertising 94–6checklist 204drug reps 94–6, 101–2, 186drug trials 95–6recommendations 7surrogate endpoints 100–101
placebo controlled trials 44placebo effect 4PLIP (Purchaser Led Implementation
Projects) 188–9, 191, 192pooled data 131–2positive predictive value 108, 110–11 post-test probability 108power calculations 69–71predictive value 108, 110–11PreMedline 17, 35press cuttings 6–7prevalence 50primary studies 42–3probability (p value) 85, 87–8
post-test 108problems, formulating (clinical
questions) 1–3, 8–11product moment correlation coefficient
test (Pearson’s r) 81, 85–6 prognosis
cohort studies 50questions 2research studies 45, 49
prospective design 47protocols, see guidelinespsychoanalytic theory 194psychology 30Psyclit 36publication bias 48PubMed 16, 17
Q-TWiST (quality adjusted TWiST)158
qualitative research 42, 49, 166–77appropriateness 171checklist 207–8 content analysis 174
credibility 175data analysis 174evaluating 170–76interpretation of results 175–6 iterative approach 169–70, 171methods 168, 173–4quality control 174–5versus quantitative research 166–70researcher’s perspective 172–3sampling methods 171–2transferability of results 176triangulation 169usefulness 170–71validity 169
quality adjusted life years (QALYs) 8,11, 156–8, 162
quality filters, see evidence-basedquality filters
quality of life measures 155–8quantitative research 42, 166–70
reliability (repeatability) 169questionnaire surveys 61QUORUM statements 129
r value (Pearson’s product momentcorrelation coefficient test 81, 85–6
R value 85randomised controlled trials 45, 46–50
advantages 47bias, see biasclinical questions 47–8disadvantages 48ethics 49exclusion criteria 48inappropriate 49–50inclusion bias 48maximally sensitive search strings
212–13publication bias 48recommended format 50systematic bias 64
rank order 79rating scale measurements 156rationing 153reading 15–16recruitment bias 61referees 40–41regression by least squares method 81rejected papers 39–41relative risk 90–92, 131relative risk reduction 90–2, 131reproducibility 113–14, 169research
HOW TO READ A PAPER
220

design 43–5, 62–4methods, see methodspriorities 195–6subjects (patients) 60–62topics 45
retrospective subgroup analysis (datadredging) 82–3
risk 90–92, 131
samplingmethods 171–2sample size 69–71
Science Citation Index 36screening, see diagnostic testssecondary (integrative) studies 42–3selection bias 65, 122sensitivity 108, 110–11, 114 sensitivity analysis 127–8, 162–3SF-36 general health questionnaire 155Sheffield Centre for Health and Related
Research in the UK (SCHARR Auracle) website 3
single blind 44skew (non-normal) distribution 79, 82,
83–4 social cognition 195Spearman’s rank correlation coefficient
81, 85–6 specificity 108, 110–11, 114stages of change model 195standard deviation (SD) 70standard gamble measurements 156statistical significance 39, 70, 87–8statistical tests 76–92
baseline characteristics 78causation 87cheating 77, 80–3commonly used 78–80correlation 85–6 obscure 80outliers 84–5 paired data 81, 83parametric/non-parametric 78–9, 81rank order 79regression 85–6 retrospective subgroup analysis (data
dredging) 82–3tails 83–4unpaired data 81, 83
statistics 69–73checklist 203
subheadings 25–8, 30SUMSearch 36
surrogate endpoints 10, 29, 62, 97–101surveys 43systematic bias 64–8systematic reviews 7, 27, 43, 120–28
advantages 122checklist 205data sources 124–6evaluating 123–8external validity 126, 128grey literature 125, 126literature searches 124–6maximally sensitive search strings
213–14methodological quality 126–7methodology 121relevance 128sensitivity analysis 127–8
target variables 86textword searches 21, 22, 31–2
adjacent words 29time trade-off measurements 156transforming data 79–80trashing 39–41treatment (therapy)
animal studies 98–9cost minimisation 7–8decision making 96–7drug reactions 94–5drug trials 94–102ethics 22–5evidence 101–2 evidence-based 4–5evidence-based quality filters 210objectives 96–7questions 2, 9–11research studies 45subheadings 26–7surrogate endpoints 97–101
triangulation 169truncation symbols 19, 20TWiST (time spent without symptoms
of disease and toxicity of treatment) 158
two sample (unpaired) t test 81, 83two way analysis of variance test 81
UK Cochrane Centre 33, 122UK Health Technology Assessment
Programme 146, 162UNICORN 36unpaired data 81, 83users’ guides 22, 41, 74
INDEX
221

utility based units 8, 162
validation studies 106–16Web of Science 36Wilcoxon matched pairs test 81willingness to accept (WTA) 157willingness to pay (WTP) 157
WinSPIRS (Silver Platter InformationLtd) 16, 17
withdrawal from clinical trials (dropout) 71–3
within subject comparison 44work up bias
HOW TO READ A PAPER
222