How to move from design research to design...
43
Design Synthesis Methods How to move from design research to design solutions
Transcript of How to move from design research to design...

Design Synthesis MethodsHow to move from design research to design solutions

Exposing the Magic of Design by Jon Kolko, designer at Frog design and the Director of Austin Centre for Design, Texas.

Synthesis...
the revelation of clarity

What is Synthesis?
Synthesis in design is a process of judging.
It is a spark, the ability for the human mind to graspmultiple ideas and manipulate them into something amazing.

The search for the keys to innovation involves both design thinking and ethnography (understanding human societies)
Both quantitative and qualitative research combined with creative thinking can lead to new and interesting ideas for products, services and systems.

Observational research involves looking at real people in their environments of work and play as they perform a task, achieve a goal or while having an experience.
Ethnography involves immersion into the culture in which people spend their time.


Design research is different from Marketing research.
The goal in design research is to find inspiration for the design, whereas the goal in marketing research is to predict the behaviour of a large group.

Design research Marketing researchFocuses on people Focuses on people
Can be quantitative or qualitative Can be quantitative or qualitative
Borrows from social or behavioural sciences Borrows from social or behavioural sciences
Attempts to understand culture. Looks at the styles, words, tools, and work-a -rounds people use in an effort to inspire design
Attempts to predict behaviour. Looks at what people say they would do, or what they actually do in an effort to predict what they would do in a new situation
Celebrates the unique and peculiar.
The new or obscure in observations can lead to a new or interesting design idea.
Avoids the unique and peculiar.
The goal is to understand mass responses

Whether the research is pragmatic - looking for usability enhancements – or conceptual – understanding how something fits into culture – the philosophy of design research is the same
To learn from people and to emphasise people rather than technology or business.

Various research methods could be used to understand the social relationships between Gen Y teens and mobility;

1. A focus on technology or product
This is destined to be constrained by realism (e.g. what can we do given current abilities?)
2. A focus on business or market
This is destined to be constrained by precedent (e.g. what are others doing and how are they doing it?)
A focus on human behaviour
This helps the researcher to learn about potential for the future state. Findings will emphasise behaviour.


Opportunities may exist in the following areas;
Technology (the devices the teens own)
Style (the clothing the teens wear)
Identity (the language teens use)
Infrastructure (the transportation methods the teens use)
In this sense, design research that focuses on human behaviour, not on a particular object or service is the most effective at discovering data for innovation.

Innovation
Its important to note two major problems with viewing design research as the ‘key to innovation’
First, an innovative product is not simply new, it must be new and successful in the market.

Design research methods will help the designer to find the newness but they will not help to bring the newness to market. For this, traditional methods of design engineering,supply chain management and other production techniques are necessary along with marketing advertising and distribution
Second, design research only presents an opportunity, it does not lead directly to the new idea or innovative concept

Design Synthesis links innovation, research and design
Design synthesis is the link between the type of behavioural research described earlier – the potential for future state – and the creation for something new. It is the most critical part of the creative process of design.
eg; Typically a company identifies through research, a new opportunity for producing a touch based phone. A product team is assembled, eventually the product ‘trickles down’ to the designer who then begins to sketch what the item might look like.

But with the recent popularity of the phrases ‘design thinking’ and innovation designers have been asked to participate in these strategic conversations, way before the ‘sketch’ stage. Designers are increasingly expected to discuss not just how to solve a problem but also which problems to consider solving.

This presents a great opportunity for us as designers moving from a tactical role to a strategic role, where we are valued for our ability to produce and our ability to analyse and think.

A designer attempting to produce an innovative design will conduct research focusing on the experiential, emotional and personal acts of culture. The research will describe an opportunity _ design research acts as problem finding
Design is that act of problem solving-developing a new design idea that fulfils the stated criteria and adds value to the human condition.

Synthesis is a sense making process that helps the designer move from data to information, and from information to knowledge
data > information > knowledge

“It is easier to tone down a wild idea, than come up with a new one’
ALEX OSBORN (INVENTOR OF BRAINSTORMING)
Brainstorming is a method of generating as many ideas as possible – no idea should be considered too ‘wild’ and after numerous ideas have been developed then they can be pruned and qualified.
This allows for playful ‘divergent’ thinking. The exploring of ‘what if’ scenarios.

The ability to generate ideas - outlandish or otherwise- are at the core of design innovation.
Design synthesis embraces this divergent dreaming.

Visualisation
1. Visualisation helps to externalise ideas, it can be quick and messy pencil sketches, doodles or marks on the back of a beer mat.
2. Visualisation allows for comparison. Compare the following eg first without visualisation and then with diagrams;

Imagine two fields of crops. The first field is divided into 16 sections, each of equal size. Five different crops are planted in each field: corn, peppers, lettuce, tomatoes and beets. Each section is limited to one crop. There are twice as many peppers as beets and twice as much corn as peppers. But in the second field the crops are planted in equal amounts.
Which field has more peppers?

Huh?

Field 1
Corn Corn Beets Peppers Tomatoes LettuceBeets Peppers
Tomatoes Lettuce
Field 2
ahh!...

3. Visualisation helps convey how changes occur over time. A drawing can be repeated with minor changes and allowing for easier comparison
4. Visualisation shows spatial relationships, making it easier to recall
5. Visualisation makes concrete what before was only an idea. It makes it sharable, storable and critique able.
6. Visualisation allows our brain to build connections between disparate ideas.

Visualisation helps us to off-load the data so that new ideas can occur and be mingled and synthesised
“getting the ideas down on paper’

Methods for making meaningout of data
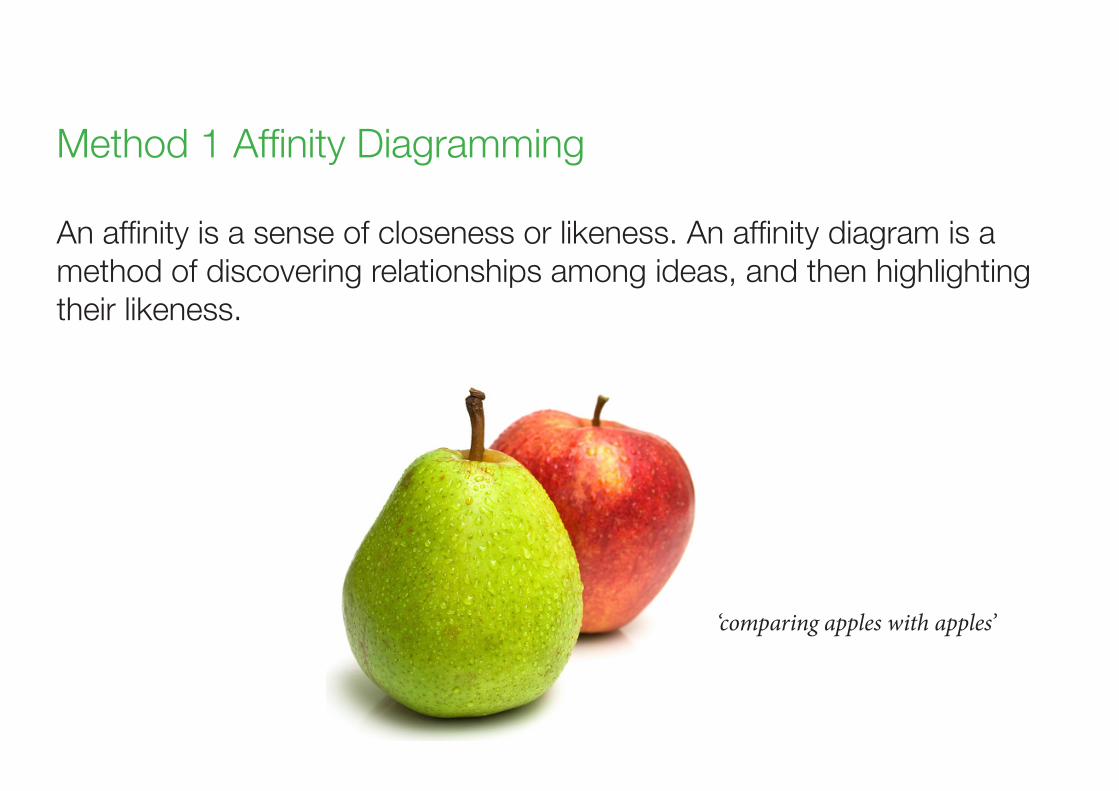
Method 1 Affinity Diagramming
An affinity is a sense of closeness or likeness. An affinity diagram is a method of discovering relationships among ideas, and then highlighting their likeness.
‘comparing apples with apples’

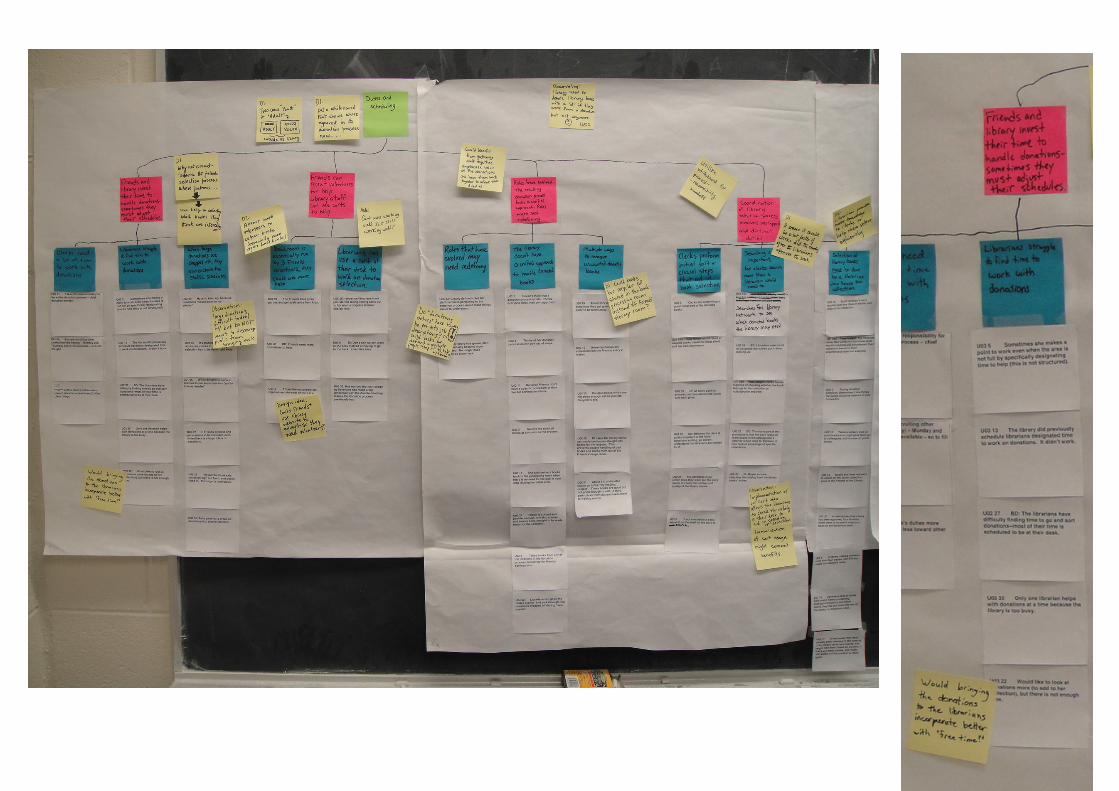
1. Write each piece of data (a comment picture, word, phrase or movie) on a post-it note or card
2. Spread them out randomly on a surface ensuring there is no fixed pattern
3. Physically move the notes around looking for patterns or groupings. Each move can be logical (both cards are discussing purchasing) or emotional (they might both discussing purchasing in some way)
4. As you work through the entire set of cards, patterns or groups will emerge

5. Once all the notes have been placed in groups, conduct a focusing exercise. Label each group on a larger coloured card. The labels should capture the groups essence like ‘Purchasing’, ‘Exploring checkout’ or ‘Ways of shopping’

6. Create a short description of the group eg Ways of shopping might be ‘This group includes some new ways of thinking about purchase and checkout”
7. Compile the whole effort into a ring binder or translate the process into a PDF presentation.
This organisational outline becomes the deliverable used to communicate what you have learned through the research data and emerging ideas.

Method 2 Parallel Clustering
You’ve already amassed a large set of data and done your analysis. You now have a number of interesting insights and numerous directions that you could follow.
For some, Parallel Clustering is the answer.

Parallel Clustering forces you to quickly articulate the top ideas/themes/needs/etc that they view as most important.
This activity helps to visually cut through all of the clutter and very quickly understand what’s most important.

Case study
In 2005, Jump Associates partnered with a large, international client to help them explore their emerging markets strategy. The project name, BRICS, is an acronym for the developing economies of Brazil, Russia, India, China and South Africa.
The goal of their work was to understand broad cultural themes in order to define business opportunities in these countries.

Initial Mind map Finding Possible Themes
Finding Different Themes in the same map

Unlike a simple clustering or mind mapping exercise parallel clustering quickly reveals MULTIPLE alternatives for grouping information.
This method works well as a group, as every team member will see the grouping or clustering in a slightly different way.
Naming the chosen Themes as Groups

Any of these methods can be used to synthesise the research findings you will gather in Task 1 and to identify insights in the gathered data.
It can also help to pair Brands with needstates and possible target audiences.
BRAND
Boomers
GenX
GenY
GenZ
AgeingBoomers
NEEDSTATE

Many design ideas will be created, not all of them will be ‘good’ ideas, some may be technically impractical while others won’t work in a business sense.
Focus on producing as many ideas as possible, and then later evaluate to find which ones work best.

AD305Prepared by Lisa Molloy 2013Excerpts from:Exposing the Magic of Design by Jon Kolko,