Scenario studies: an aide for a dynamic territorial approach to policy-making

1
How to model the future scenario for China with a Dynamic Economy
Kejun [email protected]
Energy Research Institute, China
Workshop on GHG Stabilization ScenariosTsukuba, Japan on January 22-23, 2004
ERI, ChinaERI, China

2
Energy Production and Consumption in China
0200400600800
1000120014001600
1940 1960 1980 2000 2020
Year
Mill
ion
tce
Production
Consumption

3
CO2 emission in China

4
CO2 Emission in China
0
1
2
3
4
5
6
1990 2010 2030 2050 2070 2090
Year
Bill
ion
t-C
S1
S2
S3
S4
S5
S6

5
Premary Energy Elasticity
0. 000. 100. 200. 300. 400. 500. 600. 70
S1 S3 S5CS
:基准线
CS:低替代方案
EDM-M
edium
ERI:C
ESS-
Low
ERI:C
ESS-
HighCC
E200
0:ED
CCE1
997:
BAI
M/SRE
S-C
AIM/S
RES-
STI
MER-A
1TI
MER-B
1

6
Energy Production and Consumption in China
0200400600800
1,0001,2001,4001,600
1952
1965
1978
1986
1989
1992
1995
1998
2001
years
mill
ion
TCE
ProductionConsumptionc

7
CO2 Emission Trends in China
-1000
-500
0
500
1000
1500
2000
2500
3000
1990 1991 1992 1993 1994 1995 1996 1997 1998 1999 2000 2001 2002
Year
Emis
sion
s (T
g-C
O2) Coal Combustion
Oil CombustionGas CombustionBiofuel CombustionCement ProductionBiomass BurningCarbon Uptake

8
IPAC-Emission
Population: China
0.00.51.01.52.02.53.0
1990
2000
2010
2020
2030
2040
2050
Year
Bill
ion
S1
S2
S3
S4
S5
S6
CS:基准线
CS:替代方案
CS:低替代方案
ERI-CEED
LES
ERI:CESS-Low
ERI:CESS-Medium
ERI:CESS-High
CCE1997:BaU
EDM
CCE2000:ED
Tsinghua-MARKAL
Tsinghua
AIM/China
SGM-China
AIM/SRES-C
AIM/SRES-D
AIM/SRES-S
AIM/SRES-E
TIMER A1
GDP of Chi na
0
50
100
150
200
250
1990 2000 2010 2020 2030 2040 2050
Year
Tri.Y
uan(
1990
Pric
e)
S1
S2
S3
S4
S5
S6
CS:基准线
CS:替代方案
CS:低替代方案
ERI -CEED
LES
ERI :CESS-Low
ERI :CESS-Medi um
ERI :CESS-Hi gh
CCE2000:BaU
CCE2000:ED
CCE1997:A
CCE1997:B
Tsi nghua-MARKAL
AIM/SRES-C
AIM/SRES-D
AIM/SRES-S
AIM/SRES-E
TIMER-A1
TIMER-A2
TIMER-B1
TIMER-B2
EDM-Hi gh
EDM-Medi um
EDM Low
Primary Energy in China
020406080
100120
1990
2000
2010
2020
2030
2040
2050
Year
100M
tce
S1
S2
S3
S4
S5
S6
CS:基准线
CS:替代方案
CS:低替代方案
ERI-CEED
LES
ERI:CESS-Low
ERI:CESS-Medium
ERI:CESS-High
CCE1997:A
CCE1997:B
CCE2000:BaU
CCE2000:ED
Tsinghua-MARKAL
AIM/SRES-C
AIM/SRES-D
AIM/SRES-S
AIM/SRES-E
TIMER-A1
TIMER-A2
TIMER-B1
TIMER-B2
Final energy in China
0
1020
30
4050
60
1990
2000
2010
2020
2030
2040
2050
Year
100M
tce
S1
S2
S3
S4
S5
S6
国家研究Baseline
国家研究替代方案
国家研究的 增 方案替代方案经济 长
中国能源 略研究战 : 低方案
中国能源 略研究战 : 中方案
中国能源 略研究战 : 高方案
Tsinghua-MARKAL
AIM/China
SGM-China
AIM/SRES-C
AIM/SRES-D
AIM/SRES-S
AIM/SRES-E

9
GDP Per Capita
42318
31707 30845 2895926071
12068
5462
769
0
5000
10000
15000
20000
25000
30000
35000
40000
45000
Japan Germany America France Singapore Korea The average China

10
The urbanization course in China
0%
20%
40%
60%
80%
100%
1980 1985 1990 1995 2000
The urbanization level of othercountries in 1995
0%
20%
40%
60%
80%
100%
Korea Ameri ca Japan France Germany
中国的城市化 程进 1995年其它国家的城市化水平
The urbanization course in China
0%
20%
40%
60%
80%
100%
1980 1985 1990 1995 2000
The urbanization level of othercountries in 1995
0%
20%
40%
60%
80%
100%
Korea Ameri ca Japan France Germany
中国的城市化 程进 1995年其它国家的城市化水平

11
Average living area per capita, m2
0 10 20 30 40 50 60
rural area in China
urban area in China
Japan(1993)
America(1995)
North Europe
England(1992)
Canada

12
01020304050607080
car s
tock
for1
00pe
rson
s
Japa
nGerm
any
America
France
Singap
oreAus
tralia
China EU
Car Ownership

13
GDP Growth Rate in China
0. 02. 0
4. 06. 0
8. 010. 0
12. 014. 0
16. 0
1980
1982
1984
1986
1988
1990
1992
1994
1996
1998
2000
2002
Year
%

14
Steel output in China
0
50100
150
200
250300
350
1978
1980
1985
1990
1991
1992
1993
1994
1995
1996
1997
1998
1999
2000
2001
2002
2010
2030
2010
2030
2010 other
Year
Mill
ion t
on
IPAC-
AIM2000
IPAC-
AIM2003

15
Motor Vehicles Output in China
012345678
1978
1980
1985
1990
1991
1992
1993
1994
1995
1996
1997
1998
1999
2000
2001
2002
2010
2020
2030
Year
Milli
on

16
Per Capita Residence Floor Space
05
1015202530
1989 1997 2001 2002Year
m2 Citry
Rural

17
Space Floor Completed
0200400600800
10001200
1985
1989
1990
1991
1992
1993
1994
1995
1996
1997
1998
1999
2000
2001
2002
Year
Milli
on m
2

18
Economy Target of China in 2020
Government Target: Overall wealthy societyOn the basis of economy structure optimal and increasing profit, GDP will be four time in 2020 comparing with that in 2000,realize fundamental industrialization”;Take a new way for industry development;“continually increase ability for sustainable development”;

19
Framework of IPAC
IPAC-SGM
IPAC-AIM/tech
IPAC-Emission
IPAC/Tech
IPAC-TIMER
IPAC/AIM-Local
Energy demand and supplyPrice/investmentEconomic impactMedium/long-term analysis
Region analysisMedium/short analysisEnergy demand and supplyTechnology policy
Medium/short term analysisTechnology assessmentDetailed technology flow
IPAC-MATERIAL
Energy demand and supplFull range emissionPrice, resource, technologMedium-long term analysisEconomic impact
Environment industryPollutant emissionMedium/long-term analys
Technology developmentEnvironment impactTechnology policy
AIM-air IPAC-health
Energy demand and supplyPrice/investmentMedium/long-term analysis
ERI, ChinaERI, China

20
Co-benefit to Consistency: climate and development
Identify domestic development plan
Domestic energy/land use policies
Looking for consistency
Help developing countries for their own purpose based on the consistency
ERI, ChinaERI, China

21
Unit Energy Use in Steel Making Industry
0
50
100
150
200
250
300
1970 1975 1980 1985 1990 1995 2000
Year
kgce
Large ConvertorContinuous Casting
Large Blast Furnace
Coke Dry Quenching
Coal Powder InjectionTRT
Fluit Gas Recovery DCF COREX
EF

22
IPAC-AIM/Technology:
CO2 Emission Reduction Cost
020406080
100120140
0 500 1000 1500 2000 2500
Accum ula ted Em ission Reduction, Million t-C
CO
st, U
S$
Agricult
Industry
Transport
Service
Urban
Rural

23
Marginal Abatement Cost: IPAC-Emission model
0
50
100
150
200
250
300
350
400
450
500
550
0 200 400 600 800 1000MtC
US$
/tC
USA OECD- P OECD- W EFSU Chi na
S. E. Asi a M. E Af r i ca L. A

24
AIM/Technology
CO2 emi ssi on
0. 00E+005. 00E+141. 00E+151. 50E+152. 00E+152. 50E+153. 00E+153. 50E+15
2000
2003
2006
2009
2012
2015
2018
2021
2024
2027
2030
Year
g-C
Pol i cyMarketFrozen

25
Impact mitigation on Chinese economy
2010 2020 2030 2050 2075 2100
650 -0.10% -0.10% 1.20% 1.10% 0.90% 0.90%
550 -0.20% -0.20% 1.90% 2.00% 2.00% 2.40%
450 1.40% 2.30% 2.90% 3.70% 3.90% 4.80%
Per Capita Emission -0.20% -0.20% -0.10% -0.10% 0.70% 1.50%
Carbon Intensity -0.20% -0.20% -0.10% -0.10% -0.20% -0.20%
650 -1.50% -1.70% 18.80% 22.60% 27.70% 30.50%
550 -2.60% -2.40% 29.10% 40.60% 51.60% 58.00%
450 14.70% 30.00% 41.60% 62.40% 69.00% 75.00%
Per Capita Emission -2.60% -2.40% -1.90% -1.80% 27.30% 48.50%
Carbon Intensity -2.60% -2.40% -1.90% -1.80% -4.00% -3.10%
GDP loss,%
CO2 reduction rate,%

Marginal Abatement Cost: IPAC-SGM model
Change of GDP by CDM implementation in China
0.00%0.02%0.04%0.06%0.08%0.10%
1990
2000
2010
2020
2030
2040
2050
Ye ar
%
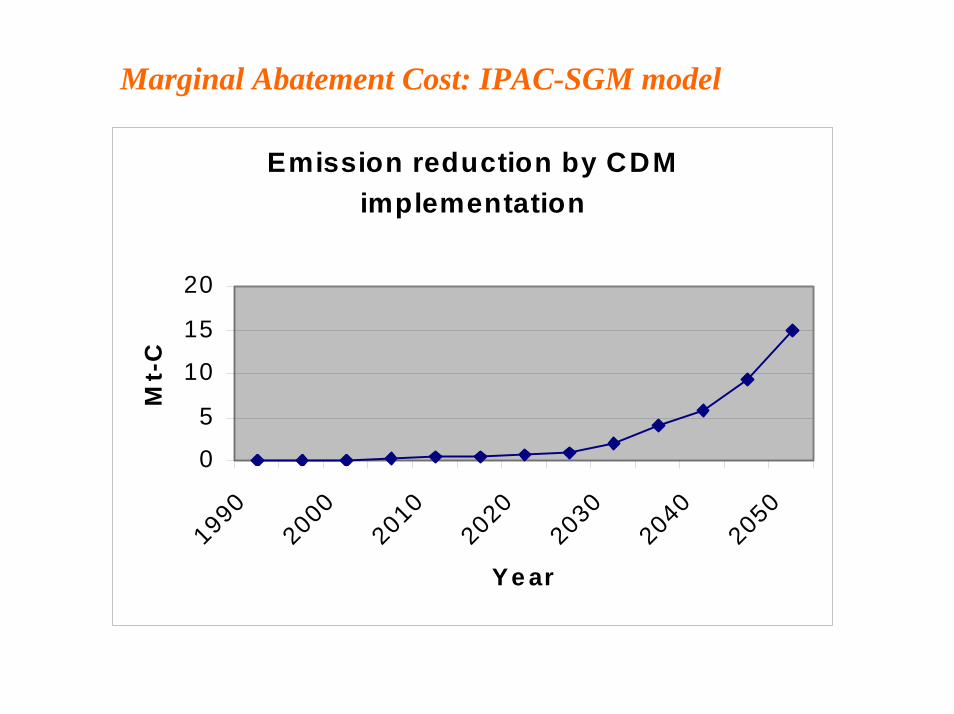
Marginal Abatement Cost: IPAC-SGM model
Emission reduction by CDM implementation
0
5
10
15
20
1990
2000
2010
2020
2030
2040
2050
Ye ar
Mt-
C

28
An easy way
More flexible market-multilateral/bilateral/global
Technology R&D/international collaboration
Domestic policies
Criticism system: reporting
ERI, ChinaERI, China

29
Next
Modeling focus on technology change and domestic policies: demand from energy planning
Driver analysis by using IPAC-AIM/Technology, join the forum for energy scenario
Study for city or province: Beijing, Chongqing, Taiyuan, Ningxia
After Kyoto
Multi-gas analysis
ERI, ChinaERI, China

30
UK: A Low Carbon Economy
60% emission reduction by 2050, and hope other developed country join
By using various countermeasures
Not much impact on economy: 0.5%-2% in 2050
ERI, ChinaERI, China

31
UK:Countermeasures
Emission trading: volunteer trading system
Energy efficiency increasing:companies, household and public utilities
Natural gas import
Extension of competitive energy market
Technology innovation: hydrogen, renewable energy, CHP and new energy conservation technology
Work together with I8 and EU for technology R&D
ERI, ChinaERI, China

32
UK: technologies
Offshore power generation(Wave, tide and wind)
CHP(local biomass, waste, wind, tide)
Mini-power generation(polygeneration, feul cell, PV)
New building design(0 emission)
Fuel cell
Transport(Hybrid, bio-fuel, hydrogen)
Nuclear fusion
ERI, ChinaERI, China

33
Others
Similar countermeasure package
Different target(only for Kyoto)
US, Japan, EU
ERI, ChinaERI, China

34
Policies contribute to climate change
aEconomic policies to promote tertiary industry aClean energy supply policy: natural gasaRenewable energy development: national wind plan,
hydropoweraClean coal technology promotionaHigh efficiency technology: green lighting, energy
efficiency standardaClean production aClose low efficiency and small scale factoryaTechnology R&D: 863 high-tech project, 973 research
planaEmission standardaSO2 emission marketa…

35
What’s for China
aTaking action in some senseaBut hard to make political commitmentaPolicy implementationaNot difficult to combine climate change and domestic
developmentaShould prepare 20 year national plan, and think about
2050 long-term strategyaChina follow well the experience on energy policies and
countermeasureaTechnology is difficult/importantaDiscussion about technology transfer/localization

36
2004 is important
a“Eleventh-Five Year Plan”a“National Climate change strategy”aEnergy forecasting/scenarioaIntegrating with local development/at early time

37
Modeling activities
aThink about near or medium term policy implementationaTechnology diffusion, R&DaWhat’s the impact of UK proposalaAfter Kyoto: meaning of Participation/ new framework