How to Integrate Geology Geophysics and Geomechanics to ... Integrated...established that integrates...
13
1 How to Integrate Geology Geophysics and Geomechanics to Drive Completion and Frac Design Optimization to Maximize Production and Economics and Minimize Frac Hit X. Li, A. Aoues, B. Attia, N. Umholtz, S. Poludasu, A. Agrawal, R. Khandelwal, A. Abassi, B. Elhamal, M. Paryani, J. Wang, M. Barri, A. Babalola, L. Ouhib, A. Hamidou, F. Znaidi, L. Benkhalfallah FracGeo, the Woodlands, TX Introduction Currently, most operators still rely on the outdated trial-and-error approach to optimizing horizontal completions by experimenting with a series of design adjustments and comparing the production with offset wells. Although the learnings from these multi-million-dollar research wells may provide some useful insights on what works or does not work for a specific formation in specific areas of a specific basin, they are far from being predictive or universally applicable, even in a given reservoir since the rock fabric varies. What the industry “desperately” needs is a practical and effective, but much less expensive workflow that can not only extract information to honor the geologic and geomechanical reality around a target well (fault/natural fracture, elastic property variations, pressure depletion), but also utilize the gathered inputs to evaluate different scenarios for adjustments and optimizations before the actual operation. With cube experiments that cost more than $100 million yielding poor performance and returns (see Bradley Olson July 4 th 2019 article in the Wall Street Journal titled A Fracking Experiment Fails to Pump as Predicted) it is time to empower shale operators with predictive tools that use real data and new relevant technologies that can provide reliable answers in a very short time while honoring all the complex physics. Integration is the key to tackle the sub-millidarcy permeability, sub-micron pore size unconventional rocks, which means multidisciplinary collaboration to transfer all the efforts from geophysics, geology, and geomechanics (3G) to support the best engineering design. With integration, the silos which for so long have plagued our industry can be broken to achieve maximum information sharing, as the missing pieces of data the engineer is looking for may just lie in his/her geoscientist colleague’s hands. In this way, the analysis and insights from 3G can be effectively translated to engineers to guide them to optimize designs instead of the trial-and-error approach. Furthermore, practical and predictive tools are necessary to aid engineers to quickly turn the gathered data and knowledge from completion and frac design evaluations to economic measures to aid decision-making and the screening of multiple scenarios. Thanks to the eleven modules, each with it’s own disruptive technologies, on FracGeo’s integrated platform, FracPredictor™, an unique multidisciplinary collaborative workflow is established that integrates Geology, Geophysics and Geomechanics (3G) to provide a complete solution to frac design, completion and well spacing optimization. Geomechanics in Surface Drilling Data Surface drilling data are one of the most commonly available (almost at every well), but least expensive sources of data acquired. Yet, not enough attention has been paid to the untapped value it possesses until recently. The Drilling process is the first direct contact with subsurface rocks by breaking them using a drill bit. The corrected mechanical specific energy (CMSE), that describes how much mechanical energy is applied to break a unit volume of rock, can be readily computed from commonly recorded surface drilling parameters. CMSE reflects how the properties of the stressed rock vary, thus by proper friction loss correction of the surface measured data and calibration as well as necessary constraints, the static geomechanical properties, natural fractures, porosity, and even pore pressure and in-situ stresses can be inferred from surface drilling data (Figure 1 Figure 2). This technique has been validated across different basins by various sources, such as DFIT, LWD logs, mud logs, Image logs, microseismic, etc. (Figure 3).
Transcript of How to Integrate Geology Geophysics and Geomechanics to ... Integrated...established that integrates...

1
How to Integrate Geology Geophysics and Geomechanics to Drive Completion and Frac Design Optimization to Maximize Production and Economics and Minimize Frac Hit X. Li, A. Aoues, B. Attia, N. Umholtz, S. Poludasu, A. Agrawal, R. Khandelwal, A. Abassi, B. Elhamal, M. Paryani, J. Wang, M. Barri, A. Babalola, L. Ouhib, A. Hamidou, F. Znaidi, L. Benkhalfallah FracGeo, the Woodlands, TX Introduction Currently, most operators still rely on the outdated trial-and-error approach to optimizing horizontal completions by experimenting with a series of design adjustments and comparing the production with offset wells. Although the learnings from these multi-million-dollar research wells may provide some useful insights on what works or does not work for a specific formation in specific areas of a specific basin, they are far from being predictive or universally applicable, even in a given reservoir since the rock fabric varies. What the industry “desperately” needs is a practical and effective, but much less expensive workflow that can not only extract information to honor the geologic and geomechanical reality around a target well (fault/natural fracture, elastic property variations, pressure depletion), but also utilize the gathered inputs to evaluate different scenarios for adjustments and optimizations before the actual operation. With cube experiments that cost more than $100 million yielding poor performance and returns (see Bradley Olson July 4th 2019 article in the Wall Street Journal titled A Fracking Experiment Fails to Pump as Predicted) it is time to empower shale operators with predictive tools that use real data and new relevant technologies that can provide reliable answers in a very short time while honoring all the complex physics. Integration is the key to tackle the sub-millidarcy permeability, sub-micron pore size unconventional rocks, which means multidisciplinary collaboration to transfer all the efforts from geophysics, geology, and geomechanics (3G) to support the best engineering design. With integration, the silos which for so long have plagued our industry can be broken to achieve maximum information sharing, as the missing pieces of data the engineer is looking for may just lie in his/her geoscientist colleague’s hands. In this way, the analysis and insights from 3G can be effectively translated to engineers to guide them to optimize designs instead of the trial-and-error approach. Furthermore, practical and predictive tools are necessary to aid engineers to quickly turn the gathered data and knowledge from completion and frac design evaluations to economic measures to aid decision-making and the screening of multiple scenarios. Thanks to the eleven modules, each with it’s own disruptive technologies, on FracGeo’s integrated platform, FracPredictor™, an unique multidisciplinary collaborative workflow is established that integrates Geology, Geophysics and Geomechanics (3G) to provide a complete solution to frac design, completion and well spacing optimization. Geomechanics in Surface Drilling Data Surface drilling data are one of the most commonly available (almost at every well), but least expensive sources of data acquired. Yet, not enough attention has been paid to the untapped value it possesses until recently. The Drilling process is the first direct contact with subsurface rocks by breaking them using a drill bit. The corrected mechanical specific energy (CMSE), that describes how much mechanical energy is applied to break a unit volume of rock, can be readily computed from commonly recorded surface drilling parameters. CMSE reflects how the properties of the stressed rock vary, thus by proper friction loss correction of the surface measured data and calibration as well as necessary constraints, the static geomechanical properties, natural fractures, porosity, and even pore pressure and in-situ stresses can be inferred from surface drilling data (Figure 1 Figure 2). This technique has been validated across different basins by various sources, such as DFIT, LWD logs, mud logs, Image logs, microseismic, etc. (Figure 3).

2
Figure 1. The input drilling parameters (left) and output rock properties (right) through the Corrected Mechanical Specific Energy (CMSE) based approach. Inputs are commonly available drilling curves, including weight on bit (WOB), rate of penetration (ROP), rotational speed (RPM), rate of penetration (ROP), mud density (ECD), and bit size (BS). Derived rock properties include Young’s modulus (YM), Poisson’s ratio (PR), shear modulus (G), porosity (PHI), fracture index (Frac IND), and stress brittleness (Stress BR).
Figure 2. In-situ stresses curves derived from surface drilling data through calibrations by DFIT data (colored dots) and stress regime constraints.

3
Figure 3. Surface drilling derived logs (left) validation by LWD (center) and mud logs (right). Based on the petrophysical analysis on nearby exploration well, the target formation has low GR, high YM characteristics, which are exhibited in the general trends through the comparison between drilling derived YM, LWD GR log, and Total Gas log, where low YM corresponds to low total gas and high GR (red box) and vice versa (purple box). An interesting observation is that the abrupt change of lithology and petrophysical property can be captured by the derived geomechanical log (dashed horizontal dark blue lines), which is important to well steering and completion design. Obvious advantages of drilling derived logs over lateral wireline derived results are real-time interpretation while drilling without delay, in-situ stress derivation without assuming pore pressure, no additional cost or operational risk, availability on each well, etc. Therefore, this technique can be applied while drilling to steer the well or used after drilling towards building reliable 3D geomechanical models and completion cluster design optimization. The basic principle of engineered completion design is to place clusters of each stage in similar rocks to avoid over-treating or no-treating to increase cluster efficiency (Figure 4). Based on the high horizontal differential stress in the study area, 5 different completion designs with decreasing stage length (SL) and cluster spacing were proposed and optimized through drilling derived Shmin curve (Figure 5).

4
Figure 4. Cluster locations of geometric design were adjusted according to Shmin (Minimum Horizontal Stress) derived from drilling data to increase the cluster efficiency from 66% to 77%.
Figure 5.Proposed five completion design after engineered optimization.

5
Seismically Driven Geologic Modeling Seismic data contains the heterogeneity and distribution information of rock properties in 3D space, which is very valuable in guiding the geologic modeling process. Through advanced stochastic inversion, the derived high-resolution impedance attribute can be used to drive the generation of 3D geologic models, where the upscaled log values from well logs will be populated in the inter-well space with the guidance from seismic attributes (Figure 6).
Figure 6: Seismically -driven geologic models. The derived models can be validated via different sources to prove its predictive capability which confirms the value of their use in engineering designs (Figure 7).
6
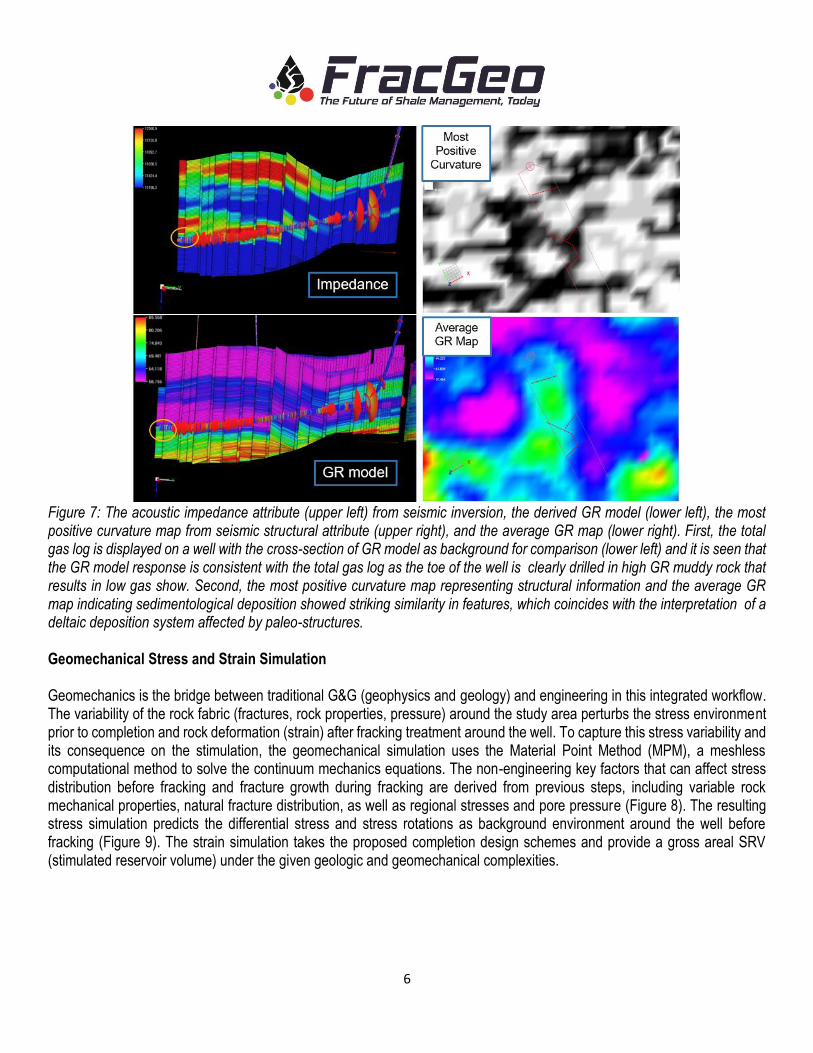
Figure 7: The acoustic impedance attribute (upper left) from seismic inversion, the derived GR model (lower left), the most positive curvature map from seismic structural attribute (upper right), and the average GR map (lower right). First, the total gas log is displayed on a well with the cross-section of GR model as background for comparison (lower left) and it is seen that the GR model response is consistent with the total gas log as the toe of the well is clearly drilled in high GR muddy rock that results in low gas show. Second, the most positive curvature map representing structural information and the average GR map indicating sedimentological deposition showed striking similarity in features, which coincides with the interpretation of a deltaic deposition system affected by paleo-structures. Geomechanical Stress and Strain Simulation Geomechanics is the bridge between traditional G&G (geophysics and geology) and engineering in this integrated workflow. The variability of the rock fabric (fractures, rock properties, pressure) around the study area perturbs the stress environment prior to completion and rock deformation (strain) after fracking treatment around the well. To capture this stress variability and its consequence on the stimulation, the geomechanical simulation uses the Material Point Method (MPM), a meshless computational method to solve the continuum mechanics equations. The non-engineering key factors that can affect stress distribution before fracking and fracture growth during fracking are derived from previous steps, including variable rock mechanical properties, natural fracture distribution, as well as regional stresses and pore pressure (Figure 8). The resulting stress simulation predicts the differential stress and stress rotations as background environment around the well before fracking (Figure 9). The strain simulation takes the proposed completion design schemes and provide a gross areal SRV (stimulated reservoir volume) under the given geologic and geomechanical complexities.

7
Figure 8: Facies map (left) shows the rock properties variations indicated by color based on GR model and natural fracture distribution map (right) based on seismic structural attribute. Both are geomechanical simulation inputs for MPM method.
Figure 9. Output differential stress (Shmax-Shmin) map (natural fracture as white line, Shmax orientation as black short line), where dark blue indicates high differential stress value promoting linear fracture and low values as light blue encourages fracture complexity.
8
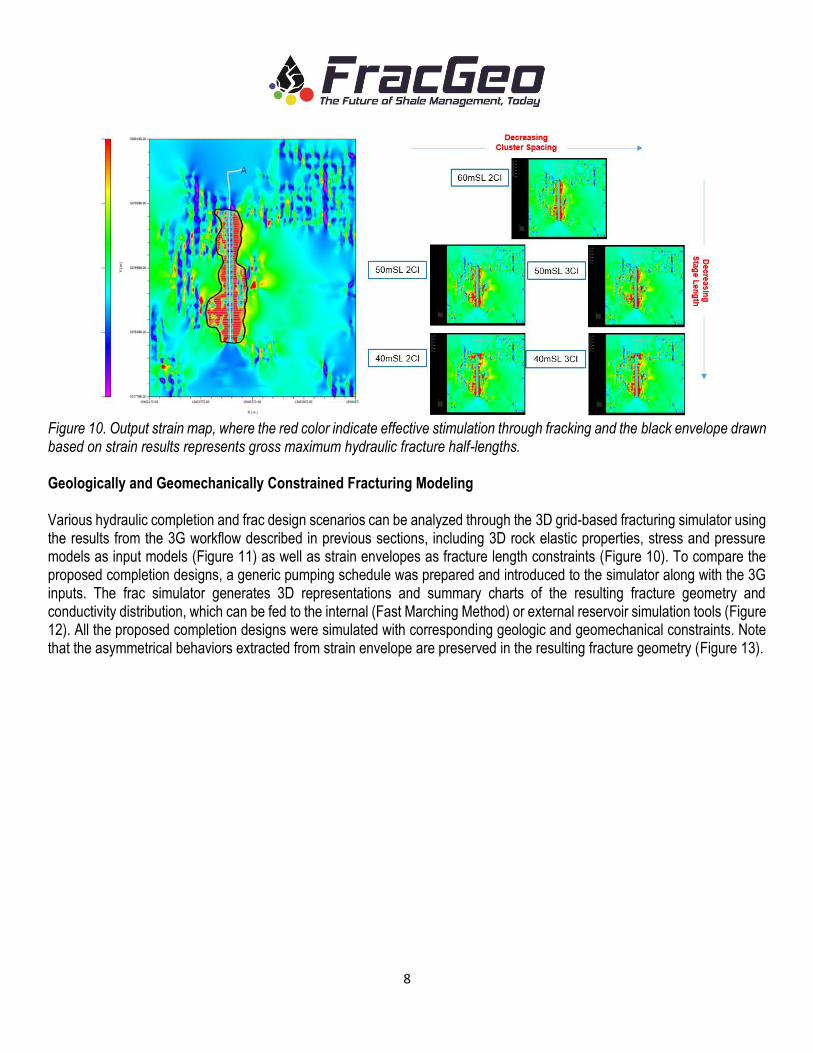
Figure 10. Output strain map, where the red color indicate effective stimulation through fracking and the black envelope drawn based on strain results represents gross maximum hydraulic fracture half-lengths. Geologically and Geomechanically Constrained Fracturing Modeling Various hydraulic completion and frac design scenarios can be analyzed through the 3D grid-based fracturing simulator using the results from the 3G workflow described in previous sections, including 3D rock elastic properties, stress and pressure models as input models (Figure 11) as well as strain envelopes as fracture length constraints (Figure 10). To compare the proposed completion designs, a generic pumping schedule was prepared and introduced to the simulator along with the 3G inputs. The frac simulator generates 3D representations and summary charts of the resulting fracture geometry and conductivity distribution, which can be fed to the internal (Fast Marching Method) or external reservoir simulation tools (Figure 12). All the proposed completion designs were simulated with corresponding geologic and geomechanical constraints. Note that the asymmetrical behaviors extracted from strain envelope are preserved in the resulting fracture geometry (Figure 13).

9
Figure 11. Input models for fracturing modeling that contains the rock properties, stress, and pressure variations in 3D space.
Figure 12. 3D views of the resulting fracture geometry and conductivity distribution (left) and fracture geometry summary charts (right) for 50m stage length and 3 cluster design as an example.

10
Figure 13.Fracturing modeling summary results for proposed completion designs. Production Forecast and Economic Evaluation Finally, the decision on which completion design to select has to rely on productivity forecast and economic considerations. The derived 3D geologic models (for example porosity) and asymmetric hydraulic fracture geometry results with PVT model are fed into a fast reservoir simulator to forecast the production according to a designed bottom-hole pressure scheme for all the proposed completion designs (Figure 14). Although the 40m stage length with 2 cluster design has the earliest production rate due to higher average fracture conductivity values, the 50m 3 cluster design climbs up later owing to the more opened fractures and slightly longer half lengths. Together with operational cost considerations and quick economic analysis (Figure 15), the 50m 3 cluster design is selected as the optimal completion design.

11
Figure 14.Five-year cumulative production forecast for the proposed completion designs.
Figure 15. Quick economic analysis for the proposed completion designs.

12
Frac Hit Mitigation for Well Pad Frac Design Frac hits are a major issue for well pad design where multiple laterals are drilled parallel to each other. The later fracturing treatment of child wells may introduce detrimental effects on the productivity of earlier fractured wells through frac interference and the high fluid pressure during the new treatment may push proppant back to the wellbore and even damage the casing on the affected wells. Thus, geomechanical strain simulations were conducted on this twin-well pad using the selected 50m 3 cluster design to predict the potential well interference during fracking (Figure 16). The high frac hits zones and associated stages on both wells were identified for further adjustments to mitigate interference. For the stages in the potential frac hit zones, the treatment size is reduced to decrease the propped half lengths to avoid well interference; for other stages, the injection rate, fluid and proppant volumes are increased accordingly to achieve max half-length and conductivity under the given constraints (Figure 17). The resulting fracture geometry using optimized frac design showed no interference between the two wells in the potential frac hit zones and the lengths of the other stages were maximized within the given constraints (Figure 18). Additionally, the final production forecast was performed (Figure 18).
Figure 16.Potential frac hits identified using the geomechanical strain simulation on the twin wells.
13
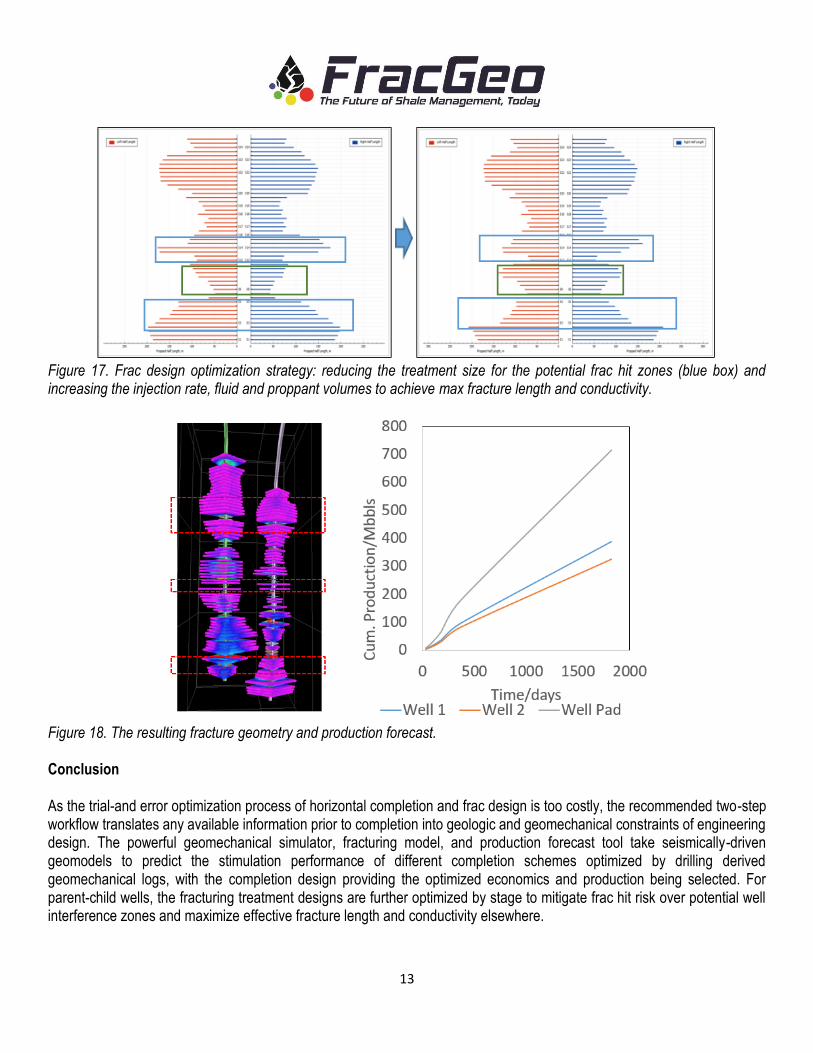
Figure 17. Frac design optimization strategy: reducing the treatment size for the potential frac hit zones (blue box) and increasing the injection rate, fluid and proppant volumes to achieve max fracture length and conductivity.
Figure 18. The resulting fracture geometry and production forecast. Conclusion As the trial-and error optimization process of horizontal completion and frac design is too costly, the recommended two-step workflow translates any available information prior to completion into geologic and geomechanical constraints of engineering design. The powerful geomechanical simulator, fracturing model, and production forecast tool take seismically-driven geomodels to predict the stimulation performance of different completion schemes optimized by drilling derived geomechanical logs, with the completion design providing the optimized economics and production being selected. For parent-child wells, the fracturing treatment designs are further optimized by stage to mitigate frac hit risk over potential well interference zones and maximize effective fracture length and conductivity elsewhere.


![Geology Geophysics in Oil Exploration[1]](https://static.fdocuments.net/doc/165x107/55258648550346f36e8b48a1/geology-geophysics-in-oil-exploration1.jpg)