How to enhance Shareholder Value through a Customer ...660509/FULLTEXT01.pdf · How to enhance...
92
How to enhance Shareholder Value through a Customer support in the Insurance industry: A BUSINESS DRIVEN APPROACH TOWARDS BUSINESS INTELLIGENCE NIKLAS JOHNSON PETER SMOGNER Master of Science Thesis Stockholm, Sweden 2013
Transcript of How to enhance Shareholder Value through a Customer ...660509/FULLTEXT01.pdf · How to enhance...

How to enhance Shareholder Value
through a Customer support in the
Insurance industry:
A BUSINESS DRIVEN APPROACH
TOWARDS BUSINESS INTELLIGENCE
NIKLAS JOHNSON
PETER SMOGNER
Master of Science Thesis
Stockholm, Sweden 2013
How to enhance Shareholder Value through
a Customer support in the Insurance
industry:
A business driven approach towards Business
Intelligence
Niklas Johnson
Peter Smogner
Master of Science Thesis INDEK 2013:71
KTH Industrial Engineering and Management
Industrial Management
SE-100 44 STOCKHOLM
3
Abstract
An increased competitive climate has enhanced the importance for companies to differentiate
from other companies. Today, the customer support within service organizations are often
disregarded as a source of value due to the focus on costs. Further, it has become more
important to leverage the contact with the customer at all encounters. New technological
advancements within Business Intelligence have also enabled companies to increase their
competitiveness through improved decision support. The objective of this thesis is through a
case study investigate how an insurance company could leverage its customer support as a
source of creating shareholder value as well as how to apply trends within Business
Intelligence for increased decision support. This was done through developing a conceptual
model based on academic theory in order to provide a tool for analysis and development of a
customer support. The research questions intends to investigate how an customer support can
contribute to, and balance a focus on service quality, costs and sales in order to enhance
shareholder value. A business driven approach was further used in order to understand how a
customer support could leverage the emerging trends of Business Intelligence. This since the
thesis also aims to provide some first insights into how to leverage the trends of mobile- and
Self-Service- Business Intelligence within the customer support within insurance companies.
The research emphasizes the need to have a holistic view of what drives value and costs with
regard to the retention, growth and acquisition of customers when viewing the customer
support as a source of value. The thesis concludes that both the trends of mobile- and Self-
Service- Business Intelligence could enable an insurance company to gain new insights
through utilizing existing internal as well as external data in order to conduct a more
continuous and flexible analysis of important matters.
Key-words
Insurance industry, Customer Support, Call-Centre, Business Intelligence, Self-Service Business
Intelligence, Mobile Business Intelligence, Shareholder Value, Value creation, Value drivers,
Lean Service, Systems Thinking, Strategic Management, Operational Strategy, Outside-in
thinking, Performance Management, Customer Retention, Customer Satisfaction, Service Quality.
Master of Science Thesis INDEK 2013:71
How to enhance Shareholder Value through a
Customer support in the Insurance industry:
A business driven approach towards Business Intelligence
Niklas Johnson
Peter Smogner
Approved
2013-06-17
Examiner
Pär Blomkvist
Supervisor
Niklas Arvidsson
Commissioner
Ferrologic Business Intelligence
Contact person
Tor Kamsvåg

4
ACKNOWLEDGEMENTS We would like to thank our supervisor, PhD Niklas Arvidsson for the support he has provided
us with throughout the thesis. Thank you for everything. Moreover, we would wish to thank
Tor Kamsvåg and every employee at Ferrologic who have helped us and provided us with this
opportunity. Without you, none of this would have been possible, thank you for everything.
We would like to thank all interviewees and participants who contributed to this thesis.
Niklas Johnson and Peter Smogner
Stockholm, June 2013

5
LIST OF FIGURES FIGURE 1. CHOICE OF RESEARCH METHODS. ........................................................................................................ 15
FIGURE 2. THE THESIS PROCESS ............................................................................................................................ 16
FIGURE 3. THE SERVICE PROFIT CHAIN. ................................................................................................................ 25
FIGURE 4. THE RETURN ON QUALITY MODEL. ...................................................................................................... 27
FIGURE 5. A GENERAL SERVICE BLUEPRINT. ......................................................................................................... 38
FIGURE 6. A TYPICAL DATA WAREHOUSE ARCHITECTURE. ................................................................................... 40
FIGURE 7. A REPRESENTATION OF THE INFORMATION ANALYSIS CYCLE. ............................................................ 43
FIGURE 8. AN ILLUSTRATION OF THE CONCEPTUAL MODEL. ............................................................................... 46
FIGURE 9. THE PROCESS OF A PURCHASE OF A NEW INSURANCE. ....................................................................... 63
FIGURE 10. THE PROCESS OF WHEN THE CUSTOMER ACQUIRED AN INCORRECT PAYMENT. ............................. 64
FIGURE 11. THE PROCESS OF WHEN A CUSTOMER TERMINATED AN INSURANCE. ............................................. 65
FIGURE 12. THE GRAPH DISPLAYS THE DISTRIBUTION OF THE CUSTOMER DEMAND. ......................................... 66
FIGURE 13. A PROBLEM TREE WITH REGARD TO SHAREHOLDER VALUE. ............................................................ 68
6
TABLE OF CONTENT 1. Introduction ............................................................................................................................ 9
1.1 Background .................................................................................................................... 10
1.2 Problem Formulation ...................................................................................................... 11
1.3 Thesis Objective ............................................................................................................. 11
1.4 Research Questions ........................................................................................................ 11
1.5 Delimitations & Limitations ........................................................................................... 12
1.6 Thesis Outline ................................................................................................................ 13
2. Methodology ........................................................................................................................ 14
2.1 Scientific Approach ........................................................................................................ 14
2.2 Choice of Methodology .................................................................................................. 14
2.2.1 Interviews ................................................................................................................ 16
2.2.2 Tallies ...................................................................................................................... 17
2.2.3 Observations ............................................................................................................ 18
2.2.4 Data Analysis .......................................................................................................... 18
2.3 Reliability ....................................................................................................................... 19
2.4 Validity ........................................................................................................................... 20
3. Theoretical Framework ........................................................................................................ 21
3.1 The Insurance Industry ................................................................................................... 21
3.2 The Creation of Shareholder Value ................................................................................ 22
3.3 Service through an Academic Perspective ..................................................................... 24
3.3.1 Existing Models of Services Contribution to value ................................................ 24
3.3.2 Service Quality ........................................................................................................ 27
3.3.3 Customer Satisfaction ............................................................................................. 28
3.3.4 Customer Retention ................................................................................................. 30
3.3.5 Word of Mouth ........................................................................................................ 30
3.3.6 Employee Retention ................................................................................................ 31
3.3.7 Consultative Selling ................................................................................................ 31
3.4 Operational Improvements ............................................................................................. 32
3.4.1 Systems’ Thinking ................................................................................................... 32
3.4.2 Lean Service ............................................................................................................ 33
3.4.3 Service Blueprinting ................................................................................................ 37
3.4.4 Performance Management ....................................................................................... 38
3.5 Business Intelligence ...................................................................................................... 40
7
3.5.1 Data Warehouse ...................................................................................................... 40
3.5.2 Self-Service Business Intelligence .......................................................................... 41
3.5.3 Mobile Business Intelligence .................................................................................. 43
4. Dissertation ........................................................................................................................... 45
4.1 The Conceptual Model ................................................................................................... 45
4.1.1 Overview of the Conceptual Model ........................................................................ 45
4.1.2 Long-term Value ..................................................................................................... 46
4.1.3 The Strategic Level ................................................................................................. 47
4.1.4 The Tactical Level ................................................................................................... 48
4.1.5 The Operational Level ............................................................................................. 49
4.1.6 Continuous Improvement, Purpose, and Waste ...................................................... 50
4.2 Utilizing Data for Value ................................................................................................. 52
4.2.1 Analysis of the Two Trends of Business Intelligence ............................................. 54
4.3 Empirical Results ........................................................................................................... 55
4.3.1 The Call-Centre ....................................................................................................... 55
4.3.2 Interviews ................................................................................................................ 55
4.3.3 Historical Data and Observations ............................................................................ 61
4.3.4 Measurement of customers’ requests ...................................................................... 66
4.4 Empirical Analysis ......................................................................................................... 67
4.4.1 Problem Analysis .................................................................................................... 67
4.4.2 Observation Analysis .............................................................................................. 71
4.4.3 Customer Demand Analysis .................................................................................... 73
5. Conclusions .......................................................................................................................... 77
5.1 Summary ........................................................................................................................ 77
5.2 Concluding the Case ....................................................................................................... 77
5.3 General Conclusions ...................................................................................................... 79
5.4 Reflections ...................................................................................................................... 81
5.5 Future Research .............................................................................................................. 82
6. References ............................................................................................................................ 83
6.1 Primary Sources ............................................................................................................. 83
6.2 Secondary Sources ......................................................................................................... 83
7. Appendix .............................................................................................................................. 91
7.1 The Interview Guide ....................................................................................................... 91
7.2 The Tally ........................................................................................................................ 92

8
This page have intentionally been left blank

9
1. INTRODUCTION The chapter intends to present an introduction and background to the thesis as well as its
problem formulation, research questions, and objective. Further, the outline of the thesis with
its delimitations and limitations are discussed.
In the last century, a tremendous corporate growth and technological improvements have
influenced the industrial dynamics of industries. In relation, new advancements in Information
and Communication Technology (ICT) have sparked the competitive climate, shortened
product life cycles, and in turn, increased the overall performance of companies (Wiggins and
Ruefli, 2005). The globalization along with the competitive climate have given rise the factors
of chance, choice, and variety in today’s society, thus it has progressively become more
complex. (Fingar, 2005; Chaudhuri et al., 2011)
In this complexity and competitive environment, companies do more often invest money in
order to earn a return on this investment in the future. In order for companies to deploy more
capital, they often have different options with regard to financing. A common form is to use
public equity or risk capital that enables investors to buy shares in the company. As the
shareholders of the organisation expect to yield a return on their investment, companies
constantly strive to live up to the short-term expectations while still coping with the survival
of the business (Ekman, 2013). Consequently, a focus on short-term results could provide a
risk and a negative impact on the firm’s health and ability to create long-term value (Koller et
al., 2010).
Thus, organisations in today’s society more often try to reach out to their customers through
additional services, in turn making organisations more service based (Gupta et al., 2006;
Macintyre et al., 2011). Within these service organisations, the short-term pressure has
resulted in managers starting to think of their job as a resource management problem, in order
to cut costs (Seddon, 2010; Macintyre et al., 2011). Companies such as SL and Telenor are
both examples of two Swedish service organizations that have decided to outsource their
customer support due to a focus on costs (Visanji, 2010; Johansson, 2013). This implies that
both these organisations have decided to lose control of their customer service. Moreover, this
focus on costs and short-term earnings have disregarded the focus on creating value through a
sustainable long-term perspective and lead to a governance commonly acknowledged as
‘command-and-control’ in academia (Qiang and Xusong, 2008; Seddon, 2010). This
governance provided by managers is acknowledged to focus on time, budgets, commissions,
pre-established goals, and hierarchical control (Seddon, 2010). However, a survey based on
more than 12000 consumers in 32 different countries found that 85% of the respondents stated
that a company could have done something differently in order to prevent them from
switching to another firm due to poor customer service (Accenture, 2012).
Further, technological advancements such as increased bandwidth, storage, digitized
telecommunications, and computing capacity have enabled the development of more efficient
10
call-centres within service organisations (Ellis and Taylor, 2006). These technological
advancements have enabled call-centres to easier reach out and serve customers, in a more
effective manner (Ellis and Taylor, 2006). These advancements have also further enabled
operations to store information about almost everything. As this information is stored,
customer supports of service organisations are experiencing an overflow of information that
lately has become possible to utilize through Business Intelligence (Sharma and Djiaw, 2011;
Castellanos et al., 2012; Rouhani et al., 2012).
This since Business Intelligence has been acknowledged as a way for organisations to cope
with the present economic environment in order to make smarter and faster decisions (TDWI,
2011). In turn, Business Intelligence has allowed organisations to utilize organisational data
through extraction and collection of several ICT techniques. Thereby provided management
within organisations to capture and statistically analyse information to further use as a base
for decisions and organisational improvements. (Chaudhuri et al., 2011; Gartner Group, 2013)
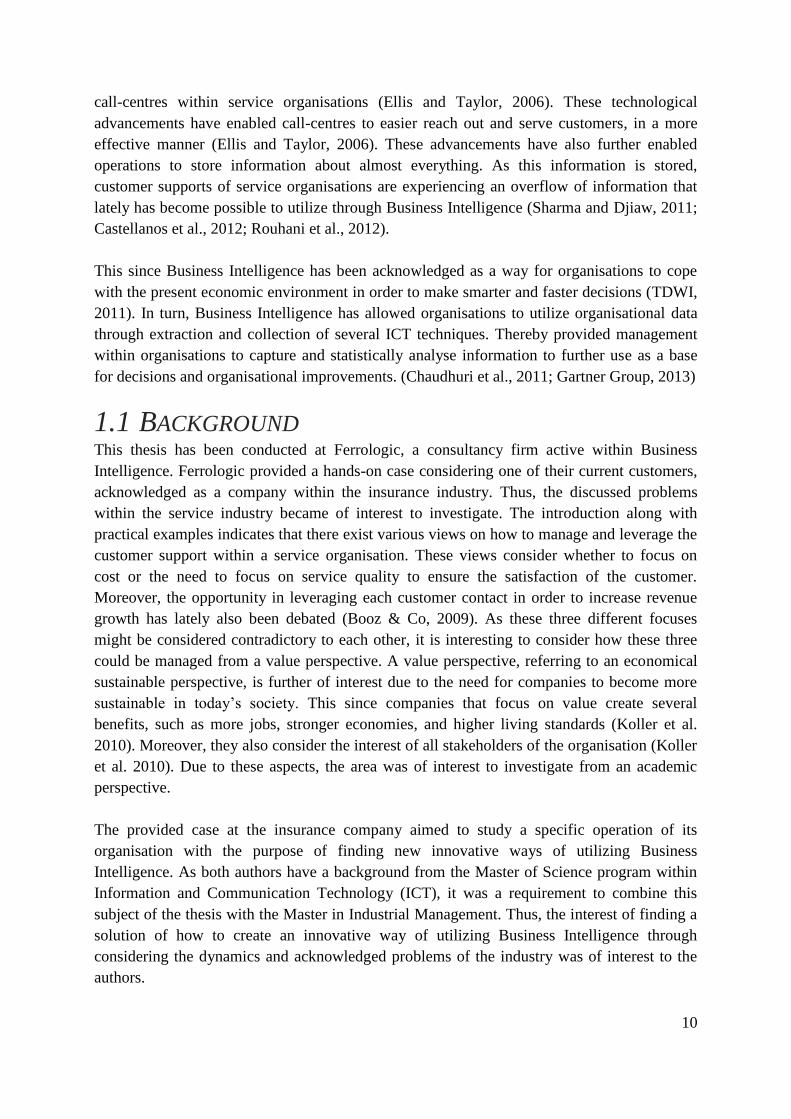
1.1 BACKGROUND This thesis has been conducted at Ferrologic, a consultancy firm active within Business
Intelligence. Ferrologic provided a hands-on case considering one of their current customers,
acknowledged as a company within the insurance industry. Thus, the discussed problems
within the service industry became of interest to investigate. The introduction along with
practical examples indicates that there exist various views on how to manage and leverage the
customer support within a service organisation. These views consider whether to focus on
cost or the need to focus on service quality to ensure the satisfaction of the customer.
Moreover, the opportunity in leveraging each customer contact in order to increase revenue
growth has lately also been debated (Booz & Co, 2009). As these three different focuses
might be considered contradictory to each other, it is interesting to consider how these three
could be managed from a value perspective. A value perspective, referring to an economical
sustainable perspective, is further of interest due to the need for companies to become more
sustainable in today’s society. This since companies that focus on value create several
benefits, such as more jobs, stronger economies, and higher living standards (Koller et al.
2010). Moreover, they also consider the interest of all stakeholders of the organisation (Koller
et al. 2010). Due to these aspects, the area was of interest to investigate from an academic
perspective.
The provided case at the insurance company aimed to study a specific operation of its
organisation with the purpose of finding new innovative ways of utilizing Business
Intelligence. As both authors have a background from the Master of Science program within
Information and Communication Technology (ICT), it was a requirement to combine this
subject of the thesis with the Master in Industrial Management. Thus, the interest of finding a
solution of how to create an innovative way of utilizing Business Intelligence through
considering the dynamics and acknowledged problems of the industry was of interest to the
authors.

11
1.2 PROBLEM FORMULATION Through outsourcing their customer service, service organisations lose control of one of their
potentially most important customer channels due to a focus on costs. Moreover, the
introduction indicated that service organisations are often managed from a resource-
perspective, which in turn could create additional costs in the organisation. One might
therefore assume that service organisations are generally not viewing or leveraging their
customer support as a strategic unit in order to enhance value. Thus, the problem formulation
can be concretized too:
Customer supports within service organisations are often disregarded as a source of value
due to a focus on costs.
1.3 THESIS OBJECTIVE The objective of the thesis is to conduct a case study in order to investigate how an insurance
company could leverage its customer support as a source of shareholder value and how to
apply trends within Business Intelligence for increased decision support. The objective is also
to develop a conceptual model based on academic theory in order to provide a tool for
analysis and development of a customer support.
1.4 RESEARCH QUESTIONS The research questions of the thesis intend to investigate how a customer support of an
insurance company can be managed as a source of value and how it could consider the
different conflicting factors of service quality, costs, and sales. In addition, reviewing the
electronic library of KTH Primo indicate that little research has been conducted regarding the
trends of both mobile- and Self-Service-Business Intelligence and their possible application to
the insurance industry (KTH Primo, 2013). Thus, the research questions of the thesis are:
How could a customer support of an insurance company be managed as a source to
create shareholder value?
How could the factors of service quality, costs and sales be managed in a customer
support of an insurance company in order to create long-term value?
How could the trends mobile- and Self-service- Business Intelligence be applied in a
customer support of an insurance company with regard to value creation?
In order to clarify the research questions, the thesis defines the creation of shareholder value
from a sustainable economic perspective referring to the company’s ability to invest money in
order to yield a higher return in the future.

12
1.5 DELIMITATIONS & LIMITATIONS With regard to the research questions of the thesis, the timeframe is to be considered a
limitation. This as the ability to acquire all necessary data as well as a holistic perspective of
the organisation is limited due to the short period of the thesis. Thus, one delimitation is
acknowledged as that the thesis will only study a specific call-centre of the customer support
of the insurance company. Furthermore, the timeframe will affect the number of study visits
and therefore the collection of data as the targeted customer support is located abroad.
Because of this, only one extensive study visit with regard to studying the operations of the
call-centre will be conducted. Further, as a Non-Disclosure Agreement (NDA) has been
signed with the targeted insurance company, it provides an additional limitation to the thesis
as it may affect the analysis of the obtained results due to confidentiality, thus it may
compromise the reliability of the thesis. Moreover, another acknowledged limitation of the
thesis may derive in the lack of conducted interviews and observations as well as the period of
measurement. Since the researchers aims to investigate how an insurance company could
leverage its customer support as a source of shareholder value, the holistic approach required
can be viewed as a limitation. This as it is hard to foresee how many interviews, observations,
and measurements that are needed to obtain this holistic view of the studied customer support.
Finally, as the concepts of mobile- and Self-Service Business Intelligence are considered the
latest trends within Business Intelligence it has implications on the availability of academic
literature. Researching them will therefore mostly be done through reviewing white papers as
few prior academic studies have been found on their application within the insurance industry.
Thus, the reliability of the thesis and is therefore considered a limitation of it. Furthermore,
real implementations of these trends are considered a delimitation due to policies of the
insurance company and lack of time. Therefore, only suggestions will be made of their
potential application.
13
1.6 THESIS OUTLINE The Methodology presents how the thesis has been carried out in terms of the choice of
methodology and research methods. The chapter further presents and motivates the methods
used during the thesis in detail. Moreover, the chapter discusses the reliability and validity of
the thesis.
The Theoretical Framework presents the reviewed academic theories that are used in the
thesis as a base for developing the conceptual model and provide an understanding of the
researched area. Moreover, the techniques and upcoming trends of Business Intelligence are
reviewed in this chapter.
The Dissertation presents The Conceptual Model built on the analysis of academic theory.
Moreover, the Empirical Results of the conducted case study are presented and analysed in
the chapter. Finally, the opportunities within the trends of Business Intelligence are analysed
and presented.
The Conclusions presents the conclusions drawn from the empirical analysis and their
findings of the research questions. Moreover, reflections of the thesis are presented along
with suggestions of future research.
The References presents the academic sources in terms of references. Moreover, The
Appendix presents the material excluded from the report in terms of The Interview Guide and
The Tally.

14
2. METHODOLOGY The chapter intends to present the methodology as well as the scientific methods that were
chosen for the research, as well as their relevance in order to answer the research questions.
The chapter also discusses the reliability and validity of the thesis in relation to the selected
methodology and methods.
2.1 SCIENTIFIC APPROACH The subject of the thesis was considered since none or only a limited amount of academic
research had been conducted within the area of mobile- and Self-Service Business
Intelligence and their application to the insurance industry. Thus, the research is considered
exploratory in its nature (Collis and Hussey, 2009). This approach is important to consider
since the thesis aims to find new ideas of how to manage an organisation with regard to value
and utilize the new trends within Business Intelligence. Since academic literature is to be
reviewed in order to provide an understanding of the existing theories and synergies of the
reality to be explored, a deductive approach has been considered (Bryman and Bell, 2011). In
addition, as empirical findings are to be viewed as new theory to further analyse and draw
conclusions upon, an inductive approach has also been considered in the thesis (Collis and
Hussey, 2009).
Furthermore, as the thesis concerns sustainability through an economical perspective and
relates to financial service organisations, a social scientific approach is considered due to the
attention to social phenomenon (Collis and Hussey, 2009). Thereby assumptions that each
individual possesses his or her own sense of reality will be accounted for, although with an
understanding that through a wider perspective reality can generalized (Collis and Hussey,
2009). Thus, the thesis do not intend to present a holistic picture of the current reality as the
thesis have been limited to only one case study. All the approaches of the thesis are
acknowledged as a mixture of both the research paradigms positivism and interpretivism
(Collis and Hussey, 2009; Bryman and Bell, 2011). Thus, a combination of both is to be
considered to achieve the best answer to the researched questions.
2.2 CHOICE OF METHODOLOGY The thesis was conducted at Ferrologic, a consultancy firm active within Business
Intelligence, which in turn provided a case in an insurance company. The case aimed to study
new, innovative ways of utilizing Business Intelligence within the targeted call-centre of the
insurance company. Thus, the methodology of a case study was considered academically as it
can utilize various methods for collecting data (Collis and Hussey, 2009). Three different
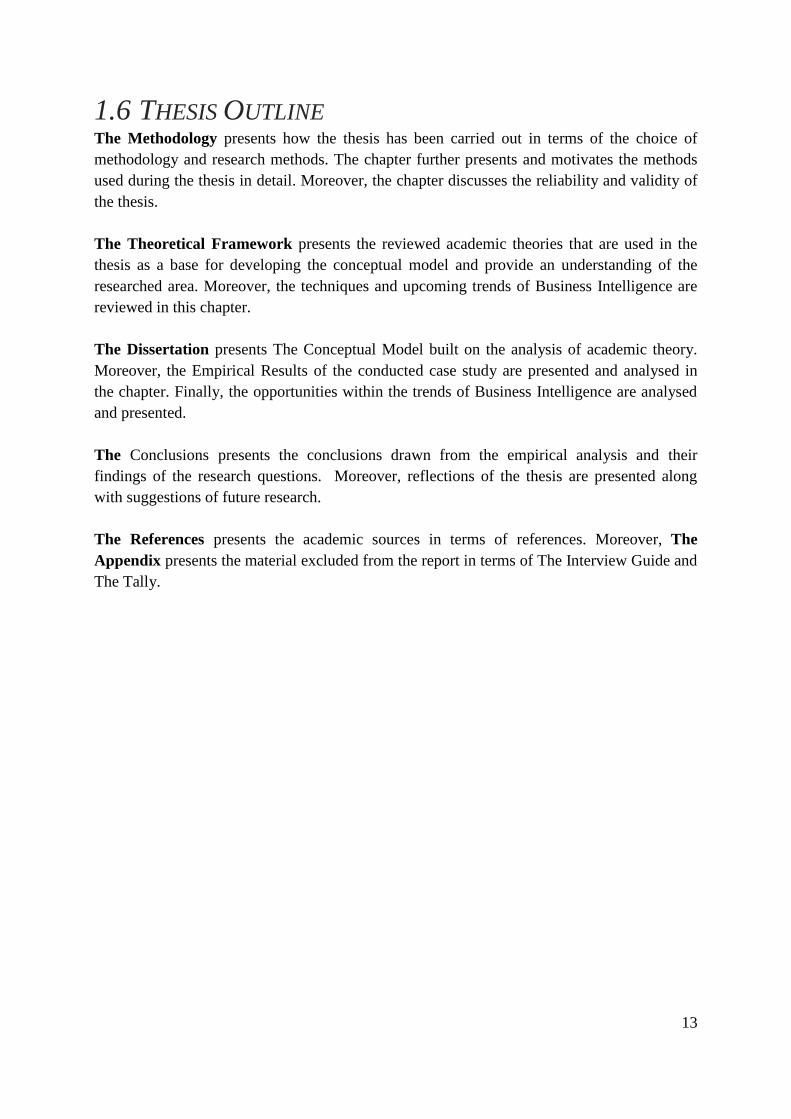
methods were chosen in order to collect data to obtain a holistic and objective view of the
call-centre as well as an understanding of the insurance company (illustrated in Figure 1).
Tallies intended to collect data in order to obtain an understanding of the purpose and possible
15
Figure 1. Choice of research methods.
problems within the call-centre from the customer’s perspective. Further, interviews were
conducted in order to get a wider and deeper understanding of the call-centre from the
perspective of the employee’s at different levels of the call-centre. Finally, observations were
made with the purpose of establishing an independent view of the operations within the call-
centre. The combination of the results provided from all of these three different methods
intends to enable the researchers to get a holistic and objective view of the problems and
opportunities within the call-centre. This view would then be used to provide answers to the
questions through an understanding of how to improve the call-centre with regard to
shareholder value. This as well as through a business driven approach, suggest how to
leverage the emerging trends of Business Intelligence within the call-centre.
Furthermore, the methodology of a case study was chosen as it provides the possibility to
study academia and still obtain a close connection to reality, even if an exploratory approach
was considered (Collis and Hussey, 2009). Therefore, conducting a case study enabled
continuous iterations of learning in order to understand the gap between academic literature
and reality. Furthermore, a case study provided a structured process of conducting the
research (Collis and Hussey, 2009). In addition, as there are different types of case studies, an
approach towards an opportunist case study was taken since the company (i.e. Ferrologic)
allowed access to a particular business (Collis and Hussey, 2009). According to Collis and
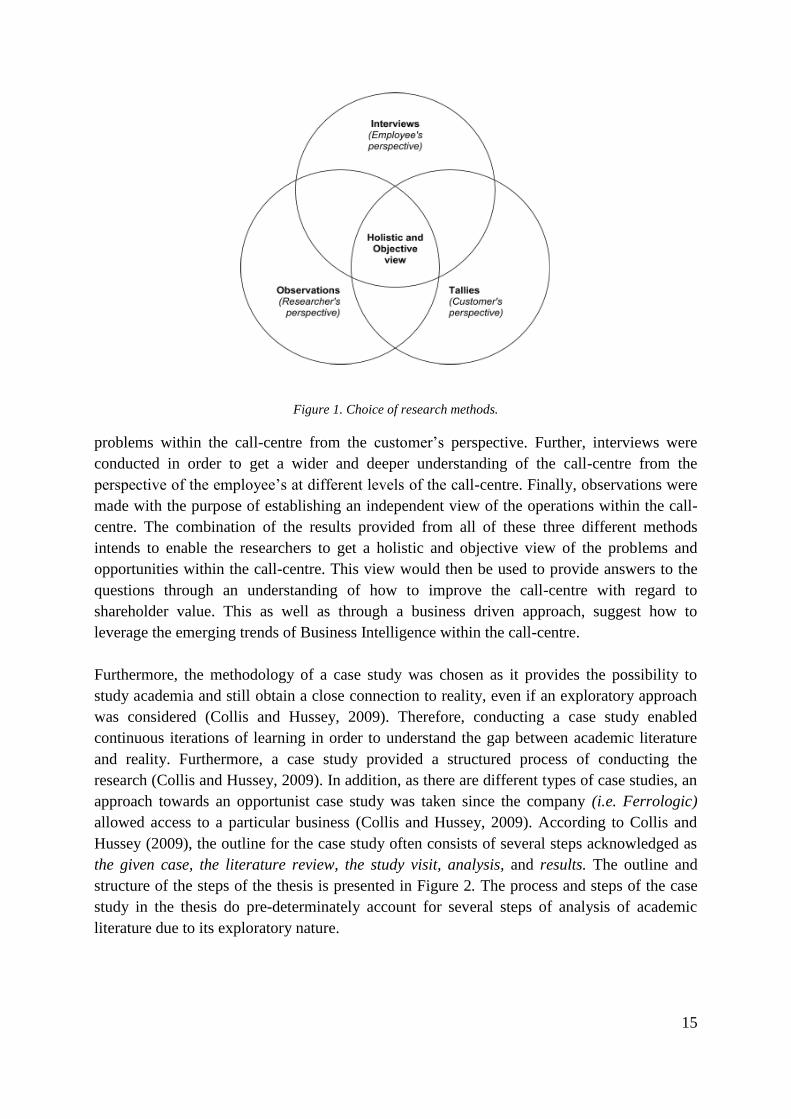
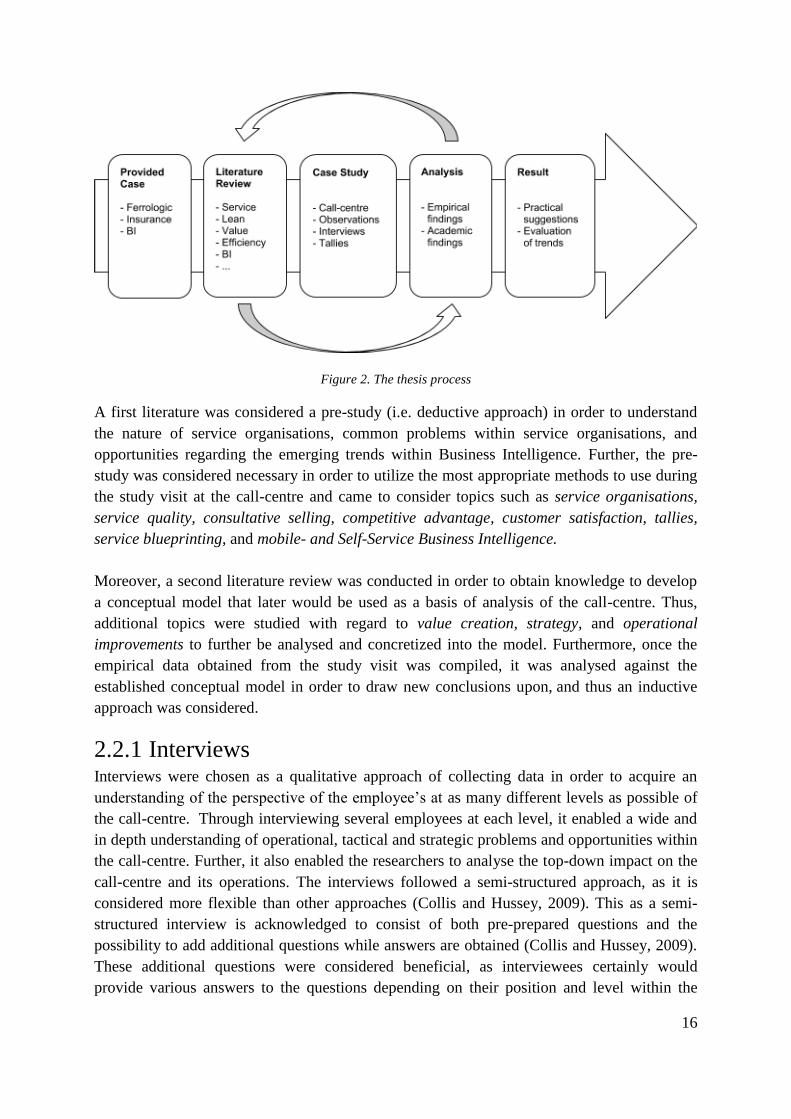
Hussey (2009), the outline for the case study often consists of several steps acknowledged as
the given case, the literature review, the study visit, analysis, and results. The outline and
structure of the steps of the thesis is presented in Figure 2. The process and steps of the case
study in the thesis do pre-determinately account for several steps of analysis of academic
literature due to its exploratory nature.
16
Figure 2. The thesis process
A first literature was considered a pre-study (i.e. deductive approach) in order to understand
the nature of service organisations, common problems within service organisations, and
opportunities regarding the emerging trends within Business Intelligence. Further, the pre-
study was considered necessary in order to utilize the most appropriate methods to use during
the study visit at the call-centre and came to consider topics such as service organisations,
service quality, consultative selling, competitive advantage, customer satisfaction, tallies,
service blueprinting, and mobile- and Self-Service Business Intelligence.
Moreover, a second literature review was conducted in order to obtain knowledge to develop
a conceptual model that later would be used as a basis of analysis of the call-centre. Thus,
additional topics were studied with regard to value creation, strategy, and operational
improvements to further be analysed and concretized into the model. Furthermore, once the
empirical data obtained from the study visit was compiled, it was analysed against the
established conceptual model in order to draw new conclusions upon, and thus an inductive
approach was considered.
2.2.1 Interviews Interviews were chosen as a qualitative approach of collecting data in order to acquire an
understanding of the perspective of the employee’s at as many different levels as possible of
the call-centre. Through interviewing several employees at each level, it enabled a wide and
in depth understanding of operational, tactical and strategic problems and opportunities within
the call-centre. Further, it also enabled the researchers to analyse the top-down impact on the
call-centre and its operations. The interviews followed a semi-structured approach, as it is
considered more flexible than other approaches (Collis and Hussey, 2009). This as a semi-
structured interview is acknowledged to consist of both pre-prepared questions and the
possibility to add additional questions while answers are obtained (Collis and Hussey, 2009).
These additional questions were considered beneficial, as interviewees certainly would
provide various answers to the questions depending on their position and level within the

17
company. Thus, these semi-structured interviews were considered beneficial in order to obtain
the needed holistic perspective to understand the needs, governance, and priorities of the call-
centre. Therefore, pre-prepared questions were suitable to determine the general view among
employees. In addition, the possibility to add and extend questions was considered beneficial
since the answers and insights could vary according to the position of the employee.
The interview questions were developed and based on academic articles regarding governance
and common issues in service organisations that are acknowledged in academia. This
problematic approach was considered necessary, as problems and opportunities had to be
identified and further analysed in order to enable the researchers to answer the research
questions. Thus, the interviews in the case study were to take a problematic perspective. The
questions in the interviews were following an open-ended structure in order to obtain in-depth
answers (Collis and Hussey, 2009). In order to not provide any bias and impact to the answers
of interviewees, the interviews were being conducted in an objective and clear manner were
the purpose of the interviews was clearly explained and questions clarified if not directly
understood. Moreover, as answers were obtained, they were repeated to the interviewee in
order to provide a correct and mutual understanding of the interviewee’s answer. The
interview guide used in all interviews can be found in the Appendix under The Interview
Guide.
2.2.2 Tallies Tallies were chosen as a quantitative approach of collecting data in order to get an understanding
of the purpose of the call-centre from the perspective of the customer through analysing the
incoming demand. The perspective of the customer was an important aspect to consider with
regard to understanding possible organizational improvements. According to Collis and Hussey
(2009), a tally is acknowledged as a way of recording and counting frequencies in answers to
open questions. The tallies that were used in the thesis aimed at obtaining an indication of
what incoming phone calls considered. This as academic literature advocated measurement of
the subject of incoming calls in order to understand potential problems (Seddon, 2010). These
tallies were first developed and further refined by operators and managers within the call-
centre in order to provide clearer choices for the operators. This approach was considered
since the language used in the context of the questions could differ due to professionalism.
Since a tally is used to count the frequency of an open question (Collis and Hussey, 2009), the
used tallies were created to answer the question of “What do customers ask/want?” Thus, the
tallies aimed to review the customer needs in order to understand enable the analysis of the
call-centre from a customer’s perspective. The tallies were further distributed to the workforce
within the call-centre that was answering incoming activities. A representation of the tally can
be found in the Appendix under The Tally of the thesis along with its categories and
subcategories. Furthermore, the obtained results of all answers are presented in the Empirical
Results in the Dissertation.

18
2.2.3 Observations Observations were chosen as a qualitative approach of collecting data to experience and acquire
an independent view of the operations of the call-centre. This was important in order to relate and
compare the results from the other methods. According to Collis and Hussey (2009),
observations are acknowledged as a method for collecting data by observing and recording
people´s actions and behaviour. During the study visit, non-participant observations were
conducted due to the nature of a call-centre where incoming calls can be intercepted. These
observations were conducted through using the process mapping tool of Service blueprint
(Shahin, 2010; Sampson; 2012). The choice of Service blueprint was further considered as it
was advocated to be suitable to use in a service context (Shahin, 2010; Milton and Johnson,
2012). In addition, the Service blueprint was also convenient to use due to its consideration of
the customer and not just internal aspects within the call-centre (Milton and Johnson, 2012,
Sampson, 2012). Hence, observations enabled the research to connect and combine the
perspective of the customer together with the behaviour of the operator’s in order to retrieve a
holistic and objective analysis of the call-centre.
Through this process-mapping tool, calls were mapped and further potentially discussed with
the operator in between incoming calls to clarify potential misunderstandings in the mapping
process. In addition, as operators also answered incoming chat-sessions and mails, these
processes were not being mapped because they rarely change subject or just contains a single
question to answer. All observations were conducted during the same study visit at the call-
centre. The aim of the observations was to obtain an insight into how work was executed
within the call-centre and how it affects the customers of the organisation. The results of these
observations are presented in the chapter named Empirical Results.
2.2.4 Data Analysis Since a deductive approach was considered during the early stages of the thesis, reviewed
academic literature was analysed at several points and in different aspects (Collis and Hussey,
2009). Thus, the first literature review aimed to analyse the academic findings regarding the
service industry as well as Business Intelligence. Moreover, as the objective of the thesis
partly aims to develop a conceptual model, additional reviewed literature came to consider
models focusing on value creation, service quality, lean service, and customer satisfaction.
These academic theories were then to be analysed and used as a basis for the building a
conceptual model in order to understand how a customer support can contribute to value in an
insurance company. The conceptual model was then applied to the researcher’s holistic and
objective view of the call-centre obtained through the study visit in order to conduct a holistic
problem analysis with regard to the creation of shareholder value. This problem analysis was
then used in order to answer the research questions.
19
2.3 RELIABILITY Reliability is acknowledged as whether the results of a study would differ as if the study was
repeated (Collis and Hussey, 2009; Bryman and Bell, 2011). Since the thesis considered the
case study of a call-centre through a holistic perspective with the aim to obtain an
understanding of the operation and its needs, the reliability in obtaining this perspective has
been considered. This since the primary sources of interviews considers several employees at
various levels within the call-centre; these will allow general statements to be recognized. As
several managers are to be targeted for interviews, their reliability as primary sources are
considered trustworthy. Conducting interviews with several people further advocates the
possibilities of avoiding bias statements in relation to only targeting a specific level or few of
employees. Although, as interviews are to be conducted, the tacit knowledge obtained from
these will be difficult to translate and mediate, which in turn might affect the reliability of the
thesis.
Moreover, the observations will use the mapping tool referred to as a Service blueprint. This
tool enables the mapping of the process through the viewpoint of the customer. Although
observations can be repeated, the results will differ to a high degree since only incoming calls
are studied. However, as the purpose of the observations aims at capturing an independent
view of the daily work of an operator from the customer’s perspective, it can be captured if
repeated, but with different results as operations may change.
As the previous aspects have considered reliability of the primary sources of the thesis, the
secondary sources consider the reviewed academic literature as well as the historical data
provided by the insurance company. Reviewed literature will be gathered mainly from
electronic journals available at the online library of KTH Primo. Academic articles will be
chosen due to their relevance to the researched area as well as their popularity through being
referenced in other academic in order to provide a high reliability. In addition, as these
academic articles are available through KTH Primo, additional online libraries are not
reviewed. Moreover, as books available at the KTH main library will be reviewed, these along
with the electronic articles are considered to strengthen the reliability of the thesis. Regarding
the historical data obtained from the insurance company, it will be consistent if reused and
thereby considered reliable.
With regard to the tallies, the distribution of the activities might vary depending on various
factors such as which month of the year the measurement are made. However, as the intention
of the tallies is to get a basis for analysing the customer requests affecting the call-centre, this
will not affect the reliability of the thesis. However, as the tallies intend to answer the
question of what the customers are asking and all potential choices to the question are
predetermined, other potential answers may be left out. This due to the difficulty in foreseeing
all possible questions customers may ask. In addition, the predetermined answers filled by the
operators may be misinterpreted. Thus providing an incorrect picture over the measurement
and thereby affecting the reliability.

20
2.4 VALIDITY With regard for the validity, the results of the thesis may not appropriately reflect the
phenomena under study. This since only one single case study is considered; therefore, the
difficulty in generalizing the results will be apparent since the situation of other call-centres
may not conclusively be the same. Considering the construct validity advocated by Collis and
Hussey (2009) as non-measurable factors affecting research and further acknowledged as
motivation, anxiety, and satisfaction, these have been considered to the largest extent
possible. Although, the construct validity of the authors can be discussed as a problematic
perspective is considered in the interviews. In order to account for these, the study visit aimed
at conducting as many interviews as possible to get a general impression of the
employees. Moreover, as the validity concerns that the results of the conducted measurement
reflects what is intended to be measured, this aspect can be reflected in the tallies (Collis and
Hussey, 2009). As the measurements obtained through the distributed tallies intend to
determine the subject of incoming calls, these measurement will reflect that the measurement
will actually measure what is intended. Although, as one of the predetermined answer was
labelled “other”, other potential not considered answers may be filed under this label, thus
affecting the validity.

21
3. THEORETICAL FRAMEWORK The chapter intends to present academic theories to acquire an understanding of their
relation to the thesis. Thus, it starts with the characteristics of the insurance industry and a
description of the concept of shareholder value. Moreover, it presents general aspects with
regard to customer satisfaction and how it can be achieved as well as its effects. Further, it
presents theory of how organisations can manage their operations in a cost efficient manner
and ends with a presentation of Business Intelligence and its trends. All the reviewed parts of
the theoretical framework intends to provide an understanding of what to consider during the
study visit of the call-centre and further a base of knowledge needed to build the Conceptual
Model.
3.1 THE INSURANCE INDUSTRY In order to provide an understanding of a customer support (e.g. call-centre) within the
insurance industry, these companies have to be distinguished from other service organisations.
According to Bazini et al. (2011), an insurance company is categorized as a financial service
organisation and therefore acknowledged as more complex than a standard service
organisation. This is also advocated by Krishnan et al. (1999) as the authors argue that
financial service organisations such as an insurance company do distinguish itself from other
service organisations and fall somewhere in between manufacturing- and full-service-
companies.
Since an ordinary service organisation must focus on its services, it becomes convenient to
organize and structure the organisation differently from a manufacturing organisation
(Koskina and Keithley, 2010; Macintyre et al., 2011; Slack and Lewis, 2011). One of the
major differences that service organisations have to consider is the change of psychological
condition that a service provides. These changes are referred to as the feelings, memories, and
behaviour that are conveyed by a service (Slack and Lewis, 2011). In addition, the main
characteristics that differentiate service organisations from manufacturing organisations are
accounted for as customer interaction, variation, and intangibility (Koskina and Keithley,
2010). The customer interaction becomes evident since service have to cope with the
involvement of the customer, consequently leading to a variation in services as it can differ
according to both context and customer (Koskina and Keithley, 2010; Macintyre et al., 2011).
Another aspect that service organisations have to consider compared to manufacturing
organisations is the service as a product. In academia, it is well established that service as a
product is seen as intangible (Lewis, 1998; Kasper, 2002; Macintyre et al., 2011; Slack and
Lewis, 2011). This as a service is not viewed as a physical object and can therefore not be
touched (Parasuraman et al., 1985; Lewis, 1998; Macintyre et al., 2011). As services cannot
be evaluated or tested in advance, this contributes a new complexity, as customers have to put
their trust in the service before evaluating it (Lewis, 1998). Therefore, service organisations
have to consider and make efforts in gaining the customers trust through establishing a close

22
relation to their customers (Shemwell et al., 1998). Regarding insurance companies, this
distinction is evident as the frequency of contact can differ between the organisation and the
customer (Bazini et al., 2011). This because the interaction between customer and
organisation is limited and a customer may necessary not use the provided service during their
entire relationship with the insurance company (Krishnan et al., 1999; Bolton et al. 2004;
Bazini et al., 2011).
Moreover, when a customer wants to buy an insurance, it becomes important for an insurance
company to try to predict the future earnings as well as payments made against that customer
(Tettamanzi et al., 2004). According to Tettamanzi et al. (2004), the profitability of a customer
can be available by the estimated and forecasted Customer Lifetime Value (CLV) of the customer.
This as each customer pays a premium for its insurance, the CLV can be explained as all future
payments, negative the expenses paid for the customer triggering the insurance (Tettamanzi et al.,
2004; Gupta et al., 2006). Thus, it becomes essential for insurance companies to create and sustain
long-term relationships with their customers in order to become profitable (Gupta et al., 2006).
Moreover, according to Gunther et al. (2011), insurance companies cannot rely on steady
relationships as their customers can transfer between other insurance providers and thereby
change their CLV. This have in turn made it crucial for insurance companies to retain their
customers (Gunther et al., 2011). Managers have therefore subsequently turned their focus
towards establishing long-term relationships in order to retain their customers (Bazini et al.,
2011). According to Bazini et al., (2011), the longer the lifetime of the customer can be extended,
the higher the benefits. In relation, Bolton et al. (2004) further argue that activities that increase
retention and cross selling have the greatest payoffs when accounting for the CLV.
3.2 THE CREATION OF SHAREHOLDER VALUE The value of a company can be calculated in various ways. One established approach when
calculating the fundamental value of a company is to use the Discounted Cash-Flow Model
(DCF). In this model, value is defined as all of the future earnings of a firm available to all
investors such as equity holders, debt holders and non-equity holders discounted to the Net
Present Value (NPV) (Koller et al., 2010). The average cost of capital of investors is used
when discounting the FCF (Koller et al., 2010). Hence, the earnings generated from the cash
invested in the business must exceed the cost of capital of the investors in order for the
company to create value (Hill and Zeller, 2008; Koller et al., 2010).
Further, it is important to understand that more value is created through the firm’s ability to
generate higher free cash flows (FCF) and through lowering the risk of the business (Koller et
al., 2010). FCF is the cash generated by the core operations of the firm available to the
investors after deducting new investments for the future (Koller et al., 2010). Risk is
therefore important as it decreases the return that debt and equity holders require investing or
borrowing money to the business. However, FCF alone is not sufficient in order to understand
whether value is created as decisions (e.g. reduction of R&D expenses) might enhance the
FCF in the short-term but destroy the firm’s ability to generate higher FCF in the long-term

23
(Koller et al., 2010). Instead, the analysis of the firm’s ability to yield FCF should be further
divided into the firm’s ability to grow revenues and the firm’s ability to earn money on the
money invested in the business (Koller et al., 2010). This is also confirmed by Kaplan and
Norton (2004) who describe that long-term shareholder value is created through revenue
growth (i.e. selling more) and productivity improvements (i.e. less direct and indirect
expenses and more effective use of physical and financial assets).
As strategy is considered to be central in value creation, Kaplan and Norton (2004, pp. 4) describe
an organization’s strategy as “How it intends to create value for its shareholders, customers, and
citizens”. Strategic decisions must be made with the goal of creating value for the firm (Fitzroy
and Hulbert, 2005; Koller et al, 2010). Nevertheless, as the environment of companies is
constantly changing, strategic managers need an external perspective on the world in order to
change as fast as or faster than this environment (Fitzroy and Hulbert, 2005). Further, it is
important that the operations are aligned to the strategic goals in order to increase business
performance (Cao et al., 2012). A lack of alignment can according to Fitzroy and Hulbert (2005)
create problems such as organizational misdirection, create slow decision making and wasted
effort.
The desire to maintain a sustainable competitive advantage is acknowledged as the core concept
of business strategy (Wiggins and Ruefli, 2005; Koller et al., 2010). According to Srivastava et al.
(2001), the most fundamental question regarding corporate survival regards for the understanding
of how to create such a sustainable competitive advantage. In addition, it is argued that a company
can only sustain increased value creation if it has a durable competitive advantage (Wiggins and
Ruefli, 2005; Koller et al., 2010). Moreover, Koller et al. (2010) argue that businesses with the
most impressive returns often combine more than one competitive advantage. In addition, Koller
et al. (2010) also argue that competition tends to remove competitive advantages, which implies
that companies must continuously find new sources of advantages in order to create long-term
value. In relation, during their study Wiggins and Ruefli (2005) found that the period of time
companies could enjoy a sustained competitive advantage has actually been growing shorter over
the years. In relation, Wiggins and Ruefli (2005) speculate that this result might be an implication
of advancements within IT, which has shortened the competitive response time through for
instance, Business Intelligence. In relation, a company not able to prevent its competitors from
duplicating its competitive advantage will be short-lived (Koller et al., 2010). Furthermore,
Verhoef and Lemon (2013) advocate that customer-centric strategies are crucial in order for firms
to outperform their competitors. In addition, Epetimehin (2011) argues that insurance companies
can find a competitive advantage through marketing, innovation, and creativity.
In the article by Srivastava et al. (1998), the authors describe and illustrate how market-based
assets are important contributors to shareholder value. There, customer relationships (e.g.
brands and the firm’s customers) and partner relationships are both advocated contributing to
an increased market performance (Srivastava et al., 1998). This in turn contribute to several
valuable factors such as faster market penetration (e.g. trials, referrals, adoption), the ability
to charge a price premium, lower sales and service costs, a higher customer perceived value,
and the retention as well as creation of loyal customers (Srivastava et al., 1998). Finally, an

24
increased market performance creates shareholder value through their linkage to the drivers of
the DCF model, hence through enhancing free cash flow, decreasing risk, and increasing
long-term profitability (Srivastava et al., 1998). Moreover, increased brand equity enables
companies to charge a price premium and increases the responsiveness to advertising and
promotion on the mark. Hence, it decreases the costs of sales and marketing.
Moreover, Verhoef and Lemon (2013) state that firms must clearly understand what drives
customer acquisition, retention, and growth over time. Furthermore, Gupta et al. (2006) along
with Verhoef and Lemon (2013) advocate that it is important to focus on increasing the CLV
as a metric in order to increase long-term profitability of the firm. As the CLV represents the
value of all of the future profits earned from a customer during the customer’s lifetime within
the firm, it builds on the same principle as the discounted cash flow model (Koller et al.,
2010). This model therefore emphasises the need to focus on the right customers (Kamakura
et al., 2002). Further, Srivastava et al. (1998) advocate that companies must both grow their
customer base and eliminate unprofitable customers in order to create shareholder value.
Gupta et al. (2006) further advocates for a framework, which highlight the links regarding
CLV to illustrate the impact of it on firm value. In addition, Gupta et al. (2006) further
advocate that the marketing program of a firm have an impact on the behaviour of customers,
which in turn affect acquisition, retention and cross selling. The CLV as a model requires a
good estimation of both customer profitability and cost (Gupta et al., 2006). Hence, there is a
problem of understanding which costs to include in the calculation of customer costs such as
marketing costs and distribution costs (Gupta et al, 2006). Moreover, Gupta et al. (2006) state
that retention costs are difficult to quantify and further advocate that there are issues regarding
incentive structures that optimize the outcome of both the acquisition and retention of
customers. A separate focus might be suboptimal as a focus on maximizing acquisition might
imply the acquisition of customers with a low CLV, hence not optimal in regard for firm
value (Gupta et al., 2006). Hence Gupta et al. (2006) conclude there is a need to develop
incentive structures that combines these two in order to provide value to the firm. Finally,
Gupta et al. (2006) state that a strict focus on CLV will reduce the customer base to include
more profitable customers, which further might have implications with regard to financial
markets.
3.3 SERVICE THROUGH AN ACADEMIC PERSPECTIVE This subchapter intends to review academic models regarding the most acknowledged factors
within service. Thus, models as the Service Profit Chain and Return on Quality model are
reviewed. Moreover, the academic theories of service quality, customer satisfaction, word of
mouth, customer retention, and employee retention are presented in the chapter.
3.3.1 Existing Models of Services Contribution to value Shemwell et al. (1998) state that having a high service quality and satisfied customers are
crucial in gaining a sustainable competitive advantage. In addition, Blocker (2011) argues that
business marketers agree to that there is a need to understand the drivers of customers more

25
precise. Understanding customers have through the use of IT become more common as firms
invests more in customer databases to better understand, oversee, and influence them
(Verhoef and Lemon, 2013). In addition, Flint et al. (2010) also advocates this by arguing that
companies today have to be better than its competition in understanding and offering what
customers value, both present and in the future. Blocker (2011) argues that support is one
important factor along with personal interaction, perceptions of offered quality, and provider
know-how and that these together contribute positively to customer value.
Furthermore, Kamakura et al. (2002) argue that it is important to include the cost of acquiring
customers in the cost of a service operation. This as acquiring a customers can be up to ten
times as expensive as retaining customers and that there is a higher cost in bringing new
customers to the same level of profitability as an existing one (Srivastava et al., 1998; Kaplan
and Norton, 2004; Ang and Buttle, 2006). In addition, Gupta et al. (2006) present findings in
their study that a one percent increase in customer retention has almost five times more
impact on firm value compared to a one per cent change in cost of capital or discount rate
which is also advocated by Ang and Buttle (2006). Moreover, Kamakura et al. (2002)
advocate that companies need to optimize the cost of customer acquisition and the operational
costs of service. This is especially important in competitive industries where acquisition costs
are likely to be higher (Kamakura et al., 2002). Moreover Kamakura et al. (2002) also indicate
that in order to become more profitable, companies need to be successful in both retaining
customers and having efficient operations.
The Service Profit Chain (SPC) and Return on Quality Model (ROQ) are two reviewed
models that illustrate how a firm can derive financial value through the improvement of its
service operations. These models are according to Kamakura et al. (2002) aimed at driving the
firm’s operations through the statistical analysis of distributed customer surveys. In addition,
Kamakura et al. (2002) further argue that these two models should be seen as complementary
models to the customer-based approaches such as the CLV model. This as the CLV model
focus more on attracting and retaining the right customers while the SPC- and ROQ- model
have a larger focus on the drivers of service quality and customer satisfaction (Kamakura et
al., 2002). An illustration of the SPC model and its links is illustrated in Figure 3.
Figure 3. The Service Profit Chain.

26
The SPC was developed by a group of researchers at Harvard University during the 90s
(Heskett et al. 1994). The model illustrates the suggested relationships between profitability,
customer loyalty, employee satisfaction, employee loyalty, and productivity (Heskett et al.
1994). The service profit-chain supports companies in determining what drives their profit
and how to manage an organization in order to achieve long-term profitability. Heskett et al.
(1994) stresses the importance that managers must pay attention to the factors that drive
profitability in service organizations. These factors include the recruitment and development
of employees, incentive structures, and supporting technology (Heskett et al., 1994). The
proposed causality in the service profit chain can be summarized as follows: the profit and
growth of a firm is stimulated primarily by customer loyalty (Heskett et al., 1994; Ang and
Buttle, 2006; Khan, 2012). Moreover, customer loyalty is driven by customer satisfaction,
which in turn is mainly driven by the value of the provided service to the customers according
to (Heskett et al., 1994). This is supported by Srivastava et al. (1998) as the authors state that
the FCF volatility is decreased when customer retention, loyalty and satisfaction are
enhanced. In addition, Heskett et al. (1994) also argue that satisfied, loyal, and productive
employees create service value. Finally, the employee satisfaction is a result of high quality,
internal support and policies that enable employees to deliver high results to the customers
(Heskett et al., 1994). Furthermore, Heskett et al. (1994) advocate that one important driver of
employee satisfaction is the ability and authority for employees to achieve these high results
for customers. However when assessing this model, Kamakura et al. (2002) emphasise that
companies need to consider how customer satisfaction is linked to the customer behaviour in
the context of the firm, which makes it important to analyse firm specific data. Kamakura et
al. (2002) also advocate that a holistic view over the company is needed in order to
understand what to focus on, and not just the isolated links presented in the models of SPC
and ROQ.
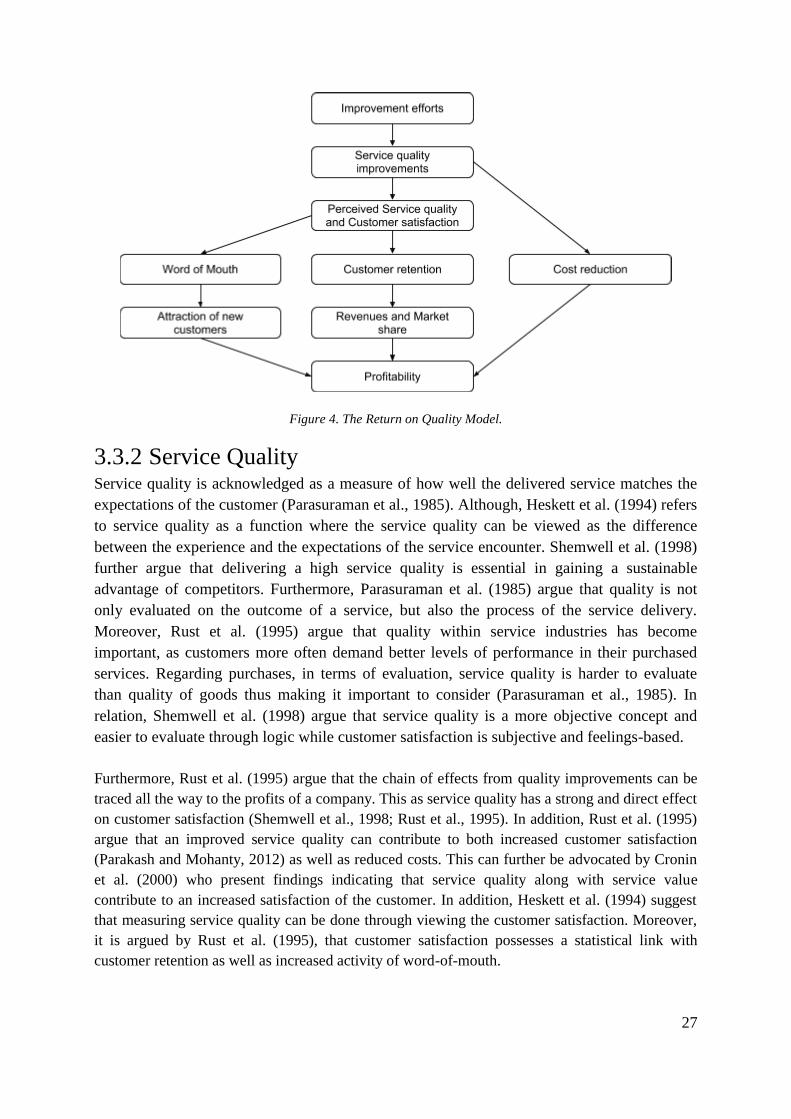
Moreover, the Return on Quality Model developed by Rust et al. (1995) intends to describe an
approach to make quality expenditures financially accountable. It is based on the four
assumptions that quality is an investment, quality efforts must be financially accountable, it is
possible to spend too much on quality, and not all quality expenditures are equally valid (Rust
et al., 1995). The model illustrates the relationship between quality improvement efforts and
profitability as a chain of effects (Rust et al, 1995). The relationships in the model can be
summarized as successful improvement efforts result in an improved service quality and cost
reduction and is presented in Figure 4. This in turn leads to a higher perceived service quality
and customer satisfaction. This in turn provides a positive effect on the retention of the
customers, which drives revenues, and market share, which has a positive impact on the
profitability of the firm. Moreover, the model advocates that word of mouth can be used in
order to attract new customers. (Rust et al., 1995)
27
Figure 4. The Return on Quality Model.
3.3.2 Service Quality Service quality is acknowledged as a measure of how well the delivered service matches the
expectations of the customer (Parasuraman et al., 1985). Although, Heskett et al. (1994) refers
to service quality as a function where the service quality can be viewed as the difference
between the experience and the expectations of the service encounter. Shemwell et al. (1998)
further argue that delivering a high service quality is essential in gaining a sustainable
advantage of competitors. Furthermore, Parasuraman et al. (1985) argue that quality is not
only evaluated on the outcome of a service, but also the process of the service delivery.
Moreover, Rust et al. (1995) argue that quality within service industries has become
important, as customers more often demand better levels of performance in their purchased
services. Regarding purchases, in terms of evaluation, service quality is harder to evaluate
than quality of goods thus making it important to consider (Parasuraman et al., 1985). In
relation, Shemwell et al. (1998) argue that service quality is a more objective concept and
easier to evaluate through logic while customer satisfaction is subjective and feelings-based.
Furthermore, Rust et al. (1995) argue that the chain of effects from quality improvements can be
traced all the way to the profits of a company. This as service quality has a strong and direct effect
on customer satisfaction (Shemwell et al., 1998; Rust et al., 1995). In addition, Rust et al. (1995)
argue that an improved service quality can contribute to both increased customer satisfaction
(Parakash and Mohanty, 2012) as well as reduced costs. This can further be advocated by Cronin
et al. (2000) who present findings indicating that service quality along with service value
contribute to an increased satisfaction of the customer. In addition, Heskett et al. (1994) suggest
that measuring service quality can be done through viewing the customer satisfaction. Moreover,
it is argued by Rust et al. (1995), that customer satisfaction possesses a statistical link with
customer retention as well as increased activity of word-of-mouth.

28
As service quality contributes to customer satisfaction, it becomes important for service
organisations to measure the determinants affecting it. Parasuraman (1985) and Johnston
(1995) are both authors that have researched what determinants that influence service quality
from the customer’s point of view. According to Parakash and Mohanty (2011), it is
acknowledged that there are various definitions of service quality in academia. In turn, these
various definitions contribute to different views of the determinants that influence service
quality. The most common determinants are summarized and listed below in order to provide
a quick overview of them from the perspective of Parasuraman (1985) and Johnston (1995).
Although the ones with the clearest definition are described accordingly.
Reliability: considers the consistency of performance, refers to that the firm performs
the service right the first time, and honours its promises towards the customer.
Responsiveness: concerns the willingness and readiness of employees of the firm to
provide service to the customers (e.g. calling customers back quickly, giving prompt
service).
Competence: employees should possess the required skills and knowledge to perform
the service.
Access: considers the service as easily to access to the customer along with short
waiting time. Moreover, the service should be accessible during convenient hours of
operation.
Courtesy: is concerning the politeness, respect, consideration and friendliness of the
service provider towards the customer.
Communications: is viewed as important and referred to as the activity of keeping the
customers informed in a language they can understand.
Credibility: refers to the trustworthiness, honesty, and working with the best intentions
to towards the customer.
Security: concerns the freedom from danger and doubt. In addition, it concerns the
confidentiality of the customer.
Understanding: refers to the understanding of the customer’s specific needs and
requirements.
Tangibles: includes the physical evidence of the service acknowledged as facilities,
appearance of personnel, and physical representations of the service.
3.3.3 Customer Satisfaction According to Iacobucci et al. (1995), the definitions of both service quality and customer
satisfaction are used differently within academia as well as in industries. This as the authors
presents a paper that tries to examine the differences and similarities between these two
concepts through empirical studies (Iacobucci et al., 1995). Moreover, it is acknowledged that
industries are putting more attention to customer satisfaction in order to stay competitive
(Taylor, 1995; Iacobucci et al., 1995; Evanschitzky et al., 2012). One of the reasons for this
attention can be acknowledged as the fact that customers are becoming more demanding as
advocated by Asher (1989). This focus on customer satisfaction can further be related to
Raithel et al. (2011) as the authors argue that there is an established conceptual link between
29
satisfaction and long-term financial performance within marketing. Adamson (1994) argues
that the relation between customer satisfaction and revenue as well as profit cannot directly be
associated.
Moreover, as Iacobucci et al. (1995) also present findings arguing that timeliness and physical
environment affects the customer satisfaction, Raithel et al. (2011) indicate that customer
satisfaction should consider the satisfaction, purchase-, and repurchase-factors of the
customer. In addition, Asher (1989) argues that customer satisfaction can only be achieved as
long as all factors that influence the satisfaction of the customer are known. According to
Evanschitzky et al. (2012), customer satisfaction is important to establish long-term and
profitable relationships with customers. Adamson (1994) further argue and discuss that
conducting customer surveys frequently regarding customer satisfaction can be demanding
from the customers perspective, which might imply a negative impact on customer
satisfaction. Thus, Adamson (1994) clearly argues that it should be measured but with care. In
relation, Heskett et al. (1994) advocate that it is important to collect data considering
customer satisfaction in an objective way.
Furthermore, Asher (1989) argues that it is important to identify what is important to the customer
and how well the company meets these requirements in order to ensure customer satisfaction. This
as companies often directs their attention on image or sales volumes, rather than focusing on
whether customers are satisfied or not (Asher, 1989). In addition, Asher (1989) further argues that
customer satisfaction can not only consider the product or service itself, but must focus on
whether or not all of the customers’ requirements have been satisfied or not. In addition,
Shemwell et al. (1998) argue that customer satisfaction is highly dependent on the human
interaction provided during the service encounter. In relation to the service encounter and
interaction between company and customer, Evanschitzky et al. (2012) along with Heskett et al.
(1994) present findings that customer satisfaction can be affected by the employee satisfaction.
Hence, employees within organisations play an important role in contributing to customer
satisfaction.
Moreover, Denning (2011) states that in order to acquire an accurate reading of whether the
customer was truly satisfied, it is in most situations enough to ask whether it is likely that the
customer would recommend the product or service to a colleague or friend. This measurement is
referred to as the Net Promoter Score (Denning, 2011). Customer-centric metrics such as the Net
Promoter Score and customer satisfaction scores can naturally be embedded in the performance
evaluation and incentive structures within the organisation (Verhoef and Lemon, 2013).
Furthermore, Evanschitzky et al. (2012) argue that adaptive selling can also be related to customer
satisfaction since it reduces the gap between expectations and experiences of the customer. Thus,
firms must find ways to enable and measure this kind of adaptive selling. Moreover, Evanschitzky
et al. (2012) present findings that service quality and value-for-money are two drivers of customer
satisfaction.

30
3.3.4 Customer Retention As the future profits of customers are important to a company, the retention of customers
becomes essential. Ranaweera and Neely (2003) state that academia often relate to customer
retention and customer loyalty as the same. Customer retention is acknowledged as important
within the service industry as long-term relationships are profitable (Shemwell et al., 1998;
Venetis and Ghauri, 2004; Bazini et al., 2011). A focus on retaining existing customers
compared to acquiring customers is according Srivastava et al. (1998) also beneficial with
regard to value creation. This as it decreases the volatility of cash flows, contributing to a
decreased cost of capital, increases the stability in the operations, and through making costs
regarding customer retention and acquisition more predictable (Srivastava et al., 1998).
Moreover, the combination of loyal customers and switching costs can enable the company to
establish competitive barriers through making it more difficult for competitors to succeed
with sales (Srivastava et al., 1998). This is also discussed by Venetis and Ghauri (2004) who
argue that the long-term relationships obtained from retaining customers increase the
competitive advantage of a company. Correspondingly, Gunther et al. (2011) argue that a
small improvement in the aspect of retaining customers can increase the profitability
significantly. Through an increased customer retention, the possibility of customers making
additional, new and other purchases within the company increases (Venetis and Ghauri,
2004). Further, Srivastava et al. (1998) advocate that the accomplishment of cross selling can
also increase the bond between the firm and its customers, increasing the switching costs for
the customer. However, with the regard for customer retention, one should not only consider
the effects of it provided by satisfied customers. This according to Ranaweera and Neely
(2003), the authors state that the customers’ lack of interest can also affect the customer
retention. Although, both Ranaweera and Neely (2003) along with Venetis and Ghauri (2004)
advocate that both service quality and customer satisfaction have an effect on customer
retention.
3.3.5 Word of Mouth Word of Mouth (WOM) is acknowledged as the perceptions spread among and between
customers as well as non-existing customers regarding a product or service. According to
Lang (2011), the communications through WOM is highly related to customer satisfaction
and service quality and therefore argue that firms must consider how they manage their
service. According to several authors, this relationship between WOM and service quality as
well as customer satisfaction is well acknowledged within the service industry (Rust et al.
1995; Sun and Qu, 2011). In addition, Ng et al. (2011) also argue that the quality of a service
is affecting the WOM behaviour, and refers to this quality as the positive feelings a customer
experiences towards the service provider.
The research conducted by Lang (2011) further suggests that the quality of the service
encounter between customer and service provider can lead to a higher activity of WOM, if a
high level of satisfaction can be achieved. This as it is commonly accepted that a customer's

31
perception of the service quality is a crucial part in spreading a positive WOM behaviour (Sun
and Qu, 2011). In addition, Lang (2011) along with Ng et al. (2011) further argue that it is
important for service oriented companies to achieve a high WOM activity, since it leads to
more profitable and trusting customers. In addition, a negative WOM holds far worse effect as
dissatisfied customer talk more about their experiences than satisfied customers do (Adamson,
1994). In relation, customers that have achieved a high satisfaction through a service
encounter are acknowledged as more trustworthy, in comparison to regular marketing
channels established by the organisation itself (Sun and Qu, 2011). In turn, WOM allows
companies to achieve more with fewer resources at no extra costs (Lang, 2011). In addition,
Ng et al. (2011) argue that it is important to consider WOM in service organisations as they
offer intangible products. It is further argued that WOM is contributing to both a far-reaching
and long-lasting impact on a firms financial indicators since it affects the CLV through its
customer retention, if positive (Rust et al. 1995; Lang, 2011).
3.3.6 Employee Retention Regarding employee retention, the empirical study of Yee et al. (2010) aimed at investigating how
the employees’ loyalty affects the firm performance. The authors found that the loyalty of
employees within service organisations indirectly leads to firm profitability, as it affects the
service quality and in turn customer satisfaction and finally customer loyalty (Yee et al., 2010).
According to Heskett et al. (1994), employee retention is acknowledged as a problem within
service organisations. The main loss of having a high employee turnover is according to Heskett
et al. (1994) not the costs regarding recruiting, hiring and educating the replacements, but the loss
in employee productivity and service quality (i.e. experience). Furthermore, Heskett et al. (1994)
argue that it is important to understand how to create loyal employees and in turn reduce the
retention of these employees. This is further emphasised as Yee et al. (2010) refers to the social
exchange theory and argue that loyal employees will deliver a higher service quality to the
customer. In addition, retaining employees is related to a higher customer satisfaction according
to Heskett et al. (1994).
3.3.7 Consultative Selling According to Graziano and Flanagan (2005), traditional selling focuses on the salesperson
telling the customers what it needs and not. In turn, salespersons conducting this traditional
selling aim at convincing the customer that the product is useful (Graziano and Flanagan,
2005). According to Moncrief and Marshall (2005), this type of traditional selling have come
to change in aspect during the last decades due to technological advancements and more
selling focused organisations. This, as researchers as well as organisations have lately started
to advocate that value as well as customer value are both important to consider as sources of
competitive advantage during sales processes (Töytäri et al., 2011). This as organisations
rather sells the value of a product or service in order to stay competitive in the long-term
rather than the product itself (Töytäri et al., 2011). Thus, a new, mutual type of selling has
evolved according to Moncrief and Marshall (2005).
This new kind of selling is acknowledged as consultative selling, aims at defining the

32
customer and its needs, and make sure that they are addressed accordingly (Graziano and
Flanagan, 2005). In relation, Moncrief and Marshall (2005) along with Verhallen et al. (1997)
refer to consultative selling as a problem solving kind of selling. Further, it is advocated that
consultative selling is one of the most effective ways of establishing long-term relationships
(Verhallen et al., 1997; Jones and Brewer, 2001; Moncrief and Marshall, 2005). According to
Verhallen et al. (1997), consultative selling is best applied to products and services that
inhabit a high complexity, as these products need a balance between the product features and
the customer’s needs. Moreover, salespersons conducting consultative selling must provide
qualitative personal advices and act more as advisers towards the customer (Verhallen et al.,
1997)
3.4 OPERATIONAL IMPROVEMENTS This subchapter intends to review established theories related to operational management as a
ground to develop the Conceptual Model upon as well as an understanding of how operations
can be managed in order to create value.
3.4.1 Systems’ Thinking Systems’ thinking is commonly referred to as a mind-set, mental model, or holistic approach
to view an organization (Senge, 2006; Gharajedaghi, 2011). Moreover, as Systems thinking
has been applied in industries it has come to advocate a holistic and new perspective to
respond to problems that affects organisations (Fulmer et al., 1998; Matheson and Matheson,
1999; Seddon, 2010). This as Systems thinking focuses on problems and activities affecting
an organisation from the outside-in and not the inside-out (Matheson and Matheson, 1999).
According to Matheson and Matheson (1999), the outside-in perspective has been proven
effective in strategic business situations. In addition, Gharajedaghi (2011) all the factors
affecting a system can be categorized into two, controlled and uncontrolled factors. The
controlled factors refer to the internal variables that can be managed by all the employees
within the organisation (Gharajedaghi, 2011). The uncontrolled factors consist of the external
and unpredictable factors constantly affecting the organisation (Ulrich et al., 2009;
Gharajedaghi, 2011). Thus, it becomes essential to understand which external factors in terms
of demand that affects the system (Senge, 2006; Seddon, 2010). Due to these uncontrolled
factors, Senge (2006) argues that systems created from a Systems thinking perspective can
never blame their employees, customers, or other external forces affecting it, just the system
as an entity.
The concept of Systems thinking further enables companies to analyse problems from another
perspective (Fingar, 2005; Cabrera et al., 2009). Having a narrow approach of solving
problems might lead to new problems, as the main cause of the issue might remain (Matheson
and Matheson, 1999). This is what Seddon (2010) along with Gharajedaghi (2011) refer to as
sub-optimization. Hence, systems’ thinking enables an analysis of problems throughout the
entire organization. Further, the approach of Systems thinking requires that organisations
must transfer the decision-making to the employees that encounter the demands placed on the

33
created system (Senge, 2006; Seddon and Caulkin, 2007). In turn, this further emphasis that
employees need a greater perspective of the overall business and its processes (Fingar, 2005).
3.4.2 Lean Service Over time, researchers in academia have started to apply the philosophy of Lean to the service
sector under the name of Lean Service (Swank, 2003; Åhlström, 2004; Piercy and Rich,
2009a; Suárez-Barraza et al. 2012). This is further advocated by Suárez-Barraza et al. (2012)
as the author’s state that Lean Service can be viewed as a derivation of the original Lean. This
extension of Lean to Lean Service is important to consider since the characteristics of service
do not apply to the logic of manufacturing (mentioned in the previous chapter named The
Insurance Industry) (Swank, 2003; Piercy and Rich, 2009a). In the paper presented by Seddon
and O’Donovan (2009), the authors argue that the pure application of Lean and its practises
on to service organisations have caused more harm than good. Moreover, as Suárez-Barraza et
al. (2012) reviews the existing literature of Lean Service within academia, the authors found
that the applications and translations of it vary widely. In addition, as these translations to
services have been researched, almost all have derived from the publishing of “The Machine
that changed the world” (see; Womack et al., 1990 for further reading) (Swank, 2003;
Åhlström, 2004; Piercy and Rich, 2009a). Although, various authors have extended these
factors and interpreted them differently. The most common factors that have been
acknowledged by authors trying to translate Lean into Lean Service are further presented.
Elimination of Waste: According to Åhlström (2004), the elimination of everything
that does not create value for the customer is the most distinguished principal of Lean.
One argument considered is that the customer is not willingly to pay for waste created
(Åhlström, 2004). In addition, this is further advocated by Piercy and Rich (2009a,
2009b) along with Staats et al. (2011) as they state that within Lean, it is important to
identify the real value that is sought by customers. In consent, Timmers and Van Der
Wiele (1990) argue that businesses must consider and identify the wishes as well as
demands of its customers in order to improve quality. Hence, Lean Service must aim
at removing the unnecessary factors that do not contribute to value from the
perspective of the customers (Swank 2003; Åhlström, 2004; Piercy and Rich, 2009a,
Staas et al., 2011). In addition, Piercy and Rich (2009a) argues that each factor not
removed is considered a failure to the customer demand. In relation, Seddon and
O’Donovan (2009) agree to this, although stating that this waste cannot be eliminated
without understanding the causes providing it.
Continuous Improvement: Continuous improvement is acknowledged as the use of a
company’s human resources (i.e. employees) to take advantage of the company’s
innovative potential to improve performance as well as achieving competitive
advantage (Fulmer, 1998; Boer et al, 2000). According to Boer et al. (2000), along
with Senge (2006), the authors argue that the key to Continuous Improvement is
acknowledged as continuous development and learning. This principle of Continuous
Improvement is further referred to by Åhlström (2004) as the most fundamental

34
principle of Lean after the elimination of waste and acknowledged as the constant
strive for perfection. Moreover, Piercy and Rich (2009a, 2009b) acknowledge this
principle as the continuous efforts made by the management of the organisation to
eliminate the present waste. This is also advocated by Staats et al. (2011) as the
authors argue that perfection requires a constant strive to meet the need of the
customers as well as improving the processes of the organisation (Piercy and Rich,
2009b). In addition, Denton (1995) along with Imai, (1986) concludes that it is
important to possess a clear and common purpose throughout the whole organisation
and make sure every employee understands it in order to succeed with Continuous
Improvement.
Pull: As the concept of push is referred to the economics of flow, the concept of pull
is referred to by Seddon and O’Donovan (2009) as when a product or service is being
created from the request of a customer (i.e. pulled at the request of the customer),
hence economics of flow. Furthermore, Åhlström (2004) argue that in an organisation
adapted to this pull system, everything starts with a customer order, further advocating
that nothing start unless a customer demands it. This can further be developed by the
statements of Piercy and Rich (2009b) as they refer to pull as when something is only
delivered or constructed, as it is actually demanded by the customer. Moreover,
Åhlström (2004) stresses that a pull system must provide every operation within the
organisation with the necessary parts and information at the right time in order to
make it work.
Standardization: Since Continuous improvement is standard-oriented, there can be no
improvements where there are no standards and people oriented with the desire for
quality (Imai, 1991; Boer et al, 2000). Swank (2003) further advocates that the
freedom in managing work related activities inhibits other employees to be flexible
and that a standardization is required when transitioning into lean within service
organisations. This due to the difficulties in filling in where there are absences
(Swank, 2003). Although, Seddon and O’Donovan (2009) argue that the aspect of
standardization must be carefully considered within Lean Service as service varies
according to customer and context more than within production.
Processes. According to Piercy and Rich (2009b, 2009b) the mapping of the value
stream, also referred to as the processes within the organisation, is a principle of Lean.
Therefore, organisations committing to Lean Service should constantly use tools as a
value stream map to identify what factors do not contribute to value to the customer in
the processes of the organisation (Piercy and Rich, 2009b, 2009b). Furthermore
Swank (2003) indicate that all aspects considering the processes should be considered
through arguing that the location of tangible assets should even be taken in
consideration.

35
Decentralisation of responsibility: Applying the philosophy of Lean Service further
emphasis that responsibility and authority is moved towards the first line workers
within the organisation (Åhlström, 2004). Denton (1995) further advocates that a
common and clear purpose combined with continuous improvement require a sense of
control and ownership of all participating actors in the process of continuous change.
3.4.2.1 Lean Service within call-centres Due to the nature of services today, Lean Service has often been associated with call-centres.
This as service is more often conducted through this non-physical contact provided by ICT-
tools (Swank 2003; Piercy and Rich, 2009a, Seddon, 2010). As these services are often
conducted through phone calls, academia has researched these call-centres through a Lean
Service perspective (Swank, 2003; Piercy and Rich, 2009a; Piercy and Rich, 2009b; Seddon
and O’Donovan, 2009; Seddon 2010).
Regarding the elimination of waste, Seddon (2010) refers to waste in these call-centres as a
failure to answer to the demands of the customers (i.e. failure demand) and this logic is
acknowledged by Piercy and Rich (2009a) as well. Moreover, Seddon (2010) further argues
that call-centres must understand the demands that contribute to value for each customer and
refers to these as value demand. In turn, this further emphasises the need to understand the
demand created by customers (Timmers and Van Der Wiele, 1990; Seddon, 2010). According
to Seddon (2010), along with Piercy and Rich (2009a), managers within call-centres should
constantly strive to visualize the demands of their customers, thus continuously try to
eliminate the failure demand and further try to predict it.
Through reviewing literature related to Lean Service and call-centres, the most common and
associated factors considered as failure demand in the context of call-centres are further
presented in order to understand the concept of failure demand and its potential waste.
One stop: Considering a call-centre handling incoming calls, it is important to focus
on customers being provided with the right service the first point of contact (Seddon,
2010). This as Piercy and Rich (2009a) found that customers often gets replaced back
into the queuing system as a result of a lack in competence of the operator handling
their requests in the first point of contact. This is also acknowledged by Swank (2003)
as a problem since incoming calls may become repetitive because the errand was not
solved the first time. Measuring this inability to not solve the errand during the first
point of contact is often acknowledged as the act of one-stop (Piercy and Rich 2009a;
Seddon, 2010). In relation, Bicheno and Holweg (2009) argue that the deficiency of
not performing a one-stop should be considered as a failure demand.
Customer delay: The customer delay within service is a demand that should be
considered as a failure demand (Bicheno and Holweg, 2009; Piercy and Rich, 2009;
Seddon, 2010). According to Bicheno and Holweg (2009), this customer delay
considers the customer queuing to be provided with service. In relation, Piercy and

36
Rich (2009a) along with Seddon and O’Donovan (2009) further point out that as
customers are queued, waiting to be served, they may exit the queue due to long wait
times. These exits caused by the queue are referred to as a type of failure demand
(Seddon, 2010). In addition, Bicheno and Holweg (2009) argue that it is essential not
to assume that the customer’s time is free as customers may change service provider.
Duplication: Regarding the service process during the service encounter, Bicheno and
Holweg (2009) argue that the action of performing duplicate tasks must be considered
as they could be considered as a failure and waste from the customer’s perspective. As
Lean and Lean Service advocates mapping of processes, all aspects referred to as
waste should be considered (Piercy and Rich, 2009a; Piercy and Rich 2009b).
According to Bicheno and Holweg (2009), these actions can be acknowledged as the
action of re-entering data several times during the same service encounter, repeat
details on forms, and copy information across systems. This as the operator of the
customer support should possess all the necessary tools and equipment in order to
obtain the correct ergonomics (Swank, 2003; Bicheno and Holweg, 2009).
Communication: The communication of the right information is important as it
otherwise can provide an additional, redundant, and unwanted encounter (Swank,
2003; Bicheno and Holweg, 2009). According to Seddon (2010), customers that do not
obtain a clear picture regarding the state of their service tend to repeatedly call back
and therefore create a failure demand. Thus, it is important to consider that the
customer is provided with the needed service directly (Piercy and Rich 2009a; Seddon,
2010).
Interactive voice response: As call-centres often are equipped with an Interactive
Voice Response (IVR) where customers have to choose between predetermined types
of errands through interaction, customers might select an inappropriate option (Piercy
and Rich, 2009a; Seddon 2010). Customers diverted to an unwanted part of the
organisation have to be rerouted once again; this scenario is in the context of Lean
Service considered as a waste. This is also acknowledged by Bicheno and Holweg
(2009) as one as a failure demand as the authors refer to it as an unnecessary
movement from the customers point of view as it creates additional queues and extra
time for the customer.
Standardization: In the context of a call-centre, Swank (2003) argues that work should
be standardized in order for substitutes to conduct their work without any problems.
Although the author also argues that, the service process should not be standardized
since it can lead to problems (Swank, 2003). In addition, some authors argue that the
standardization of the service process is considered as inappropriate in call-centres
(Seddon and O’Donovan, 2009; Seddon, 2010). This as incoming calls possesses a
variation in their subject and therefore the length and complexity of each call differ
and thereby no standardized can be made (Seddon, 2010). Thus, Seddon (2010)
37
strongly argue that management within call-centres should not focus on the quantity
and length of incoming calls answered by employees, as these cannot be predicted.
This as standardizing time to handle customers may affect various aspects of the
service quality (Seddon and O’Donovan, 2009; Seddon, 2010).
Errors: Regarding waste, it must also be viewed from an external perspective. Waste
is therefore important to consider in the external transactions as well as the service
transactions that are present (Bicheno and Holweg, 2009). Moreover, it is important to
consider the intangible resources within service, as it is important to be able to provide
what is required of the customer (Bicheno and Holweg, 2009).
3.4.3 Service Blueprinting A process can be defined as how to organise work or a set of activities to reach a desired
outcome (Gibb et al., 2006; Milton and Johnson, 2012). According to Gibb et al. (2006),
processes are often influenced and aligned to the business in which they are active. In
addition, Gibb et al. (2006) state that the key goal of processes is to establish a standardisation
and monitor the outcome in order to ensure quality.
Moreover, a process may vary depending on its context, industry, or customer interaction.
Thus, several different tools of reviewing processes have been established over the years
(Milton and Johnson, 2012). Some of these are accounted for as; the PNC model, Service
Blueprinting, and the Service map (Shahin, 2010; Kostopoulos, 2012; Milton and Johnson,
2012; Sampson, 2012). The PNC model has its focus on costs while the Service blueprinting
can be viewed as an extension of the Service map (Shahin, 2010; Sampson, 2012). Although
it is an extension, the Service blueprint differentiates itself from the Service map on a
fundamental level. This as Service blueprinting is acknowledged as a tool that focuses on a
process through an engineering approach while the Service map offers more of a
psychological approach (Shahin, 2010). In addition, Milton and Johnson (2012) state that
Service blueprinting is more suited in the mapping of a process in the service context.
Regarding viewpoint, the Service blueprint as a tool takes the viewpoint of the customer, not
the organization. This as it enables the visualisation of the different parts of the process, both
visible and invisible to the customer. (Milton and Johnson, 2012; Sampson, 2012) Through a
Service blueprint, members within an organisation can visualize how and what functions that
must interact in order to establish customer satisfaction (Gibb et al. 2006). Except from its
specific viewpoint of the customer, Service blueprinting also focuses on the visible and
invisible contacts, support processes, and physical evidences of a process (Parakash and
Mohanty, 2012; Kostopoulos, 2012; Milton and Johnson, 2012). Since the customer is part of
a process in service, one must consider what information the customer receives during the
process as well (Milton and Johnson, 2012). In addition, Kostopoulos (2012) states that it
becomes important to sort tasks executed during the process after their importance.
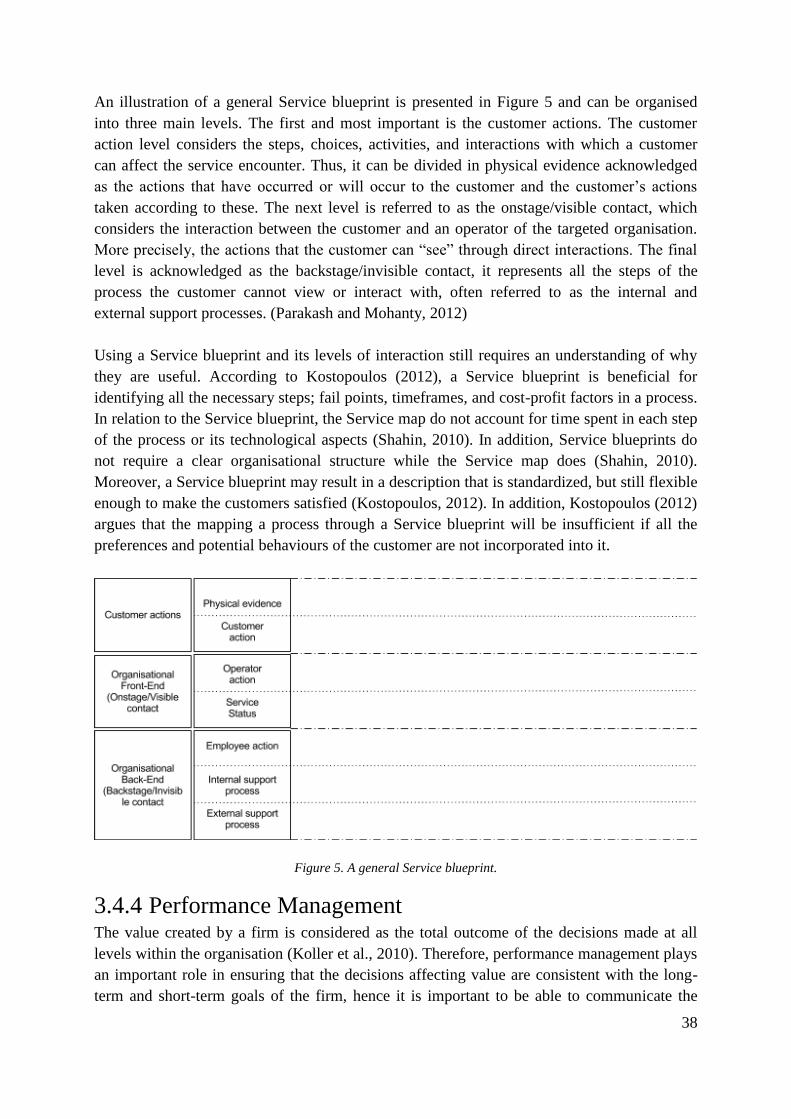
38
An illustration of a general Service blueprint is presented in Figure 5 and can be organised
into three main levels. The first and most important is the customer actions. The customer
action level considers the steps, choices, activities, and interactions with which a customer
can affect the service encounter. Thus, it can be divided in physical evidence acknowledged
as the actions that have occurred or will occur to the customer and the customer’s actions
taken according to these. The next level is referred to as the onstage/visible contact, which
considers the interaction between the customer and an operator of the targeted organisation.
More precisely, the actions that the customer can “see” through direct interactions. The final
level is acknowledged as the backstage/invisible contact, it represents all the steps of the
process the customer cannot view or interact with, often referred to as the internal and
external support processes. (Parakash and Mohanty, 2012)
Using a Service blueprint and its levels of interaction still requires an understanding of why
they are useful. According to Kostopoulos (2012), a Service blueprint is beneficial for
identifying all the necessary steps; fail points, timeframes, and cost-profit factors in a process.
In relation to the Service blueprint, the Service map do not account for time spent in each step
of the process or its technological aspects (Shahin, 2010). In addition, Service blueprints do
not require a clear organisational structure while the Service map does (Shahin, 2010).
Moreover, a Service blueprint may result in a description that is standardized, but still flexible
enough to make the customers satisfied (Kostopoulos, 2012). In addition, Kostopoulos (2012)
argues that the mapping a process through a Service blueprint will be insufficient if all the
preferences and potential behaviours of the customer are not incorporated into it.
Figure 5. A general Service blueprint.
3.4.4 Performance Management The value created by a firm is considered as the total outcome of the decisions made at all
levels within the organisation (Koller et al., 2010). Therefore, performance management plays
an important role in ensuring that the decisions affecting value are consistent with the long-
term and short-term goals of the firm, hence it is important to be able to communicate the
39
strategy of the firm (Koller et al., 2010). Therefore, it is important to measure performance in
order to identify success and fulfilment of customer requirements (Parker, 2000). According
to Parker (2000), this is important as it identifies problems and bottlenecks that must be
understood in order to make consistent decision as well as follow up on improvements made.
This as organizational learning requires that organizations understand not only what
happened, but also measure why it happened (Reckham, 1999).
Comparing past company health metrics to meaningful targets can help managers observe
crucial information about the current performance of the company (Koller et al., 2010).
According to Lebas (1995), it is important to have a clear purpose of the measurement and to
be able to operationalize this purpose into a specific measurement. In the article by Neely et
al. (2002), the authors provide a checklist in order to facilitate the development of metrics.
One of the important aspects included is the importance of having a metric that everyone will
understand (Neely et al., 2002). Further, Neely et al. (2002) state that it is important to have a
clear purpose of metrics as well as consider what behaviors of the employees they might
create (Neely et al., 2002).
Furthermore, Koller et al. (2010) emphasise the need for a company to identify the drivers of
value. These value drivers can be divided into four categories acknowledged as short-,
medium-, long-term and finally financial value drivers (Koller et al., 2010). Koller et al.
(2010) emphasises the need for firms to understand the value drivers related to each of these
levels. The financial drivers refer to the firm’s ability to grow and its ability to earn money on
the cash invested in the business and the ability to decrease the risk and therefore its cost of
capital (Koller et al., 2010). Short-term drivers are the drivers that have a direct impact on the
financial result of the company (i.e. sales revenue). Moreover, the Medium-term drivers are
concerned with whether the company can sustain its growth during the next one to five years.
This through considering factors such as customer satisfaction and the firm’s ability to
provide new products to the market as well as the firm’s ability to manage costs relatively to
its competitors. Finally, it is important to consider the long-term drivers that are more
concerned with the strategic health of the firm which indicate whether the firm can sustain its
current business and exploit new areas of growth. Moreover, it is also important to consider
the organizational health, which emphasises the need to ensure that the company has the
people, skills, and culture to sustain value creation. (Koller et al., 2010)
Moreover, many firms have focused on the use of market share as a metric (Verhoef and
Lemon, 2013). However, it is important to understand that this metric is influenced by various
factors such as customer retention, customer acquisition, market growth rate, and the retention
rate of competitors and the effectiveness of marketing efforts (Rust et al., 1995). Further,
Verhoef and Lemon (2013) advocate the importance of understanding the negative effects that
could occur by using this metric in the wrong way. Verhoef and Lemon (2013) state that it
could create a focus on achieving sales targets. This in turn could imply that companies use
sales promotions in order to accomplish these goals, which cause only temporary shift in sales
and therefore not long-term value. This as activities that increases the market share at the

40
expense of other competitors are easy to imitate, hence enabling other competitors to counter
the offer unless competitors get outcompeted (Koller et al., 2010).
3.5 BUSINESS INTELLIGENCE This subchapter intends to review the architecture of Business Intelligence in order to
understand its fundamentals. Moreover, a theoretical review of the two trends mobile- and
Self-Service Business Intelligence is presented.
3.5.1 Data Warehouse The term Business Intelligence is acknowledged as a way of taking advantage of the historical
data of a company in decision-making as well as in the purpose of increasing the
organisational performance (Baars and Kemper, 2008; Gartner Group, 2013). Although, it is
acknowledged that Business Intelligence is often defined in various ways according to its
context (Gessner and Volonino, 2005; Baars and Kemper, 2008; Elbashir et al., 2011). This
since Business Intelligence can be seen as a collection of technologies or applications, which
together provides a basis for decision-making (Chaudhuri et al., 2011). Moreover, Business
Intelligence is a single technique, as it is often associated or accompanied by a Data
Warehouse (Chaudhuri et al., 2011; O’Leary, 2011; Chen et al., 2012). According to
Chaudhuri et al. (2011) in consent with Chen et al. (2012), the authors account for Data
Warehousing as the fundamental building block in Business Intelligence. Boateng et al.
(2012) define the concept of Data Warehousing as a technique of collecting a company’s data
from different systems and additional sources into one single source. Thereby the Data
Warehouse becomes a collection of all gathered information related to a company’s historical
operations. The term Business Intelligence can therefore be viewed as the set of tools,
techniques, and components that through collection, compilation, organisation, and analysis
visualize information to its users (Chaudhuri et al., 2011).
Figure 6. A typical Data Warehouse architecture.
Understanding Business Intelligence therefore requires an understanding of a Data Warehouse
as a concept. Figure 6 illustrates a generalization of a Data Warehouse architecture
(Chaudhuri and Dayal, 1997; Kimball and Ross, 2002). First, data is gathered both externally

41
and internally, along with additional data sources (Boateng, 2012). In addition, Kimball and
Ross (2002) refer to this component of the Data Warehouse as the ‘operational source
systems’ where information is extracted from various sources. As this stage captures the
transactions of a company, no control over new, incoming data is provided. Further, as data is
extracted, it is synchronized through a set of processes, one of them referred to as the Extract-
Transformation-Load (ETL) process (Kimball and Ross, 2002). Furthermore, as the data has
been compiled through the ETL process, it is stored in what is commonly acknowledged as
the Data Warehouse (Chaudhuri et al., 2011; Boateng et al., 2012). According to Kimball and
Ross (2002) this process of compiling the data before loading, contains transformations as
correct misspellings, resolving domain conflicts, and dealing with missing elements. This
stage is further referred to as the ‘Data Staging Area’ according to Kimball and Ross (2002).
In turn, this data is often distributed further in the Data Warehouse into Data Marts (Kimball
and Ross, 2002; Chaudhuri et al., 2011). Kimball and Ross (2002) acknowledge this stage in
the Data Warehouse as the ‘Data Presentation Area’. In this stage data is organized, stored,
and made available to the users through these Data Marts. These Data Marts are also known
as subsets of the Data Warehouse where the data is predefined in various combinations and
further targeted to specific business functions, in purpose of improving the scalability
(Kimball and Ross, 2002; Boateng et al., 2012). Further on, data is gathered from the Data
Marts into various applications that enable reporting, data mining and further analysis
(Boateng et al., 2012), also known as the stage of ‘Data Access Tools’ according to Kimball
and Ross (2002). These tools are acknowledged for as the front-end applications and
techniques within Business Intelligence (Chaudhuri and Dayal, 1997; Chaudhuri et al., 2011).
Kimball and Ross (2002) argue that this is the major component of the data warehouse as they
refer to fact that the compiled data has to be viewed and analysed at some point.
The architecture of a Data Warehouse becomes essential when reviewing Business
Intelligence as a tool to make decisions upon. Hence, there is a need for a Data Warehouse to
provide the user with scalability, fast response-times, and high complexities (Boateng et al.,
2012). Thus, Business Intelligence naturally copes with the response-time of the Data
Warehouse it is built on.
3.5.2 Self-Service Business Intelligence Little has been written in academia regarding the trend of Self-Service Business Intelligence.
In order to cope with the increasing demand and response-time, companies are constantly
developing their Data Warehouses under pressure in order to improve their decision-making
(Forrester, 2009; TDWI, 2011; Özcan et al., 2011). Often as these Data Warehouses are
constructed, they are assumed to provide answers to all strategic questions of the company
(Gutierrez, 2006). This assumption is often false and in turn, information workers using
Business Intelligence often find themselves in an overwhelming amount of disorganized
information (Gutierrez, 2006; Forrester, 2009). This is acknowledged as one of the
disadvantages of Business Intelligence as the information workers are spending more time
searching for the right data instead of using it (Forrester, 2009). Although, according to
42
Gutierrez (2006) the process of implementing Self-Service Business Intelligence in
organisations is acknowledged as difficult. This as a strong vision should be established that
enables all the departments of the organisation to collaborate. Moreover, it should also
account for the alignment of employees, technology, and processes (Gutierrez, 2006). This is
advocated vision further acknowledged as a need to consider as executives more often view
their business from a strategic level without any transparency of what is driving the
performance at the functional level (Aberdeen Group, 2010).
In order to cope with the increasing demand and response-time, Self-Service Business
Intelligence has become a trend that environmentally focuses on the information workers
(Forrester, 2009). This through providing the information workers with the means of creating
their own reports and analysis without the influence of the organization's IT department
(Evelson, 2011; TDWI, 2011). Through creating an environment for information workers that
is easy to use and consume, the information workers become self-sufficient (Gutierrez, 2006;
TDWI, 2011). In addition, by making information workers more self-sufficient, IT
departments within organisations can focus on more value adding activities instead of
continuously creating reports and analysis from the Data Warehouse (explained further in the
Information Analysis Cycle) (Gutierrez, 2006; TDWI, 2011). The market research company
Forrester defines Self-Service Business Intelligence as:
“...an approach that combines processes, methodologies, organizational structure,
tools, and technologies that enables strategic, tactical, and operational decision-
makers to be more flexible and more responsive to the fast pace of changes to business
and regulatory requirements.” (Evelson, 2011, pp. 5)
Moreover, Self-Service Business Intelligence focuses on the four main objectives: easy-
access, easy-to-use, fast-to-deploy, and easy-to-manage (TDWI, 2011). One other reason Self-
Service Business Intelligence has started to gain popularity is due to its opportunities of
meeting the demands of the constantly changing business needs (TDWI, 2011). In addition,
Gutierrez (2006) refers to the Information Analysis Cycle when evaluating the benefits with
the trend of Self-Service Business Intelligence.
The Information Analysis Cycle (IAC) is illustrated in Figure 7 with the traditional cycle of
reporting through Business Intelligence (Gutierrez, 2006). The cycle starts with the
identification of a need that has to be analysed and further a conceptualization of what kind of
information must be available to perform this analysis. Through further analysis, a definition
of what type of reports that are required to analyse this need takes place. As this need has
been conceptualized and defined, the IT department of the organisation must create it before
the information can be analysed and acted upon. This step referred to as Report in Figure 7 is
acknowledged as time consuming for IT departments as well as information workers
(Evelson, 2011; TDWI, 2011). Thus, Self-Service Business Intelligence replaces the role of
the IT departments and enables a faster and more flexible cycle of analysis. Gutierrez (2006)
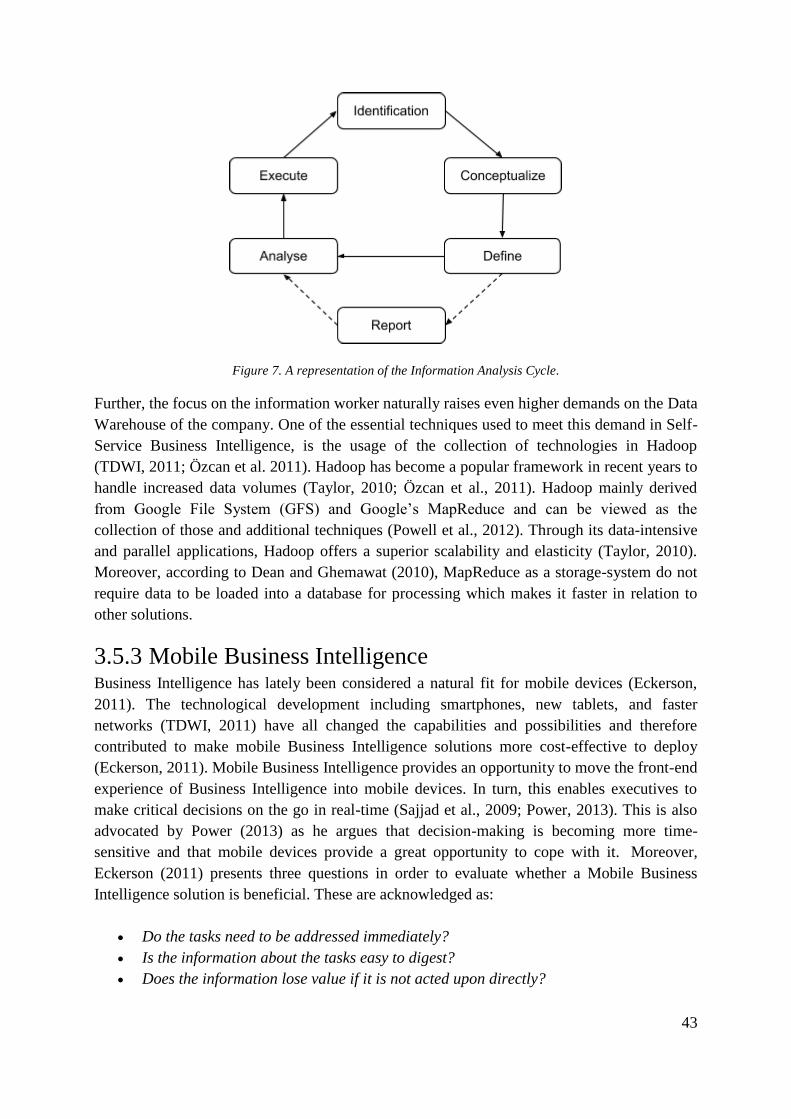
43
Figure 7. A representation of the Information Analysis Cycle.
Further, the focus on the information worker naturally raises even higher demands on the Data
Warehouse of the company. One of the essential techniques used to meet this demand in Self-
Service Business Intelligence, is the usage of the collection of technologies in Hadoop
(TDWI, 2011; Özcan et al. 2011). Hadoop has become a popular framework in recent years to
handle increased data volumes (Taylor, 2010; Özcan et al., 2011). Hadoop mainly derived
from Google File System (GFS) and Google’s MapReduce and can be viewed as the
collection of those and additional techniques (Powell et al., 2012). Through its data-intensive
and parallel applications, Hadoop offers a superior scalability and elasticity (Taylor, 2010).
Moreover, according to Dean and Ghemawat (2010), MapReduce as a storage-system do not
require data to be loaded into a database for processing which makes it faster in relation to
other solutions.
3.5.3 Mobile Business Intelligence Business Intelligence has lately been considered a natural fit for mobile devices (Eckerson,
2011). The technological development including smartphones, new tablets, and faster
networks (TDWI, 2011) have all changed the capabilities and possibilities and therefore
contributed to make mobile Business Intelligence solutions more cost-effective to deploy
(Eckerson, 2011). Mobile Business Intelligence provides an opportunity to move the front-end
experience of Business Intelligence into mobile devices. In turn, this enables executives to
make critical decisions on the go in real-time (Sajjad et al., 2009; Power, 2013). This is also
advocated by Power (2013) as he argues that decision-making is becoming more time-
sensitive and that mobile devices provide a great opportunity to cope with it. Moreover,
Eckerson (2011) presents three questions in order to evaluate whether a Mobile Business
Intelligence solution is beneficial. These are acknowledged as:
Do the tasks need to be addressed immediately?
Is the information about the tasks easy to digest?
Does the information lose value if it is not acted upon directly?

44
According to Airinei and Homocianu (2010), the practical scope of Mobile Business
Intelligence refers to three distinct usage models acknowledged as: alerts, push reporting, and
pull reporting. Airinei and Homocianu (2010) refer to these alerts as the user being able to
receive proactive alerts when something unusual or critical has happened. As an example,
Airinei and Homocianu (2010) describe that a sales agent could be alerted when a low
inventory level might threaten to interrupt the assembly line. Further, push reporting enables
the user to receive a predefined set of key performance indicators (KPI’s) at a given time. The
final category, pull reporting enables the user to request a specific set of KPI’s thus making
the user more self-sufficient (e.g. Asking the application to display the top customers of a
certain product during the last six months) (Airinei and Homocianu, 2010).

45
4. DISSERTATION The chapter intends to present an analysis of the academic findings and empirical results of
the thesis. It starts with a presentation of the conceptual model, further presenting the
empirical results and finally analyses these against each other. Thus, the trends of Business
Intelligence are analysed in the chapter.
4.1 THE CONCEPTUAL MODEL This subchapter intends to present the conceptual model analysed from the academic theories
earlier reviewed in the Theoretical Framework and an analysis over how organisational data
could be utilized with regard to it.
4.1.1 Overview of the Conceptual Model The purpose of the conceptual model is to illustrate how a customer support within an
insurance company can contribute to shareholder value (i.e. enable the insurance company to
increase the profit from the money invested in the business) and how the operations of a
customer support could be designed in order to work towards shareholder value. The model
facilitates the analysis through value drivers that are structured into three different levels of
the model (i.e. strategic, tactical and operational). Moreover, it is important to have a holistic
view of these value drivers as the model builds on causal logic between them and their
contribution to value. These value drivers could then be used to facilitate the understanding of
what drives value in order to formulate a common purpose (i.e. from the customer’s
perspective) in the customer support. Furthermore, the model advocates that this joint purpose
should be used in order to adopt principles of Continuous Improvement and the elimination of
waste to work towards creating value. However, when adopting these principles, it is
important to consider the characteristics of service and an uncontrollable variation when
working with improvements. An illustration of the model with its value drivers is presented in
Figure 8.
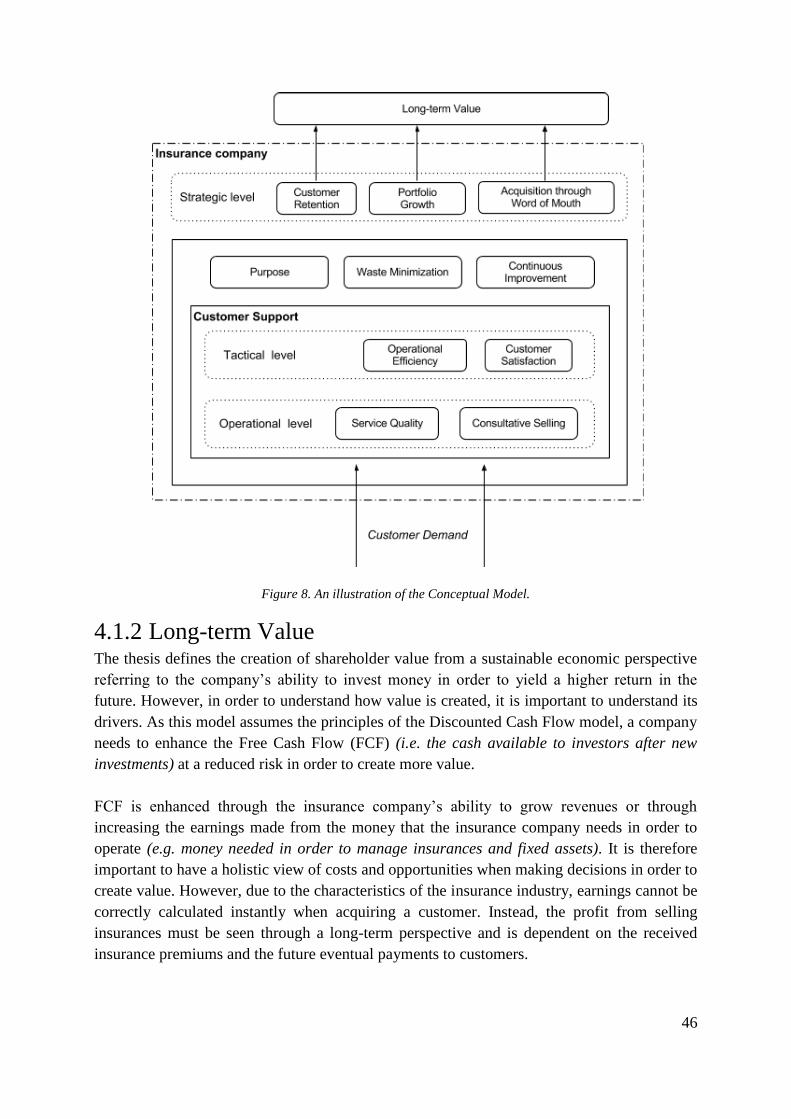
46
Figure 8. An illustration of the Conceptual Model.
4.1.2 Long-term Value The thesis defines the creation of shareholder value from a sustainable economic perspective
referring to the company’s ability to invest money in order to yield a higher return in the
future. However, in order to understand how value is created, it is important to understand its
drivers. As this model assumes the principles of the Discounted Cash Flow model, a company
needs to enhance the Free Cash Flow (FCF) (i.e. the cash available to investors after new
investments) at a reduced risk in order to create more value.
FCF is enhanced through the insurance company’s ability to grow revenues or through
increasing the earnings made from the money that the insurance company needs in order to
operate (e.g. money needed in order to manage insurances and fixed assets). It is therefore
important to have a holistic view of costs and opportunities when making decisions in order to
create value. However, due to the characteristics of the insurance industry, earnings cannot be
correctly calculated instantly when acquiring a customer. Instead, the profit from selling
insurances must be seen through a long-term perspective and is dependent on the received
insurance premiums and the future eventual payments to customers.

47
The dynamics of the insurance industry therefore emphasises the need to maintain long-term
relationships with its customers in order to enhance the FCF. Acquiring a customer is
therefore a long-term initiative and is advocated by theory to be much more expensive
compared to retaining a customer. The model therefore emphasises the need for the customer
support of an insurance company to contribute to the value drivers at the strategic level of the
model referred to as Customer Retention, Portfolio Growth, and Acquisition through Word of
Mouth. The strategic drivers of the model contribute to value in various ways as Customer
Retention of profitable customer’s increases customer profitability and decreases costs with
regard to acquiring customers. Moreover, Portfolio growth enables an insurance company to
increase revenues and the profitability of its current customers in order to enhance the FCF.
Finally, the customer support can also contribute to Acquisition through Word of Mouth,
which in turn increases the FCF due to its effect on revenue growth and through the decreased
costs of customer acquisition. It is therefore important to consider the opportunity in
leveraging a high service quality as a brand differentiator as it could drive sales and increase
the FCF as well. A strong brand might also enable an insurance company to charge a price
premium, which in turn can enable to insurance company to enhance FCF.
Furthermore, with regard to risk, an increased profitable loyal customer base could also
decrease the perceived risk of the business through making the costs regarding customer
retention and acquisition easier to predict. This could in turn decrease the cost of capital,
which creates shareholder value through an increased net present value of the FCF.
4.1.3 The Strategic Level The strategic level emphasises the need for the customer support to contribute to the value
drivers of Customer Retention, Portfolio growth, and Acquisition through Word of Mouth in
order to contribute to value creation. The strategic value drivers should be considered a result
of the customer support creating and maintaining satisfied customers.
4.1.3.1 Customer Retention The customer retention must be considered as the most essential driver at the strategic level of
an insurance company. These as customers are not profitable at the point of acquisition within
the insurance industry due to each individual risk they inhabit of triggering their insurance.
Customers must be viewed from the perspective of the customer lifetime value (CLV); since
their value increases over the time, they are loyal and sustain their relationship with an
insurance company. Therefore, the retention of customers must be considered as a
requirement for value creation and important as customers can leave the insurance company at
any time. Moreover, the aspect of customer retention should further be considered as theory
advocate that it is significantly more expensive to acquire new customers compared to
retaining existing ones. A larger focus on the acquisition of customers compared to retaining
customers will in turn decrease the value created as it increases the costs of maintaining or
growing the market share, which in turn can provide a negative impact on the profitability of
an insurance company. Moreover, it might be difficult to replace customer defaults with new
profitable customers. Further, loyal customers will continuously pay their insurance premium

48
leading to long-term profitability. A loyal customer base must be considered as a competitive
advantage, since it makes it difficult for competitors to acquire the existing customers of the
company.
4.1.3.2 Portfolio Growth At a strategic level, the growth of the insurance company’s current customer portfolio is
important to consider as it enables an insurance company to increase the profitability of each
customer through additional sales. Further, cross selling could also increase the bond between
the firm and its customers by increasing the switching costs for the customer and therefore
customer retention.
4.1.3.3 Acquisition through Word of Mouth The acquisition through word of mouth is to be considered as an important value driver as it
enables an insurance company to grow its customer base through no sales expenditures.
Hence, enabling revenue growth in a more profitable and long-term manner through using
less resources in the aspect of acquisitions through sales. Acquisition through word of mouth
should further be considered as peer-to-peer marketing is advocated to be more reliable
compared to other types of sales promotions. Through a strategic perspective, customers
acquired through the marketing of word of mouth should in turn strategically be converted
into loyal, long-term customers, which drive value through increased cash flows at a lower
risk. Moreover, being successful at acquiring customers through word of mouth could also
enable an insurance company to reduce sales promotions. This could create value as acquiring
customers through sales promotions only cause temporary shifts in sales and could further
increase the price sensitivity of customers. This as competitors can easily counter such an
offer through decreasing their prices as well, this could further destroy value through its
negative impact on Customer Retention as well as decreased price premiums which in turn
decreases the insurance company’s ability to enhance FCF.
4.1.4 The Tactical Level The tactical level considers the linkage between how the customer support and its operations
might contribute to value at the strategic level. The level emphasises the need to work towards
the drivers of Customer Satisfaction and Operational Efficiency in order to create value. This
as Customer Satisfaction provides an impact on the strategic drivers of the model while
Operational Efficiency decreases the costs of the operations with regard to the value created
to the customer.
4.1.4.1 Customer Satisfaction Customer satisfaction must be considered as crucial for value creation due to its impact on the
value drivers Customer retention, Acquisition through word of mouth, and Portfolio growth.
This since satisfied customers tends to have longer relationships with a company and is more
likely to acquire additional insurances during their lifetime. In addition, satisfied customers
are more likely to recommend other customers about the services provided by the insurance
company, thus contributing to increased sales and brand image through the communication of

49
word of mouth. As customer satisfaction affects these strategic drivers, a customer support
must aim at satisfying the customers in order to enhance value creation. In order to create
satisfied customers it is also important to consider the satisfaction of employees,
Since customer satisfaction is considered as intangible and based on the feelings of the
customer, it consequently becomes difficult to measure. Thus, objective metrics such as the
Net Promoter Score (NPS) can be considered as it is questioning the customer’s possible
actions of recommendation. Moreover, this metric is indirectly aligned with the value drivers
at the strategic level. This as the NPS provides information whether customers might facilitate
or work against the value driver Acquisition through Word of Mouth. Measuring and
analysing the reason for both satisfaction as well as dissatisfaction of customers must be
considered as an opportunity to learn and constantly improve the service quality of the
customer support and its contribution to value. Although, it should be done with care as
frequent measurement of customer satisfaction may affect it negatively.
4.1.4.2 Operational Efficiency The value driver of operational efficiency should regard for the firm’s ability to hold a high
service quality to a low cost. Cost is important to consider in a negative aspect since it
decreases the FCF and therefore value. Although, cost should not be focused and considered
through an isolated perspective as it can contribute to sub-optimization. This could in turn
create new costs and waste elsewhere in the organisation. Thus, factors contributing to cost
must be considered through a holistic perspective. In addition, a focus on cost might also
create dissatisfaction among customers as service becomes driven by the inappropriate
metrics and therefore creating the wrong incentives. Hence, it is important to continuously
remove factors that contribute to unnecessary costs through considering their contribution
from a value perspective.
4.1.5 The Operational Level The operational level within the model intends to reflect the actions of the daily operations
within the customer support. This as the operational level copes with the demands of the
customers and enables the firm to meet the tactical and strategic value drivers within the
model. The operational value drivers are concerned with the Service Quality and Consultative
Selling and are further presented.
4.1.5.1 Service Quality As the relationship between service quality and customer satisfaction is considered as strong,
service quality has to be considered as a driver of value. Thus, activities within the customer
support must constantly improve the determinants affecting the service quality. This as poor
service quality can affect the value driver of Customer Satisfaction negatively. Providing a
high service quality must therefore start by considering the entire service process performed
by the customer support. This as the characteristics of service advocates a presence of
variation in the service process through the characteristics of customer involvement and
intangibility (Earlier discussed in the chapter The Insurance Industry in the Theoretical

50
Framework). Therefore, processes must be designed to be flexible so that they can be adapted
to the needs of the customers in order to provide a high service quality. Moreover, it is also
important to evaluate the important attributes of service quality depending on the customer
demand before starting to work with improvements.
As the most acknowledged determinants are considered as competence, understanding,
responsiveness, communications, access, courtesy, credibility, and reliability, they can be
divided into directly- and indirectly-measurable determinants. In turn, the directly measurable
determinants should constantly be monitored through a short-term perspective. Considering
the indirectly measurable determinants, they should consequently be monitored to the highest
extent possible through various activities (e.g. customer surveys and personal questioning).
As these determinants are understood, they must be measured with the appropriate alignment
to the established purpose with the aim of removing waste and contributing to value for the
customer.
4.1.5.2 Consultative Selling By accomplishing sales through consultative selling, the customer support could meet
potential sales targets through not affecting the satisfaction of the customer. Thus, operators
of the customer support should take an approach as problem solvers and advisors towards
customers by fulfilling their needs instead of providing them with needs. This by adopting a
more service oriented approach of sales. This is important to consider as insurances often
holds a great complexity since they cannot be tested or evaluated in advance. Thus, operators
must aim to educate and advise customers in potential needs and possibilities.
Improving consultative selling should focus on establishing long-term relationships with the
customers. In turn, increasing the value drivers of Customer Retention, Portfolio Growth and
Acquisition through Word of Mouth. Therefore, it is important to succeed with additional
sales without compromising on customer satisfaction. This should be considered due to the
risk of a negative impact on value in the long-term.
4.1.6 Continuous Improvement, Purpose, and Waste Disregarding for the connection of Systems thinking and Continuous Improvement to
manufacturing, these philosophies could be adopted and further linked to the drivers of value
presented in the model. This through taking a holistic approach of a system as advocated in
Systems thinking and thereby view and define problems from the outside-in, hence viewing it
as customer demands effecting the system. Through viewing the organisation as a system, the
possibilities of avoiding sub-optimizations also increase. As a systems perspective advocates
this outside-in perspective, customer requests on the system must be viewed as demands
affecting the system. As the demand consists of both controllable and uncontrollable factors,
it is important to consider a natural variation with regard to the demand coming in to the
system. As an example, the frequency of demand varies as well as how an operator should
respond to it in order to ensure the satisfaction of customer.
51
4.1.6.1 Aligning the purpose towards value A clear purpose should enable the analysis of whether internal factors might prevent the
customer support to work towards it. In addition, a clear purpose must be considered in order
to succeed with Continuous Improvement to enable employees to work in the same direction.
The purpose must therefore be defined from the perspective of satisfying the customer since it
enables the customer support to work towards an increased Customer Satisfaction to increased
Operational Efficiency through eliminating factors that do not contribute to customer value.
However, a solid focus on customer satisfaction through service is not enough as it is also
important to grow the existing portfolio through additional sales and to succeed at acquiring
new customers. Therefore, the value driver of consultative selling must be considered when
defining the purpose and designing the sales process of the customer support.
4.1.6.2 Waste Minimization Aligning the call-centre to the purpose of satisfying the customer must advocate the actions of
removing all factors not contributing to customer value. As the continuous strive to eliminate
waste should be considered from an outside-in perspective, waste must and should therefore
be considered as all unnecessary factors affecting the customer experience and the service
quality negatively.
The analysis of waste should begin at the demand of the customers where the demand should
be categorised into value- (e.g. wanted calls) and failure-demand (e.g. unwanted calls). The
demand should be evaluated depending on whether it contributes to value for customers with
regard to the purpose of the customer support. Measuring value and failure demand provides
an opportunity in learning how to improve the customer support from the customer’s
perspective. By analysing the underlying factors contributing to failure demand, the
fundamental cause of these can be recognized and removed. By continuously removing the
causes of failure demand, it can enable the customer support to increase Operational
Efficiency while also improving Customer Satisfaction. This since the customer will not need
to experience any unnecessary problems with regard to the insurance company as well as an
decreased amount of demands will decrease the requirement of resources to run the customer
support.
Striving to remove waste must focus on enabling the customers to pull and acquire as much
value as possible from the customer support, at the most cost efficient manner possible. In
taking a perspective of the customer, a higher service quality can be achieved through
removing everything not contributing to value for the customer. Because of this, metrics such
as one stop, customer delay, duplication, communication, interactive voice response, and
general errors could be considered in order to understand how to improve the Service
Quality. Hence, it is important to ensure that the improvements do not have a negative impact
on Service Quality as this drives Customer Satisfaction. In addition, it becomes essential to
52
consider a decentralized governance in order to make it possible for employees that meet the
demands of the organisation to affect the decision-making.
Further, it is important to consider all the organizational factors not improving the customer
supports ability handle the demand of the customer effectively in order to fulfil the purpose of
the customer support. Hence, factors such as processes, governance, and IT systems must be
aligned and improved in order to increase Customer Satisfaction, the accomplishment of
Service Quality and Consultative Selling.
It is important to review whether the governance of the customer support encourages the
desired behaviours of the employees in order to meet the customer demands in a desired way
and enable the employees to improve in their job. Further, it is important to ensure that the
metrics used considers the natural variation in the demand, which emphasises the need to
understand the negative effects of using productivity metrics such as activity time when
evaluating employees. This since it in turn will create a focus that risk decreasing Service
Quality as well as increasing employee stress. This might risk to work against value as a
decreased employee satisfaction might have a negative impact on Customer Satisfaction.
Because of this, it is important that metrics are mainly focused on fulfilling and improving
factors with regard to the value drivers of the model, where an emphasised focus should be
put on the accomplishment of Customer Satisfaction, as this is the main driver of value within
the customer support. Productivity metrics could instead be monitored just in order to find
problems with regard to employee’s not doing their job or problems in the demand of
customers.
Finally, it is important to follow up on whether the customer support contributes to value.
Because of this, it is important to develop appropriate metrics that enable the customer
support to follow up on whether the value drivers are accomplished and whether it fulfils its
purpose. Further, it is important to follow up whether the customer support contribute to the
strategic drivers of the model and therefore on value.
4.2 UTILIZING DATA FOR VALUE This subchapter intends review the possible utilization of Business Intelligence since it
fundamentally relies on internal data sources of a company as well as external data sources.
This subchapter therefore suggests how a customer support in an insurance company can
acquire the needed data and what data that could be considered in regard for the conceptual
model.
Regarding the analysis of value and failure demand provided by the customer, internal data
sources could be used. This as operators handling incoming activities could take notes, in turn
categorize the subject of the customers’ demands during or in between calls, and directly
register it to the available IT systems. Thus, the IT system can store this data for potential
analysis. In addition to these demands, operators can further provide a more detailed
description over the subject to determine if it could be evaluated as a kind of waste.

53
Considering the service quality and its potential measurements, these could be categorized as
directly- and indirectly-measurable determinants. The directly measurable determinants could
be acknowledged as the determinants that can be measured directly before and during the
service encounter (e.g. queue time, service time, and accessibility of the service encounter)
due to the possible usage of ICT-Tools. These directly measurable determinants can therefore
be considered as internal data sources available to a customer support. The indirectly
measurable determinants could be considered as the determinants measurable through
customer surveys (e.g. courtesy, credibility and reliability of the operator) as they cannot be
measured directly during a service encounter but through customer surveys and personal
investigations. Thus, these kind of indirectly measurable determinants could be considered as
external data sources that can be stored by the insurance company.
Moreover, as operators may conduct consultative selling during service encounters the
insurance company must naturally register these occasions. Thus, these occasions can be
stored and acknowledged as internal data sources.
Regarding the value driver of customer satisfaction it could through the metric of the Net
Promoter Score be utilized in both service encounters and through customer surveys. Through
asking the question of whether the customer would recommend the services to a friend or
colleague in customer surveys, an external data source can be accounted for. Further asking
this question during a service encounter provides an opportunity to acquire an internal data
source. Although, these occasions differ with regards of ranking the answer as a customer
survey may provide a scale while a service encounter could satisfy with a yes or no as an
answer.
Considering the Acquisition through Word of Mouth operators handling incoming activities
could ask new customers whether they have been recommended to the insurance company or
if they sought it out themselves. Thus, this data can be considered as an internal data source.
Through asking new a customer the question in customer surveys this data could also be
considered an external data source. Moreover, the same aspect could be considered onto the
existing customers as they acquire new insurances.
Regarding the Customer Retention and Portfolio Growth, the data considering these could be
gathered from the insurance company’s existing computer systems. This as the customer
retention considers the lifetime of the customer with the insurance company and the portfolio
growth the current customers within the insurance company. These metrics could therefore be
accounted for as internal data sources available to the insurance company.

54
4.2.1 Analysis of the Two Trends of Business Intelligence This subchapter intends to summarize the advantages and disadvantages of the two trends
mobile- and Self-Service Business Intelligence.
Regarding the trend of Self-Service Business Intelligence, several advantages can be considered
in relation to traditional Business Intelligence. Where traditional Data warehouses within Business
Intelligence uses Data Marts to cope with the scalability, Self-Service Business Intelligence does
not. This as traditional Data warehouses through their Data marts rely on predetermined
combinations of metrics built by the organization's IT department. This as the techniques provided
by Hadoop and used in Self-Service Business Intelligence enables access to larger amounts of
data through superior scalability. Thus, the organisational needs for Data marts within the Data
warehouses can therefore be excluded and replaced by all data available to the company. This
fundamental change of Data warehouse architecture enables Self-Service Business Intelligence to
combine all available data within the company in every possible manner. In turn, it provides a
flexible possibility of analysing the desired relations for decision-making. These flexible analyses
are acknowledged as one of the greatest advantages with Self-Service Business Intelligence. In
turn, this enables easier and faster access to the information worker. Moreover, the Information
Analysis Cycle becomes more effective through excluding the organisation’s IT department in the
process of creating the desired reports. Thus, the IT department of the organisation is also allowed
to conduct more value contributing activities.
However, as Self-Service Business Intelligence allows for a more self-sufficient work, it increases
the required qualifications of the analyst. This as the competence of the information worker
becomes essential as a more self-sufficient approach to work becomes available. As the aspect of
this understanding is considered, Self-Service Business Intelligence further provides an advantage
of fast deployment. This since the pending request for a report is removed by the exclusion of the
IT department. Thus, Self-Service Business Intelligence has to strive towards making the
compilation of information easy to use as well as to manage for the information worker.
Therefore, Self-Service Business Intelligence through its flexible analysis might allow users of it
to respond faster to changing business needs.
Considering the trend of mobile Business Intelligence, it has lately gained popularity through the
spread and increased usage of mobile devices, which have made it cost-effective to deploy.
Through this accessibility, it enables real-time decision making for managers and information
workers. However, it is important to understand as of when this technology is beneficial to apply.
As theory advocates, managers as well as IT departments should consider if the information must
be addressed immediately. In relation, if much information needs to be addressed immediately it
must be considered whether that information is easy to summarize and understand. This since
mobile devices are limited in size and since mobile Business Intelligence relies on predefined
KPI’s. Moreover, the accessibility provided by this trend should be considered through the aspect
of whether it must be acted on directly. The flexibility provided by mobile Business Intelligence
should be considered as the awareness it provides through its alerts and push- and pull-
notifications.
55
4.3 EMPIRICAL RESULTS The subchapter intends to present the results of the conducted study visit. The collection of
data has intended to provide a holistic view of the call-centre, its contribution to value as well
as problems within the organisation. Therefore, the chapter presents the result of the
conducted interviews, observations, and tallies. In order to answer the research questions, a
focus has been directed to how the call-centre manage costs and its effects, how it have been
designed in order to contribute to customer satisfaction, as well as if or how it performed sales
activities in order to be able to analyse its effect on value. Certain strategic questions and
insights have been left out, due to the confidentiality of the Non-Disclosure Agreement
(NDA).
4.3.1 The Call-Centre According to insights from interviews and provided documentation, the studied call-centre
was currently considered to represent an important part regarding the customer support of the
insurance company. The call-centre was described as responsible for general tasks, such as
solving general issues as well as renewing or signing additional insurances to existing
customers. Further, interviews found that the call-centre managed all possible questions and
customer issues except insurance claims, which was managed by another call-centre within
the insurance company. Hence, the call-centre was described to affect the customer
experience and perception of the service of the insurance company. This was described as that
customers may not trigger their insurance during their entire relationship with the insurance
company. Consequently, it was found that new customers were never confronted unless the
customers initiated contact to the call-centre. Instead, the majority of the new customers are
obtained through another function of the insurance company that specifically aims at
acquiring new customers. In addition, as customers reach a point where they are considered
more profitable than others they are deliberately provided with a personal contact and thereby
excluded from future interactions with the studied call-centre. Thus, the call-centre handled
regular customers that naturally present a larger proportion of the entire customer portfolio.
Moreover, incoming activities was described as deriving to the call-centre from all over the
country as they were randomly divided among other call-centres that were regionally located.
The studied call-centre was further described to consist of approximately 40 operators and
additionally 12 managers at different levels. (Interviewee A, 2013; Interviewee B, 2013;
Interviewee C, 2013; Interviewee F, 2013)
4.3.2 Interviews This subchapter presents the results of the conducted interviews. The questions asked in the
interviews can be found in the Appendix under the Interview Guide. As the interviews
followed a semi-structured approach, certain deviations to the questions will appear.
REGARDING THE ASPECTS AND EXPECTATIONS IN THE WORK
According to Interviewee C (2013), the complexity of balancing the risk towards the quality
of the customer was considered one of the most important aspects of the daily work. In

56
relation, Interviewee D (2013) answered that the complexity of balancing the risk towards the
customer as well as determining the quality of each individual customer was acknowledged as
“part of the daily work” and an expectation of the managers towards their operators. In
addition, Interviewee A (2013) along with Interviewee B (2013) also acknowledged that since
the insurance company did not compete on price, an important aspect of the daily work was to
make sure that the customers understood the value that the insurance company were trying to
offer to them.
Another important aspect of the daily work was acknowledged as the importance of realizing
and adapting to the fact that service must differ according to customer (Interviewee B, 2013;
Interviewee G, 2013; Interviewee I, 2013). This was further emphasised as important to
realize since insurance requires various amount of time in the aspect of consulting the
customer (Interviewee G, 2013; Interviewee I, 2013). According to Interviewee H (2013)
along with Interviewee I (2013), an important aspect of each service encounter was
acknowledged at aiming to try to satisfy the customer while still following the established
rules according to the operators. This was also acknowledged as one of the expectancies in the
daily work. Moreover, the focus on conducting an accurate analysis of the customer’s needs
and further suggesting the right insurance from that analysis was also considered an important
aspect as well as an expectation of the daily work (Interviewee C, 2013; Interviewee E, 2013;
Interviewee G, 2013). Moreover, managers acknowledged that an important aspect and
expectation of their operators work was to aim to sell additional insurances, but doing so to
the right people (Interviewee B, 2013; Interviewee C, 2013; Interviewee D, 2013; Interviewee
E, 2013).
REGARDING THE PURPOSE OF THE CALL-CENTRE
Considering the question of what employees within the call-centre thought the purpose of the
call-centre was, no direct or specific answers were obtained. Although, as the answers were
different in nature, they came to consider many topics and individual statements regarding the
customer. The answers came to define the purpose as
“to provide good advices to the customers” (Interviewee A, 2013)
“to help and inform the customer of what insurances he or she needs” (Interviewee I,
2013)
“to make sure that the customer understands what it is paying for” (Interviewee G,
2013)
“to create good customer experiences” (Interviewee E, 2013)
“to conduct additional sales” (Interviewee B, 2013)
“to be the face towards the customers of the organisation” (Interviewee H, 2013)
“to be the centre of sales within the organisation” (Interviewee C, 2013)
REGARDING COMMISSIONS, INCENTIVES AND PERFORMANCE
The current incentive structures consisted of bonuses through commissions (Interviewee A,
2013; Interviewee C, 2013; Interviewee E, 2013; Interviewee G, 2013; Interviewee H, 2013;

57
Interviewee I, 2013). Three of the established bonuses were individually chosen by every
employee (Interviewee C, 2013; Interviewee E, 2013). Some of these metrics were
exemplified by Interviewee C (2013) and Interviewee G (2013) as
whether the customers filled in their health evaluation or not
gross sales made
outgoing sales made
average sales made
service quality metrics
specific insurances sold
Additionally, every operator and manager had fixed metrics that they were evaluated on and
that were common among all employees. These metrics were considered mutual and were
acknowledged as additional sales made and other pre-established service quality metrics.
(Interviewee C, 2013; Interviewee E, 2013; Interviewee H, 2013)
REGARDING ATTENTION AND EVALUATIONS
The interviewed employees all confirmed that they were evaluated on additional sales made
and the pre-established service quality metrics (Interviewee A, 2013; Interviewee C, 2013;
Interviewee G, 2013; Interviewee H, 2013; Interviewee I, 2013). Although, every interviewee
also acknowledged that the additional sales made was rising more attention and fame than
fulfilling the pre-established quality metrics. These acknowledgements were further also
confirmed and related to what managers drew their attention too. This as almost all
interviewees confirmed that when it came to an evaluation, the sales made were more
important to the manager than the fulfilment of service quality metrics (Interviewee C, 2013;
Interviewee E, 2013; Interviewee G, 2013; Interviewee H, 2013). Interviewee C (2013) also
clearly stated, “Everyone talks about service, but the focus is on sales.” in relation the
question of what employees were evaluated on.
These evaluations were made on a monthly basis were the pre-established measurements and
their results were focused (Interviewee G, 2013; Interviewee H, 2013). During these
meetings, manager and operator discussed the pre-established service metrics and sales goals
from the previous month (Interviewee C, 2013; Interviewee E, 2013; Interviewee G, 2013;
Interviewee H, 2013). In addition, it was also acknowledged that certain sales were
considered different from other sales as Interviewee H (2013) stated, “it is not always a
question of the amount of insurances sold, one must consider the earnings made from
insurance in relation to the others”. Moreover, Interviewee H (2013) also argued that it was
important to consider the amount of new customers sold too.
This focus on sales was both present to operators from managers and in turn, onto managers
from their managers (Interviewee C, 2013; Interviewee E, 2013; Interviewee G, 2013).
Interviewee E (2013) stated that all managers constantly monitor the sales made by the
operators. Moreover, it was also acknowledged that this was done on a daily basis to see to

58
that the operators achieve their sales (Interviewee B, 2013; Interviewee C, 2013; Interviewee
E, 2013). Further managers also considered the evaluation of the acquired customer’s lifetime
with the insurance company as important (Interviewee A, 2013; Interviewee E, 2013).
According to Interviewee A (2013) along with Interviewee B (2013), this was acknowledged
as important since “operators must sell to the right customers and not the ones that are
unprofitable”. This was also an important aspect to evaluate the operators on, as customers
had to be viewed from a long-term perspective (Interviewee A, 2013). This consequently led
to managers having to measure the lifetime of the customer that operators had been acquired
or sold insurances too (Interviewee A, 2013; Interviewee B, 2013).
REGARDING DEVELOPMENT AND LEARNING
Apart from the governance through the established KPI’s (i.e. service quality and additional
sales), interviewed managers clearly stated that all viewed their personnel as people to coach
and educate through studying their progress (Interviewee C, 2013; Interviewee E, 2013;
Interviewee G, 2013). Interviewee C (2013) argued that the daily work consisted of the
identification of patterns that the operators expressed (i.e. in a psychological manner) and in
turn, trying to understand these. Moreover, Interviewee C (2013) along with Interviewee E
(2013) stated that development was a question of constantly raising the qualities of their
operators as these often fluctuated over periods.
These qualities were according to managers developed during daily team meetings as well as
individually through individual meetings, role play, and interception of calls were problems
and potential improvements were discussed afterwards (Interviewee A, 2013; Interviewee C,
2013; Interviewee E, 2013). According to these interviewees, the discussed developments and
improvements between manager and operator often concerned how the operator should or
could take care of and handle all the activities in the most effective manner possible. As
managers and operators confirmed they were governed through the additional sales KPI’s,
they also acknowledged that the qualities they tried to identify and develop were mainly those
that had a negative impact on the KPI of additional sales. Further interviewees advocated that
an easier way of following these fluctuating qualities (Interviewee C, 2013; Interviewee E,
2013; Interviewee G, 2013; Interviewee H, 2013).
In regard for the metrics set by top management that considered the evaluation of the entire
call-centre, managers stated that the focus on the metrics was constantly shifting (Interviewee
B, 2013; Interviewee D, 2013). Interviewee D (2013) acknowledged this constant change of
metrics derived due to new strategies and experiments. Although, these metrics were never
used as a basis for evaluation but instead as a basis for learning and development (Interviewee
D, 2013).
REGARDING PROBLEMS
One well acknowledged problem among managers seemed to be that the customers
terminated their insurances after a short period and that they could do so whenever they
wanted (Interviewee B, 2013; Interviewee D, 2013). Interviewed managers further expressed
59
that the current high competition in the insurance industry has resulted in increased
acquisition costs through sales and marketing expenses (Interviewee A, 2013; Interviewee D,
2013; Interviewee F, 2013). In regard for the acquisition of customers, the interviewed
managers argued that it has become crucial to control the quality of the customers that were
acquired through sales in order to maintain and build a profitable portfolio of customers
(Interviewee A, 2013; Interviewee B, 2013; Interviewee D, 2013; Interviewee F, 2013).
Through the conducted interviews, managers also argued that this focus on the quality of the
customers was acknowledged as a great complexity within the insurance company as well as
within the entire industry (Interviewee A, 2013; Interviewee F, 2013). The two managers
acknowledged this problem by explaining the circumstance that customers are not profitable
at the point of acquisition in the insurance industry (Interviewee A, 2013; Interviewee B,
2013).
Interviewee A (2013) acknowledged and emphasised the most important problem as the
company’s customer portfolio since a significant fraction of it left for competitors each year.
Although, the loss of customers was not to be considered astonishing for this highly
competitive industry according to Interviewee A (2013). Further, Interviewee A (2013)
argued that besides these unsatisfied customers that left for a competitor, satisfied customers
were not considered as a source of learning and acknowledged as a problem. Instead, the
unsatisfied customers were the ones targeted for learning (Interviewee A, 2013).
Further, the interviewed operators acknowledged one problem as the possibility of changing
the price for the customer (Interviewee H, 2013; Interviewee I, 2013). This as they were
allowed to change the price through providing the customer with a discount, which in turn
was regulated. The problem according to Interviewee H (2013) was acknowledged as an
inconsistency in the usage of this discount. This as it was meant to satisfy and retain the
customer but further become a basis for evaluation for the manager if used to frequently
(Interviewee H, 2013; Interviewee I, 2013). In addition, managers also confirmed the
established rules regarding these discounts, and that they regulate the operator’s possible
actions towards the customers (Interviewee C, 2013; Interviewee E, 2013).
REGARDING STRESS
According to the interviewed managers, they acknowledged that the metric of additional sales
stressed their operators (Interviewee C, 2013; Interviewee E, 2013; Interviewee H, 2013). The
factor that stressed the operators as well as the managers was according to Interviewee E
(2013) the additional sales quota. This quota was further explained as the additional sales that
derived from the annual budget that corresponded to the total amount of sales over a year.
Further, it is divided down onto all sales functions of the insurance company and from there,
to every manager. Every manager in turn has their own responsibility to divide this quota
among their operators. (Interviewee E, 2013)
Two managers also acknowledged the stress from this sales quota and stated that they in turn
had to cope with the stress of not achieving their own quota (Interviewee C, 2013;

60
Interviewee E, 2013). Moreover, Interviewee C (2013) also argued that the pressure of
dividing this quota among the operators often became a problem, as not every operator are
suited to perform the given tasks. In addition, Interviewee E (2013) stated that one benefit of
this quota was that it was equally divided among all managers and operators of the call-centre
and that it created a sort of community.
Interviewee C (2013) along with Interviewee E (2013) further made it clear that no direct
actions are taken towards the operator that did not achieve this daily quota. Although, “If the
daily quota is not met throughout an entire week, I will start to question the operator”
(Interviewee E, 2013). In addition, Interviewee C (2013) argued that the focus on this quota
and its additional sales often confused the operators, as they did not get a clear picture of
whether to conduct service or make additional sales.
Moreover, managers acknowledged that this quota often diminished the quality of the sales
(Interviewee A, 2013; Interviewee C, 2013; Interviewee E, 2013). Thus, managers confirmed
that much of their daily work considered monitoring these metrics from a qualitative
perspective. These observations of operators was acknowledged as a necessity among
managers as operators often sold insurances to customers that did not fulfil the quality metrics
in order to achieve their provided sales quota (Interviewee A, 2013; Interviewee C, 2013).
REGARDING OBSTACLES
Managers as well as operators acknowledged that the focus on conducting administrative
work besides providing service drew attention and focus from the service aspect of the work
(Interviewee C, 2013; Interviewee E, 2013; Interviewee G, 2013; Interviewee H, 2013).
According to Interviewee C (2013), the administrative work that managers as well as
operators had to conduct besides handling customers consumed a lot of time. This was also
acknowledged by Interviewee C (2013) as well as Interviewee E (2013) as they both stated
that managers and operators currently conducted more meetings and administrative tasks than
necessary work.
Moreover, Interviewee C (2013) also argued that the focus between providing both service,
additional sales, and administrative work was considered as problematic among operators.
Although, Interviewee C (2013) stated that this situation might change since the customer
support strategically is considered moving towards becoming more focused on sales. In
addition, Interviewee E (2013) also pointed out that these administrative tasks currently are
under consideration within the organisation.
Moreover, almost all interviewed managers advocated that the efficiency within the call-
centre was diminishing since operators constantly are conducting multiple tasks within their
daily work (Interviewee A, 2013; Interviewee C, 2013; Interviewee D, 2013; Interviewee E,
2013). These activities were acknowledged as the operators handling incoming phone calls,
emails, and chat sessions (Interviewee C, 2013; Interviewee E, 2013; Interviewee F, 2013).
This way of conducting and performing multiple task in daily work was acknowledged as a

61
standard as well as an adoption to the modern society (Interviewee A, 2013). According to
Interviewee C (2013), this situation of conducting work is problematic, as the operators
constantly have to change focus and prioritize differently. Interviewee C (2013) along with
Interviewee D (2013) further acknowledged this multitasking as a general problem and both
advocated that it would be beneficial to introduce a kind of specialization into the operators
work activities.
REGARDING IMPROVEMENTS IN DAILY WORK
According to Interviewee C (2013), improvements in the daily work were not under
consideration. The only improvements mainly accounted for were those made by managers in
consideration for raising the additional sales of the operators (Interviewee C, 2013). In
addition, Interviewee C (2013) along with Interviewee E (2013) argued that the improvements
considered educating the operators in handling these various activities they constantly had to
switch among. With regard for the improvements of work-related activities, managers as well
as operators argued that there was none (Interviewee A, 2013; Interviewee C, 2013;
Interviewee E, 2013; Interviewee H, 2013). Interviewee C (2013) further stated that,
“continuously improving activities is currently not under consideration”. According to
several interviewees, it would be beneficial to make it possible to alter and improve the way
of conducting the daily work (Interviewee A, 2013; Interviewee C, 2013; Interviewee D,
2013; Interviewee E, 2013; Interviewee G, 2013). Moreover, managers advocated that this
could be done through changing the current governance and enable a more flexible
management and work (Interviewee A, 2013; Interviewee B, 2013; Interviewee C, 2013).
Moreover, managers stated that the organisation was not currently considering what is
acknowledged as “the bottom of the pyramid” (Interviewee A, 2013; Interviewee C, 2013;
Interviewee E, 2013; Interviewee G, 2013). This bottom of the pyramid was commonly
referred to the operators meeting customers. Managers acknowledged that operators possess
the most relevant experience of how to improve work (Interviewee A, 2013; Interviewee C,
2013; Interviewee E, 2013). The managers further advocated a better way of altering work
since operational objectives are not developed in accordance to the demands that the
organisation acquires (Interviewee A, 2013; Interviewee C, 2013; Interviewee E, 2013).
Interviewee C (2013) further stated that this have resulted in forming the processes and rules
of the call-centre from the organisational needs and not from the needs of the customers.
Moreover, interviewed managers argued that this has also lead to an unawareness of what is
really going on in the customer support (Interviewee C, 2013; Interviewee E, 2013).
4.3.3 Historical Data and Observations This subchapter of intends to present an overview over some of the historical data obtained
during the conducted study visit. Moreover, the result of the observations is also presented in
this subchapter.

62
4.3.3.1 Historical Data Reviewed data confirmed that the call-centre was continuously evaluating the service quality
of the operators on three questions (one of these can be mentioned in consideration to the
signed NDA). One of them was acknowledged as “Did you get the desired information or
help which you requested?” while the second was, “Do you have any insurances in another
insurance company”. Thus, the first was the only one considering the actual service and its
quality. The obtained historical data also indicated that the subject of the incoming activities
was studied in the call-centre. These activities had also been categorized in detail by the
operator performing it (e.g. notes taken by the operator during the call). Although, as notes
were taken, the categories where pre-determined. The categories were acknowledged as
other credit transfers
good service complains missing service
price claims feedback
In addition, statistics over whether the customer changed insurance company and to which,
could also be reviewed. Historical data also indicated as well as confirmed that the focus on
sales were apparent. This as historical data considered these sales related KPI’s as well as the
service quality metrics. Among the data, a customer survey was provided and considered the
following questions
The impression the customer got from the acquired help and information.
What the customer actually asked for.
Whether the customer had contacted the customer support earlier due to the same
errand not being solved.
Whether the customer did possess any other insurances in other insurance companies.
Whether the operator asked the customer about certain products or opportunities that
the company offered.
Whether the customer did acquire the help it asked for.
Whether the customer would recommend the insurance company if it had to
recommend any insurance company.
What the customer actually thought of the operator handling the call.
Additional data also revealed that managers could further obtain information that considered
whether the customer called in to the call-centre for the very first time regarding an errand.
Moreover, the obtained data also reviewed the amount of incoming and outgoing calls, as well
as incoming emails and chat sessions made on a weekly basis. Furthermore, the historical data
also indicated that time spent on each of those activities was compared against other operators
as well as a calculated average. Regarding the measured availability, it considered the
frequency of how often the operator took on new activities. This focus on time spent on
activities was also acknowledged by Interviewee C (2013) as a possible explanation to the
customer calling back since insufficient information was acquired during the first contact.

63
Moreover, additional historical data also more precisely considered the actual time spent on
the incoming and outgoing calls along with several other activities made on a daily basis.
These other activities further considered time spent by operators on breaks, training, meetings,
reporting, and other none, directly work related tasks.
4.3.3.2 Observations This subchapter intends to presents the conducted observations performed during the study
visit at the call-centre. The observations were done through using the process-mapping tool of
a Service blueprint. Several service encounters were mapped, although the most common
ones are described in this chapter. This since even though an incoming activity varied, they all
followed a general pattern. Thus, this subchapter presents three incoming calls that were
observed from interception of them. No emails or chat sessions were observed due to their
long lifetime. The results from the Service blueprints are presented in Figure 9 and Figure 10,
and Figure 11 and explained individually.
Studying the work conducted by the operators, it showed that work was driven through
several well-functioned IT software’s (IT systems). Thus, a large portion of the work was
considered automatized. As operators handled incoming calls, all the information about the
customer was displayed and easily accessible to the operator. These IT systems further made
it possible to review all activities as they were compiled and stored on a daily basis
(Interviewee B, 2013; Interviewee D, 2013; Interviewee F, 2013).
Figure 9. The process of a purchase of a new insurance.
NEW INSURANCE
As the process illustrated in Figure 9 explains the encounter of when an existing customer
bought a New Car, it can be generalized to every process of a customer insuring an object it
recently bought. Thus, the customer called (i.e. Calling) the call-centre in purpose of insuring
the object. The operator answering the call started by asking (i.e. Asking) the customer what
the subject of the call considered. As the subject became clear, the operator started gathering

64
(i.e. Gathering) information through specific questions of the purchased object to be insured.
Thus, the customer had to have all the details prepared in advance. The answers to these
questions further became parameters to the IT system (i.e. IT system) that the operator
handled. Through all the questions and their answers, a price was calculated by the IT system
according to the history of the customer and the condition of the object. This price (i.e. Price)
was then presented by the operator to the customer. From this point, the customer could either
buy the insurance (i.e. Accept) to proposed price or ask/demand a better price on the
insurance*. If the price was accepted, the operator performed a registration (i.e. System reg.).
From that point on, the operator confirmed (i.e. Confirmed) the insurance being bought and
informed the customer of that the confirmation of the errands status (i.e. Status) was going to
be sent to the customer as a confirmation (i.e. Confirmation). This status often considered an
email or regular mail being sent to the customer to make sure that the activity has been
handled correctly from both parts perspective (Interviewee C, 2013; Interviewee G, 2013).
Figure 10. The process of when the customer acquired an incorrect payment.
UNEXPECTED INFORMATION
Figure 10 explains the process of when a customer had acquired an incorrect payment from
the insurance company or as when the customer did not understand specifics that been sent
out to him or her (i.e. Payment). Consequently, the customer was calling (i.e. Calling) the
call-centre to sort out the question at hand. The operator handling the call started by
answering (i.e. Answer) and asking for the subject of the call. When the subject was
determined by the operator, he or she further started by checking (i.e. Checking) the payment
through the directly available IT system (i.e. IT System). As the system detected the error and
the problem was solved, a new status message (i.e. Status) was sent to the customer through
email or mail to make sure that the activity had been handled correctly from the insurance
company’s perspective. The operator further tried to explain (i.e. Explaining) the error to the
customer and more offered to call back (i.e. Calling back) to the customer in a short period
(e.g. one to two days) to follow up the errand and the customer confirmed (i.e. Confirm) to

65
this. Further, the customer would receive a confirmation (i.e. Confirmation) of the errand
from the insurance company after a few days or directly.
Figure 11. The process of when a customer terminated an insurance.
TERMINATION OF INSURANCE
As the process illustrated in Figure 11 explains the service encounter of when a customer
called to terminate the insurance. This customer terminating the insurance (i.e. Terminating)
could be a result of the customer considering the insurance company to be too expensive or
that the customer had been provided with a better offer at a competitor, or just being
unsatisfied with the service provided by insurance company (Interviewee A, 2013;
Interviewee B, 2013). Thus, the customer called (i.e. Calling) the call-centre and an operator
started by answering and asking (i.e. Answer) for the subject of the call. When the operator
confirmed the subject, he or she further performed a registration (i.e. System reg.) of the
customer’s request. Further the operator also continued to ask (i.e. Asking) for the reason of
the customer willingly terminating the insurance and the customer explained (i.e. Explaining)
the circumstances. If the price was a factor to the customer, the operator tried to offer a
discount (i.e. Discount) to the customer*. If the discount was insufficient, the operator
Confirmed and informed of a Status message being sent to the customer in form of an email or
regular mail (i.e. Mail/Email) to make sure that the activity have been handled correctly from
both parts perspective. Eventually the customer got a confirmation (i.e. Confirmation).
*If the customer did not agree to the suggested price by the operator, the operator tried to use
his or her Discount that could be used in these occasions. This through Checking the IT
system again with the discount as a new parameter. As the new price were calculated by the
IT System the operator once again proposed it to the customer with the hope of the customer
accepting it. This process continued until the operator could not provide any more discount to
the suggested price by the system. Thus, the customer eventually had to accept or leave
without the insurance.
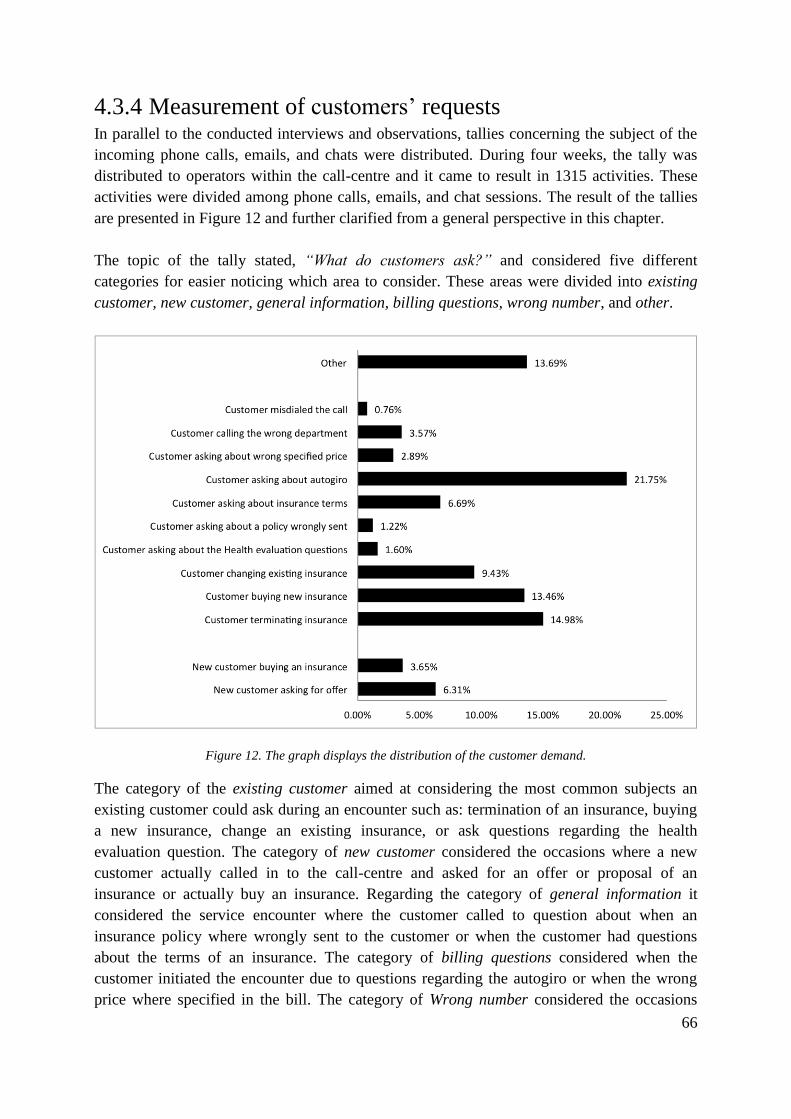
66
4.3.4 Measurement of customers’ requests In parallel to the conducted interviews and observations, tallies concerning the subject of the
incoming phone calls, emails, and chats were distributed. During four weeks, the tally was
distributed to operators within the call-centre and it came to result in 1315 activities. These
activities were divided among phone calls, emails, and chat sessions. The result of the tallies
are presented in Figure 12 and further clarified from a general perspective in this chapter.
The topic of the tally stated, “What do customers ask?” and considered five different
categories for easier noticing which area to consider. These areas were divided into existing
customer, new customer, general information, billing questions, wrong number, and other.
Figure 12. The graph displays the distribution of the customer demand.
The category of the existing customer aimed at considering the most common subjects an
existing customer could ask during an encounter such as: termination of an insurance, buying
a new insurance, change an existing insurance, or ask questions regarding the health
evaluation question. The category of new customer considered the occasions where a new
customer actually called in to the call-centre and asked for an offer or proposal of an
insurance or actually buy an insurance. Regarding the category of general information it
considered the service encounter where the customer called to question about when an
insurance policy where wrongly sent to the customer or when the customer had questions
about the terms of an insurance. The category of billing questions considered when the
customer initiated the encounter due to questions regarding the autogiro or when the wrong
price where specified in the bill. The category of Wrong number considered the occasions

67
where the customer actually phoned the wrong department or misdialled the call completely.
The last category other was deliberately considered for the operators to be provided with a
second category, as the others were not considered suitable for the subject of the call.
4.4 EMPIRICAL ANALYSIS The chapter intends to present a holistic problem analysis of the empirical results with regard
to the insurance company's creation of shareholder value. Further, the chapter presents an
analysis of the conducted observations as well as the present value and failure demand. The
chapter finally analyse the available data and metrics within the call-centre.
4.4.1 Problem Analysis The sub-chapter intends to present a strategic, tactical and operational problem analysis of the
insurance company with regard to value through applying the conceptual model. Thus, the
analysis begins at the strategic level in order to review the direct problems with regard to the
management of customers and its implication on shareholder value. In order to facilitate the
understanding of the problem analysis an issue tree is presented in Figure 13. Further, the
analysis reviews the current operational governance’s and its effects on the value drivers of
the conceptual model.
The value created by the insurance company has been described negatively affected by the
high competition within the industry. In order for the insurance company not to solely
compete on price, it intends to retain and attract customers through being superior at
delivering customer value (i.e. providing a sense of security and satisfaction). Hence, a well-
reputed customer support is an important aspect of the insurance company's differentiation to
other companies. This is according to the conceptual model beneficial with regard to value
creation as a strong brand could enable the insurance company to drive sales and charge a
price premium, which in turn would enhance the free cash flow (FCF) and therefore value.
Currently the insurance company strives to increase customer value through providing an
excellent customer experience regarding its insurance claims. However, the investigated call-
centre, responsible for all other service issues is not strategically utilized in order to enhance
customer value but is instead seen more from a cost perspective. Thus, the call-centre could
be considered a weak link or in the worst case, even be considered to work against the
strategic goals of competing on customer value. This could therefore have a negative impact
on Customer Satisfaction, which in turn could decrease customer retention, the ability to
acquire value through Portfolio Growth and Acquisition through Word of Mouth.

68
Figure 13. A problem tree with regard to shareholder value.
A main problem regarding the strategy of competing on customer value is the difficulties for
the insurance company to communicate and enable the customer to realise the value provided.
As selling insurance means selling a sense of security, it might be difficult for the insurance
company to maintain this feeling towards customers that have not yet triggered their
insurances. This could in turn imply that customers without this experience (e.g. the most
valuable customers), might not realise the value provided by the insurance company.
Consequently, the insurance company risk that customers might switch to a cheaper firm with
the price as a decisive factor. Thus according to the model, this could have a negative effect
on value as it would pressure prices and decrease Customer Retention which in turn is crucial
for creating FCF. The loss of loyal customers also decreases the insurance company’s ability
to acquire value through Portfolio Growth. Moreover, the failure to communicate value in
order to enhance Customer Satisfaction will also have a negative impact on the Acquisition
through Word of Mouth and the brand of the insurance company. Hence, it is important that
customer value is created and leveraged at all contact points with the customer. Because of
this, it is for example important to leverage the satisfaction of customers experiencing an
insurance claim in order to contribute to a positive Word of Mouth.
Because of this, the highly competitive industry could therefore be responsible for pressuring
prices, which in combination with the difficulties of communicating customer value could
result in the significant amount of customer defaults every year. This could also be

69
strengthened by the empirical results, which found that the main reason for customers leaving
the firm was due to another firm being cheaper. This significant amount of customer defaults
has various negative effects with regard to value due to a decreased Customer Retention and
the ability to acquire value through Portfolio Growth. As the empirical results found that
customers are not profitable at the point of acquisition and customer profitability is increased
in relation to their lifetime, it decreases the firm’s ability to enhance the FCF and therefore
shareholder value.
Moreover, this might also create an increased short-term sales pressure in order to compensate
for the loss of customers. This since the managers of the insurance company is required to
meet the expectations of the shareholders and therefore pressured to maintain the current
market share of the insurance company. The need to achieve sales due to customer defaults
decreases value since it creates high acquisition costs and marketing expenditures, which in
turn decreases the FCF. As indicated by the empirical results, these actions may also risk
decreasing the quality of the acquired customers, resulting in a riskier customer portfolio. This
as being successful at both achieving high sales targets and acquire high qualitative customers
might be considered as two conflicting goals. A focus on accomplishing sales could also
according to the model decrease the volatility of cash flow as it might become more difficult
to forecast the costs associated with the customer portfolio. This could in turn increase the
perceived risk of the investors and therefore the cost of capital for shareholders.
The problems identified above might have many negative implications on the call-centre. As
stated above, the call-centre is not utilized as a strategic unit in order to increase and
communicate customer value. Instead, the empirical results indicated that it is mainly seen
from a cost perspective, where the call-centre is designed from an inside-out perspective and
not from the perspective of creating value for the customer. This could be seen as problematic
with regard to communicating customer value in order for the insurance company to succeed
with Customer Retention, Portfolio Growth and Acquisition through Word of Mouth
strategically. This as the empirical results found that the call-centre is an important factor
regarding the customer experience and it might constitute the only service contact with
customers not contacting the insurance company’s claims department. Thus, not considering
the call-centre through an outside-in perspective by reviewing the Customer Demand further
diminishes the call-centres ability to create customer value and does not enable the call-centre
to remove factors not contributing to customer value. Hence, this has a negative impact on
Customer Satisfaction and Operational Efficiency.
The empirical results further indicated a two-folded focus within the call-centre, referring to
the accomplishment of both service quality and sales. Even though it was commonly
acknowledged by the interviewees that the need of the customer is the most important aspect
to consider, a deeper review of the call-centre found that managers and operators emphasized
a stronger focus on sales. This might in turn be the result of the short-term sales pressure,
which arises in order to compensate for the customer defaults, which in turn could have
various implications with regard to value. An unclear purpose could diminish the call-centre’s

70
ability to adopt Continuous Improvement, as it might be difficult for employees to work in the
same direction according to the model. Moreover, it could also complicate the design the call-
centre in order to create customer value. However, as accomplishing sales is important in
order to leverage Portfolio Growth and Acquisition through Word of Mouth, the model does
not criticize a focus on sales. Instead, it advocates the need to formulate a purpose through the
perspective of the customer where Customer Satisfaction is driven by both Service Quality
and Consultative Selling.
The governance and incentive structures of the operators and managers also emphasised the
focus on the accomplishment of sales. Additional sales had to be achieved on a daily basis,
based on a pre-determined sales quota for the year. This might have implications with regard
to value, since a stronger focus on sales might decrease Service Quality. This since the current
governance might risk encourage employees to focus more on the sales aspect of their job and
less on providing the customer with a high service quality. In turn, this might risk have a
negative impact on Customer Satisfaction and therefore on the perceived customer value. This
as an operator’s chances at performing additional sales diminishes as it is answering email or
handling chat sessions, this might consequently lead to a prioritization of incoming calls
rather than emails or chat sessions among the operators. This since no reward or bonus is
provided through service conducted through email and chat sessions, the service quality might
therefore be negatively affected during these activities. Therefore, this is also considered a
problem according to the model, which emphasises that the value drivers of Service Quality
and Consultative Selling should not conflict with regard to creating Customer Satisfaction.
Moreover with regards to the governance, it is also important to ensure that incentive
structures are aligned to encourage the employees to work with Continuous Improvement in
order to increase operational efficiency, as this has a direct effect on costs and therefore on
shareholder value.
Moreover, a lot of pressure might arise on the operators in the aspect of whether or not they
should focus on additional sales or providing a high service quality. These circumstances
might result in diminished employee satisfaction, as operators constantly have to work under
pressure to achieve the sales quota. The operator’s ability to achieve this sale quota might also
vary depending on the type of customer demand the operator respond too. This could
according to the model result in a negative impact on Customer Satisfaction as dissatisfied
employees might decrease the service quality.
Further, even though the delivered service quality is followed up, the need to accomplish that
goal was not as prioritized as achieving sales. As the main metric of service quality regarded
whether the operator managed to help the customer, it could be considered to evaluate
whether the minimum requirement of the service was met. Although, it did not clearly
consider whether the customer was satisfied with the actual service delivery. Therefore, it
does not provide any information that could help the employees by constantly getting
feedback on how to improve the service. Instead, it can be seen more as a metric to monitor
whether the operator met his or her job objectives. This could have implications with regard

71
to working with Continuous Improvement in order to increase Operational Efficiency. This as
it according to the model is important to have metrics that enables the organisation to learn
and follow up on improvements. Instead, the model suggests the adoption of the Net
Promoter Score (NPS), which could enable the call-centre to work towards increasing its
score and in order to increase Customer Satisfaction and Acquisition through Word of Mouth.
Further, regarding the service process, all observed errands was solved at the first point of
contact in an efficient manner and customer queues were managed effectively. However, the
large variation in the job of the employees had implications as it was found to be difficult for
operators to manage and solve all different types of demand and tasks effectively. Hence, this
could either decrease the Service Quality and the accomplishment of sales through
Consultative Selling. Moreover, many administrative tasks were also considered time
consuming for the operators. This in turn created a lot of administrative work for the coaches
who had to support the operators in tasks they were not suited for constantly. According to the
model, this has a negative impact on Operational Efficiency since such tasks do not create
more value for the customer. Moreover, the coaching provided from managers to operators
was mainly focused on improving the accomplishment of sales, which in turn could decrease
Customer Satisfaction.
Moreover, the historical data provided also indicated that a cost focus (e.g. command-and-
control) was present and measured within the call-centre. The metrics used was characterised
as metrics regarding the operator’s productivity. The model advocates that if such metrics are
optimized in the wrong way, they might contribute to a negative impact on Service Quality as
well as Operational Efficiency. In addition, employees within the call-centre believed that the
focus on activity time was contributing to customers calling back which in turn would
increase the costs of the call-centre’s operations, hence decrease FCF.
4.4.2 Observation Analysis This subchapter intends to present an analysis of the affection with regard to value during the
service encounters made by the Observations.
NEW INSURANCE
In regard for the three presented observations in the Observations of the Empirical Results,
the observation presented in Figure 9 considered a customer requesting to insure an object.
The process seen from a value perspective with consideration to Service Quality did not find
any particular problems regarding waste such as long customer waiting times. The gathering
of information from the operator was considered a necessity from the insurance company’s
perspective as well as the customer’s perspective. As these service encounters regarded an
existing customer wanting to insure an object they contributed to creating value through
Portfolio Growth. This as it enables the insurance company to grow its existing portfolio
through additional sales. In turn, these service encounters can create value through providing
a high Service Quality and Consultative Selling in order to contribute to Customer
Satisfaction.

72
However, when the operator presented an offer the customer often rejected it. This as the
customer often demanded a lower price of the insurance premium. Currently, the operators
had a discount pot they could use in order to adjust the price a bit in order to close such sales.
Although, as the operators were evaluated on the amount of discount given to customers, it is
important to consider what effects this could have on the behaviours of the employee’s as well
as the customers. It can be seen as beneficial that the operators have the authority to make
adjustments in price of the insurance in order to close sales. However, adjustments should
mainly be made through Service Quality and Consultative Selling in order to increase
Customer Satisfaction. This could be done through enabling the customer to take advantage of
available discounts that the customer could take advantage of if purchasing an additional
insurance. According to the model, selling additional insurances increases FCF and could
increase customer loyalty. Through decreasing the focus on price and increase the focus on
the needs of the customers, it could decrease the acquisition of customers that are more price
sensitive, which in turn could increase the risk of them switching to another firm due to a
better offer. Moreover, if the insurance company would create Customer Satisfaction through
discounts, this could potentially create a communication of word of mouth and brand image of
the insurance company that work against the strategic objective of competing on customer
value and not price. This since other customers would probably want to take advantage of
these discounts as well, which therefore could create an emphasised focus on price. Instead,
price reductions should be made to loyal customers in order to increase Customer Retention
but should not be used as a tool to drive sales as it could according to the model result in
temporary shifts in sales and increase price sensitivity of customers.
INCORRECT PAYMENT
Further, Figure 10 described an observation of a call where the customer had received an
incorrect payment or been provided with the wrong information which is according to the
demand analysis considered to be a Failure Demand. Although, the process of the encounter
was easily solved from the insurance company’s perspective, considering the customer
answers were easily acquired through these encounters without any greater obstacles.
Although, the competence of the customer could evidently affect the encounter as the
customer did not understand the operators’ explanation. These service encounters must aim to
provide a high service quality in order to create value for the customer and the insurance
company.
TERMINATION OF INSURANCE
Further, on, the observation presented in Figure 11 illustrated the process of a customer
requesting to terminate an insurance. Customers terminating their insurances could be
considered a failure demand depending on reason and explanation as it decreases the value
created from Customer Retention and Portfolio Growth. However, the termination of an
insurance could of course be due to valid reasons such as the customer could have sold the
insured asset. However, if the termination is a result of a failure of communicating customer
value or in worst case a result of customer dissatisfaction this needs to be considered and

73
learned from in order to improve the customer experience. Further, it was found to be
common that the price was the reason for the customer terminating their insurance. Because
of this, it is important to ensure that the customer has received all possible discounts of for
instance, being loyal or through having several insurances with the insurance company.
However, if this does not convince the customer to retain, it could be worth to try decrease the
price just a little depending on the value of the customer, as it will be costly to acquire a new
loyal customer. Yet, it is important to remember the negative effects that could occur of
satisfying the price sensitive customers instead of focusing on loyal customers that consider
paying a bit more in order to get a better customer experience.
4.4.3 Customer Demand Analysis This subchapter intends to present the analysis of the present value and failure demand as the
empirical study focused on categorizing the customer demand and calculating its occurrence
through distributed tallies. An analysis of each category of demand is discussed below with
regard to value demand and failure demand, costs, customer satisfaction, and sales. Value and
Failure demand is not only seen from the perspective of the customer, as it is important to
leverage the customer contact in order to create more value. The results are those presented in
graph Figure 12 of the Empirical Results. As the operators handled incoming calls, emails,
and chat-sessions, these are referred to as activities in this chapter.
NEW CUSTOMERS
The result from the tallies found that almost ten percent of all the activities involved new
customers contacting the call-centre. Six percent (6.31%) of those were accounted for
customers requesting to get an offer of an insurance and three percent (3.65%) included
customers signing up as new customers. As acquiring new customers is important for value
creation, it is to be considered a value demand. New customers can become satisfied long-
term profitable customers, which can further enhance FCF through Portfolio Growth. From
the customer’s perspective, it is important that the operators of the insurance company
understand the need of the customer and provide a high quality service. Thus, Consultative
Selling could be utilized during these encounters to meet the needs of the customer through
educating and advising the customer. Operators therefore need to provide a first good
impression with regard to service quality in order to make the customer satisfied. Moreover, it
is important to measure whether these calls could be a result of word of mouth or not. This as
the possibility of the communication through Word of Mouth should be considered a metric to
constantly monitor whether the customer support contribute to the Acquisition through Word
of Mouth. This as the effect of Customer Satisfaction might drive sales through customer
recommendations.
ADDITIONAL INSURANCES
Moreover, it was found that more than thirteen percent (13.46%) of all incoming activities
consisted of current customers requesting to buy an additional insurance. As this demand is
directly contributing to the value driver of Portfolio Growth through no customer acquisition
costs, it should be considered a value demand from the perspective of the insurance company
74
as it enables the insurance company to enhance its FCF. Further, the customer should be
provided with Consultative Selling in order to provide the customer with good advice and
Service Quality in order to increase Customer Satisfaction. Moreover, according to the model,
additional sales could potentially also contribute to value through increasing customer loyalty,
hence Customer Retention. Thus, the provided service quality during these service encounters
as well as the factors that satisfy these customers should be viewed as an opportunity to
investigate and learn from in order to strengthen the Service Quality and in turn the Customer
Satisfaction.
ALTERING INSURANCES
More than nine percent (9.43%) of the incoming activities considered customers changing
their existing insurance. From the insurance company’s perspective, this is to be considered a
value demand as the customer needs help as well as advice with regard to insurances.
This enables the call-centre to contribute to Customer Satisfaction through Consultative
Selling. Even though customers might become less profitable through conducting this change
of insurance, it is more important that the customer is satisfied with his or her insurances as
well as the service, in order ensure the accomplishment of the value drivers of Customer
Satisfaction as well as Customer Retention. Hence, it is important not viewing the
accomplishment of sales from a short-term perspective. Further, it is important to learn from
this demand in order to increase the Service Quality and Consultative Selling.
TERMINATING INSURANCES
Moreover, almost fifteen percent (14.98%) of the activities involved customers terminating
their insurance. Losing valuable customers is of course negative with regard to Customer
Retention. However, this demand should consider the type of customer and reason for the
customer requesting to terminate an insurance. It is important to be able to analyse whether
this is a valuable customer to the insurance company in order to avoid such a customer to
leave for a competitor. Moreover, it is important to investigate and learn from the reason of
the customer requesting to terminate the insurance, as it could be a result of various reasons
such as the need does not exist anymore for the customer, a better offer from a competitor or
customer dissatisfaction. Such factors should be taken into account in order to understand
how to increase the retention of valuable customers and improve factors that might cause a
customer dissatisfaction. If a customer is not in need of an insurance, it is important to
provide the customer with a Service Quality and perhaps Consultative Selling if the customer
might be in need of other insurances.
AUTOGIRO
Further, twenty-one percent of the activities (21.75%) considered questions and issues
regarding the customer’s autogiro. This type of activity should be seen as a failure demand as
it is to be seen as unnecessary and problematic from the customer’s perspective and therefore
a negative contributor to customer satisfaction. The interviews confirmed that this demand
was mainly a result of customers buying or changing their existing insurance. This, in turn
implied that the next payment had to be postponed one month, resulting in a larger payment,

75
which would cause a problem with the current autogiro of the customer. This was
acknowledged to consequently lead to the payment not been carried out, hence leaving the
customer uninsured during that period. (Interviewee H, 2013; Interviewee I, 2013) This
problem would have a large negative impact on Customer Satisfaction if the customer would
need to trigger his or her insurance during that period. Through not informing the customer of
this situation, the Service Quality can be considered as being inadequate and in turn affecting
the Customer Satisfaction. These customers will probably blame their insurance company
even though their bank might be considered responsible for the occurrence. Moreover, these
encounters may not be considered suitable to conduct Consultative Selling in. Instead, the
cause of this demand should be removed in order to avoid customer dissatisfaction.
IVT AND WRONG PRICE
Furthermore, more than three percent (3.57%) of the activities were a result of customers
selecting the wrong department through the IVR. Customers not selecting the right
department directly can be considered to either accidently press the wrong number when
selecting queue or experience the choices in the IVR to be unclear. As this type of demand
increases the lead-time of the customer getting help, it is considered a failure demand and an
unnecessary cost put on the call-centre. Hence, the cause of this demand can to be further
investigated in order to increase service quality and decrease costs as well as removing the
factor influencing it. Moreover, almost three percent (2.89%) of the activities considered that
the customer acquired the wrong price of the purchased insurance. From a customer’s
perspective, these activities should be considered as a failure demand as it affects the
customer satisfaction since customers not willingly pay extra for something they do not
possess. Moreover, as providing a sense of security is important, it might be extra important
to avoid these problems.
TERMS
Moreover, almost eight percent (7.91%) of the activities accounted for information requests.
Six percent (6.69%) involved customers asking for the terms of their insurance and one
percent (1.22 %) regarded that the wrong insurance policy had been sent to the customer. The
activities considering the insurance policy that was wrongly sent, could be seen as a failure
demand through the customer’s perspective, which could risk have a negative impact on
Customer Satisfaction. This since it accounts for waste and customers unwillingly having to
call, email, or chat with the call-centre to sort out their problem. As this demand might
contribute to dissatisfied customers, its root cause should be investigated and removed.
Therefore, a strict focus on Service Quality should be applied and not Consultative Selling
until the demand has been removed. Moreover, out of these eight percent of information
request, six percent (6.69%) regarded customers asking for the terms of the insurance. As
insurances are complex products, this should be considered a value demand as it enables the
call-centre to help the customer. Further, it could also be leveraged in order to apply
Consultative Selling in order to increase Portfolio Growth and Customer Satisfaction. This as
the customer might receive additional advice, which the customer did not consider.

76
HEALTH EVALUATION AND MISDIALS
Moreover, the activities that considered the questions about the health evaluation form
accounted for a little more than one percent (1.60%). These activities should be considered as
a value demand from a customer’s perspective. This as the customer might be confused of
what to do and is therefore in need of help. Thus, the customer must be provided with a high
service quality with the aim at satisfying the customer’s needs during these encounters. This
demand can further be leveraged in order to apply Consultative Selling in order further give
advice to the customer and contribute to Portfolio Growth and Customer Satisfaction.
However, it is important to investigate whether this health evaluation form is very complex to
understand as this in turn could make customers frustrated, hence contributing to customer
dissatisfaction. Hence, the unclear factors affecting the customers should be investigated in
order to improve the service quality. Regarding the misdial of calls that accounted for less
than one percent (0.67%) of all the activities could occasionally be categorized as a value as
well as a failure demand. Although it can be considered as a natural, cause that cannot be
removed and neither be considered as waste. However, it might be leveraged in order to ask
whether the customer is interested in receiving advice regarding insurance and thereby
through Consultative Selling increase Portfolio Growth.
OTHER
Furthermore, almost eleven percent (13.69%) of all the observed activities considered a
demand not being able to categorize in the study, according to the operators. This type of
demand should raise questions since it does not advocate neither value nor failure demand.
Not knowing what demands actually consider can actually be a failure demand itself. Thus,
the service quality factor of competence becomes relevant, as the operators of the insurance
company might not know how to handle these calls.

77
5. CONCLUSIONS The chapter intends to present the conclusions of the thesis. The chapter begins with
summarizing the fundamental aspects of the report. The empirical problem analysis is then
concluded with regard to the research questions before trying to answer these questions
through a general perspective. Finally, the reflections of the research as well as the suggested
future research are presented.
5.1 SUMMARY The thesis intended to investigate the problem that customer supports within service
organisations as these are often disregarded as a source of value due to the focus on costs.
This problem was confirmed within the studied call-centre at the targeted insurance company.
Further, the objective of the thesis was to, through a case study investigate how an insurance
company could leverage its customer support as a source of creating shareholder value, as
well as how to apply trends within Business Intelligence for increased and improved decision
support. The objective was also to develop a conceptual model based on academic theory in
order to provide a tool for analysis and development of a customer support. This was done as
the thesis defined the creation of shareholder value from a sustainable economic perspective
referring to the company’s ability to invest money in order to yield a higher return in the
future.
Three different methods were used to collect data with the goal to get an objective and holistic
view the call-centre and the insurance company in order to answer the research questions of
the thesis presented in this chapter. Tallies were used to get a better view of the purpose of the
call-centre from the perspective of the customer. This while interviews were conducted in
order to get the perspective of employee’s at different levels of the call-centre. Finally, the
work within the call-centre was observed with the purpose of getting an own and independent
understanding of the operations within the call-centre. Together, these three methods have
enabled the research to obtain an own holistic and objective view of the organisation, which
in turn enabled an analysis of problems and opportunities with regards to value through
applying The Conceptual Model. This analysis was then used in order to answer the research
questions. A business driven approach of investigating how to leverage the trends within
Business Intelligence was needed due to the lack of academic studies within the subject. This
chapter begins with concluding how the targeted call-centre of the insurance company could
enhance its contribution to value with regard to the problem analysis before drawing general
conclusions based on the model and the knowledge gained from the empirical study.
5.2 CONCLUDING THE CASE The insurance company should increase its competitiveness through leveraging its call-centre
in order to contribute to the improvement of the customer’s experience at all possible
encounters. This in order for the insurance company to increase customer satisfaction with the
intention of driving value through improving the retention rate, portfolio growth and to

78
enhance the brand reputation and acquisitions through word of mouth. An increased retention
rate of profitable customers would enhance free cash flow (FCF) and decrease the short-term
sales pressure, which in turn decreases FCF through high acquisition costs, marketing
expenditures and a possibly riskier customer portfolio. Through succeeding with this, the
insurance company could also create a competitive advantage through preventing other
companies from acquiring its existing customers while growing its customer base at the
expense of its competitors.
Thus, the call-centre needs to align its operations to satisfy the customer in order to succeed
with this. Thus, it is important for the call-centre to ensure that the accomplishment of sales or
any attempts to reduce costs does not come at the expense of customer satisfaction due to its
strategic impact on value. Instead, a clear purpose of the call-centre should be defined from a
customer’s perspective in order to draw all employees the same direction when adopting
continuous improvement. Costs should be decreased through removing factors not
contributing to customer value in order to improve both customer satisfaction and operational
efficiency. It was found that the call-centre could remove waste including the cause of failure
demand such as the occurrence of autogiro calls. Furthermore, in order to improve the
accomplishment of sales, it is suggested to categorize the operators into more service oriented
and more sales oriented employees. This in order to increase their effectiveness of sales and
service quality due to the problems found in the empirical analysis. It would also simplify the
recruitment of suitable employee’s and it could also enable the development of more suitable
incentive structures that would encourage the desired behaviour of the employees in order to
work towards customer satisfaction and still meet the sales targets. Through categorizing the
demand affecting the call-centre, the different categories could be delegated to these two
different types of operators.
In regard for Self-Service Business Intelligence (SS BI), it can be applied to the call-centre in
various ways. The technology enables a faster, more flexible and explorative analysis of the
available data and therefore an opportunity in extracting more knowledge on how to improve
the accomplishment of the value drivers of The Conceptual Model as well as their
relationships. In turn, this provides an advantageous opportunity for the call-centre to adopt
and work with Continuous Improvement as it enables information workers to dig deeper into
the available data in order to find and follow up on improvements. The application of Self-
Service Business Intelligence can further allow the information worker to continuously
experiment, learn and include new factors to improve customer value, which is crucial in
order for the insurance company to create more value.
Moreover, SS BI can also enable the insurance company to follow up on value drivers that
might be difficult to quantify. As an example, in order to follow up on the accomplishment of
customer retention, various aspects could be considered in order to follow up this value driver
accurately. Such factors could include the degree of retention of profitable and targeted
customers, the characteristics of customers leaving, reasons for leaving, whether the
customers that left had any previous negative experiences with regards to customer service,

79
changes in market growth, the customer defaults regarding competitors and similar factors.
All available internal and external data could be considered in such an analysis. This could
also be applied in order to measure customer satisfaction through the proposed metric of the
Net Promoter Score (NPS). This since various aspects could be considered in order to
understand the cause of a high or low NPS score. This could include factors such as the type
of demand, service quality parameters (e.g. customer waiting time), previous customer
problems, customer lifetime, operator and more. This knowledge could then be used in order
to improve the organisation. As the call-centre was found to have all kinds of data available,
SS-BI therefore enables the call-centre to extract and create new knowledge out of all this
unused data. However, it is important to not measure and follow up on customers to often as it
might have a negative impact on customer satisfaction.
With regard to mobile Business Intelligence, the alert, pull, and push notifications could be
leveraged in order to facilitate for the managers of the call-centre to get notifications on where
to focus their attention in case of problems. Through statistically monitoring important aspects
such as the accomplishment of service quality, customer satisfaction, and sales, it can enable
the managers to become notified quickly about important problems to focus on. This as
managers currently devoted a lot of time educating operators and thereby not considering the
urgent needs. Hence, it could increase the flexibility for coaches to monitor and focus their
resources on where it is needed. However, it is important that the monitoring focus on aspects
that the operator could affect and that it is not focused on productivity metrics that could have
negative effects on the call-centre. Instead, it should be seen as a tool that could facilitate for
the operators to understand where to focus their efforts in order to help improve the operators
with regard to the problem. This could enable the operators to decrease the time spent on
administrative tasks, which was currently considered a problem.
5.3 GENERAL CONCLUSIONS Through the thesis application to reality, general conclusions of the research questions have
been considered. This even though the thesis did only consider a one single case study. These
conclusions in relation to their research questions are further presented and answered.
How could a customer support of an insurance company be managed as a source to
create shareholder value?
It is important to have a holistic and long-term view of how value is created when considering
the customer support of an insurance company as a source of value. In addition, it is important
to consider the costs of customer-defaults and acquisition that could be avoided through
improving the customer experience with the firm. The Conceptual Model provides a
conceptual view of how a customer support can contribute to value through its value drivers at
the strategic, tactical, and operational level. Moreover, it also provides an operational view,
which emphasises the need to design the customer support from the customer’s perspective
and remove all factors not contributing to customer value. This since it enables the customer
to pull out as much value as possible from the call-centre to decreased operational costs. One
80
opportunity in decreasing waste is to remove the cause of failure demand. However, through
considering the empirical analysis it is concluded that failure demand should only be
considered to be demands with a negative impact on customer satisfaction. Otherwise,
demands should be used in order to leverage the customer contact in order to improve the
relationship with the customer. Further, the call-centre could also call out to customers in
order to increase the customer experience and retain customers.
How could the factors of service quality, costs and sales be managed in a customer
support of an insurance company in order to create long-term value?
Due to the characteristics of the insurance industry and the need to create long-term
relationships with customers in order to become profitable, it is concluded that the main
objective of the customer support should be to ensure the satisfaction of the customer in order
to increase the retention of profitable customers. It is therefore important that a focus on sales
and costs should not come at the expense of customer satisfaction as this could have a
negative impact on customer retention, portfolio growth and acquisition through word of
mouth and therefore shareholder value. Instead, costs should be managed through removing
factors not contributing to customer value (i.e. unnecessary costs such as failure demand).
Further, the sales process should be designed in order to enhance customer value through
considering the needs of customers. Hence, it is important to not attempt to decrease costs
through focusing on metrics such as activity time or similar types of productivity metrics as
this could decrease customer satisfaction as well as create new costs. It is further concluded
from the empirical analysis that balancing sales, costs, and service quality requires two
different types of operators where one focus more on sales and the other on service errands.
Through dividing the appropriate demand to each type of operator, it could enable customer
support’s to increase both the efficiency and effectiveness of delivering both service quality
and the accomplishment of sales. It also enables the development of two different governance
and incentive structures, which are aligned and enables the operators to work towards
increasing customer satisfaction and therefore shareholder value.
How could the trends mobile- and Self-service- Business Intelligence be applied in a
customer support of an insurance company with regard to value creation?
As Self-Service Business Intelligence is a new powerful trend that could enable insurance
companies to extract more knowledge out of its available data, it can be applied with regard to
creating value. This as it can enable the analysts of a customer support to continuously
analyse and experiment with all kinds of available data, which in turn can generate knowledge
on how to improve the value drivers and their linkages in order to create more value. Hence, it
provides a whole new opportunity in working with Continuous Improvement. The value
drivers of the conceptual model can be used as a basis to focus this analysis on the most
important aspects. This application of Self-Service Business Intelligence is possible if the
right metrics are available within the customer support.

81
Mobile Business intelligence is to be considered another powerful trend that could be applied
and thereby change the job of the managers responsible for operators in a call-centre. This as
mobile Business Intelligence could be applied to monitor the progress of the operators and
respond to statistical anomalies in a more efficient and flexible manner. In turn, this could
enable these managers to become more active within the job of the operators through
facilitating the analysis of where to focus their attention. This could enable a more efficient
development of employees and less administrative work not contributing to value.
5.4 REFLECTIONS The thesis has provided some insights on how Self-Service Business Intelligence and Mobile
Business Intelligence could be applied in a customer support. However, as the empirical study
only considered one insurance company in one country, it has implications on the thesis
ability to draw conclusions that are more general. This as other insurance companies
operating in the same or in a different country might experience a different reality, which
could affect the conclusions of the research. Hence, the answers to the research questions
could be improved through involving additional insurance companies. However, this would
have been difficult due to the timeframe of the thesis. The timeframe has also limited the
thesis’ ability to ensure a proper holistic view of the studied insurance company. Hence, this
could imply that important aspects have been left out in the analysis and thereby affecting the
findings of the research. In addition, as the case study aimed at conducting several interviews
within each level at the call-centre in order to confirm statements and provide a high
reliability, all the desired interviews could not be conducted due to scheduling problems.
Further, the semi-structured interviews were found to deviate more than anticipated, which
resulted in all interviewees not answering to all the questions. In addition, the language
occasionally made answers not understandable even though recorded, which affected the
results of the empirical findings. Since an NDA was signed, it affected additional
contributions to provide an accurate representation of the case. The Conceptual Model has not
intended to provide a detailed overview of possible improvements within the call-centre, but
more a general idea of what drives value to facilitate this analysis. Moreover, the suggested
linkages in The Conceptual Model regarding value creation are all based on theory. Thus, the
linkages have therefore not been tested in the matter of if they apply in the insurance industry
within its particular context due to the timeframe of the thesis. If these linkages would not
apply in this context, it would have a major impact on the conclusions of the thesis.
Furthermore, it should be seen as a conceptual model and not as a systematic model to review
a whole call-centre with regard to its processes, IT systems etc. Moreover, with regard to
customer satisfaction, it is important to understand that the customer service is not the only
factor affecting it. Further, the thesis ability to draw conclusions on how to apply the trends of
Business Intelligence can be considered limited due to the limited research within available in
the field.
82
5.5 FUTURE RESEARCH As the thesis emphasises the need to ensure customer value in order to increase customer
retention, portfolio growth and acquisition through word of mouth, this should be investigated
further. This to get the purpose of getting a more detailed understanding of how the design of
operations of a customer support could enhance customer value. Further, it would be
interesting to look into how to leverage satisfied customers in order to increase acquisition
through word of mouth. Further, it could also be interesting to investigate how the customer
support could be leveraged further depending on the competitive position of an insurance
company. It would also be interesting to investigate how the sales process of consultative
selling could be designed in order more effectively succeed with sales and enhance customer
value and in which service encounters to do so.
Moreover, it would also be interesting to investigate the effects of applying the conceptual
model presented in the thesis in an insurance company, as it was difficult due to the lack of
time. Further, a more detailed measurement of the customer demand that were done would be
interesting as well as how to improve daily operations considering these. Moreover, as the
thesis concludes that two different incentive structures is appropriate in an environment that
sales before service, an incentive structure measuring service would be of interest to further
investigate. Further, a more detailed and extensive view on how to analyse the different value
drivers and their relationships within the model would be interesting.

83
6. REFERENCES This chapter intends to present the reviewed academic literature as well as the primary and
secondary sources that were used in the thesis.
6.1 PRIMARY SOURCES Interview with Interviewee A. (March 2013)
Interview with Interviewee B. (March 2013)
Interview with Interviewee C. (March 2013)
Interview with Interviewee D. (March 2013)
Interview with Interviewee E. (March 2013)
Interview with Interviewee F. (March 2013)
Interview with Interviewee G. (March 2013)
Interview with Interviewee H. (March 2013)
Interview with Interviewee I. (March 2013)
6.2 SECONDARY SOURCES Aberdeen Group (2010) Self-Service BI, Empowering the Line-of-Business Manager. May 2010. Boston:
Aberdeen Group.
Accenture. Wollan, R., Palmer, D. and Jain, N. (2012) Are Your Customers on a Speedway or Stuck in the Slow
Lane? The 2012 Accenture Global Consumer Pulse Research Study. [WWW, PDF]
http://www.accenture.com/SiteCollectionDocuments/PDF/Accenture-Global-Consumer-Pulse-Research-Study-
2012.pdf: Accenture, pp. 1-18 [Accessed: 24/05/2013]
Adamson, C. (1994) How to waste money measuring customer satisfaction. Managing Service Quality, Vol. 4,
No. 5, pp. 9-12.
Airinei, D. and Homocianu, D. (2010), The Mobile Business Intelligence Challenge. Economy Informatics, Vol.
10, No. 1, pp. 5–12.
Ang, L. and Buttle, F. (2006) Customer retention management processes. European Journal of Marketing. Vol.
40, No. ½, pp. 83-99.
Asher, M. (1989) Measuring customer satisfaction. The Total quality management Magazine, Vol. 1, No. 2, pp.
93-96.
Bazini, E., Elmazi, L. and Sinaraj, S. (2012) Importance of Relationship Marketing Management in the
Insurance Business in Albania. Procedia – Social and Behavioral Sciences. Vol. 44, No. 1, pp. 155-162.

84
Baars, H. and Kemper, H.-G. (2008), Management Support with Structured and Unstructured Data— An
Integrated Business Intelligence Framework. Information Systems Management, Vol. 25 No. 2, pp. 132–148.
Boateng, O., Singh, J., and Singh, G.P. (2012) Data Warehousing, Business Intelligence Journal, Vol. 5, No. 2,
pp. 224-234.
Bicheno, J. and Holweg, M. (2009) The lean toolbox, 4th edition, United Kingdom: Picsie books.
Boer, H., Berger, A., Chapman, F. and Gertsen, G. (2000). CI changes: from suggestion box to organisational
learning. Continuous improvement in Europe and Australia, Ashgate Publishing Company, Aldershot.
Booz & Co. Hölbling, K., Künstner, T., Marsch, C. and Steinkrauss, N. (2009) Next-Generation Customer
Service: The New Strategic Differentiator. [WWW, PDF]
http://www.booz.com/media/file/Next_Generation_Customer_Service.pdf:. pp. 1-17.
Bolton, R. N., Lemon, K. N. and Verhoef, P. C. (2004) The Theoretical Underpinnings of Customer Asset
Management: A Framework and Propositions for Future Research. Journal of the Academy of Marketing
Science, Vol. 32, No. 3, pp. 1-20
Blocker, P.C. (2011) Modeling customer value perceptions in cross-cultural business markets. Journal of
Business Research. Vol. 64, No. 5, pp. 533-540.
Bryman, A. and Bell, E. (2011) Business Research Methods. 3rd Edition. United States, New York: Oxford
University Press.
Cao, Q., Baker, J. and Hoffman, J. (2012) The role of the competitive environment in studies of strategic
alignment: a meta-analysis. International Journal of Production Research, Vol. 50, No. 2, pp. 567-580.
Cabrera, D., Colosi, L. and Lobdell, C. (2008) Systems thinking. Evaluation and Program Planning, Vol. 31,
No. 3, pp. 299-310.
Castellanos, M. Gupta, C. Wang, S. Daydal. U and Durazo, M. (2012) A platform for situational awareness in
operational BI, Decision support systems, Elsevier. Vol. 52, No. 4, pp. 869-883.
Chaudhuri, S. and Dayal, U. (1997) An overview of Data Warehousing and Olap Technology, ACM SIGMOD,
Vol. 26, No. 1, pp. 65-74.
Chaudhuri, S., Dayal, D., and Narasayya, V. (2011) An Overview of Business Intelligence Technology.
Communications of the ACM, Vol. 54, No. 8, pp. 89-98.
Chen, H., Chiang, R., and Storey, V. (2012), Business Intelligence and analytics: From Big Data to big impact.
MIS Quarterly, Vol. 36, No. 4, pp. 1165–1188.
Cronin, J. J., Brady, M. K. and Hult, G. T. M. (2000).Assesing the Effects of Quality, Value, and Customer
Satisfaction on Consumer Behavioral Intentions in Service Environment. Journal of Retailing, Vol. 76, No. 2,
pp. 193-218.
Collis, J., and Hussey, R. (2009) Business Research: A practical guide for undergraduate & postgraduate
students. 3rd edition. England, Hampshire: PALGRAVE MACMILLAN.
Dean, J. and Ghemawat, S. (2010) MapReduce: a flexible data processing tool. Communications of the ACM,
Vol. 53, No. 1, pp. 72-77.

85
Denning, S. (2011) Reinventing management: the practices that enable continuous innovation. Strategy &
Leadership. Vol. 39, No. 3, pp. 16-24.
Denton, D. K. (1995) Creating a System for Continuous Improvement. Business Horizons. Vol. 38, No. 1, pp.
16-21.
Eckerson, W. (2011) A complete Primer to Mobile BI. [WWW, PDF] Available from:
http://www.oracle.com/us/solutions/business-intelligence/oracle-mobile-bi-ebook-ds-501071.pdf [Accessed:
29/03/2013].
Ekman, M. (2013) Vattenfall behöver ha mer fokus på affärerna. [WWW] www.svd.se. Available from:
http://www.svd.se/opinion/brannpunkt/vattenfall-behover-ha-mer-fokus-pa-affarerna_7915862.svd [Accessed:
15/05/2013]
Elbashir, M.Z., Collier, P. A. and Sutton, S.G. (2011), The Role of Organizational Absorptive Capacity in
Strategic Use of Business Intelligence to Support Integrated Management Control Systems, The Accounting
Review, Vol. 86 No. 1, pp. 155–184.
Ellis, V. and Taylor, P. (2006), You don’t know what you’ve got till it’s gone: recontextualising the origins,
development and impact of the call centre, New Technology, Work and Employment, Vol. 21 No. 2, pp. 107-122.
Evelson, B. (2011) Trends 2011 And Beyond: Business Intelligence [WWW, PDF]
Forrester: http://www.mxisoft.com/Portals/53068/docs/Forrester%20trends_2011_and_beyond_busine
ss_intelligence%5B1%5D.pdf [Accessed: 28/05/2013]
Epetimehin, F. M. (2011) Achieving Competitive Advantage in Insurance Industry: The Impact of Marketing
Innovation and Creativity. Journal of Emerging Trends in Economics and Management Sciences, Vol. 2, No. 1,
pp. 18-21.
Fingar, P. (2005) Systems thinking: The “Core” Core competency for BPM. [WWW]
http://www.bptrends.com/search.cfm?keyword=systems+thinking&gogo=1. September 6, pp. 1-3 [Accessed:
04/06/2013]
Flint, D.J., Blocker, C.P. and Boutin, P.J. (2010) Customer value anticipation, customer satisfaction and loyalty:
An empirical examination. Industrial Marketing Management. Vol. 40, No. 2, pp. 219-230.
Forrester (2009) Lean Business Intelligence, Why And How Enterprises Are Moving To Self-Service Business
Intelligence. [WWW, PDF] http://whitepapers.technologyevaluation.com/view_document/20243/lean-business-
intelligence-why-and-how-enterprises-are-moving-to-selfservice-business-intelligence.html: Forrester
Consulting. October, 2009, pp. 1-31.
Fitzroy, P. and Hulbert, J. (2005) Strategic management: Creating value in turbulent times. 1st Edition. Great
Britain: John Wiley and Son.
Fulmer, R.M., Gibbs, P. and Bernard Key, J. (1998) The Second Generation Learning Organizations: New Tools
for Sustaining Competitive Advantage. Organizational Dynamics, Vol. 27, No. 2, pp. 7-20.
Evanschitzky, H., Sharma, A. and Prykop, C. (2012) The role of the sales employee in securing customer
satisfaction. European Journal of Marketing, Vol. 46, No. 3, pp. 489-508.
Gartner Group (2013) IT Glossary, Defining the IT industry. [WWW, PDF] Available from:
http://www.gartner.com/it-glossary/business-intelligence-bi/ [Accessed: 28/05/2013].
Gessner, G. and Volonino, L. (2005), Quick response improves returns on business intelligence investments,
Information systems management, Vol. 22, No. 3, pp. 66–75.
86
Gharajedaghi, J. (2011) Systems Thinking: Managing Chaos and Complexity. 3rd edition. United States of
America, Burlington: Elsevier.
Gibb, F., Buchanan, S. and Shah, S. (2006) An integrated approach to process and service management.
International Journal of Information Management. Vol. 26, No.1, pp. 44-58.
Graziano, E. and Flanagan, P.J. (2005) Explore the art of Consultative Selling. Journal of Accountancy, Vol.
199, No. 1, pp. 34 -37.
Gupta, S., Hanssens, D. Hardie, B., Kahm, W., Kumar, V., Lin, N., Ravishanker, N. and Sriram, S. (2006)
Modeling Customer Lifetime Value. Journal of Service Research, Vol. 9, No. 2, pp. 139-155.
Gutierrez, N. (2006) Establishing a Business Intelligence (BI) Self Service Platform, part 1 [WWW, PDF]
Infosys: http://www.infosys.com/industries/consumer-packaged-goods/white-papers/Documents/establishing-
business-intelligence.pdf [Accessed: 28/03/2013]
Gunther, C-C., Tvete, I.F., Aas, K., Sandnes, G.I. and Borgan, Ø. (2011) Modelling and predicting customer
churn from an insurance company. Scandinavian Actuarial Journal, pp. 1-14.
Heskett, J.L, Jones, T.O, Loveman, G.W, Sasser, W.E. and Schlesinger, L.A. (1994) Putting the Service-profit
Chain to Work. Harvard Business Review. March-April.
Hill, J. W. and Zeller, T. L. (2008) The new value imperative for privately held companies: The why, what, and
how of value management strategy. Business Horizons, Vol. 51, No. 6, pp. 541-553.
Iacobucci, D., Ostrom, A. and Grayson, K. (1995) Distinguishing Service Quality and Customer satisfaction:
The Voice of Customer. Journal of consumer psychology, Vol. 4, No. 3, pp. 277-303.
Imai, M. (1986), Kaizen. The key to Japan’s competitive success. New York: McGraw-Hill.
Johansson, S. (2013) Telenor outsourcar hela kundtjansten [WWW] www.telekomidag.se. Available from:
http://www.telekomidag.se/nyheter/artikel.php?id=40324 [Accessed: 25/05/2013]
Johnston, R. (1995) The determinants of service quality: satisfiers and dissatisfiers. Journal of Service Industry
Management, Vol. 6, No. 5, pp. 53-71.
Jones, D.L. and Brewer, K.P. (2001) The future of the Meeting, Incentive, Convention, and Exhibition (MICE)
Industry Buyer-Seller Relationship. Journal of Convention & Exhibition Management, Vol. 3, No. 2, pp. 53 - 67.
Kamakura, W. A., Mittal, V., Rosa, F. D. and Mazzon, J. A. (2002) Assessing the Service-Profit Chain.
Marketing Science, Vol. 21, No. 3, pp. 294-317.
Kaplan, R. S. and Norton, D. P (2004) Strategy Maps: Converting intangible assets into tangible outcomes,
Harvard Business School Press: Boston.
Kasper, H. (2002) Culture and leadership in market-oriented service organisations. European Journal of
Marketing, Vol. 36, No. 9. pp. 1047-1057.
Khan, I. (2012) Impact of Customers Satisfaction And Customers Retention on Customer Loyalty. International
Journal of Scientific & Technology Research, Vol. 1, No. 2, pp. 106-110.
Kimball, R. and Ross, M. (2002) The Data Warehousing Toolkit, the complete guide to dimensional modeling.
2nd edition. United States of America, New York: Wiley and Sons, Inc.
Koller, T., Goedhart, M. and Wessels. D (2010) Valuation: Measuring and Managing the Value of Companies,
5th ed. New Jersey: John Wiley & Sons., Inc, Hoboken.
Koskina, A. and Keithley, D. (2010) Emotion in a call centre SME: A case study of positive emotion
management. European Management Journal, Vol. 28, No. 3, pp. 208-219.

87
Kostopoulos, G. (2012) Service blueprinting effectiveness. Managing Service Quality. Vol. 22, No. 6, pp- 580-
591.
Krishnan, M.S., Ramaswamy, V., Meyer, M.C. and Damien, P. (1999) Customer satisfaction for Financial
Services: The Role of Products, Services, and Information Technology, Management Science, Vol. 45, No. 9, pp.
1194-1209.
Lang, B. (2011) How word of mouth communication varies across service encounters. Managing Service
Quality, Vol. 21, No. 6, pp. 583-598.
Lebas, M.J (1995) Performance measurement and performance management. International journal of production
economics. Vol. 41, No. 1, pp. 23-35.
Lewis, B. (1991) Customer care in Service organisations, Management Decision, Vol. 29, No.1, pp. 31-34.
Macintyre, M., Parry, G. and Angelis, J. (2011) Service and design delivery. 1st Edition. UK, London: Springer
Science+Business Media.
Matheson, D. and Matheson, J.E. (1999) Outside-In Strategic Modeling. Interfaces, Vol. 29, No. 6, pp. 29-41.
Milton, S.K and Johnson, L.W. (2012) Service blueprinting and BPMN: a comparison. Managing Service
Quality. Vol. 22, No. 6, pp. 606-621.
Moncrief, W.C. and Marshall, G.W. (2005) The evolution of the seven steps of selling. Journal of Industrial
Marketing Management, Vol. 34, No. 1, pp. 13-22.
Neely, A., Adams, C. and Kennerley, M. (2002), The Performance Prism: The Scorecard for Measuring and
Managing Business Success. Financial Times-Prentice Hall: London.
Ng, S., David, M.E. and Dagger, T.S. (2011) Generating positive word-of-mouth in the service experience.
Managing Service Quality, Vol. 21, No. 2, pp. 133-151.
O’Leary, D. (2011), Building And Evolving Data Warehousing And Business Intelligence Artefacts: The Case
Of Sysco, Intelligent Systems in Accounting, Finance and Management, Vol. 18, No. 4, pp. 195–213.
Parakash, A. and Mohanty, R.P. (2012) Understanding service quality. Production Planning and Control, pp. 1-
16.
Parker, C. (2000) Performance measurement, Work Study, Vol. 49, No. 2, pp. 63 - 66.
Parasuraman, A. Zeithaml, V. A. and Berry, L. L. (1985) A conceptual Model of Service Quality and Its
Implications for Future research. Journal of Marketing, Vol. 49, No. 4, pp. 41-50
Piercy, N. and Rich, N. (2009a) High quality and low cost: the lean service centre. European Journal of
Marketing, Vol. 43, No. 11, pp. 1447-1497.
Piercy, N. and Rich, N. (2009b) Lean transformation in the pure service environment: the case of the call service
centre. International Journal of Operations & Production Management, Vol. 29, No. 1, pp. 54-76.
Powell, J., Collins, L., Eberhardt, A., Izraelevitz, D. and Roman, J. (2012) “At scale” author name matching with
Hadoop/MapReduce, Library Hi Tech News, Vol. 29, No. 4, pp. 6-12.
Power, D.J. (2013) Mobile decision support and business intelligence: an overview, Journal of Decision
Systems, Vol. 22, No. 1, pp., 4-9.

88
Qiang, W. and Xusong, X. (2008) System Thinking Mode of Complexity Science Management: The Forefront of
Management Theory. International Congerence on Wireless Communications, Networking and Mobile
Computing. (WiCOM’08) China, Dalian: IEEE Xplore, pp. 1-5.
Raithel, S., Sarstedt, M., Scharf, S. and Schwaiger, M. (2011) On the value relevance of customer satisfaction.
Multiple drivers and multiple markets. Academy of Marketing Science, Vol. 40, No. 4, pp. 509-525.
Ranaweera, C. and Neely, A. (2003) Some moderating effects on the service quality-customer retention link.
International Journal of Operations & Production Management, Vol. 23, No. 2, pp. 230-248.
Reckham, N. (1999) Rethinking the Sales Force: Redefining Selling to Create and Capture Customer Value.
United States of America, New York: McGraw-Hill.
Rouhani, S., Mirhosseini, S.V., and Asgari, S. (2012),Review Study: Business Intelligence Concepts and
Approaches, EuroJournals Publishing, Vol. 50 No. 50, pp. 62–75.
Rust, T. R., Zahorik, A. J. and Keiningham, T. L. (1995) Return on Quality (ROQ): Making Service Quality
Financially Accountable. Journal of Marketing, Vol. 59, No. 2, pp. 58-70.
Sampson, S.E. (2012) Visualizing Service Operations. Journal of Service Research. Vol. 15, No. 2, pp. 182-198.
Sajjad, B., Mir, A., Khawar, A. Bashir, F. and Tariq, A. (2009) An open source service oriented Mobile Business
Intelligence Tool (MBIT). International Conference on Information and Communication Technologies. pp. 235-
240.
Seddon, J. and Caulkin, S. (2007) Systems thinking, lean production and action learning. Action Learning:
Research and Practice, Vol. 4, No. 1, pp. 9-24.
Seddon, J. and O’Donovan, B. (2009) Rethinking Lean Service. [WWW, PDF] Available at:
http://www.processexcellencenetwork.com/downloadSecureContent.cfm?ID=10 [Accessed: 23-05-2013]
Seddon, J. (2010) Bort fran styrning och kontroll - omvardering av Lean service. 1st Edition. Place of
publication: Sverige, Lund: studentlitteratur AB.
Senge, M. P. (2006) The Fifth Discipline, The art & practice of the learning organisation. 1st Edition. Great
Britain, London: Century Business.
Shahin, A. (2010) Service Blueprinting: An Effective Approach for Targeting Critical Service Processes - With a
Case Study in a Four-Star International Hotel. Journal of Management Research, Vol. 2, No. 2, pp. 1-16.
Sharma, R.S. and Djiaw, V. (2011) Realising the strategic impact of business intelligence tools. VINE, The
journal of information and knowledge management systems, Vol. 41 No. 2, pp. 113 - 131.
Shemwell, D.J., Yavas, U. and Bilgin, Z. (1998) Customer-service provider relationships: an emprical test of a
model of service quality, satisfaction and relationship-oriented outcomes. International Journal of Service
Industry Management. Vol. 9. No. 2. pp. 155-168.
Slack, N. and Lewis, M. (2011). Operations Strategy. 3rd ed. Harlow: Pearson Education Limited
Srivastava, R. K., Shervani, T. A. and Fahey, L. (1998) Market-Based Assets and Shareholder Value: A
Framework for Analysis. Journal of Marketing, Vol. 62, No. 1, pp. 2-18.

89
Srivastava, R. K., Fahey, L. and Christensen, H. K. (2001) The resource-based view and marketing: The role of
market-based assets in gaining competitive advantage. Journal of Management, Vol. 27, No. 6, pp. 777-802.
Staats, B .R., Brunner, D. J. and Upton, D.M. (2011) Lean principles, learning, and knowledge work: Evidence
from a software services provider. Journal of Operations Management, Vol. 29, No. 5, pp. 376-390.
Suárez-Barraza, M. F., Smith, T. and Dahlgaard-Park, S. M. (2012) Lean Service: A literature analysis and
classification. Total Quality Management & Business Excellence, Vol. 23, No. 3, pp. 359-380.
Sun, L.B and Qu, H. (2011) Is there a gender effect on the relationship between service quality and Word-of-
Mouth? Journal of Travel & Tourism Marketing, Vol. 28, No. 2, pp. 210-224.
Swank, C. K. (2003) The lean service machine. Harvard Business Review, Vol. 81, No. 10, pp. 123-138.
Taylor, C. (1995) The case for customer satisfaction. Managing service Quality, Vol. 5, No. 1, pp. 11-14.
Taylor, R. (2010) An overview of the Hadoop/MapReduce/HBase framework and its current applications in
bioinformatics. BMC Bioinformatics, Vol. 11, No. 1, pp. 1-6.
TDWI (2011) Self-Service Business Intelligence, Empowering Users to Generate Insight. United States of
America:Washington, Report, Third Quarter 2011, Imhoff, C. and White, C., pp. 1-36.
Tettamanzi, A., Sammartino, L., Simonov, M., Soroldoni, M. and Beretta, M. (2004) Learning Environment for
Life Time Value Calculationof Customers in Insurance Domain. Genetic And Evolutionary Computation Gecco,
Vol. 31, No. 3, pp. 1251-1262.
Timmers, J. and Van Der Wiele, T. (1990) Out of the crisis. The TQM Magazine, Vol. 2, No.3, pp. 181-183.
Töytäri, P., Alejandro, T. B., Ollila, I., Parvinen, P. and Rosendahl, N. (2011) Bridging the theory to application
gap in value-based selling. Journal of Business & Industrial Marketing, Vol. 26, No. 7, pp. 493-502.
Ulrich, D., Allen, J., Smallwood, N., Brockbank, W. and Younger, J. (2009) Building culture from the outside in.
Strategic HR Review, Vol. 8, No. 6, pp. 20-27.
Venetis, K.A. and Ghauri, P.N. (2004) Service quality and customer retention: building long-term relationships.
European Journal of Marketing, Bol. 38, No. 11, pp. 1577-1598.
Verhallen, T. M. M., Greve, H. Frambach, R. T. (1997) Consultative selling in financial services: an
observational study of the mortgage mediation process. International Journal of Bank Marketing, Vol. 15, No. 2,
pp. 54-59.
Verhoef, P.C. and Lemon, K.N. (2013) Successful customer value management: Key lessons and emerging
trends. European Management Journal, Vol. 31, No. 1, pp. 1-15.
Visanji, N. (2010) SL outsourcar kundtjanst [WWW] www.idg.se. Available from:
http://www.idg.se/2.1085/1.318930/sl-outsourcar-kundtjanst [Accessed: 25/05/2013]
Wiggins, R. R., & Ruefli, T. W. (2005) Schumpeter’s ghost: Is hypercompetition making the best of times
shorter? Strategic Management Journal, Vol. 26, No. 10, pp. 887—911.
Womack, J., Jones, D. and Roos, D. (1990) The Machine that Changed the World, Rawson Associates, New
York, NY.

90
Yee, W.Y.R., Yeung, A.C.L. and Cheng, T.C.E. (2010) An empirical study of employee loyalty, service quality
and firm performance in the service industry. International journal of production economics, Vol. 124, No. 1,
pp. 109-120.
Åhlström, P. (2004) Lean service operations: translating lean production principles to service operations.
International Journal Technology and Management, Vol. 5, No. 5, pp. 545-563.
Özcan, F., Hoa, D., Beyer, K.S., Balmin, A., Jie Liu, C. and Li, Y. (2011) Emering trends in the enterprise data
analytics: connecting Hadoop and DB2 warehouse. Management of data: Proceedings of the 2011 ACM
SIGMOD International Conference, (SIGMOD’11). Greece, Athens: Association for Computing Machinery, pp.
1161 - 1164.

91
7. APPENDIX The chapter intends to review for external material not presented in the thesis.
7.1 THE INTERVIEW GUIDE Question: How would you describe the call-centre?
Question: What is your position and what do you do?
Question: What are the important aspects in your work? Question: What is expected of you in your daily work?
Question: What is the established purpose of the call-centre according to you?
Question: What are the current incentives or commissions in your daily work?
Question: What draws your manager’s attention? Question: What tells you that you know that you are doing a good job?
Question: What is the current development and learning in your work? Question: What are the most common problems within your daily work if there are any?
Question: What are you evaluated on?
Question: What stresses you?
Question: What affects the efficiency in your daily work?
Question: How well do you think that you can affect your work when it comes to improvements?

92
7.2 THE TALLY
What do customers ask/want? (Draw a line for counting the frequency) |||| ||
Existing customer
Terminate insurance:
Buy new insurance:
Change existing insurance:
Health evaluation:
New customer
An offer/proposal:
Buy insurance:
General information
Policy wrong sent:
Terms:
Billing question:
Autogiro:
Question regarding wrong specified price:
Misdial
Wrong department:
Misdial:
Other