How to Construct Narrative Networks using ThreadNet
14
1 How to Construct Narrative Networks using ThreadNet Version 2.2 November 28, 2016 Brian T. Pentland ([email protected]) Michigan State University Overview ........................................................................................................................................ 2 Inputs........................................................................................................................................... 2 Outputs ........................................................................................................................................ 2 Hardware/software requirements ................................................................................................ 3 What is unique about ThreadNet? .............................................................................................. 3 Creating narrative networks ........................................................................................................ 3 Basic ThreadNet algorithm ......................................................................................................... 3 Putting actions in context ............................................................................................................ 4 What questions can I answer with ThreadNet? ......................................................................... 4 Description of action patterns ..................................................................................................... 4 Comparison of action patterns .................................................................................................... 4 Challenges and limitations .......................................................................................................... 5 ThreadNet in Five Easy Steps ...................................................................................................... 5 Step 1: Read data ........................................................................................................................ 5 Step 2: Define Threads and Vertices .......................................................................................... 6 Step 3: Select/compare subset (optional) .................................................................................... 6 Step 4: Output Options ............................................................................................................... 7 Step 5: Go! ................................................................................................................................ 10 Appendix A: Input file format ................................................................................................... 11 File types = .csv, .xls, .xlsx ....................................................................................................... 11 Required data types ................................................................................................................... 12 Appendix B: Analytic Outputs .................................................................................................. 12 Data and parameter settings ...................................................................................................... 12 Summary Of Threads ................................................................................................................ 12 Summary Of Networks ............................................................................................................. 12 Handoff Analysis ...................................................................................................................... 13 Frequency Of Attributes (by Attribute & Comparison Group) ................................................ 13 Frequency Of Sub-Sequences (by N-Gram And Comparison Group) ..................................... 13 Acknowledgements ..................................................................................................................... 14 References .................................................................................................................................... 14
Transcript of How to Construct Narrative Networks using ThreadNet

1
HowtoConstructNarrativeNetworksusingThreadNet
Version 2.2 November 28, 2016
Brian T. Pentland ([email protected])
Michigan State University Overview ........................................................................................................................................ 2
Inputs........................................................................................................................................... 2 Outputs ........................................................................................................................................ 2 Hardware/software requirements ................................................................................................ 3
What is unique about ThreadNet? .............................................................................................. 3 Creating narrative networks ........................................................................................................ 3 Basic ThreadNet algorithm ......................................................................................................... 3 Putting actions in context ............................................................................................................ 4
What questions can I answer with ThreadNet? ......................................................................... 4 Description of action patterns ..................................................................................................... 4 Comparison of action patterns .................................................................................................... 4 Challenges and limitations .......................................................................................................... 5
ThreadNet in Five Easy Steps ...................................................................................................... 5 Step 1: Read data ........................................................................................................................ 5 Step 2: Define Threads and Vertices .......................................................................................... 6 Step 3: Select/compare subset (optional) .................................................................................... 6 Step 4: Output Options ............................................................................................................... 7 Step 5: Go! ................................................................................................................................ 10
Appendix A: Input file format ................................................................................................... 11 File types = .csv, .xls, .xlsx ....................................................................................................... 11 Required data types ................................................................................................................... 12
Appendix B: Analytic Outputs .................................................................................................. 12 Data and parameter settings ...................................................................................................... 12 Summary Of Threads ................................................................................................................ 12 Summary Of Networks ............................................................................................................. 12 Handoff Analysis ...................................................................................................................... 13 Frequency Of Attributes (by Attribute & Comparison Group) ................................................ 13 Frequency Of Sub-Sequences (by N-Gram And Comparison Group) ..................................... 13
Acknowledgements ..................................................................................................................... 14 References .................................................................................................................................... 14

2
OverviewThreadNet is a software application for visualizing and comparing patterns of action (Pentland, 2016). ThreadNet does this by converting threads of sequentially related events into networks. It provides a convenient way to construct what Pentland and Feldman (2007) refer to as a narrative network. It implements what Pentland and Liu (in press) call the "bottom-up" method for tracing associations between actions to create a network.
Figure 0: The Big Picture
Each input thread is a sequence of related events, such as the steps in a process or the events in a story. I find it useful to think of threads as narrative fragments: parts of stories. A thread can contain any number of events. Threads should be coherent; there should be a meaningful, sequential relation between events in the thread (Abbott, 1992). These events can be described by any number of attributes, such as the action, actors, tools, systems, location, and so forth. ThreadNet traces between events in the threads to identify edges in the network. In the resulting network, the nodes represent categories of events, and the edges represent sequential relations between those categories.
InputsThreadNet works equally well with data collected from observation, interview, computerized event logs, or any source that can provide a sequence of events. ThreadNet reads in a simple spreadsheet (.xls, .xlsx, or .csv) as input. Each row in the spreadsheet represents one event. Each column in the spreadsheet represents an attribute of the events (action, actor, location, etc). A thread is formed by any set of sequentially related rows, and a single spreadsheet can contain thousands of threads. The specific format is explained in more detail below.
OutputsThreadnet creates three kinds of outputs that allows users to describe and compare narrative networks:
1. visualizations of the input threads and the resulting network; 2. metrics that summarize the properties of the input threads and the resulting network; and 3. standard output files, so that the narrative network can be imported into other software
for visualization and analysis.

3
SystemrequirementsThreadNet runs on OS X (El Capitan or later) and Windows (Win 7), on systems with typical memory, disk and CPU. My MacBook Pro has 16GB RAM, but 8GB would be plenty.
• To run ThreadNet: A standalone, compiled application can be downloaded for OS X or Windows. For either platform, download the ThreadNet installer and follow the instructions. The installer will automatically download the necessary MatLab support libraries from www.mathworks.com.
• To modify ThreadNet: To edit the code, you will need MatLab 2016b, including the Bioinformatics Toolbox. Download the source code and dig in.
• ThreadNet can be downloaded from http://routines.broad.msu.edu.
WhatisuniqueaboutThreadNet?There are excellent tools for visualizing and analyzing networks (e.g., UCINet, Pajek, Gephi, NodeXL), for process mining (e.g., Pro/M, Fluxicon Disco) and for sequence analysis (e.g., TraMineR). These tools offer a wide range of sophisticated capabilities. However, ThreadNet is aimed at a particular gap in this landscape: creating narrative networks from a collection of narrative fragments (Pentland and Feldman, 2007; Pentland, 2016).
CreatingnarrativenetworksFor decades, organizational scholars have been articulating the importance of action patterns in organizing (Weick, 1969), narrative (Abbott, 1992; Czarniawska, 1997), routines (Nelson and Winter, 1982; Cohen et al, 1996) and process in general (Langley et al, 2013). The focus on patterns of action has become a foundation of recent work on organizational routines (Feldman and Pentland, 2003) and routine dynamics (Feldman, 2016; Feldman et al, 2016). In short, we have good reasons to expect that action patterns provide an interesting perspective on the social world. A narrative network is one way to express a pattern of actions (Pentland and Feldman, 2007). A narrative network (a.k.a., event network or action network) is distinctly different from a social network. In a narrative network, the nodes are actions or events, and the edges represent sequential relations between those events. Unlike a social network, it does not explicitly represent actors or ties between actors. Where an actor-network traces associations between actants (Latour, 2005), a narrative network traces associations between actions. Therefore, one cannot assume that familiar ideas from social network analysis will have a meaningful interpretation in the context of a narrative network.
BasicThreadNetalgorithmThreadNet constructs the narrative network by making two passes through the data. In the first pass, it identifies the nodes. In the second pass, it identifies the edges.
1. Define the nodes. To define the nodes that will be included in the network, ThreadNet scans through all of the events (the rows of the spreadsheet). Each row with a unique attribute or combination of attributes becomes a node in the network. Only the combinations that occur in the data appear in the network. Each node will have unique attributes, but all nodes represent events, so the network is unimodal.

4
2. Trace the edges. Follow each thread from one event to the next. Whenever the sequentially adjacent events within a thread are different, it adds an edge from one event to the next. The frequency of each pair of events can be used to indicate the strength of the tie between those events.
The resulting network is a valued, directed graph that is uni-modal (one kind of node) and uni-dimensional (one kind of edge). The network can be exported from ThreadNet as a comma delimited adjacency matrix or a GEXF file, for use in other software. For a more formal description of the ThreadNet algorithm, see Pentland, Recker and Wyner (2015).
Puttingactionsincontext(bydefiningnodesusingmultipleattributes)A distinctive feature of ThreadNet is the way it forms the network. The categories of action that form the vertices of the network can be defined in terms of multiple attributes (e.g., action, actor, location). Even if we know the action is "murder," it helps to know the context. ThreadNet allows us to distinguish between "Colonel Mustard, in the Kitchen, with the Candlestick" and "Professor Plum, in the Conservatory, with the Revolver", and so forth. More generally, ThreadNet provides a way to include the basic context of action into the definition of the actions in the network. Formal analysis will always be decontextualized to some extent (the map is not the terrain), but in many kinds of inquiry, it is important to distinguish the Kitchen from the Conservatory and the Candlestick from the Revolver.
WhatquestionscanIanswerwithThreadNet?Currently, ThreadNet is designed to address two basic kinds of question: describing a pattern of action, and comparing two or more patterns of action. The description and comparison is based on describing the pattern of action as a network. ThreadNet can also export the narrative network for visualization and analysis in other software, if so desired.
DescriptionofactionpatternsGiven a set of threads from a single process or routine, ThreadNet provides a variety of descriptive information:
• What does this routine look like as a network? • How are actions, actors and other dimensions in this routine related? • How complex is this routine (and other metrics, such as density)? • How prevalent are handoffs in this routine? • What sub-sequences are most common?
ComparisonofactionpatternsGiven a set of threads from multiple routines, ThreadNet can be used to compare those routines. In addition to descriptive information about each routine, ThreadNet computes measures of similarity based on the extent to which the threads share common attributes or common sub-sequences (1-gram, 2-gram, 3-gram and 4-gram). For esdach routine being compared, ThreadNet displays the most frequent sub-sequences in the data. This provides a detailed answer to the question: How similar/different are these routines?

5
The validity of this kind of comparison depends on representing the routines with a common lexicon (Pentland, 2003). When some attributes appear in one set of threads but not the others, one is tempted to say "this is apples-and-oranges" and give up on comparison. To address this problem, ThreadNet constructs a common lexicon (based on the attributes of the data) each time you click Go!. It counts n-grams and computes similarity based on that common lexicon.
Challengesandlimitations• Data must be carefully coded. The main challenge in using ThreadNet is in capturing
and coding the threads: sequences of related events, all described by a set of common attributes. All of the threads go into a single spreadsheet (events are the rows, attributes are the columns, and thread are blocks of adjacent rows). Coding actual processes and stories into a clean set of rows and columns requires editorial judgment and nerve. Categories need to be simplified; details need to be omitted. This is just "coding the data," but it involves a lot of decisions and interpretations.
• Threads do not capture simultaneous (parallel) activities. In real life, multiple things happen at the same time. That aspect of reality is omitted here.
• ThreadNet only captures adjacent pairs of events. When an event influences other events that are several steps away in the thread, that influence will not be captured. Those kinds of "higher order" dependencies will be lost in ThreadNet because it converts threads into pairs of adjacent events. It traces associations between events, but the network representation is limited to pair-wise associations.
• One routine or many? The current version of ThreadNet does not include any
functionality for clustering or separating a set of threads into multiple routines. However, given two or more sets of threads, ThreadNet provides metrics for how similar/different they are (based on frequencies of attributes and sub-sequences).
ThreadNetinFiveEasySteps
Step1:Readdata
Figure 1: ThreadNet interface
When you click the Load New button, ThreadNet presents a dialog box that lets you select a file (.xls, .xlsx, or .csv). At any time, you can Show Data, although this function can take a few

6
minutes with a large data set. You can also Reset to the original state as if the data was freshly loaded.
Step2:DefineThreadsandVerticesBefore ThreadNet can convert threads into a network, you need to tell it which fields contain the data that defines the threads. The following three steps need to be completed in order:
1. ThreadID: Which column in the spreadsheet contains the ThreadID? This can be any identifier that defines the case or narrative fragment. In the sample data, the field is called CaseID. The ThreadID should be the same for all rows in the same thread.
2. Sequence: Which column in the spreadsheet contains the Sequence? In the sample data, the field is called SeqNo. It contains an integer from 1 to n. It restarts at 1 in each thread.
3. Define Vertices (nodes): Each column in the spreadsheet contains an attribute that can contribute to the definition of the nodes in the narrative network. You can choose any attributes or set of attributes to define the nodes. Each unique combination of attributes will result in a single node in the network. For example, in Figure 2, three attributes are selected (Action, Actor and Artifact).
When the choices in Step 2 are completed, you can jump to Step 5 and click Go!
Figure 2: Define Threads and Vertices
Step3:Select/comparesubset(optional)If the spreadsheet contains threads from more than one routine, you can select a subset of data by checking Select Subset, as shown in Figure 3. These subsets are sometimes referred to as "comparison groups" later in this document and in the ThreadNet output file.

7
Figure 3: Select/compare subset
When selecting a subset of data, the first step is to decide what attribute you will use to make the selection. For example, in the example data, there are four departments (DeptCode). You can select one or more values of the attribute. The selection determines the number of threads that are included in the sub-sample. Each time the selection is changed, the number of threads is updated. Selecting one value. If you select one value of the attribute (e.g., one department), then the threads for that single attribute value are used to create a network and compute its properties. Selecting multiple values. If you select multiple values, the threads are aggregated into a single network in the visualizations. To see separate graphs for each attribute value, select the Compare box. ThreadNet will draw separate graphs for each subset of the data and display them in a single window. In the output file, xxx_results.txt, each subset is analyzed separately and the results are presented in a table, regardless of whether the Compare box is checked or not.
Step4:OutputOptionsThreadNet has a number of output options for visualizing, displaying metrics, and creating files that can be transferred to other software for other analysis. Transition matrix (a.k.a. adjacency matrix). The transition matrix that represents the network is presented by default. The axes indicate the number of nodes in the network. The colored patches indicate the edges. The darker the color, the greater the frequency of sequential relationship between the edges. The color bar on the right of the figure shows the relationship between the color and the frequency. When the color is white, there is no connection. As the number of nodes gets larger, it will tend to become more sparse. Figures 4a and 4b show the data for one type of problem (ProbType=21). The difference between the two figures is in the number of attributes used to define the nodes.

8
Figure 4(a & b): Two transition matrices
❑ Show Thread Map The thread map provides a quick visual impression of the variability in the threads. Each color represents a unique combination of attribute values. Thus, each color represents a node in the network. These windows can be resized, saved and printed. In these two examples, most of the threads start with the same color, which means they start at the same node in the network.
Figure 5: Two thread maps
9
❑ Show Digraph This option generates two graphs, each in a separate window. One of them is a 2-D format. The other is the same graph in a 3-D format, where the third dimension is the difference between the in/out degree of each node. These graphs can be resized, rotated in 3D and saved in a variety of formats (a built-in feature of MatLab).
Figure 6: 2D and 3D graphs of ProbType =21
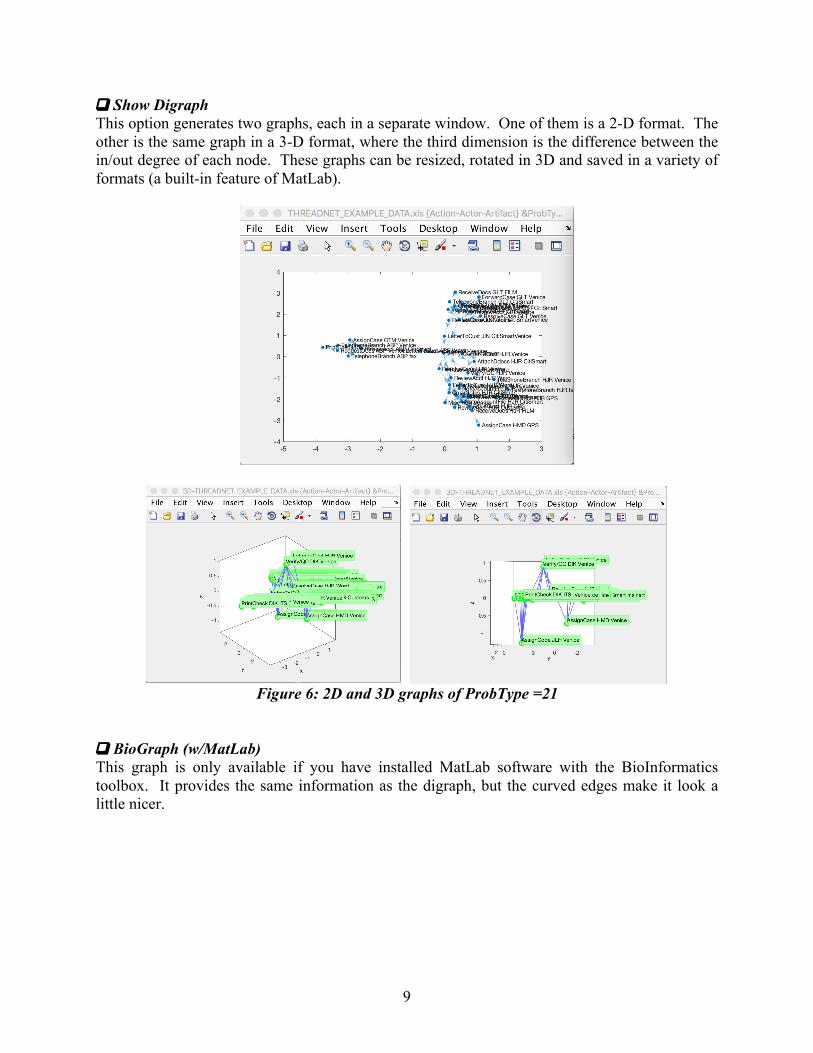
❑ BioGraph (w/MatLab) This graph is only available if you have installed MatLab software with the BioInformatics toolbox. It provides the same information as the digraph, but the curved edges make it look a little nicer.

10
Figure 6: BioGraph of ProbType=21
(only available if MatLab Bioinformatics Toolbox is installed) ❑ Write results.txt This option produces an output file that includes:
• descriptive statistics for the input data; • various metrics for the narrative network • sub-sample comparative data, if requested • frequencies of sub-sequences (n-grams) in each sub-sample
❑ Adjacency Matrix.txt This produces a comma delimited text file that represents the narrative network as an adjacency matrix (a.k.a, transition matrix). It can be imported into other software for further visualization and analysis. ❑ .GEFX file This produces an XML file that represents the narrative network as an adjacency matrix (a.k.a, transition matrix). GEFX is a standard format that can be imported into other software for further visualization and analysis.
Step5:Go!When you click Go!, ThreadNet converts the threads into a narrative network using the options you have selected. For small data sets (less than 100 threads), it should take a few seconds. For larger data sets (thousands of threads, and hundreds of unique nodes), it may take a few minutes.

11
AppendixA:InputfileformatThe file THREADNET_EXAMPLE_DATA.xls is provided as an example.
• The input file is a single spreadsheet that contains a collection of threads, from 1 to tens of thousands of threads.
• Threads contain sequences of events. The minimum thread is two events; there is no maximum.
• Each row in the input file is an event, described by a ThreadID, Sequence Number and other attributes. In this example, attributes are Action, Person and System.
• The first row of the spreadsheet contains the variable labels. • Each column is an attribute of the events. • Each thread must have a unique ID number. • Within each thread, all events must have the same ID number. • Within each thread, each event must have a unique Sequence Number (1, 2, ... n).
ThreadNet re-sorts your data according to the Sequence Number in Step 2.
ThreadID SeqNumber Action Person System More attributes... Text or numeric
Numeric Only
Text or numeric
Text or numeric
Text or numeric
Text or numeric
10010421 1 LogIn MYM ITS
10010421 2 ReviewAcct NIC IPS
10010421 3 SearchCINS NIC BOS
10010421 4 NoteAccountFile NIC CitiSmart
10010421 5 LetterToCust NIC LetterGenerator
10010421 6 EmailToCust GUF Lotus
10010421 7 LogOut HNH ITS
10010421 8 Verify/QC LOG ITS
93120226 1 AssignCase LDR Venice
93120226 2 ReviewAcct HMD CitiSmart
93120226 3 LetterToCust HMD Venice
93120226 4 Verify/QC DIK Venice
92912260 1 AssignCase AUK Venice
92912260 2 RequestDocs EBM CitiSmart
92912260 3 ReceiveDocs EBM FILM
92912260 4 ResolveCase EBM Venice
92912260 5 Verify/QC AVJ CitiSmart
Filetypes=.csv,.xls,.xlsx

12
RequireddatatypesThe Sequence Number must be numeric (so that it sorts correctly). The other fields can be text or numeric, but they will be converted to text inside the program. The text fields will work best if they do not contain spaces.
AppendixB:AnalyticOutputsWhen requested, ThreadNet writes an output file that contains a variety of metrics, as described here. The output file is names by taking the name of the input file and appending "_results.txt" to the end. For "THREADNET_EXAMPLE_DATA.xls", the output file is named: "THREADNET_EXAMPLE_DATA.xls_results.txt"
DataandparametersettingsThe first two rows of the file contain the name of the input file and the basic settings used in the analysis. In this example, vertices were defined by a single attribute ("Action") and three sub-samples were included in the analysis (DeptCode=(1,2,3)). Each sub-sample forms a "comparison group" in the analysis.
THREADNET_EXAMPLE_DATA.xls {Action} & DeptCode=(1,2,3) 24-Nov-2016 22:38:15
SummaryOfThreadsFor each comparison group in the data, ThreadNet provides some descriptive measures of the input data:
• nRows: number of rows in the input spreadsheet • nThreads (unique): number of threads in the sub-sample, and the number of those
threads that are unique • Length (Min/Ave/Max): the minimum, average and maximum length of the threads in
the sub-sample • SW-idx: Shannon-Wiener index is a measure of the diversity of the threads in the data.
The Shannon index is also used as a measure of ecological diversity. It is closely related to entropy (see https://en.wikipedia.org/wiki/Diversity_index).
SummaryOfNetworksFor each comparison group in the data, ThreadNet provides some descriptive measures of the resulting network data:
• Vertices: the number of vertices (nodes) in the network • Edges: the number of edges (ties) in the network • Density: The density of the network. • RecipEdges: the number of pairs of vertices that are connected in both directions
(A --> B and B --> A). • 3cycles: the number of 3-cycles in the graph. (A--> B --> C --> A). • Complexity: estimated number of paths in the network, which is a measure of task or
process complexity (Hærem, Pentland and Miller, 2015). This is a logarithmic scale; each increase of 1 unit implies a 10-fold increase in the estimated number of paths.

13
• HO_idx: Edges in a narrative network can be conceptualized as handoffs (Pentland, Recker and Wyner, 2016). On average, across the network, how many event attributes change in each handoff (from one event to the next)?
• CO_idx: This is simply the inverse of the HO_idx: on average, how many attributes stay the same?
HandoffAnalysisThe handoff analysis provides a count of the number of handoffs as conceptualized in Pentland, Recker and Wyner (2016), Rediscovering Handoffs, Academy of Management Discoveries. It provides a more detailed breakdown of the handoff index (HO_idx) and its complement, the coherence index (CO_idx). This break down is reported for each sub-sample (comparison group) selected in Step 3. When there is a single attribute selected to define the nodes in Step 2, the handoff analysis is not very interesting. For any single attribute, the handoff index (HO_idx) is always equal to 1, and all handoffs are the same type. When there are multiple attributes selected in Step 2, then there can be multiple kinds of handoffs. For example, if there are two attributes (A & B), then there are three kinds of handoffs (A, B, and A+B). In general, there are 2N-1 types of handoffs, where N is the number of attributes used to define the nodes. When a handoff is counted as one of the 2N-1 types of handoffs, it means that only the specific, stated attributes are changing. If A+B changed in one edge, then tha edge would not be counted as an "A" handoff or an "B" handoff. Rather, it would be counted once as an "A+B" handoff. If there are 0 handoffs of type "A", it means that there were no edges in the graph where that single attribute (A) changed by itself. wweq
FrequencyOfAttributes(byAttribute&ComparisonGroup)This section compares the sub-samples selected in Step 3 using the attributes that are selected in Step 2 to define the nodes. For each comparison group, ThreadNet counts the frequency of each value of each attribute. In the output file, the 20 most frequent attribute values are reported. If there is more than one attribute selected in Step 2, ThreadNet counts the frequencies for each. If there is more than one comparison group selected in Step 3, the vector of n-gram frequencies is used to compare the sub-samples using cosine distance. Although the top 20 values are reported in the output file, the entire vector of values is used to compute the distances.
FrequencyOfSub-Sequences(byN-GramAndComparisonGroup)This section compares the sub-samples selected in Step 3 using the frequency of four n-grams in the threads (1-gram, 2-gram, 3-gram, 4-gram). For each comparison group, ThreadNet counts the frequency of each n-gram. If there is more than one comparison group, the vector of attributes is used to compare the sub-samples using cosine distance. In the output file, the 20 most frequent n-grams are reported.

14
If there is more than one comparison group selected in Step 3, the vector of n-gram frequencies is used to compare the sub-samples using cosine distance. The top 20 values are reported in the output file, but the entire vector of values is used to compute the distances.
AcknowledgementsThe initial prototype of ThreadNet was implemented by Yu Lucy Han, a student in the MS-Business Analytics program at Michigan State University. She designed the clever and efficient method of defining nodes with multiple attributes that is at the core of this software. That part has worked well right from the start. All the subsequent errors and bugs are my own. And thanks to my colleagues and co-conspirators (Martha Feldman, Thorvald Hærem, Jan Recker, George Wyner, Julie Ryan, Steve Barley, Paul Leonardi, Kent Miller, Mathias Hansson, Peng Liu, Derek Hillison, Waldemar Kremser and many others) who have been helping figure out what is interesting about action patterns...
ReferencesAbbott, A. (1992) From Causes to Events: Notes on Narrative Positivism, Sociological Methods and Research,
20:428-55.Cohen, M. D., Burkhart, R., Dosi, G., Egidi, M., Marengo, L., Warglien, M., & Winter, S. (1996) Routines and other
recurring action patterns of organizations: contemporary research issues, Industrial and corporate change, 5: 653-698.
Czarniawska, B. (1997). Narrating the organization: Dramas of institutional identity. University of Chicago Press. Feldman, M.S. (2016) Routines as process: Past, present and future. In Claus Rerup and Jennifer Howard-Grenville
(eds.). Organizational routines and process organization studies. Perspectives on Process Organization Studies Series, Oxford University Press.
Feldman, M.S. and Pentland, B.T. (2003) Reconceptualizing organizational routines as a source of flexibility and change, Administrative science quarterly, 48: 94-118.
Feldman, M.S. and Pentland, B.T., D'Adderio, L. and Lazaric, N. (2016) Beyond routines as things: Introduction to the special issue on routine dynamics, Organization Science, 27(3), 505-513.
Hærem, T. Pentland, B. T., and Miller, K. D. (2015) Task complexity: Extending a core concept, Academy of Management Review, 40(3): 446-460.
Langley, A., Smallman, C., Tsoukas, H., & Van de Ven, A. H. (2013) Process studies of change in organization and management: unveiling temporality, activity, and flow, Academy of Management Journal, 56(1), 1-13.
Latour, B. (2005) Reassembling the Social: An Introduction to Actor-Network Theory. Oxford University Press, Oxford.
Pentland, B. T. (2003) Conceptualizing and Measuring Variety in Organizational Work Processes, Management Science, 49(7): 857-870.
Pentland, B. T. and Feldman, M. S. (2007) Narrative Networks: Patterns of technology and organization, Organization Science, 18(5), 781-795.
Pentland, B.T., Recker, J. and Wyner, G. (2015) A thermometer for interdependence: Exploring patterns of interdependence using networks of affordances, Thirty Sixth International Conference on Information Systems, Ft. Worth, TX.
Pentland, B.T., Recker, J. and Wyner, G. (2016) Rediscovering Handoffs, Academy of Management Discoveries, doi:10.5465/amd.2016.0018
Pentland, B.T. (2016) ThreadNet: Tracing and visualizing associations between actions, IFIP Working Group 8.2, Dublin, Ireland.
Pentland, B.T. & Liu, P. (in press) Network Models of Organizational Routines: Tracing Associations Between Actions, in S. Jain and R. Mir (Eds), Routledge Companion to Qualitative Research in Organization Studies.
Ryan, J. L., Pinto, D., Pentland, A. P., & Pentland, B. T. (2016). Complexity thermometer: Unraveling complexity of clinic process. Journal of Investigative Dermatology, 136(5), S26.
Weick, K. E. (1969) The social psychology of organizing. Reading, Addison-Wesley.