How to Avoid the Lies and Damned Lies: Pitfalls of Data Analysis Clay Helberg Special Topics in...
12
How to Avoid the Lies and Damned Lies: Pitfalls of Data Analysis Clay Helberg Special Topics in Marketing Research Dr. Charles Trappey Summarized by Kevin Beyer
-
Upload
daisy-gallagher -
Category
Documents
-
view
215 -
download
0
Transcript of How to Avoid the Lies and Damned Lies: Pitfalls of Data Analysis Clay Helberg Special Topics in...
How to Avoid the Lies and Damned Lies: Pitfalls of Data Analysis Clay Helberg
Special Topics in Marketing Research
Dr. Charles Trappey
Summarized by Kevin Beyer

The Problem with Statistics
“There are three kinds of lies; lies, damned lies and statistics.” Twain or Desraeli
Statistics requires the ability to consider things from a probabilistic perspective.
Non-mathematicians view numbers as if they must be right, and therefore anything that isn’t ‘right’ must be ‘wrong’.
Statistical Pitfalls: I.Sources of Bias, II.Errors in Methodology, III.Interpretation of Results
I. Sources of Bias
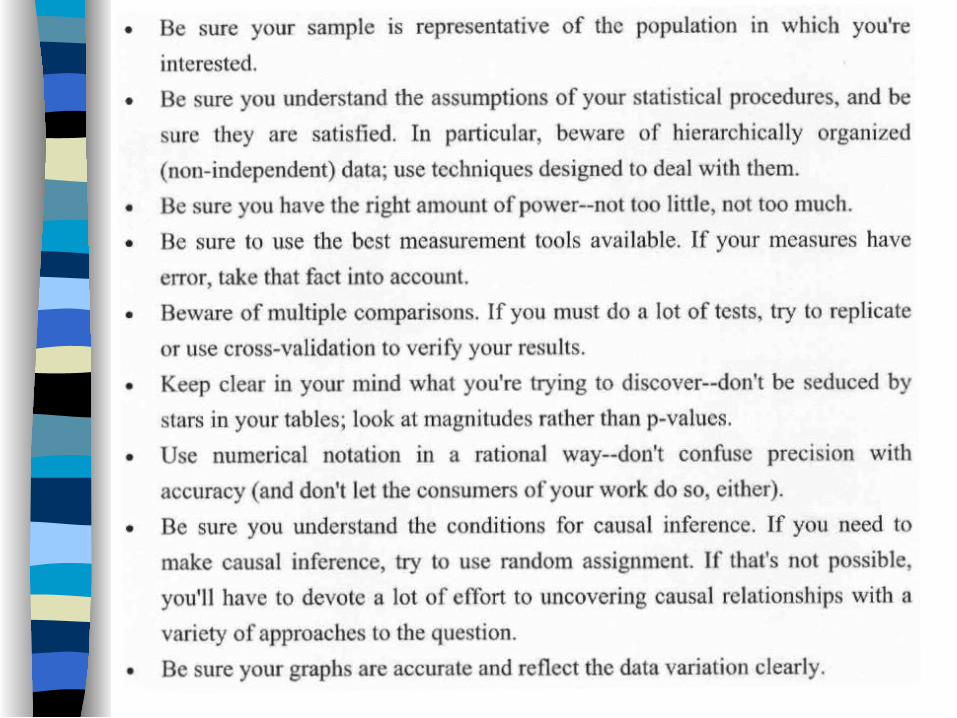
1. Representative Sampling– The observed sample must represent the
target population• Problematic sample = one that doesn’t
parallel the population
– Can’t always control for all of the key characteristics

I. Sources of Bias
2. Statistical Assumption– The validity of statistical procedure depends on
statistical assumptions• ANOVA depends on the assumption of normality and
independence• Creates a temptation to ignore any non-normality.• Should try to find reasons why; measurement artifact ->
develop a better measuring tool.
– Assumption of independence is often violated• Observations that are linked in some way may show
dependencies• Aggregating cases to the higher level is one way around
this.

II. Errors in Methodology
1. Statistical Power • Vertical dotted line reps. the point-null hypothesis• Solid vertical line represents a criterion for significance• Alpha = probability of a Type I error (reject null when shouldn’t)• Beta = probability of a Type II error (don’t reject null when should)• Power refers to your ability to avoid a Type II error
– Depends on sample size, effect size, alpha, variability

II. Errors in Methodology
1. Statistical Power Cont’d Too little power, you run the risk of missing
the effect you’re trying to find Important if you’re looking to claim ‘no
difference’ - it may be there, but the sample size may be too small.
Too much power can result in tiny or meaningless differences being statistically significant.
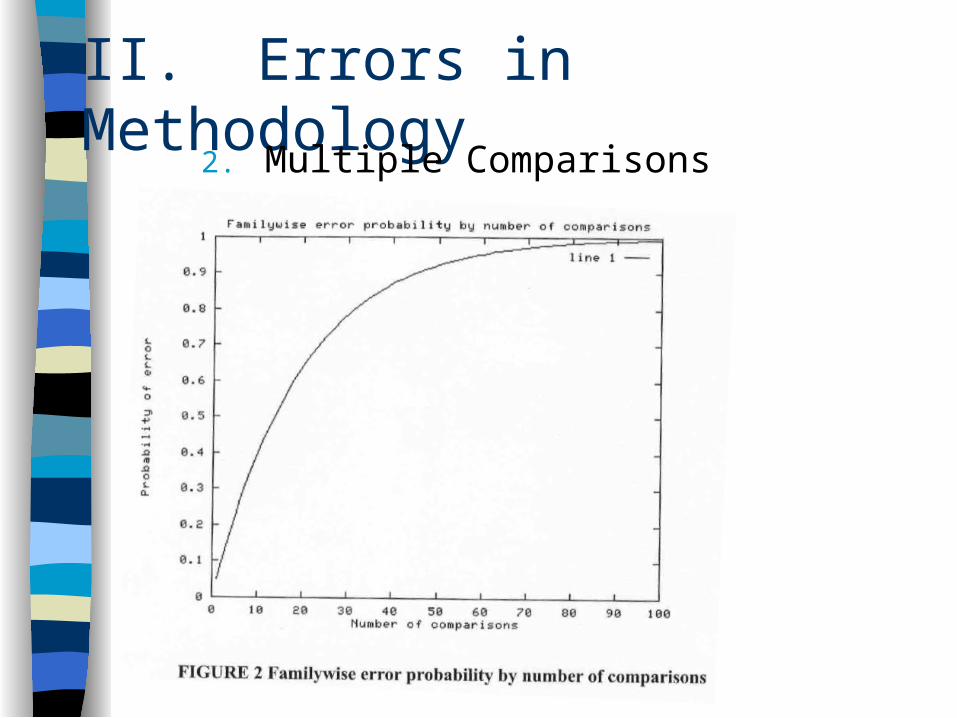
II. Errors in Methodology2. Multiple Comparisons

II. Errors in Methodology2. Multiple Comparisons

II. Errors in Methodology
3. Measurement Error• Occurs especially is ‘noisy’ data, like
surveys• Important characteristics of measurement
are reliability and validity• Reliability is the ability of instrument to
measure the same thing each time• Validity is the extent in which the indicator is
able to measure the thing it is meant to measure
III. Problems with Interpretation
1. Confusion Over Significance• Statistical significance and practical significance
are not the same
2. Precision and Accuracy• Precision = how finely a specimen is specified
(4.097 is more precise than 4.0)• Accuracy = how close an estimate is to the true
value• Estimates can be precise without being accurate• Don’t report more decimal places than are
meaningful

III. Problems with Interpretation
3. Causality• The bottom line on causality; you must
have random assignment• The experimenter must be assigning values
of predicator variables to cases.
• A -> B, B -> A, A <- X -> B
4. Graphic Representations• It is easy to confuse readers when
presenting quantitative info. Graphically