How to analyse auto-enrolment default funds - … · How to analyse auto-enrolment default funds...
36
How to analyse auto-enrolment default funds January 2017 Accredited by Sponsor
Transcript of How to analyse auto-enrolment default funds - … · How to analyse auto-enrolment default funds...

How to analyse auto-enrolment default funds
January 2017
Accredited bySponsor

2
Contents
ABI Association of British Insurers
AMC Annual management charge
CIO Chief Investment Officer
CPI Consumer price index
DC Defined contribution
ESG Environmental, social and governance
FCA Financial Conduct Authority
IC Investment committee
IGC Investment governance committee
MVO Mean variance optimisation
NEST National Employment Savings Trust
TCF Treating customers fairly
TER Total expense ratio
TPR The Pensions Regulator
RPI Retail price index
UFPLS Uncrystallised funds pension lump sum
Acronyms
Target audience 3
Introduction 4
Learning objectives 5
Part 1 – Analysis of the key factors to consider when reviewing default funds
6
Default fund due diligence checklist 10
Part 2 – Analysis of the most commonly used default funds
11
Part 3 – NEST and its default fund 20
Conclusion 28
Test yourself for CPD 32
3
Target audienceThis case study is written for professional financial advisers and paraplanners responsible for researching and recommending auto-enrolment pension schemes.
While not authorised to provide investment advice, this case study will also be of interest to accountants and bookkeepers who are looking to provide their clients with an enhanced service through the involvement of a regulated adviser and/or by at least understanding what is available in the market to inform their clients.
This case study should not be considered as evidence to support any recommendations or endorsement of any specific provider or scheme. Advisers should conduct their own research and document their findings before recommending any solutions.
Patrick Norwood Insight Analyst (Funds) [email protected]
Richard Hulbert Insight Analyst (Wealth products) [email protected]
Authors
4
We highlight the key factors we feel advisers should understand, have an awareness of and be considering when reviewing the default fund on offer, especially as historically 9 out of 10 savers have remained in the default fund from inception to retirement.
Being able to recommend a scheme after evidence-based analysis of the default fund places financial advisers in a very strong position with their client. We have split this case study into three parts:
IntroductionIn this case study we independently review the defined contribution (DC) market place and more specifically the auto-enrolment propositions and their default funds.
In the first part we set the scene with background information relating to the auto-enrolment scheme landscape, scheme structures and variations. We then analyse and compare the most commonly used default fund options available, across several different criteria. Finally, we look at NEST’s default fund offering with the objective of helping readers to understand their approach and positioning compared to peers.
Auto-enrolment has now been with us for over three years, with some 200,000 large employers having already gone through staging. The market is now splitting into three groups:
1. Employers still to stage: commonly these have fewer than 30 employees
2. Employers who have already staged and are dissatisfied with their current solution
3. Employers who have already staged and are satisfied with their current solution
This study will focus on the needs of the first two groups.
The overarching need for regulated advisers is to be able to evidence ‘value for money’. This does not mean the cheapest solution, neither does it mean the best performing fund, but rather an assessment that includes these elements but ultimately creates a good outcome for the consumer.
1. Analysis of the key factors to consider when reviewing default funds
2. Comparison of the most commonly used default funds
3. Specific focus on the National Employment Savings Trust (NEST) proposition
Evidence value for money
5
Reading this publication will enable you to:
Learning objectivesThis case study is accredited by the CII/PFS and CISI for up to 60 minutes of structured CPD.
1 Understand the different default investment strategies available, focusing upon the accumulation phase
2 Identify the main differentiating factors to be considered between the individual default investment propositions including:
• The investment management procedures and responsibilities• Implications of in-house and outsourced management• Clarity, robustness and repeatability of decision making• How defaults are performing against benchmarks and peers• Suitability of the default and identifying value for money
3 Understand how the various default propositions in the market differ from each other to support market research and due diligence
For clarification, NEST has commissioned Defaqto to undertake this review of default funds in the auto-enrolment pension scheme market place. A comparison of the NEST proposition with its peers will help advisers understand how the proposition fits in the market.
To do this, Defaqto has detailed the independent assessment criteria and factors advisers should be considering and evidencing to impartially research default funds as part of their compliant due diligence process.
6
Part 1 – Analysis of the key factors to consider when reviewing default funds
INSERT IMAGE
6
• Aegon
• Aviva
• B&CE (The People’s Pension)
• Friends Life
• Legal & General Investment Managers (LGIM)
• NEST
• NOW Pensions
• Prudential
• Royal London
• Scottish Widows
• Standard Life
Scene settingWith so many schemes available for the purpose of this study, we have focused on those most commonly used based on the value of assets under their management, namely:

7
1. Good governance, what this looks like and how it is evidenced
2. The provider’s financial strength and/or capability
3. The implications of in-house and outsourced investment management
4. The investment management procedures and responsibilities
5. The clarity, robustness and repeatability of decision making
6. How defaults are performing against benchmarks and peers
7. The suitability of the default fund and identifying value for money
Key factors to considerBelow are the key factors we believe should be considered:
We will go into detail for factors 3 to 7 above, which are those that are most related to investment (the main focus of this study).
The implications of in-house and outsourced investment managementResearchers should look at the investment committee that has the remit to run and manage the default fund and ascertain what, if any, conflicts of interests exist and how ‘value for money’ is being evidenced. For example, if XYZ is the pension provider and the default fund only invests in funds from XYZ, then this may affect analysis of independence and costs.
The implication for in-house arrangements is that there may be a greater chance of a conflict of interest existing between the provider’s needs and those who are invested in the default fund. In addition, without independent oversight, it may be more difficult for those making investment decisions and/or managing the funds to be removed easily or prudently.
Independence is considered essential by both regulators (FCA and TPR) to reduce the possibility of any potential for conflicts of interests. Indeed, the FCA has regulated that contract-based schemes should have an independent governance committee (IGC) that must publicly report to members on at least an annual basis.
The FCA has placed a duty on IGCs to scrutinise the ‘value for money’. An IGC has a minimum of five members, the majority of whom must be independent, including an independent chair, and must:
• Act solely in the interests of relevant scheme members
• Act independently of the provider
8
The TPR guidance is less around independence and evidencing ‘value for money’ and more around requiring trustees to have strong governance and protecting member’s interests. Full details can be found in the DC code, and advisers should familiarise themselves with this before recommending a trust-based scheme. It can be found at:
thepensionsregulator.gov.uk/codes/code-governance-administration-occupational-dc-trust-based-schemes.aspx
Many schemes are run on a hybrid basis, whereby the overall strategy is designed and managed
in-house with elements such as investment management outsourced to independent third parties. It is not unusual to find some form of independent scrutiny and reporting being undertaken on the in-house decisions, and these reports can aid the selection process.
Impartial oversight and/or outsourcing to independent third parties does not necessarily increase costs, indeed the opposite can sometimes be true. Importantly, they provide managers and trustees with the ability to appoint professionals to meet specific needs and target them accordingly, with failure potentially resulting in their prompt replacement.
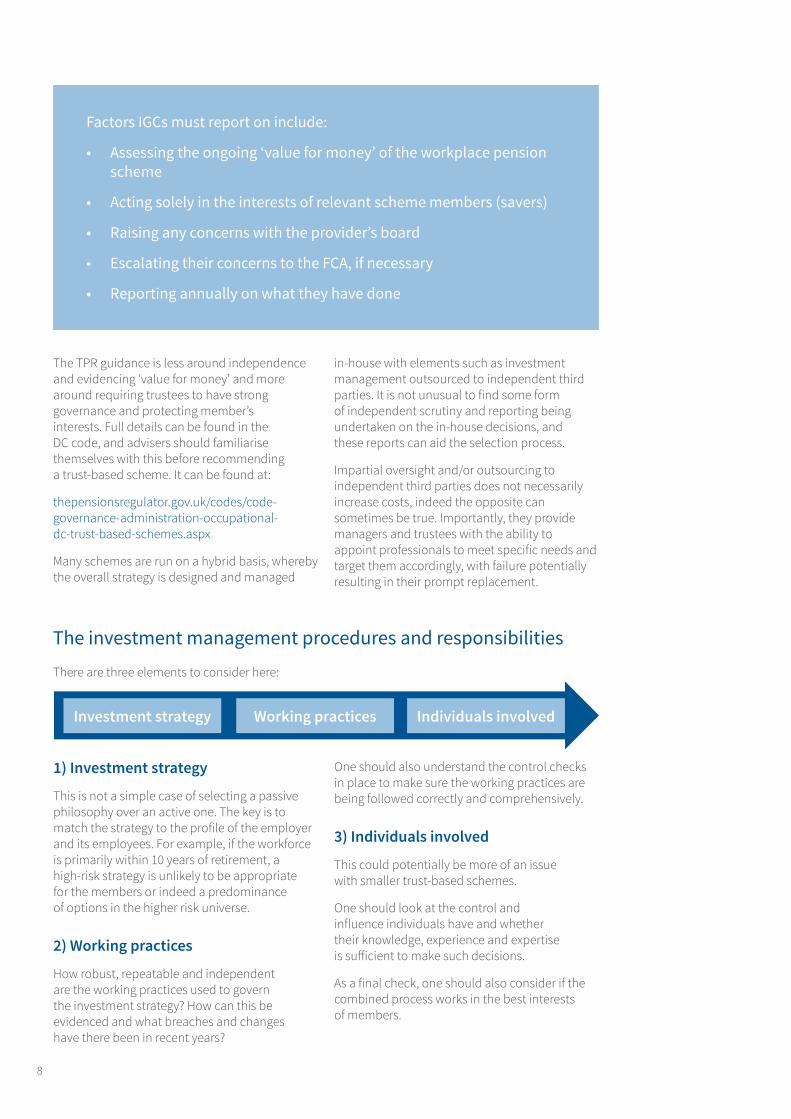
Factors IGCs must report on include:
• Assessing the ongoing ‘value for money’ of the workplace pension scheme
• Acting solely in the interests of relevant scheme members (savers)
• Raising any concerns with the provider’s board
• Escalating their concerns to the FCA, if necessary
• Reporting annually on what they have done
The investment management procedures and responsibilities
Investment strategy Working practices Individuals involved
There are three elements to consider here:
1) Investment strategy
This is not a simple case of selecting a passive philosophy over an active one. The key is to match the strategy to the profile of the employer and its employees. For example, if the workforce is primarily within 10 years of retirement, a high-risk strategy is unlikely to be appropriate for the members or indeed a predominance of options in the higher risk universe.
2) Working practices
How robust, repeatable and independent are the working practices used to govern the investment strategy? How can this be evidenced and what breaches and changes have there been in recent years?
One should also understand the control checks in place to make sure the working practices are being followed correctly and comprehensively.
3) Individuals involved
This could potentially be more of an issue with smaller trust-based schemes.
One should look at the control and influence individuals have and whether their knowledge, experience and expertise is sufficient to make such decisions.
As a final check, one should also consider if the combined process works in the best interests of members.
9
Having a clear, understandable and documented decision-making process is essential.
Advisers should be checking that there is a documented (freely available) clear structure and decision-making process in place. Questions should be asked about how the processes are managed and compliance checked. In particular, when exceptions have occurred, what impact have these had on savers?
The nature of auto-enrolment is that with capital growth and ongoing contributions, the value of the funds under administration will grow quickly and significantly. Historically,
some funds have reached saturation points where their size makes it difficult for them to trade competitively, for example selling a £1m shareholding in a company is a lot easier than selling a £50m holding.
Advisers should be looking for schemes that are not necessarily constrained by their size, irrespective of their performance. Those schemes that can facilitate investment through diversification of asset classes and investment managers are quite often better able to meet this need. In other words, exposure to, say, the UK stock market is provided through more than one asset class, fund and/or manager.
Many of the factors we have discussed so far are subjective, and not all providers will be able to answer all of your questions. Evidence-based analysis is therefore critically important to evidence suitability and value for money of the default fund.
Benchmarking provides a clear parameter by which initial and ongoing suitability can be assessed and should be agreed with the client as being appropriate. Advisers should also agree an appropriate timescale for the benchmark assessment period.
We also see some providers opting to use composite benchmarks, ie different benchmarks for different elements of the assets held. While composite benchmarks may work well for providers and fund managers, they are almost incomprehensible to the average consumer and therefore somewhat meaningless.
Some providers combine options A, B and/or C with D (a volatility band) and this can be a good way to monitor both volatility (risk) and overall return.
Advisers should also agree an appropriate timescale for the benchmark assessment period. Pension fund providers often talk about 20+ year returns, especially those investing in infrastructure projects (building railways, power stations etc). However, for many savers, 20 years will be around half of their working life and advisers would be irresponsible to leave their clients in a poor performing fund for that long.
At Defaqto, we consider anything less than three years’ performance to be insufficient to draw any meaningful conclusion; ideally one should be looking at five or more years.
Irrespective of the provider’s preferred benchmark, we suggest advisers recommend a benchmark that is relevant and easily understood by both employers and employees. For many, we would expect this to be either option B or C, perhaps with D overlaid.
Providers preferred benchmarks vary greatly across the industry, common examples including:
A Association of British Insurers Mixed Investment 40-85% Shares
B Cash + x% pa
C Inflation (CPI or RPI) + x%
D Volatility
The clarity, robustness and repeatability of decision making
How defaults are performing against benchmarks and peers
10
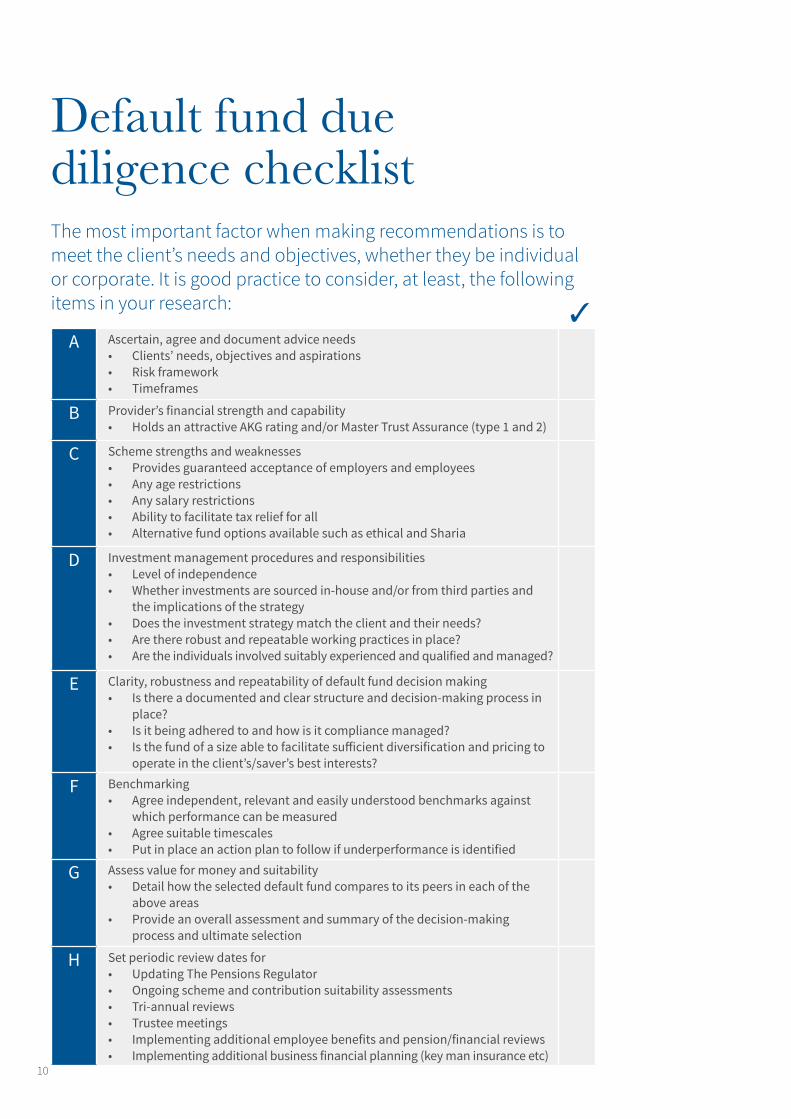
A Ascertain, agree and document advice needs• Clients’ needs, objectives and aspirations• Risk framework• Timeframes
B Provider’s financial strength and capability• Holds an attractive AKG rating and/or Master Trust Assurance (type 1 and 2)
C Scheme strengths and weaknesses• Provides guaranteed acceptance of employers and employees• Any age restrictions• Any salary restrictions• Ability to facilitate tax relief for all• Alternative fund options available such as ethical and Sharia
D Investment management procedures and responsibilities• Level of independence• Whether investments are sourced in-house and/or from third parties and
the implications of the strategy• Does the investment strategy match the client and their needs?• Are there robust and repeatable working practices in place?• Are the individuals involved suitably experienced and qualified and managed?
E Clarity, robustness and repeatability of default fund decision making • Is there a documented and clear structure and decision-making process in
place?• Is it being adhered to and how is it compliance managed?• Is the fund of a size able to facilitate sufficient diversification and pricing to
operate in the client’s/saver’s best interests?
F Benchmarking• Agree independent, relevant and easily understood benchmarks against
which performance can be measured• Agree suitable timescales• Put in place an action plan to follow if underperformance is identified
G Assess value for money and suitability• Detail how the selected default fund compares to its peers in each of the
above areas• Provide an overall assessment and summary of the decision-making
process and ultimate selection
H Set periodic review dates for• Updating The Pensions Regulator• Ongoing scheme and contribution suitability assessments• Tri-annual reviews• Trustee meetings• Implementing additional employee benefits and pension/financial reviews• Implementing additional business financial planning (key man insurance etc)
Default fund due diligence checklistThe most important factor when making recommendations is to meet the client’s needs and objectives, whether they be individual or corporate. It is good practice to consider, at least, the following items in your research: 3
11
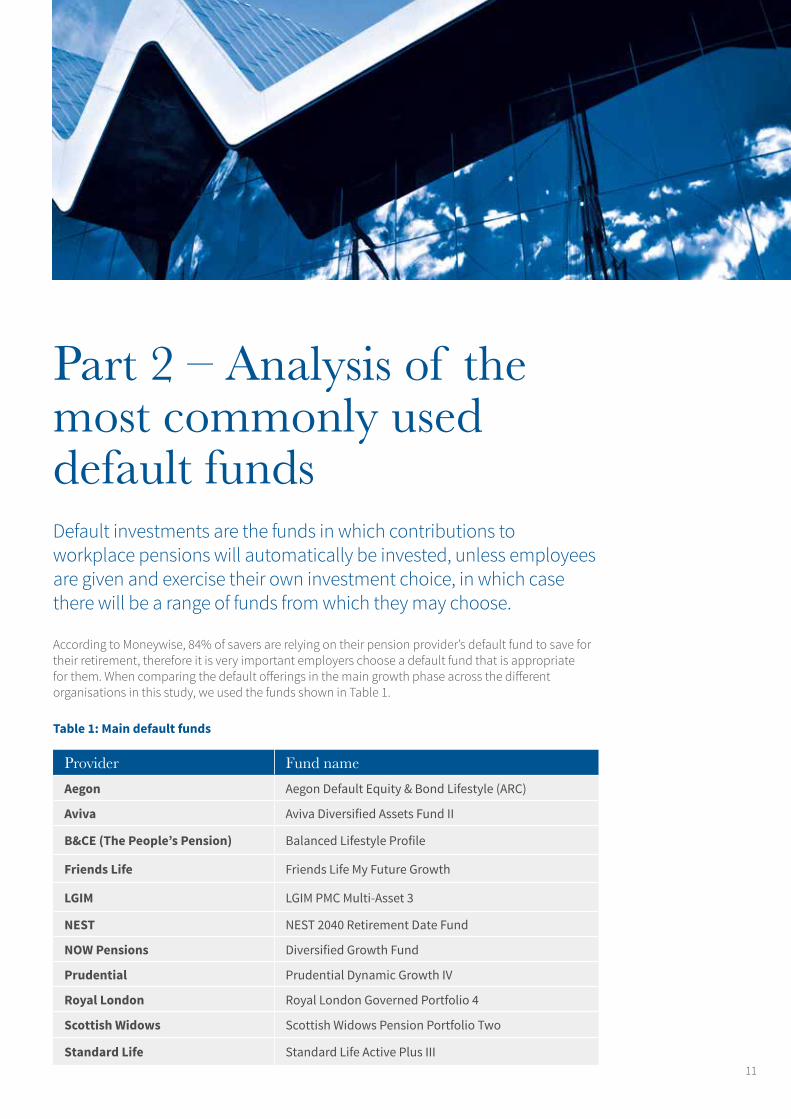
According to Moneywise, 84% of savers are relying on their pension provider’s default fund to save for their retirement, therefore it is very important employers choose a default fund that is appropriate for them. When comparing the default offerings in the main growth phase across the different organisations in this study, we used the funds shown in Table 1.
Table 1: Main default funds
Part 2 – Analysis of the most commonly used default fundsDefault investments are the funds in which contributions to workplace pensions will automatically be invested, unless employees are given and exercise their own investment choice, in which case there will be a range of funds from which they may choose.
Provider Fund nameAegon Aegon Default Equity & Bond Lifestyle (ARC)
Aviva Aviva Diversified Assets Fund II
B&CE (The People’s Pension) Balanced Lifestyle Profile
Friends Life Friends Life My Future Growth
LGIM LGIM PMC Multi-Asset 3
NEST NEST 2040 Retirement Date Fund
NOW Pensions Diversified Growth Fund
Prudential Prudential Dynamic Growth IV
Royal London Royal London Governed Portfolio 4
Scottish Widows Scottish Widows Pension Portfolio Two
Standard Life Standard Life Active Plus III
12
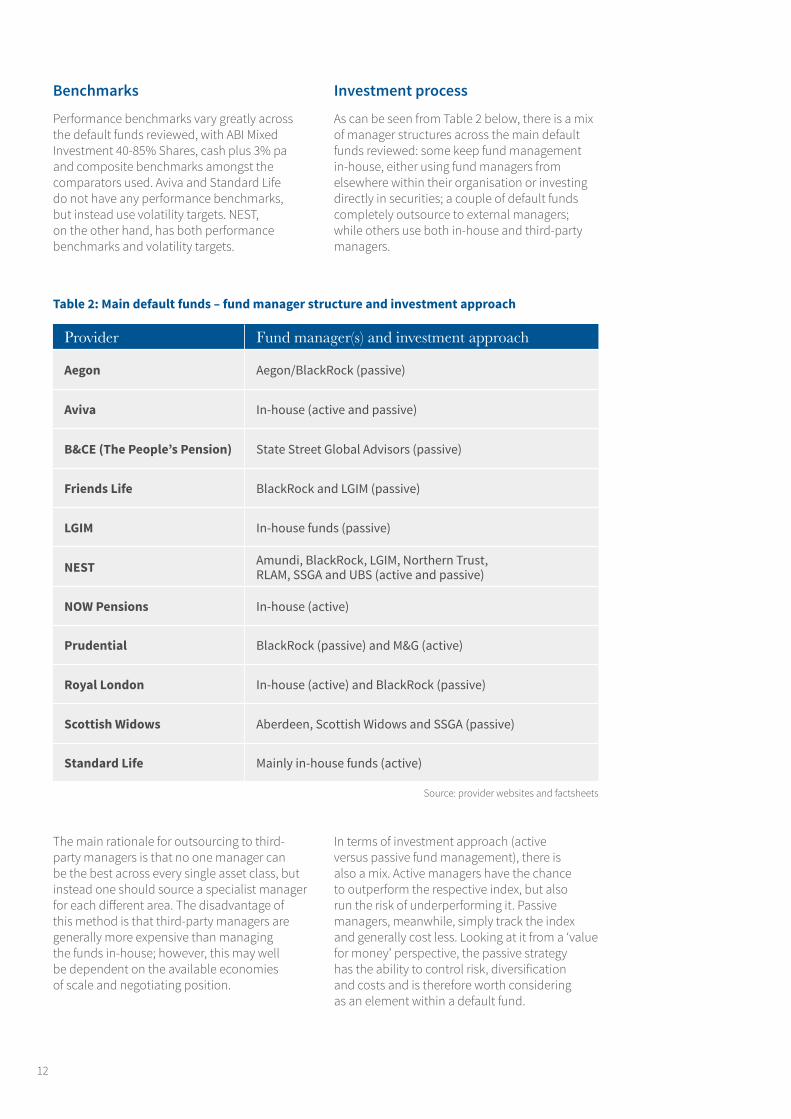
Benchmarks
Performance benchmarks vary greatly across the default funds reviewed, with ABI Mixed Investment 40-85% Shares, cash plus 3% pa and composite benchmarks amongst the comparators used. Aviva and Standard Life do not have any performance benchmarks, but instead use volatility targets. NEST, on the other hand, has both performance benchmarks and volatility targets.
Investment process
As can be seen from Table 2 below, there is a mix of manager structures across the main default funds reviewed: some keep fund management in-house, either using fund managers from elsewhere within their organisation or investing directly in securities; a couple of default funds completely outsource to external managers; while others use both in-house and third-party managers.
The main rationale for outsourcing to third-party managers is that no one manager can be the best across every single asset class, but instead one should source a specialist manager for each different area. The disadvantage of this method is that third-party managers are generally more expensive than managing the funds in-house; however, this may well be dependent on the available economies of scale and negotiating position.
In terms of investment approach (active versus passive fund management), there is also a mix. Active managers have the chance to outperform the respective index, but also run the risk of underperforming it. Passive managers, meanwhile, simply track the index and generally cost less. Looking at it from a ‘value for money’ perspective, the passive strategy has the ability to control risk, diversification and costs and is therefore worth considering as an element within a default fund.
Table 2: Main default funds – fund manager structure and investment approach
Provider Fund manager(s) and investment approach
Aegon Aegon/BlackRock (passive)
Aviva In-house (active and passive)
B&CE (The People’s Pension) State Street Global Advisors (passive)
Friends Life BlackRock and LGIM (passive)
LGIM In-house funds (passive)
NEST Amundi, BlackRock, LGIM, Northern Trust, RLAM, SSGA and UBS (active and passive)
NOW Pensions In-house (active)
Prudential BlackRock (passive) and M&G (active)
Royal London In-house (active) and BlackRock (passive)
Scottish Widows Aberdeen, Scottish Widows and SSGA (passive)
Standard Life Mainly in-house funds (active)
Source: provider websites and factsheets
13
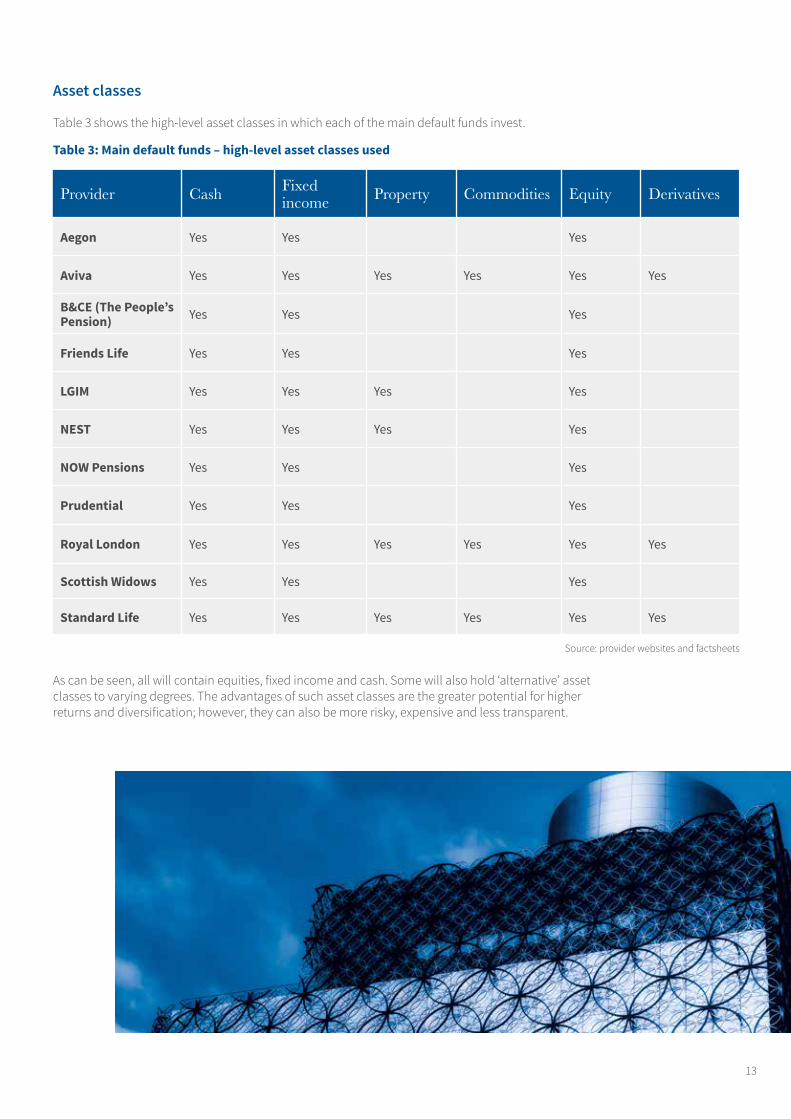
Asset classes
Table 3 shows the high-level asset classes in which each of the main default funds invest.
Table 3: Main default funds – high-level asset classes used
Provider Cash Fixed income Property Commodities Equity Derivatives
Aegon Yes Yes Yes
Aviva Yes Yes Yes Yes Yes Yes
B&CE (The People’s Pension) Yes Yes Yes
Friends Life Yes Yes Yes
LGIM Yes Yes Yes Yes
NEST Yes Yes Yes Yes
NOW Pensions Yes Yes Yes
Prudential Yes Yes Yes
Royal London Yes Yes Yes Yes Yes Yes
Scottish Widows Yes Yes Yes
Standard Life Yes Yes Yes Yes Yes Yes
Source: provider websites and factsheets
As can be seen, all will contain equities, fixed income and cash. Some will also hold ‘alternative’ asset classes to varying degrees. The advantages of such asset classes are the greater potential for higher returns and diversification; however, they can also be more risky, expensive and less transparent.
14
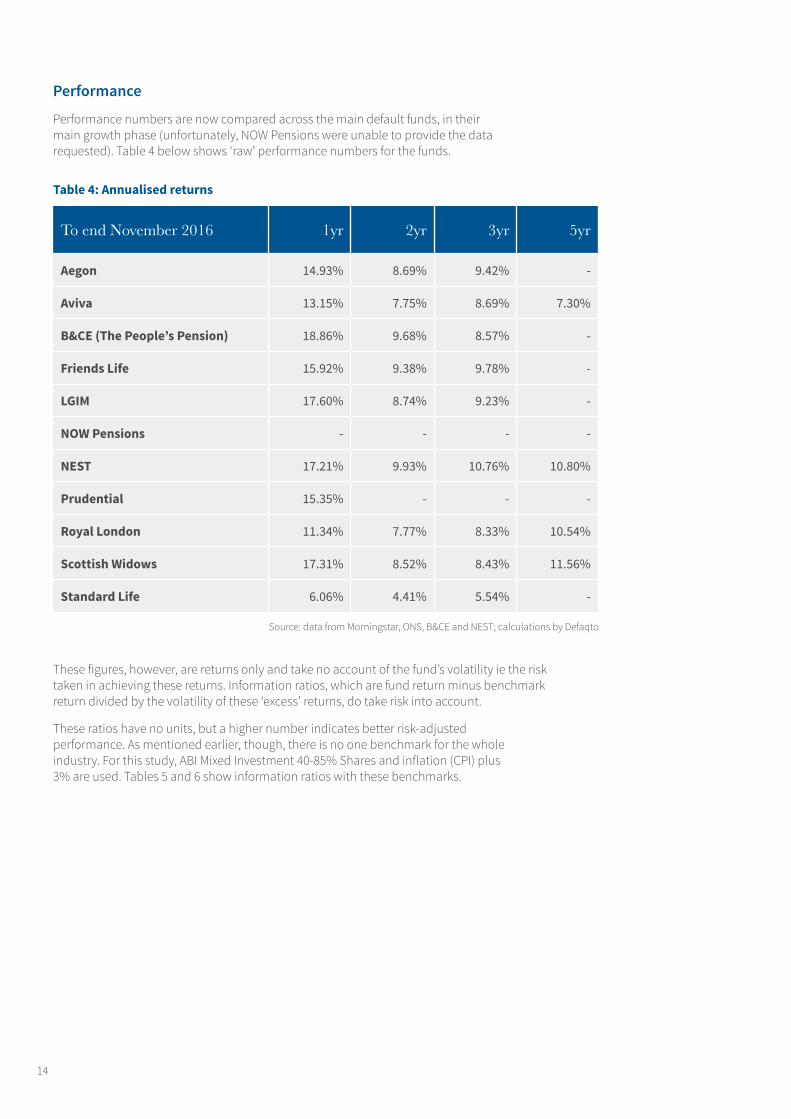
Performance
Performance numbers are now compared across the main default funds, in their main growth phase (unfortunately, NOW Pensions were unable to provide the data requested). Table 4 below shows ‘raw’ performance numbers for the funds.
These figures, however, are returns only and take no account of the fund’s volatility ie the risk taken in achieving these returns. Information ratios, which are fund return minus benchmark return divided by the volatility of these ‘excess’ returns, do take risk into account.
These ratios have no units, but a higher number indicates better risk-adjusted performance. As mentioned earlier, though, there is no one benchmark for the whole industry. For this study, ABI Mixed Investment 40-85% Shares and inflation (CPI) plus 3% are used. Tables 5 and 6 show information ratios with these benchmarks.
Table 4: Annualised returns
To end November 2016 1yr 2yr 3yr 5yr
Aegon 14.93% 8.69% 9.42% -
Aviva 13.15% 7.75% 8.69% 7.30%
B&CE (The People’s Pension) 18.86% 9.68% 8.57% -
Friends Life 15.92% 9.38% 9.78% -
LGIM 17.60% 8.74% 9.23% -
NOW Pensions - - - -
NEST 17.21% 9.93% 10.76% 10.80%
Prudential 15.35% - - -
Royal London 11.34% 7.77% 8.33% 10.54%
Scottish Widows 17.31% 8.52% 8.43% 11.56%
Standard Life 6.06% 4.41% 5.54% -
Source: data from Morningstar, ONS, B&CE and NEST; calculations by Defaqto
15
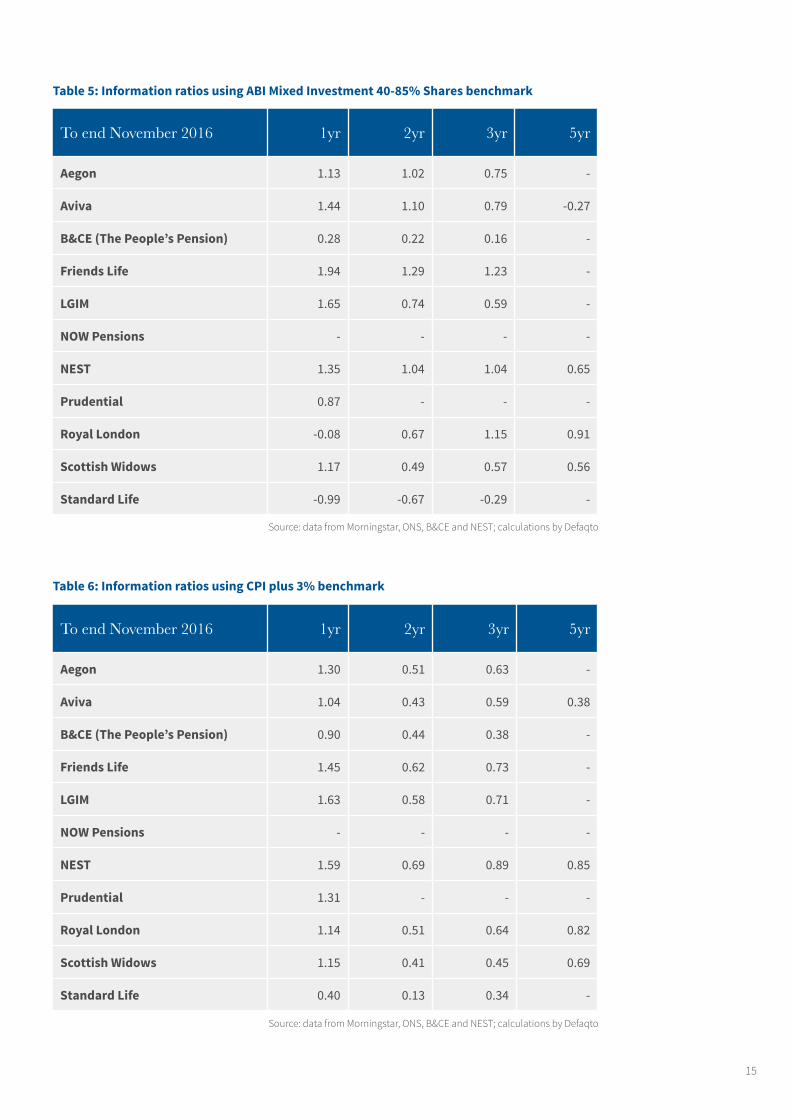
Table 5: Information ratios using ABI Mixed Investment 40-85% Shares benchmark
Table 6: Information ratios using CPI plus 3% benchmark
To end November 2016 1yr 2yr 3yr 5yr
Aegon 1.13 1.02 0.75 -
Aviva 1.44 1.10 0.79 -0.27
B&CE (The People’s Pension) 0.28 0.22 0.16 -
Friends Life 1.94 1.29 1.23 -
LGIM 1.65 0.74 0.59 -
NOW Pensions - - - -
NEST 1.35 1.04 1.04 0.65
Prudential 0.87 - - -
Royal London -0.08 0.67 1.15 0.91
Scottish Widows 1.17 0.49 0.57 0.56
Standard Life -0.99 -0.67 -0.29 -
To end November 2016 1yr 2yr 3yr 5yr
Aegon 1.30 0.51 0.63 -
Aviva 1.04 0.43 0.59 0.38
B&CE (The People’s Pension) 0.90 0.44 0.38 -
Friends Life 1.45 0.62 0.73 -
LGIM 1.63 0.58 0.71 -
NOW Pensions - - - -
NEST 1.59 0.69 0.89 0.85
Prudential 1.31 - - -
Royal London 1.14 0.51 0.64 0.82
Scottish Widows 1.15 0.41 0.45 0.69
Standard Life 0.40 0.13 0.34 -
Source: data from Morningstar, ONS, B&CE and NEST; calculations by Defaqto
Source: data from Morningstar, ONS, B&CE and NEST; calculations by Defaqto
16
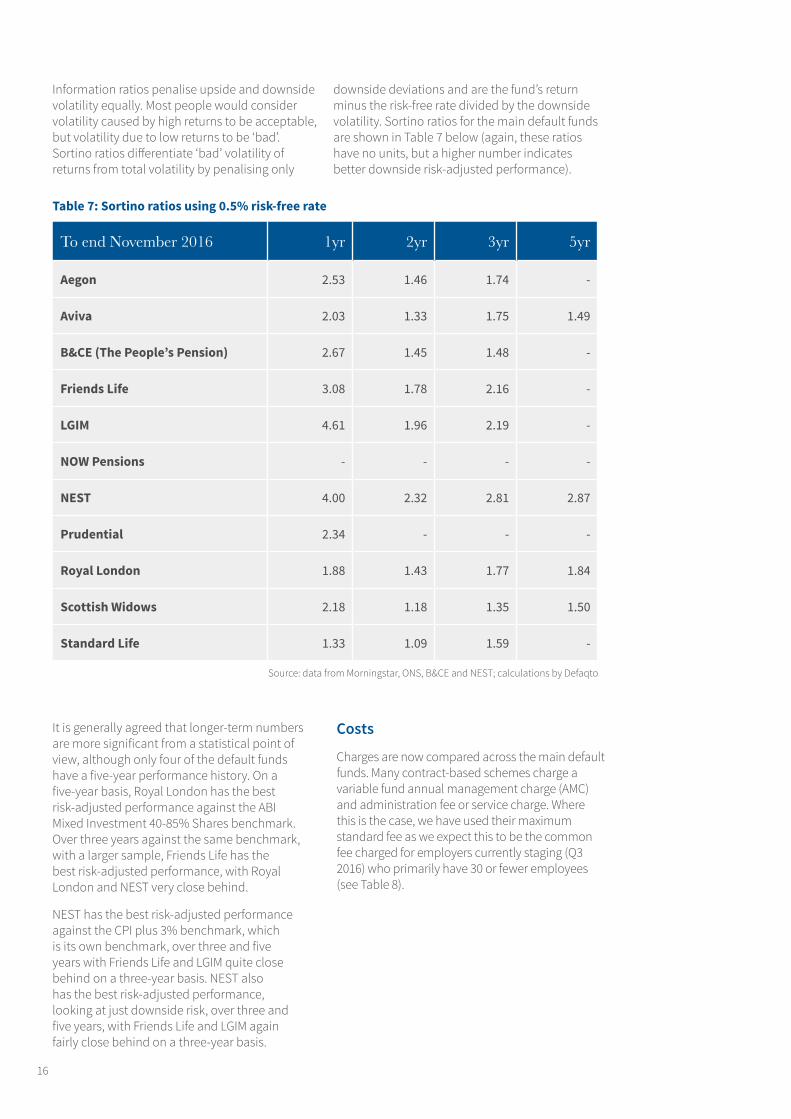
Information ratios penalise upside and downside volatility equally. Most people would consider volatility caused by high returns to be acceptable, but volatility due to low returns to be ‘bad’. Sortino ratios differentiate ‘bad’ volatility of returns from total volatility by penalising only
downside deviations and are the fund’s return minus the risk-free rate divided by the downside volatility. Sortino ratios for the main default funds are shown in Table 7 below (again, these ratios have no units, but a higher number indicates better downside risk-adjusted performance).
It is generally agreed that longer-term numbers are more significant from a statistical point of view, although only four of the default funds have a five-year performance history. On a five-year basis, Royal London has the best risk-adjusted performance against the ABI Mixed Investment 40-85% Shares benchmark. Over three years against the same benchmark, with a larger sample, Friends Life has the best risk-adjusted performance, with Royal London and NEST very close behind.
NEST has the best risk-adjusted performance against the CPI plus 3% benchmark, which is its own benchmark, over three and five years with Friends Life and LGIM quite close behind on a three-year basis. NEST also has the best risk-adjusted performance, looking at just downside risk, over three and five years, with Friends Life and LGIM again fairly close behind on a three-year basis.
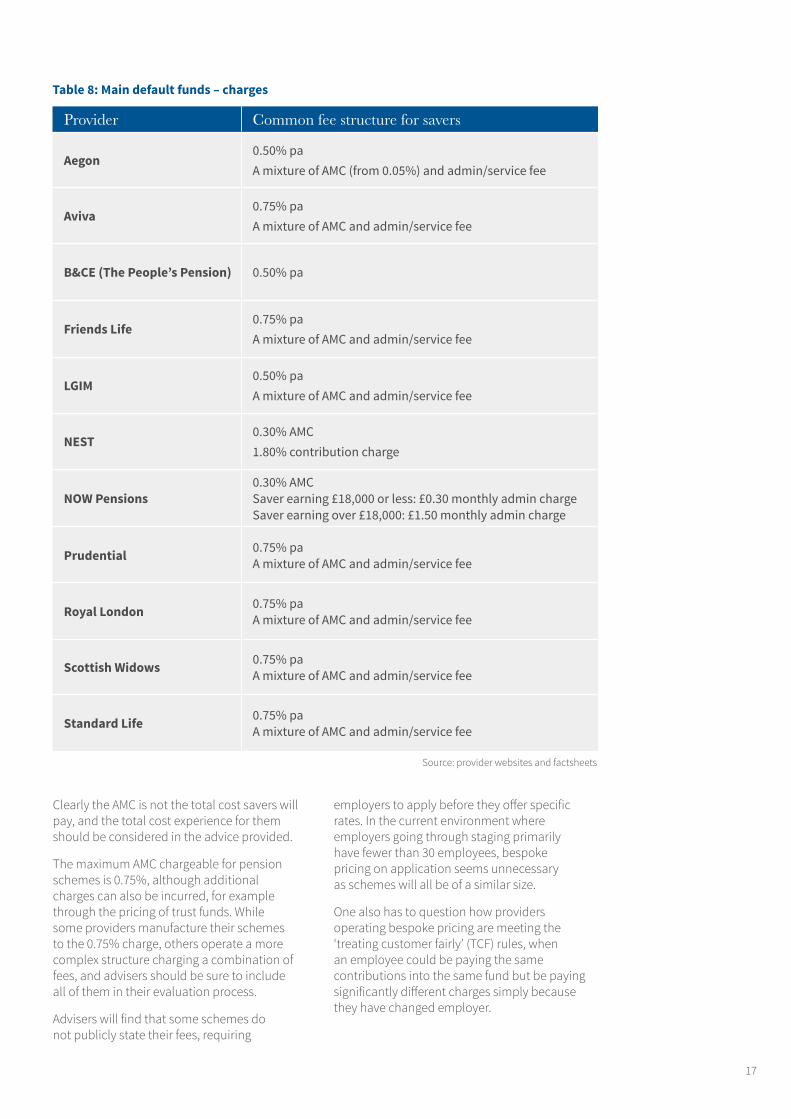
Costs
Charges are now compared across the main default funds. Many contract-based schemes charge a variable fund annual management charge (AMC) and administration fee or service charge. Where this is the case, we have used their maximum standard fee as we expect this to be the common fee charged for employers currently staging (Q3 2016) who primarily have 30 or fewer employees (see Table 8).
Table 7: Sortino ratios using 0.5% risk-free rate
To end November 2016 1yr 2yr 3yr 5yr
Aegon 2.53 1.46 1.74 -
Aviva 2.03 1.33 1.75 1.49
B&CE (The People’s Pension) 2.67 1.45 1.48 -
Friends Life 3.08 1.78 2.16 -
LGIM 4.61 1.96 2.19 -
NOW Pensions - - - -
NEST 4.00 2.32 2.81 2.87
Prudential 2.34 - - -
Royal London 1.88 1.43 1.77 1.84
Scottish Widows 2.18 1.18 1.35 1.50
Standard Life 1.33 1.09 1.59 -
Source: data from Morningstar, ONS, B&CE and NEST; calculations by Defaqto
17
Provider Common fee structure for savers
Aegon0.50% pa A mixture of AMC (from 0.05%) and admin/service fee
Aviva0.75% pa A mixture of AMC and admin/service fee
B&CE (The People’s Pension) 0.50% pa
Friends Life0.75% pa A mixture of AMC and admin/service fee
LGIM0.50% pa A mixture of AMC and admin/service fee
NEST0.30% AMC 1.80% contribution charge
NOW Pensions0.30% AMCSaver earning £18,000 or less: £0.30 monthly admin chargeSaver earning over £18,000: £1.50 monthly admin charge
Prudential 0.75% paA mixture of AMC and admin/service fee
Royal London 0.75% paA mixture of AMC and admin/service fee
Scottish Widows 0.75% paA mixture of AMC and admin/service fee
Standard Life 0.75% paA mixture of AMC and admin/service fee
Clearly the AMC is not the total cost savers will pay, and the total cost experience for them should be considered in the advice provided.
The maximum AMC chargeable for pension schemes is 0.75%, although additional charges can also be incurred, for example through the pricing of trust funds. While some providers manufacture their schemes to the 0.75% charge, others operate a more complex structure charging a combination of fees, and advisers should be sure to include all of them in their evaluation process.
Advisers will find that some schemes do not publicly state their fees, requiring
employers to apply before they offer specific rates. In the current environment where employers going through staging primarily have fewer than 30 employees, bespoke pricing on application seems unnecessary as schemes will all be of a similar size.
One also has to question how providers operating bespoke pricing are meeting the ‘treating customer fairly’ (TCF) rules, when an employee could be paying the same contributions into the same fund but be paying significantly different charges simply because they have changed employer.
Table 8: Main default funds – charges
Source: provider websites and factsheets
18
Table 9: Illustrative pension fund values assuming 2% contribution rate
Table 10: Illustrative pension fund values assuming 5% contribution rate
Table 11: Illustrative pension fund values assuming 8% contribution rate
Employee = 1%, employer = 1%
Value at 10 yrs
Value at 20 yrs
Value at 30 yrs
Value at 40 yrs
No charges £7,441 £22,610 £52,193 £108,440
NEST £7,191 £21,465 £48,591 £98,832
NOW Pensions £7,080 £21,187 £48,052 £97,875
Aegon, B&CE and LGIM £7,246 £21,375 £47,769 £95,816
Aviva, Friends Life, Prudential, Royal London, Scottish Widows and Standard Life
£7,150 £20,790 £45,729 £90,165
Employee = 3%, employer = 2%
Value at 10 yrs
Value at 20 yrs
Value at 30 yrs
Value at 40 yrs
No charges £18,603 £56,524 £130,484 £271,099
NEST £17,978 £53,663 £121,477 £247,080
NOW Pensions £18,065 £53,974 £122,274 £248,841
Aegon, B&CE and LGIM £18,114 £53,438 £119,422 £239,539
Aviva, Friends Life, Prudential, Royal London, Scottish Widows and Standard Life
£17,876 £51,974 £114,321 £225,414
Employee = 5%, employer = 3%
Value at 10 yrs
Value at 20 yrs
Value at 30 yrs
Value at 40 yrs
No charges £29,765 £90,439 £208,774 £433,758
NEST £28,765 £85,861 £194,364 £395,328
NOW Pensions £29,050 £86,762 £196,496 £399,806
Aegon, B&CE and LGIM £28,893 £85,501 £191,075 £383,263
Aviva, Friends Life, Prudential, Royal London, Scottish Widows and Standard Life
£28,601 £83,158 £182,914 £360,662
Calculations by Defaqto
Calculations by Defaqto
Calculations by Defaqto
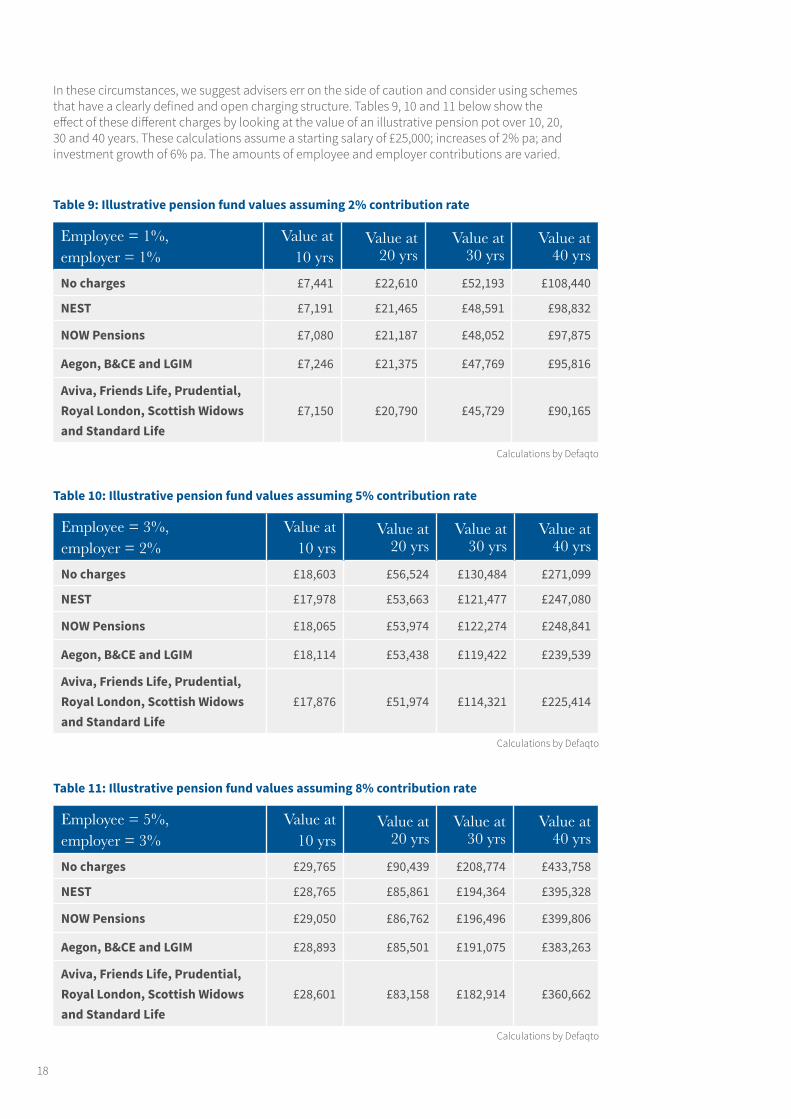
In these circumstances, we suggest advisers err on the side of caution and consider using schemes that have a clearly defined and open charging structure. Tables 9, 10 and 11 below show the effect of these different charges by looking at the value of an illustrative pension pot over 10, 20, 30 and 40 years. These calculations assume a starting salary of £25,000; increases of 2% pa; and investment growth of 6% pa. The amounts of employee and employer contributions are varied.
19
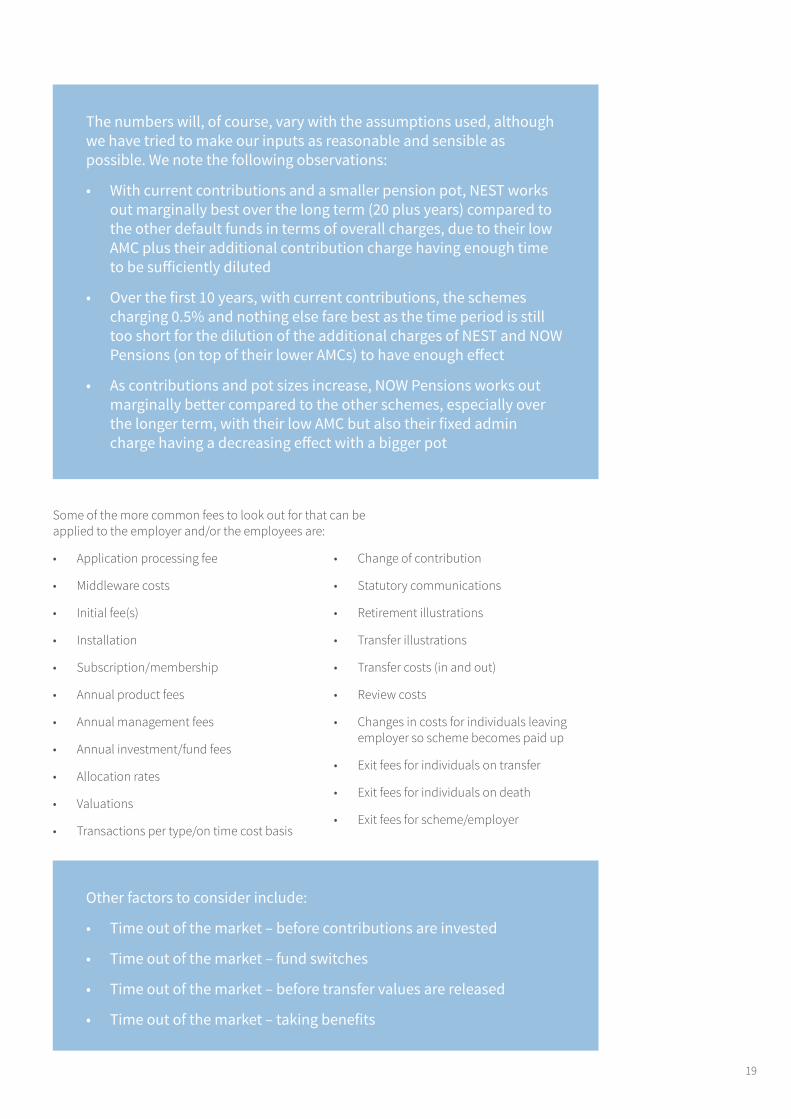
Some of the more common fees to look out for that can be applied to the employer and/or the employees are:
• Application processing fee
• Middleware costs
• Initial fee(s)
• Installation
• Subscription/membership
• Annual product fees
• Annual management fees
• Annual investment/fund fees
• Allocation rates
• Valuations
• Transactions per type/on time cost basis
• Change of contribution
• Statutory communications
• Retirement illustrations
• Transfer illustrations
• Transfer costs (in and out)
• Review costs
• Changes in costs for individuals leaving employer so scheme becomes paid up
• Exit fees for individuals on transfer
• Exit fees for individuals on death
• Exit fees for scheme/employer
The numbers will, of course, vary with the assumptions used, although we have tried to make our inputs as reasonable and sensible as possible. We note the following observations:
• With current contributions and a smaller pension pot, NEST works out marginally best over the long term (20 plus years) compared to the other default funds in terms of overall charges, due to their low AMC plus their additional contribution charge having enough time to be sufficiently diluted
• Over the first 10 years, with current contributions, the schemes charging 0.5% and nothing else fare best as the time period is still too short for the dilution of the additional charges of NEST and NOW Pensions (on top of their lower AMCs) to have enough effect
• As contributions and pot sizes increase, NOW Pensions works out marginally better compared to the other schemes, especially over the longer term, with their low AMC but also their fixed admin charge having a decreasing effect with a bigger pot
Other factors to consider include:
• Time out of the market – before contributions are invested
• Time out of the market – fund switches
• Time out of the market – before transfer values are released
• Time out of the market – taking benefits
20
Part 3 – NEST and its default fundNEST is an occupational defined contribution workplace pension scheme and was set up to facilitate automatic enrolment as part of the government’s workplace pension reforms under the Pension Act 2008.
NEST was created to offer employers and their workers access to a good quality pension scheme, with the intention of helping more people to save for retirement. Interestingly, it was established with a public service obligation to accept any employer, which means that every single employer has access to a qualifying pension scheme into which they can enrol their eligible workers.
NEST is one of the qualifying pension schemes that employers can use to meet their new duties. It now serves more than 3.8m members across over 215,000 employers, and assets under management (AUM) stood at around £1.2bn at the beginning of November 2016.
We anticipate that due consideration will be given by employers, on behalf of their employees, to NEST as a result of these legislation changes.
September 2016
• Uncrystallised funds pension lump sum (UFPLS) options to become more flexible
• Contributions can be received while benefits are being taken (through UFPLS)
• Ability to pay lump sums as benefits
• Changes to death benefits
April 2017
• Changes to annual contribution limits
• Ability to facilitate transfers in and out (for individuals and bulk)
21
In the case of NEST, around 99% of members invest in the default funds. The default option for NEST’s members is one of the NEST Retirement Date Funds.
There are around 50 of these funds in existence at any one time, with each corresponding to the year in which the member wishes to take out some of their money tax free and convert the remainder into retirement benefits eg if the member expects to take their money out in 2040, then they will save into the NEST 2040 Retirement Fund. The member can, however, switch to a different fund, free of charge, if they later decide they want to save for longer or take their money out earlier. None of NEST’s peers uses this target date approach, using ‘life styling’ instead.
NEST does offer other fund choices for members with certain beliefs or for those who want to take greater or less risk with their investments than the average. These are the:
• NEST Ethical Fund
• NEST Sharia Fund
• NEST Higher Risk Fund
• NEST Lower Growth Fund
• NEST Pre-retirement Fund
The availability of a standalone Sharia fund is useful for those employers who wish to meet the potential needs of some of their Muslim employees and therefore avoid potential discrimination issues. Of all of the auto-enrolment qualifying pension schemes, 80% offer this specific fund option.
For those investors who do not want to use the default fund, some pension schemes provide no alternative while others provide access to hundreds of funds. NEST sits somewhere in the middle as it provides a comprehensive but focused list of alternative investment funds.
Although this case study focuses primarily on NEST’s default funds, many of their attributes (eg the investment beliefs and team behind them) will also apply to NEST’s other funds.
NEST's default strategy
22
NEST was able to start with a ‘blank sheet of paper’ when designing its investment process and governance structure. It carried out a consultation process, looking at how similar schemes operate around the world and learning from them. NEST has also attempted to make its solution scalable and is part of a network of large non-profit schemes, which also includes APG and the Ontario Teachers’ Pension Plan.
Investment strategy
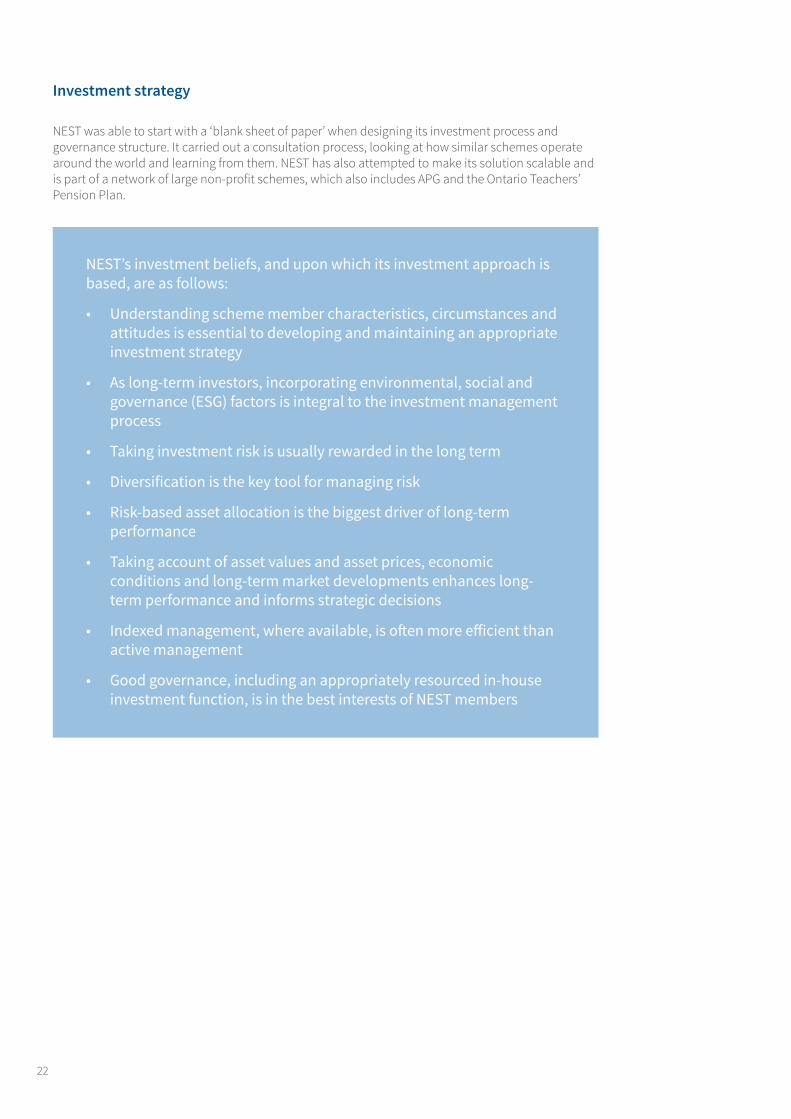
NEST’s investment beliefs, and upon which its investment approach is based, are as follows:
• Understanding scheme member characteristics, circumstances and attitudes is essential to developing and maintaining an appropriate investment strategy
• As long-term investors, incorporating environmental, social and governance (ESG) factors is integral to the investment management process
• Taking investment risk is usually rewarded in the long term
• Diversification is the key tool for managing risk
• Risk-based asset allocation is the biggest driver of long-term performance
• Taking account of asset values and asset prices, economic conditions and long-term market developments enhances long-term performance and informs strategic decisions
• Indexed management, where available, is often more efficient than active management
• Good governance, including an appropriately resourced in-house investment function, is in the best interests of NEST members
23
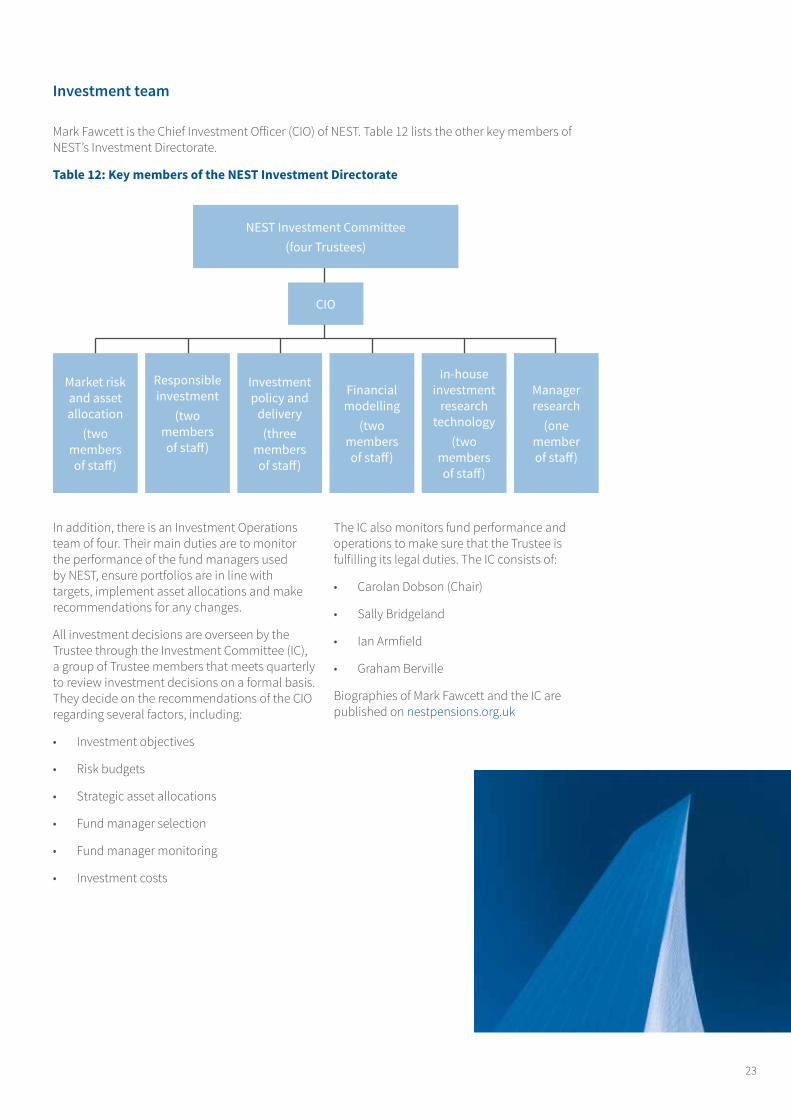
Mark Fawcett is the Chief Investment Officer (CIO) of NEST. Table 12 lists the other key members of NEST’s Investment Directorate.
Table 12: Key members of the NEST Investment Directorate
In addition, there is an Investment Operations team of four. Their main duties are to monitor the performance of the fund managers used by NEST, ensure portfolios are in line with targets, implement asset allocations and make recommendations for any changes.
All investment decisions are overseen by the Trustee through the Investment Committee (IC), a group of Trustee members that meets quarterly to review investment decisions on a formal basis. They decide on the recommendations of the CIO regarding several factors, including:
• Investment objectives
• Risk budgets
• Strategic asset allocations
• Fund manager selection
• Fund manager monitoring
• Investment costs
The IC also monitors fund performance and operations to make sure that the Trustee is fulfilling its legal duties. The IC consists of:
• Carolan Dobson (Chair)
• Sally Bridgeland
• Ian Armfield
• Graham Berville
Biographies of Mark Fawcett and the IC are published on nestpensions.org.uk
Investment team
CIO
NEST Investment Committee(four Trustees)
Market risk and asset allocation
(two members of staff)
Responsible investment
(two members of staff)
Investment policy and
delivery(three
members of staff)
Financial modelling
(two members of staff)
In-house investment
research technology
(two members of staff)
Manager research
(one member of staff)
24
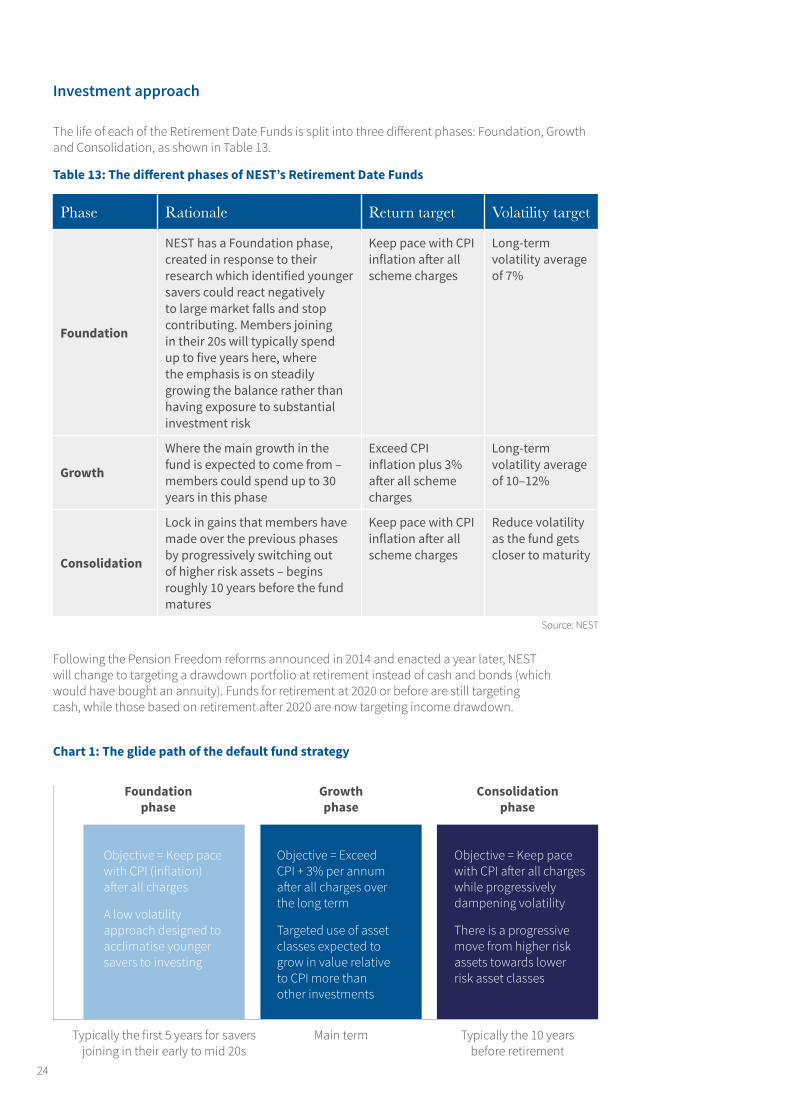
The life of each of the Retirement Date Funds is split into three different phases: Foundation, Growth and Consolidation, as shown in Table 13.
Table 13: The different phases of NEST’s Retirement Date Funds
Chart 1: The glide path of the default fund strategy
Following the Pension Freedom reforms announced in 2014 and enacted a year later, NEST will change to targeting a drawdown portfolio at retirement instead of cash and bonds (which would have bought an annuity). Funds for retirement at 2020 or before are still targeting cash, while those based on retirement after 2020 are now targeting income drawdown.
Foundation phase
Typically the first 5 years for savers joining in their early to mid 20s
Main term Typically the 10 years before retirement
Objective = Keep pace with CPI (inflation) after all charges
A low volatility approach designed to acclimatise younger savers to investing
Objective = Exceed CPI + 3% per annum after all charges over the long term
Targeted use of asset classes expected to grow in value relative to CPI more than other investments
Objective = Keep pace with CPI after all charges while progressively dampening volatility
There is a progressive move from higher risk assets towards lower risk asset classes
Growth phase
Consolidation phase
Investment approach
Phase Rationale Return target Volatility target
Foundation
NEST has a Foundation phase, created in response to their research which identified younger savers could react negatively to large market falls and stop contributing. Members joining in their 20s will typically spend up to five years here, where the emphasis is on steadily growing the balance rather than having exposure to substantial investment risk
Keep pace with CPI inflation after all scheme charges
Long-term volatility average of 7%
Growth
Where the main growth in the fund is expected to come from – members could spend up to 30 years in this phase
Exceed CPI inflation plus 3% after all scheme charges
Long-term volatility average of 10–12%
Consolidation
Lock in gains that members have made over the previous phases by progressively switching out of higher risk assets – begins roughly 10 years before the fund matures
Keep pace with CPI inflation after all scheme charges
Reduce volatility as the fund gets closer to maturity
Source: NEST

25
Table 14: Retirement Date Funds – fund managers and investment approaches
This lifecycle differs from that of the other main default funds in that none of them has a phase similar to Foundation, instead starting with the main growth phase. The advantage of the NEST lifecycle, as mentioned above, is that large market falls in the early years, which could dissuade people from continuing to save in the middle and later years, are less likely. The disadvantage of this approach is that members miss out on any large market gains in the early years, or these would be at least restricted (although, as pots are small at this point, there may in fact be a negligible impact on outcomes).
The second main difference in lifecycle between NEST and the other default funds
is that the latter will begin moving out of the main growth phase at a set number of years before the expected retirement date. In the case of the NEST funds, however, the transition from one phase to another will be ‘dynamically’ managed rather than relying on a set rule. This means commencing the transition earlier or later, depending on prevailing economic and market conditions.
Table 14 shows how the Retirement Date Funds invest across the different asset classes. They use external fund managers in all cases rather than the funds being managed ‘in-house’.
Asset class Fund manager Investment approach
Global developed equities UBS Asset Management Passive
Emerging market equities HSBC Global Asset Management Passive
Emerging market equities Northern Trust Passive
Gilts State Street Global Advisors Passive
Short-dated gilts LGIM Buy and hold
Index-linked gilts State Street Global Advisors Passive
Sterling corporate bonds Royal London Asset Management Active
Emerging market debt Amundi Asset Management Active
UK direct/global listed property LGIM Active/Passive
Low-risk sterling liquidity BlackRock Active
Source: NEST
26
Source: NEST
As can be seen, NEST spreads its investments across a greater range of managers than the other default funds. Their fund manager turnover has been low and NEST will tolerate short-term underperformance as long as the manager keeps to their stated process and style.
As mentioned earlier, the disadvantage of using third-party managers is that this method is generally more expensive than managing in-house, although NEST states that it is able to negotiate favourable terms as a result of its fund size and expected future contributions.
As alluded to above, the asset allocation for each Retirement Date Fund will depend on its point in the lifecycle, together with prevailing economic and market conditions. The policy (strategic) asset allocation is determined partly through mean variance optimisation (MVO). NEST, however, recognises the limitations of MVO, in particular the occurrence of corner solutions and its sensitivity to the inputs used, therefore it combines this with risk-diversified optimisation. These policy asset allocations will be reviewed quarterly and are typically adjusted once a year.
Quarterly reviews take place in between the annual updates, where the in-house team looks at the macroeconomic background, financial markets, sentiment and latest asset class valuations, together with any tactical adjustments around the policy allocation that might be made. In the first stage of the reviews, these inputs are discussed by the key members of the Investment Directorate. Any decisions are then made during the second stage at a meeting between just the CIO, Head of Asset Allocation and Head of Economics. These potential changes are analysed from a risk point of view before being implemented.
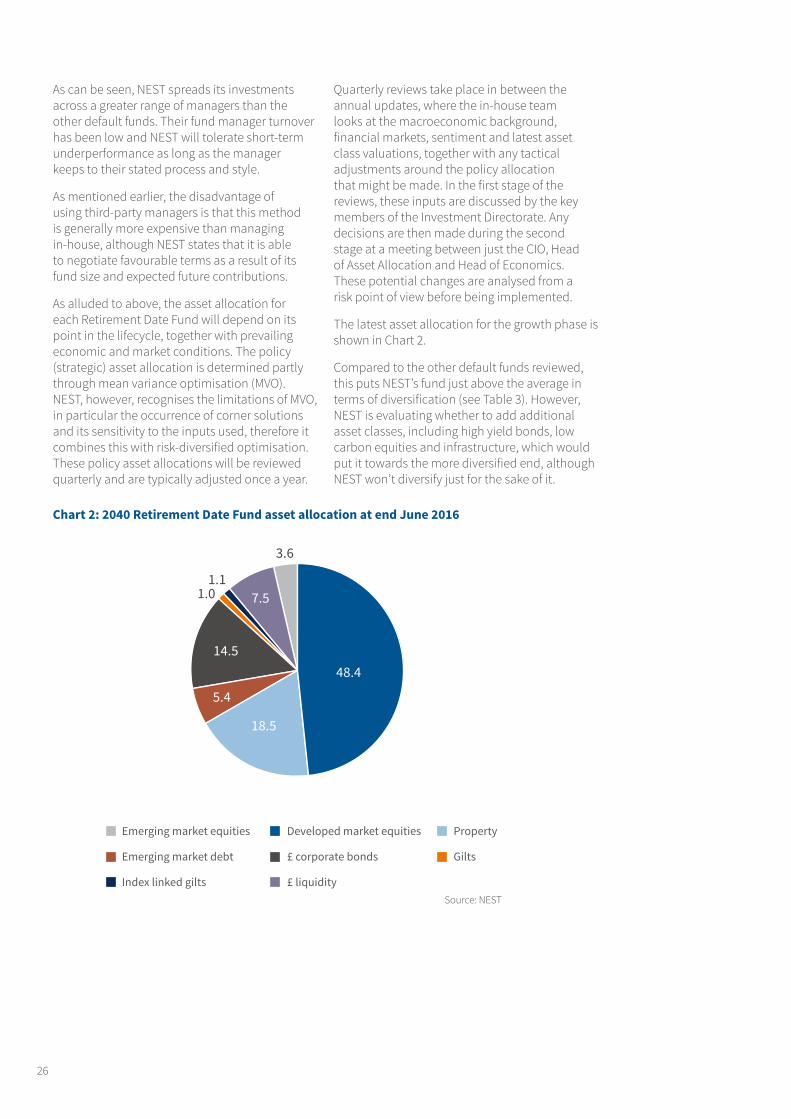
The latest asset allocation for the growth phase is shown in Chart 2.
Compared to the other default funds reviewed, this puts NEST’s fund just above the average in terms of diversification (see Table 3). However, NEST is evaluating whether to add additional asset classes, including high yield bonds, low carbon equities and infrastructure, which would put it towards the more diversified end, although NEST won’t diversify just for the sake of it.
Chart 2: 2040 Retirement Date Fund asset allocation at end June 2016
Emerging market equities Developed market equities Property
Emerging market debt £ corporate bonds Gilts
Index linked gilts £ liquidity
3.6
48.4
18.5
5.4
14.5
1.0 1.1
7.5
27
Risk framework
There are asset class ranges/limits and the NEST Investment Directorate would need permission from the IC if it wished to move outside these.
NEST uses the MSCI BARRA risk-package for the analysis of risk in its portfolios.
Costs
The total costs of scheme membership are (1) direct member-borne costs and charges, and (2) portfolio transaction costs.
As already mentioned, NEST’s member charges consist of:
• A contribution charge of 1.8%, deducted from all contributions made to the scheme
• An AMC of 0.3%, applied to all AUM. This includes all custodian, legal and accounting costs and is also the total expense ratio (TER)
Transaction costs and dealing spreads across the 50 or so default funds will vary depending on the asset allocation. However, they have been structured to minimise trading costs for the scheme, such as trading spreads and brokerage fees. NEST has done this by creating an internal market between the different Retirement Date Funds such that the funds which are reducing exposure to certain asset classes will transfer those investments to the funds still adding to them.
The internal market also keeps costs down for members leaving the scheme and those just joining. New member contributions can be used to balance allocations and for paying cash lump sums to members taking their money out. Finally, the internal market can be used to maintain the target asset allocation or re-balance the funds.
Transaction costs for the default funds are between 0 and 0.083% and costs for other fund choices are between 0 and 0.098%. The costs for each fund are detailed in Appendix three of the NEST scheme annual report and accounts 2015/6 available on its website. NEST constantly monitors and analyses costs and spreads.
NEST is unique in that it is free for employers to use and any UK employer can use NEST to meet its workplace duties.
Governance
NEST is a trust-based pension scheme, regulated by TPR and it appears to be meeting, if not exceeding, the various governance standards and duties imposed on it.
NEST is one of the schemes that should be applauded for making much of the governance due diligence data required by advisers available on its website.
28
ConclusionThis case study first looked at the key factors we believe should be considered when reviewing or selecting a default fund:
• The investment management procedures and responsibilities
• The implications of in-house and outsourced management
• The clarity, robustness and repeatability of decision making
• How the default funds are performing against benchmarks and peers
• The suitability of the default funds and identifying value for money
The case study then looked at and compared the most commonly used default pension funds from an auto-enrolment point of view. We saw a great variety in terms of benchmark, manager structure (in-house manager, third-party managers or a mix), investment approach (active, passive or both), level of diversification, performance and charging across the funds. With some of these attributes, such as manager structure and investment approach, the choice of provider and fund might come down to the investment beliefs of the employer or their adviser. In terms of the other more objective features ie risk-adjusted performance and charges, however, some providers and funds are clearly more competitive than others.
Finally, this case study looked at NEST’s default pension funds in more detail, comparing them to their most relevant peer
group of competitors. The main strengths of NEST’s Retirement Date Funds are:
• The investment team behind these funds is experienced and well-resourced
• Risk-adjusted performance in the main growth phase of the lifecycle has been very good versus peers over the longer (and more statistically meaningful) time periods
• With an increasing investment time period, NEST’s overall charges become more favourable in relation to most of the other big default funds by virtue of the dilution of the contribution charge over the longer term
• These funds have a volatility target as well as a performance benchmark (the other default funds tend to have one or the other)
29
The key areas where NEST’s Retirement Date Funds differ from the other default funds looked at are:
• None of the others has single-year Target Date funds
• NEST has a Foundation phase, created in response to their research which identified younger savers could react negatively to large market falls and stop contributing. Members joining in their 20s will typically spend up to five years here, where the emphasis is on steadily growing the balance rather than having exposure to substantial investment risk. While mitigating negative market risk it is possible that market gains won’t be reflected, however should this happen this strategy is unlikely to have a notable impact as the pot size of savers in their 20s is usually small
• Switching out of the main growth phase in the run up to retirement does not automatically commence at a pre-set point before retirement, but instead can be started slightly sooner or later, depending on prevailing market conditions
The evidence shows that NEST’s Retirement Date Funds can hold their own against their peers and are worthy of consideration alongside other schemes by corporate clients and professional advisers on behalf of their clients, irrespective of the employer’s size of scheme.

30
Learning objectivesThis case study is accredited by the CII/PFS and CISI for up to 60 minutes of structured CPD.
Reading this publication will enable you to:
1 Understand the different default investment strategies available, focusing upon the accumulation phase
2 Identify the main differentiating factors to be considered between the individual default investment propositions including:
• The investment management procedures and responsibilities• Implications of in-house and outsourced management• Clarity, robustness and repeatability of decision making• How defaults are performing against benchmarks and peers• Suitability of the default and identifying value for money
3 Understand how the various default propositions in the market differ from each other to support market research and due diligence

31
Test yourself for CPDIn order to assess your knowledge following completion of this publication, why not work your way through the following questions? All the answers can be found within the content of this publication.
1 Name the two regulators of auto-enrolment pension schemes.
2 What is the main concern with a default fund using funds primarily from the scheme provider?
3 Name four common benchmarks used by default funds.
4 List the main reasons why many default funds utilise passive (index) funds.
5 At what percentage are pension default funds annual management fees capped?
32
6 What does IGC stand for and which scheme type does it apply to?
7 Which regulator utilises the DC Code and which scheme type does it apply to?
8 Does ‘value for money’ mean the cheapest solution?
Name
Signature
Date
CPD time recorded
This publication is accredited by the CII/PFS and CISI for up to 60 minutes of structured continuing professional development (CPD).
33
NEST.The provider of last resort.Unless you’re after an award-winning pension scheme.
At first glance, NEST might not be the first provider you’d consider recommending to your clients. But if you’re looking for a pension with an innovative investment approach, independently accredited governance and a substantial collection of industry awards you might want to take another look.
©NEST Corporation 2016. All rights reserved. NEST will only accept employers electing to use the scheme for the purposes of meeting their duties under the Pensions Act 2008 and subject to them accepting our Employer Terms and Conditions. This information does not constitute financial, investment or professional advice. We do not make any personal recommendation or give advice to employers, their workers or third parties on how to make investment decisions. The NEST trademarks and trade names used above are owned by NEST Corporation and should not be used in any way without our permission.
NEST. Think you know us?
Think again.
Find out more

34
Send us your feedback Your feedback is extremely important to us and we would be grateful if, after completing this publication, you would take a few minutes to complete a short survey. Your answers will be treated in the strictest confidence and the results of this will help the development of future publications.
The survey can be accessed at:
https://www.snapsurveys.com/wh/s.asp?k=144610976149
35
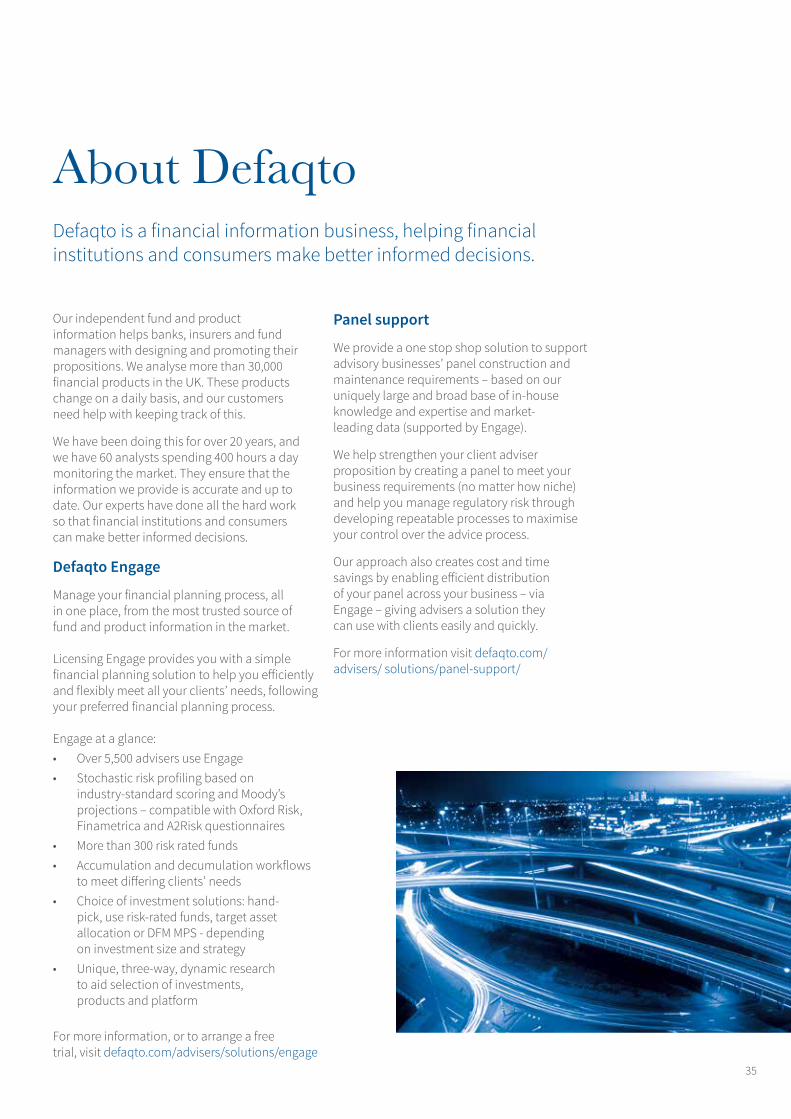
Our independent fund and product information helps banks, insurers and fund managers with designing and promoting their propositions. We analyse more than 30,000 financial products in the UK. These products change on a daily basis, and our customers need help with keeping track of this.
We have been doing this for over 20 years, and we have 60 analysts spending 400 hours a day monitoring the market. They ensure that the information we provide is accurate and up to date. Our experts have done all the hard work so that financial institutions and consumers can make better informed decisions.
Defaqto Engage
Manage your financial planning process, all in one place, from the most trusted source of fund and product information in the market.
Licensing Engage provides you with a simple financial planning solution to help you efficiently and flexibly meet all your clients’ needs, following your preferred financial planning process.
Engage at a glance:• Over 5,500 advisers use Engage• Stochastic risk profiling based on
industry-standard scoring and Moody’s projections – compatible with Oxford Risk, Finametrica and A2Risk questionnaires
• More than 300 risk rated funds• Accumulation and decumulation workflows
to meet differing clients’ needs• Choice of investment solutions: hand-
pick, use risk-rated funds, target asset allocation or DFM MPS - depending on investment size and strategy
• Unique, three-way, dynamic research to aid selection of investments, products and platform
For more information, or to arrange a freetrial, visit defaqto.com/advisers/solutions/engage
About Defaqto Defaqto is a financial information business, helping financial institutions and consumers make better informed decisions.
Panel support
We provide a one stop shop solution to support advisory businesses’ panel construction and maintenance requirements – based on our uniquely large and broad base of in-house knowledge and expertise and market-leading data (supported by Engage).
We help strengthen your client adviser proposition by creating a panel to meet your business requirements (no matter how niche) and help you manage regulatory risk through developing repeatable processes to maximise your control over the advice process.
Our approach also creates cost and time savings by enabling efficient distribution of your panel across your business – via Engage – giving advisers a solution they can use with clients easily and quickly.
For more information visit defaqto.com/advisers/ solutions/panel-support/

Please contact your Defaqto Account Manager or call us on 0808 1000 804
defaqto.com/advisers
© Defaqto Limited 2016. All rights reserved.No part of this publication may be reprinted, reproduced or used in any form or by any electronic, mechanical, or other means, now known orhereafter invented, including photocopying and recording, or in any information storage or retrieval system without the express written permissionof the publisher. The publisher has taken all reasonable measures to ensure the accuracy of the information and ratings in this document andcannot accept responsibility or liability for errors or omissions from any information given and for any consequences arising.