How the Western Balkans can catch up - · PDF file1 How the Western Balkans can catch up Peter...
43
1 How the Western Balkans can catch up Peter Sanfey, Jakov Milatović and Ana Krešić Abstract Countries in the Western Balkans – Albania, Bosnia and Herzegovina, FYR Macedonia, Kosovo, Montenegro and Serbia – all aspire to membership of the European Union, but they face a major convergence challenge in terms of living standards. The main reason behind this prosperity gap lies in the failure over the years of Western Balkan countries to be competitive, meaning that they lack the appropriate factors and institutions needed for high levels of long-term productivity. The key issue is whether the Western Balkans countries can narrow the gap in the coming decade and, if so, what do they need to do to achieve this. The vital requirement for catching up with the rest of the European Union is a boost to investment in the region. The Western Balkans has a number of attractive features for investors. The long-term EU perspective is a major plus and a unique quality of the region compared with other emerging markets, as it helps to anchor market-oriented reforms and European standards. Strong macroeconomic stability, strategic geographic location, diverse economies, favourable tax regimes and low unit labour costs, combined with a relatively well-educated population, are common attributes throughout the region. Looking ahead, sources of growth include trade integration, within the region and with the rest of the world, exploitation of the region’s energy resources, improvement of the transport infrastructure and technological innovation. However, long-term challenges remain, such as the possibility of a slowdown in reforms, risks posed by financial instability, adverse demographic trends and climate change. But provided governments in the region remain committed to reforms and regional cooperation, these challenges can be mitigated, if not overcome. Keywords: Western Balkans, Competitiveness, Investment, Development JEL Classification Number: F1 P0 Contact details: Peter Sanfey, One Exchange Square, London EC2A 2JN, United Kingdom Phone: +44 20 7338 6227; Fax: +44 20 7338 6110; email: [email protected]. Peter Sanfey is Deputy Director, Country Economics and Policy; Jakov Milatović is Regional Analyst for south-eastern Europe; and Ana Krešić is an intern, all within the Country and Sector Economics Department at the EBRD. We are grateful to Isabel Blanco, Ian Brown, Ralph de Haas, Christoph Denk, Tony Doherty, Alex Plekhanov, Toshiaki Sakatsume, Peter Tabak and Emir Zildžović for helpful comments on an earlier draft. The working paper series has been produced to stimulate debate on economic transition and development. Views presented are those of the authors and not necessarily of the EBRD.
Transcript of How the Western Balkans can catch up - · PDF file1 How the Western Balkans can catch up Peter...
1
How the Western Balkans can catch up
Peter Sanfey, Jakov Milatović and Ana Krešić
Abstract
Countries in the Western Balkans – Albania, Bosnia and Herzegovina, FYR Macedonia, Kosovo, Montenegro and Serbia – all aspire to membership of the European Union, but they face a major convergence challenge in terms of living standards. The main reason behind this prosperity gap lies in the failure over the years of Western Balkan countries to be competitive, meaning that they lack the appropriate factors and institutions needed for high levels of long-term productivity. The key issue is whether the Western Balkans countries can narrow the gap in the coming decade and, if so, what do they need to do to achieve this.
The vital requirement for catching up with the rest of the European Union is a boost to investment in the region. The Western Balkans has a number of attractive features for investors. The long-term EU perspective is a major plus and a unique quality of the region compared with other emerging markets, as it helps to anchor market-oriented reforms and European standards. Strong macroeconomic stability, strategic geographic location, diverse economies, favourable tax regimes and low unit labour costs, combined with a relatively well-educated population, are common attributes throughout the region.
Looking ahead, sources of growth include trade integration, within the region and with the rest of the world, exploitation of the region’s energy resources, improvement of the transport infrastructure and technological innovation. However, long-term challenges remain, such as the possibility of a slowdown in reforms, risks posed by financial instability, adverse demographic trends and climate change. But provided governments in the region remain committed to reforms and regional cooperation, these challenges can be mitigated, if not overcome.
Keywords: Western Balkans, Competitiveness, Investment, Development
JEL Classification Number: F1 P0
Contact details: Peter Sanfey, One Exchange Square, London EC2A 2JN, United Kingdom
Phone: +44 20 7338 6227; Fax: +44 20 7338 6110; email: [email protected].
Peter Sanfey is Deputy Director, Country Economics and Policy; Jakov Milatović is Regional Analyst for south-eastern Europe; and Ana Krešić is an intern, all within the Country and Sector Economics Department at the EBRD.
We are grateful to Isabel Blanco, Ian Brown, Ralph de Haas, Christoph Denk, Tony Doherty, Alex Plekhanov, Toshiaki Sakatsume, Peter Tabak and Emir Zildžović for helpful comments on an earlier draft.
The working paper series has been produced to stimulate debate on economic transition and development. Views presented are those of the authors and not necessarily of the EBRD.
2
Working Paper No. 186 Prepared in January 2016
Introduction
As of early 2016, the six countries of the Western Balkans – Albania, Bosnia and
Herzegovina, FYR Macedonia, Kosovo, Montenegro and Serbia – face a formidable array of
challenges. For the past seven years growth rates have been in low single digits at best, and
negative at times in some countries. Levels of unemployment and poverty are persistently
high. Supplies of foreign credit and capital from private sources – plentiful in the pre-crisis
years – have largely dried up. Meanwhile, banks in the region remain preoccupied with the
legacy of the crisis, especially the high levels of non-performing loans (NPLs), rather than
lending to the real economy. At the same time, governments face severe limits in what they
can do to tackle these problems. The fiscal space for Keynesian-style public spending
projects is limited, while monetary policy is naturally constrained in these small open
economies which all have a high degree of euroisation. So how can the Western Balkans
countries catch up with their richer EU neighbours?
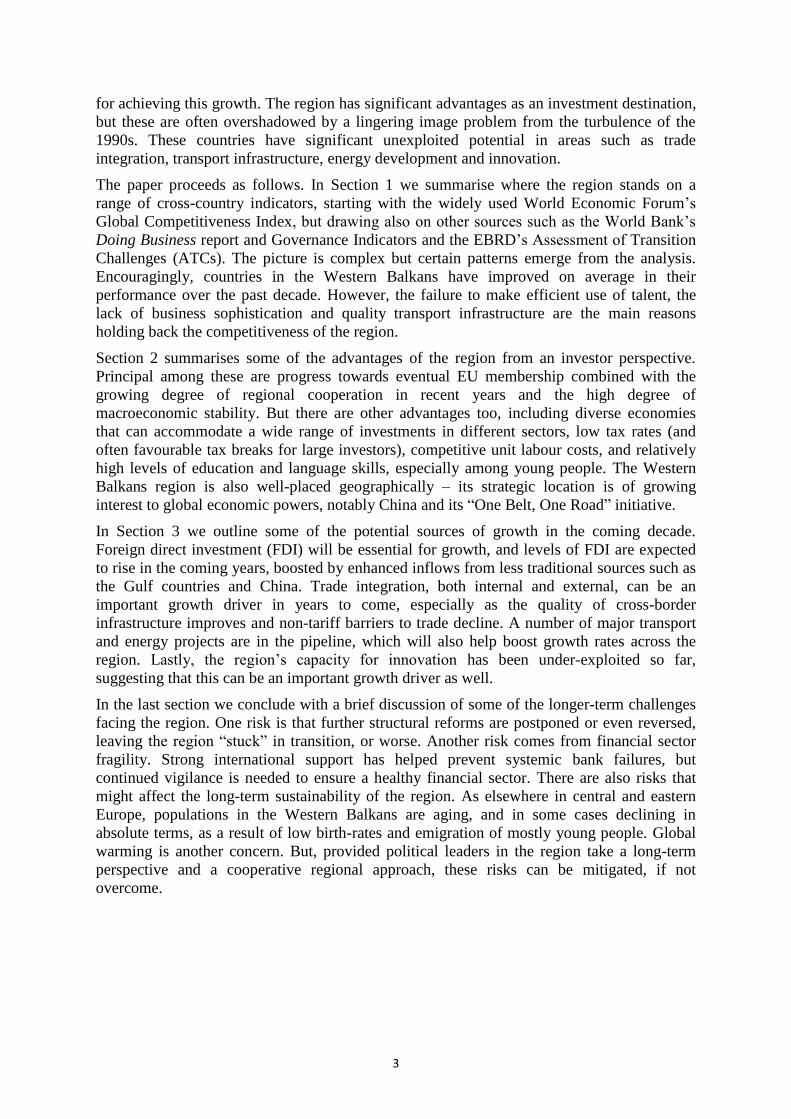
The size of this challenge – and the potential – facing the Western Balkans is illustrated in
Chart 1, which shows the extent of the gap in living standards vis-à-vis western, southern and
eastern European EU countries. Looking at the regional averages, GDP per capita in the
Western Balkans, adjusted for purchasing power parity, is roughly half that of eastern
European EU countries, one-third that of southern EU members and a mere quarter of the
richest EU members in western Europe. Such gaps reflect many years of under-performance
and turbulence in the Western Balkans.
Chart 1: Convergence potential
Source: World Economic Outlook, IMF, October 2015.
Note: Countries are ordered from highest to lowest. Luxembourg is an outlier in terms of GDP PPP per capita and is not included.
The central argument of this paper is that the Western Balkans can narrow these gaps in the
coming decade. Under the right circumstances, these economies can achieve growth rates that,
even if not quite matching the pre-crisis years (when growth was artificially boosted by a
huge credit boom), can make a serious dent in unemployment and poverty and bring living
standards closer to those in the European Union. Attracting foreign investment will be vital
3
for achieving this growth. The region has significant advantages as an investment destination,
but these are often overshadowed by a lingering image problem from the turbulence of the
1990s. These countries have significant unexploited potential in areas such as trade
integration, transport infrastructure, energy development and innovation.
The paper proceeds as follows. In Section 1 we summarise where the region stands on a
range of cross-country indicators, starting with the widely used World Economic Forum’s
Global Competitiveness Index, but drawing also on other sources such as the World Bank’s
Doing Business report and Governance Indicators and the EBRD’s Assessment of Transition
Challenges (ATCs). The picture is complex but certain patterns emerge from the analysis.
Encouragingly, countries in the Western Balkans have improved on average in their
performance over the past decade. However, the failure to make efficient use of talent, the
lack of business sophistication and quality transport infrastructure are the main reasons
holding back the competitiveness of the region.
Section 2 summarises some of the advantages of the region from an investor perspective.
Principal among these are progress towards eventual EU membership combined with the
growing degree of regional cooperation in recent years and the high degree of
macroeconomic stability. But there are other advantages too, including diverse economies
that can accommodate a wide range of investments in different sectors, low tax rates (and
often favourable tax breaks for large investors), competitive unit labour costs, and relatively
high levels of education and language skills, especially among young people. The Western
Balkans region is also well-placed geographically – its strategic location is of growing
interest to global economic powers, notably China and its “One Belt, One Road” initiative.
In Section 3 we outline some of the potential sources of growth in the coming decade.
Foreign direct investment (FDI) will be essential for growth, and levels of FDI are expected
to rise in the coming years, boosted by enhanced inflows from less traditional sources such as
the Gulf countries and China. Trade integration, both internal and external, can be an
important growth driver in years to come, especially as the quality of cross-border
infrastructure improves and non-tariff barriers to trade decline. A number of major transport
and energy projects are in the pipeline, which will also help boost growth rates across the
region. Lastly, the region’s capacity for innovation has been under-exploited so far,
suggesting that this can be an important growth driver as well.
In the last section we conclude with a brief discussion of some of the longer-term challenges
facing the region. One risk is that further structural reforms are postponed or even reversed,
leaving the region “stuck” in transition, or worse. Another risk comes from financial sector
fragility. Strong international support has helped prevent systemic bank failures, but
continued vigilance is needed to ensure a healthy financial sector. There are also risks that
might affect the long-term sustainability of the region. As elsewhere in central and eastern
Europe, populations in the Western Balkans are aging, and in some cases declining in
absolute terms, as a result of low birth-rates and emigration of mostly young people. Global
warming is another concern. But, provided political leaders in the region take a long-term
perspective and a cooperative regional approach, these risks can be mitigated, if not
overcome.
4
1. How competitive is the Western Balkans region relative to
others?
In the introduction we suggested that the Western Balkans lag behind the rest of Europe
because economies in the region have been less competitive than others. The notion of
“competitiveness” can mean different things to different authors. In this paper we deem a
country to be highly competitive if it has the right combination of institutions and policies,
such as effective governance and an enabling business environment, and factors of
production to achieve high levels of productivity. To understand why the region finds itself in
its current state, and to assess the potential for catch-up, it is important to see where these
countries stand across a range of indicators vis-à-vis its comparators in the European Union.
How competitive are the Western Balkans countries? The natural starting point to answer this
question is the World Economic Forum’s Global Competitiveness Report (GCR), a
publication that bills itself as the “world’s most comprehensive assessment of national
competitiveness”.1 But the GCR by no means captures all aspects of this concept. Other
surveys and studies can complement the report by providing greater insights into specific
aspects of the business environment and governance that hold back private sector
development and deter investment.
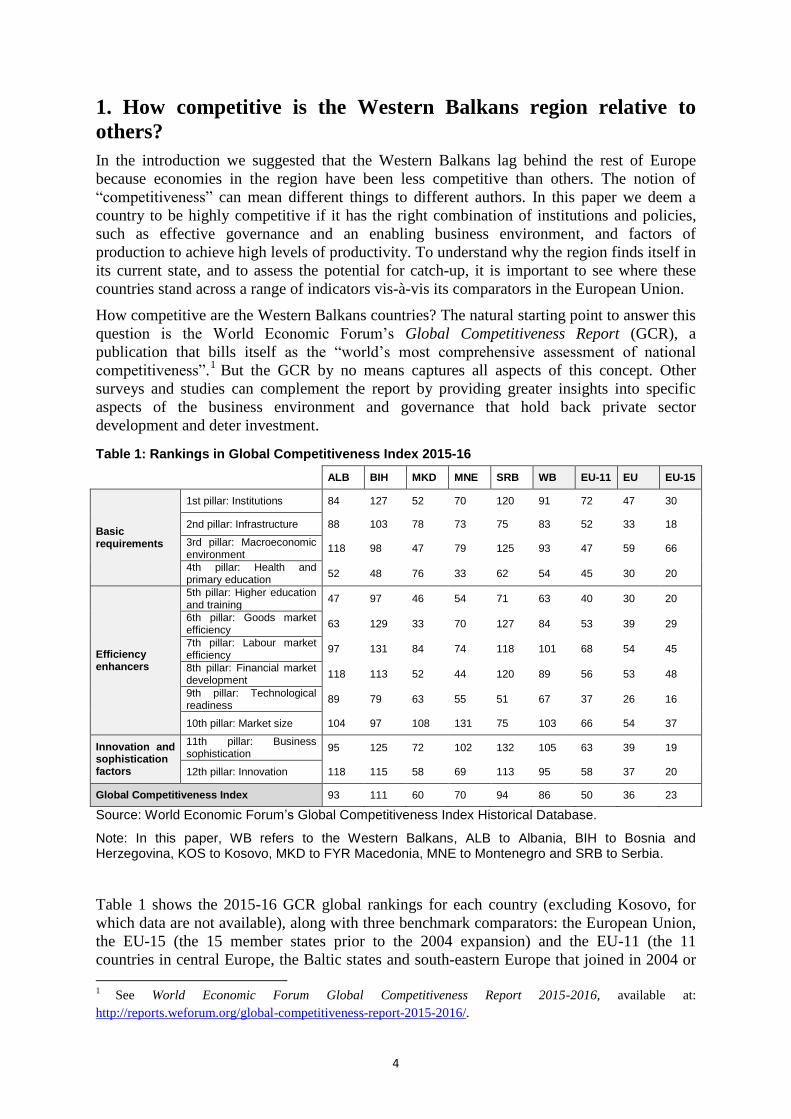
Table 1: Rankings in Global Competitiveness Index 2015-16
ALB BIH MKD MNE SRB WB EU-11 EU EU-15
Basic requirements
1st pillar: Institutions 84 127 52 70 120 91 72 47 30
2nd pillar: Infrastructure 88 103 78 73 75 83 52 33 18
3rd pillar: Macroeconomic environment
118 98 47 79 125 93 47 59 66
4th pillar: Health and primary education
52 48 76 33 62 54 45 30 20
Efficiency enhancers
5th pillar: Higher education and training
47 97 46 54 71 63 40 30 20
6th pillar: Goods market efficiency
63 129 33 70 127 84 53 39 29
7th pillar: Labour market efficiency
97 131 84 74 118 101 68 54 45
8th pillar: Financial market development
118 113 52 44 120 89 56 53 48
9th pillar: Technological readiness
89 79 63 55 51 67 37 26 16
10th pillar: Market size 104 97 108 131 75 103 66 54 37
Innovation and sophistication factors
11th pillar: Business sophistication
95 125 72 102 132 105 63 39 19
12th pillar: Innovation 118 115 58 69 113 95 58 37 20
Global Competitiveness Index 93 111 60 70 94 86 50 36 23
Source: World Economic Forum’s Global Competitiveness Index Historical Database.
Note: In this paper, WB refers to the Western Balkans, ALB to Albania, BIH to Bosnia and Herzegovina, KOS to Kosovo, MKD to FYR Macedonia, MNE to Montenegro and SRB to Serbia.
Table 1 shows the 2015-16 GCR global rankings for each country (excluding Kosovo, for
which data are not available), along with three benchmark comparators: the European Union,
the EU-15 (the 15 member states prior to the 2004 expansion) and the EU-11 (the 11
countries in central Europe, the Baltic states and south-eastern Europe that joined in 2004 or
1
See World Economic Forum Global Competitiveness Report 2015-2016, available at:
http://reports.weforum.org/global-competitiveness-report-2015-2016/.
5
later).2 The table shows the clear competitiveness gap between the Western Balkans region
and the European Union. On average, the region is ranked 86th (ranging from FYR
Macedonia in 60th to Bosnia and Herzegovina in 111th place), compared with an average
50th place for the EU-11 and 36th for the European Union as a whole. The gap is particularly
large with respect to the EU-15, where the average ranking is 23rd.
The GCI is made up of three broad categories, which are divided into 12 pillars, and the
rankings of the five Western Balkans countries by categories and pillars are also contained in
Table 1. The rankings differ widely, both within and across countries. The region scores
reasonably well on indicators associated with health and primary education, as well as higher
education and training (except for on-the-job training), electricity and telephone
infrastructure and information and communications technology (ICT) use. However, the most
problematic areas are: efficient use of talent, that is, capacity to attract talent from abroad and
retain talent, as confirmed by the brain drain problem; and reliance on informal (family and
friend) relationships rather than on professional management. The second area dragging
down the overall ranking is business sophistication. Despite the high heterogeneity, on
average countries lack well-developed business clusters and are characterised by shallow
value chains. Transport infrastructure ranks badly mostly due to the limited passenger-
carrying capacity in airline traffic, but also because of the poor quality of overall
infrastructure, including roads, railways and ports.
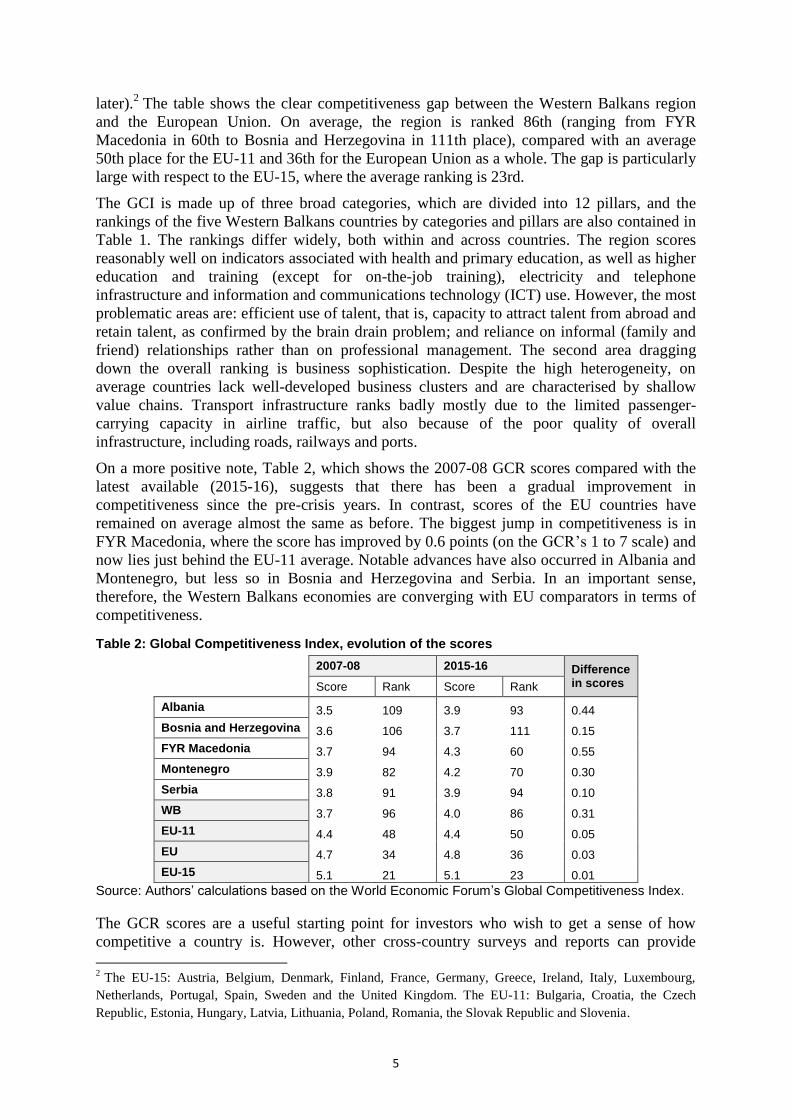
On a more positive note, Table 2, which shows the 2007-08 GCR scores compared with the
latest available (2015-16), suggests that there has been a gradual improvement in
competitiveness since the pre-crisis years. In contrast, scores of the EU countries have
remained on average almost the same as before. The biggest jump in competitiveness is in
FYR Macedonia, where the score has improved by 0.6 points (on the GCR’s 1 to 7 scale) and
now lies just behind the EU-11 average. Notable advances have also occurred in Albania and
Montenegro, but less so in Bosnia and Herzegovina and Serbia. In an important sense,
therefore, the Western Balkans economies are converging with EU comparators in terms of
competitiveness.
Table 2: Global Competitiveness Index, evolution of the scores
2007-08 2015-16 Difference in scores
Score Rank Score Rank
Albania 3.5 109 3.9 93 0.44
Bosnia and Herzegovina 3.6 106 3.7 111 0.15
FYR Macedonia 3.7 94 4.3 60 0.55
Montenegro 3.9 82 4.2 70 0.30
Serbia 3.8 91 3.9 94 0.10
WB 3.7 96 4.0 86 0.31
EU-11 4.4 48 4.4 50 0.05
EU 4.7 34 4.8 36 0.03
EU-15 5.1 21 5.1 23 0.01
Source: Authors’ calculations based on the World Economic Forum’s Global Competitiveness Index.
The GCR scores are a useful starting point for investors who wish to get a sense of how
competitive a country is. However, other cross-country surveys and reports can provide
2 The EU-15: Austria, Belgium, Denmark, Finland, France, Germany, Greece, Ireland, Italy, Luxembourg,
Netherlands, Portugal, Spain, Sweden and the United Kingdom. The EU-11: Bulgaria, Croatia, the Czech
Republic, Estonia, Hungary, Latvia, Lithuania, Poland, Romania, the Slovak Republic and Slovenia.
6
complementary perspectives and insights, especially when it comes to economic governance
and the overall quality of the business environment. To shed further light on these two areas,
we draw on three other surveys and reports: two from the World Bank (Governance
Indicators and Doing Business scores) and the joint EBRD-World Bank Business
Environment and Enterprise Performance Survey (BEEPS).
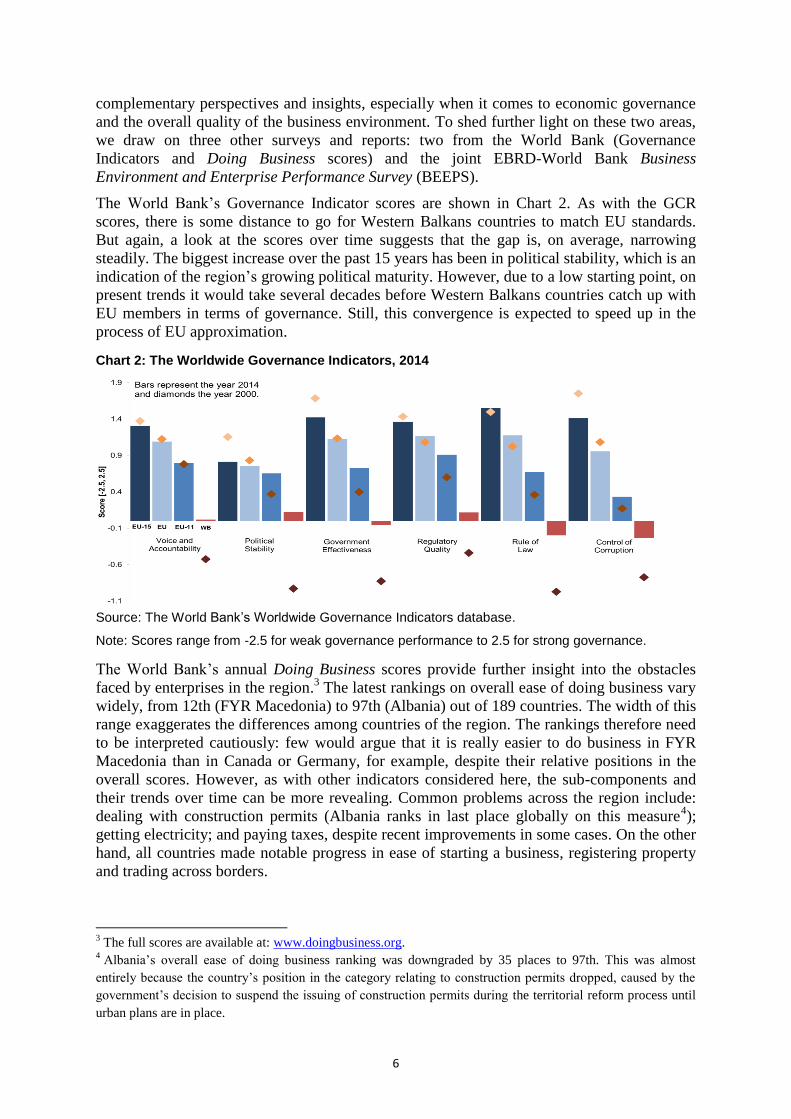
The World Bank’s Governance Indicator scores are shown in Chart 2. As with the GCR
scores, there is some distance to go for Western Balkans countries to match EU standards.
But again, a look at the scores over time suggests that the gap is, on average, narrowing
steadily. The biggest increase over the past 15 years has been in political stability, which is an
indication of the region’s growing political maturity. However, due to a low starting point, on
present trends it would take several decades before Western Balkans countries catch up with
EU members in terms of governance. Still, this convergence is expected to speed up in the
process of EU approximation.
Chart 2: The Worldwide Governance Indicators, 2014
Source: The World Bank’s Worldwide Governance Indicators database.
Note: Scores range from -2.5 for weak governance performance to 2.5 for strong governance.
The World Bank’s annual Doing Business scores provide further insight into the obstacles
faced by enterprises in the region.3 The latest rankings on overall ease of doing business vary
widely, from 12th (FYR Macedonia) to 97th (Albania) out of 189 countries. The width of this
range exaggerates the differences among countries of the region. The rankings therefore need
to be interpreted cautiously: few would argue that it is really easier to do business in FYR
Macedonia than in Canada or Germany, for example, despite their relative positions in the
overall scores. However, as with other indicators considered here, the sub-components and
their trends over time can be more revealing. Common problems across the region include:
dealing with construction permits (Albania ranks in last place globally on this measure4);
getting electricity; and paying taxes, despite recent improvements in some cases. On the other
hand, all countries made notable progress in ease of starting a business, registering property
and trading across borders.
3 The full scores are available at: www.doingbusiness.org.
4 Albania’s overall ease of doing business ranking was downgraded by 35 places to 97th. This was almost
entirely because the country’s position in the category relating to construction permits dropped, caused by the
government’s decision to suspend the issuing of construction permits during the territorial reform process until
urban plans are in place.
7
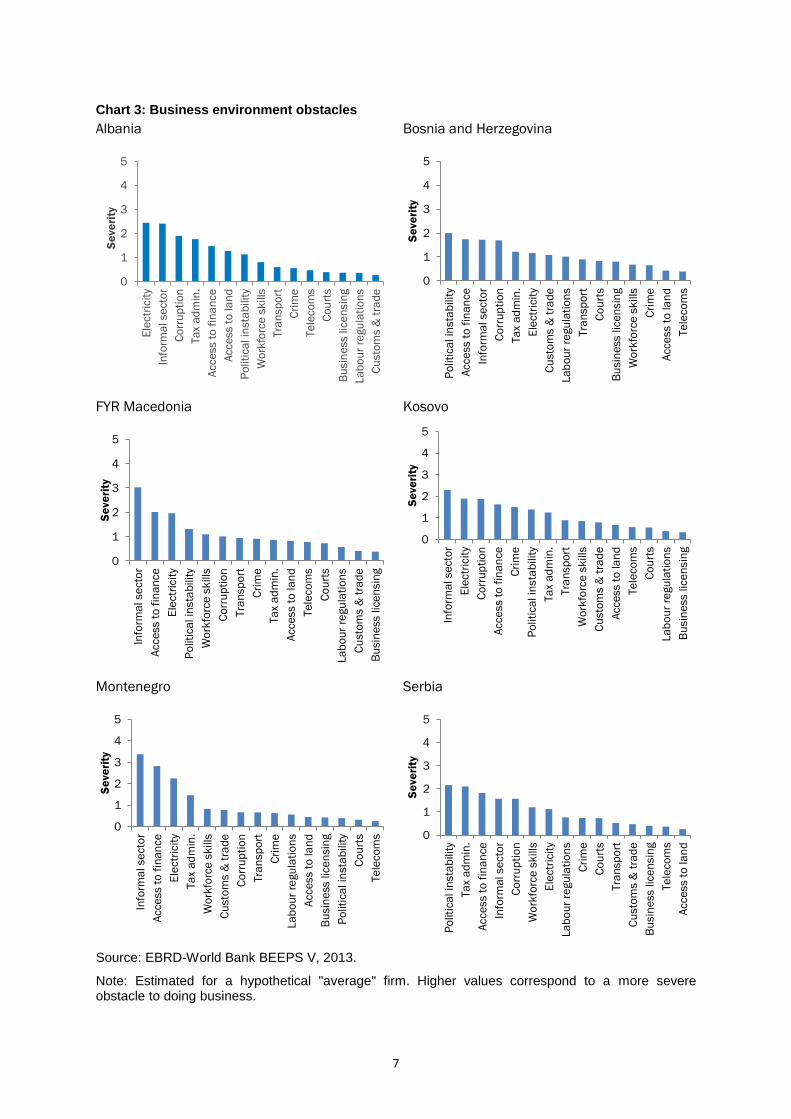
Chart 3: Business environment obstacles
Albania
Bosnia and Herzegovina
FYR Macedonia
Kosovo
Montenegro
Serbia
Source: EBRD-World Bank BEEPS V, 2013.
Note: Estimated for a hypothetical "average" firm. Higher values correspond to a more severe obstacle to doing business.
0
1
2
3
4
5
Ele
ctr
icit
y
Info
rma
l se
cto
r
Co
rru
pti
on
Ta
x a
dm
in.
Acce
ss t
o f
ina
nce
Acce
ss t
o la
nd
Po
liti
ca
l in
sta
bilit
y
Wo
rkfo
rce
sk
ills
Tra
nsp
ort
Cri
me
Te
leco
ms
Co
urt
s
Bu
sin
ess lic
en
sin
g
La
bo
ur
regu
lati
on
s
Cu
sto
ms &
tra
de
Se
ve
rity
0
1
2
3
4
5
Po
liti
ca
l in
sta
bilit
y
Acce
ss t
o f
ina
nce
Info
rma
l se
cto
r
Co
rru
pti
on
Ta
x a
dm
in.
Ele
ctr
icit
y
Cu
sto
ms &
tra
de
La
bo
ur
regu
lati
on
s
Tra
nsp
ort
Co
urt
s
Bu
sin
ess lic
en
sin
g
Wo
rkfo
rce
sk
ills
Cri
me
Acce
ss t
o la
nd
Te
leco
ms
Se
ve
rity
0
1
2
3
4
5
Info
rma
l se
cto
r
Acce
ss t
o f
ina
nce
Ele
ctr
icit
y
Po
liti
ca
l in
sta
bilit
y
Wo
rkfo
rce
sk
ills
Co
rru
pti
on
Tra
nsp
ort
Cri
me
Ta
x a
dm
in.
Acce
ss t
o la
nd
Te
leco
ms
Co
urt
s
La
bo
ur
regu
lati
on
s
Cu
sto
ms &
tra
de
Bu
sin
ess lic
en
sin
g
Se
ve
rity
0
1
2
3
4
5
Info
rma
l se
cto
r
Ele
ctr
icit
y
Co
rru
pti
on
Acce
ss t
o f
ina
nce
Cri
me
Po
liti
ca
l in
sta
bilit
y
Ta
x a
dm
in.
Tra
nsp
ort
Wo
rkfo
rce
sk
ills
Cu
sto
ms &
tra
de
Acce
ss t
o la
nd
Te
leco
ms
Co
urt
s
La
bo
ur
regu
lati
on
s
Bu
sin
ess lic
en
sin
g
Se
ve
rity
0
1
2
3
4
5
Info
rma
l se
cto
r
Acce
ss t
o f
ina
nce
Ele
ctr
icit
y
Ta
x a
dm
in.
Wo
rkfo
rce
sk
ills
Cu
sto
ms &
tra
de
Co
rru
pti
on
Tra
nsp
ort
Cri
me
La
bo
ur
regu
lati
on
s
Acce
ss t
o la
nd
Bu
sin
ess lic
en
sin
g
Po
liti
ca
l in
sta
bilit
y
Co
urt
s
Te
leco
ms
Se
ve
rity
0
1
2
3
4
5
Po
liti
ca
l in
sta
bilit
y
Ta
x a
dm
in.
Acce
ss t
o f
ina
nce
Info
rma
l se
cto
r
Co
rru
pti
on
Wo
rkfo
rce
sk
ills
Ele
ctr
icit
y
La
bo
ur
regu
lati
on
s
Cri
me
Co
urt
s
Tra
nsp
ort
Cu
sto
ms &
tra
de
Bu
sin
ess lic
en
sin
g
Te
leco
ms
Acce
ss t
o la
nd
Se
ve
rity
8
To gain further insight into the obstacles, as perceived by businesses, we turn lastly to the
EBRD-World Bank Business Environment and Enterprise Performance Survey (BEEPS).
The BEEPS, carried out every three to four years since the first round in 1999, is a face-to-
face survey of top managers that looks at various aspects of the business environment through
both quantitative and qualitative questions. One of the parts of the survey is an opinion-based
question that asks respondents to grade areas according to their perception of how severe an
obstacle is. The responses range from “not an obstacle”, which can be scored at 0, to “a very
severe obstacle”, scored 4.
Chart 3 highlights the main obstacles, ranked by severity, for a hypothetical “average” firm in
each country. In virtually all countries, competition from the informal sector stands out as a
key constraint. This is a long-standing problem in the region and efforts to address it have
been sporadic at best. The Albanian government’s recent initiative to tackle the problem is
welcome and may yield concrete results (see Box 1, p38). Having reliable access to
electricity is also identified by many businesses in Albania and Kosovo as a major obstacle,
consistent with the analysis of the World Bank’s Doing Business report.
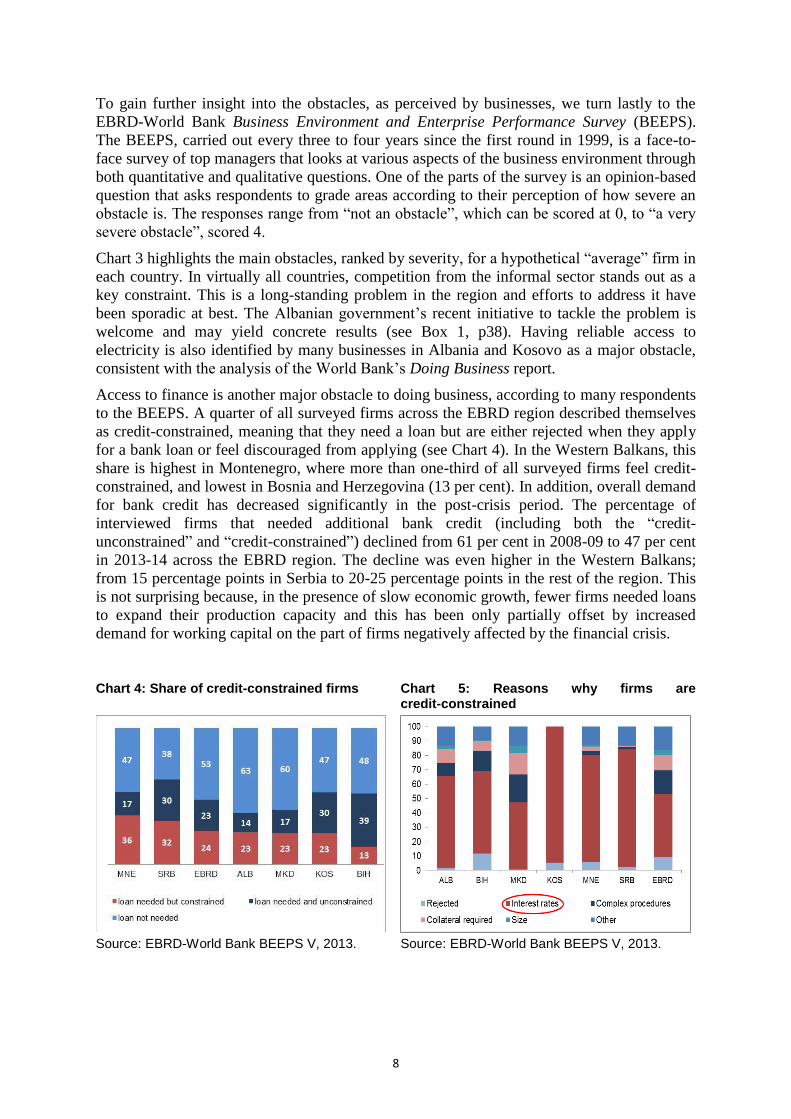
Access to finance is another major obstacle to doing business, according to many respondents
to the BEEPS. A quarter of all surveyed firms across the EBRD region described themselves
as credit-constrained, meaning that they need a loan but are either rejected when they apply
for a bank loan or feel discouraged from applying (see Chart 4). In the Western Balkans, this
share is highest in Montenegro, where more than one-third of all surveyed firms feel credit-
constrained, and lowest in Bosnia and Herzegovina (13 per cent). In addition, overall demand
for bank credit has decreased significantly in the post-crisis period. The percentage of
interviewed firms that needed additional bank credit (including both the “credit-
unconstrained” and “credit-constrained”) declined from 61 per cent in 2008-09 to 47 per cent
in 2013-14 across the EBRD region. The decline was even higher in the Western Balkans;
from 15 percentage points in Serbia to 20-25 percentage points in the rest of the region. This
is not surprising because, in the presence of slow economic growth, fewer firms needed loans
to expand their production capacity and this has been only partially offset by increased
demand for working capital on the part of firms negatively affected by the financial crisis.
Chart 4: Share of credit-constrained firms Chart 5: Reasons why firms are credit-constrained
Source: EBRD-World Bank BEEPS V, 2013. Source: EBRD-World Bank BEEPS V, 2013.

9
But what is driving these constraints? Chart 5 provides further insights. Overwhelmingly in
the Western Balkans region the main driver is the discouraging level of interest rates. Despite
the high number of banks in the region, competition among lenders appears to be limited and
small and medium-sized enterprises (SMEs) in particular struggle to get the funds they need
to grow their businesses. Other reasons that discourage firms from applying for bank credit
include: complex procedures, collateral requirements and size of the loan.
To conclude this section, it is fair to say that the Western Balkans region lies behind western
European comparators in terms of competitiveness, governance and ease of doing business.
But there are plenty of reasons to be optimistic about future trends. In particular, institutions
and governance standards are being slowly but steadily improved, especially in the EU
candidate countries. The next section outlines some of the potential advantages of the region
not fully captured by the cross-country data sets mentioned above.
10
2. What can the Western Balkans offer investors?
In this section we focus on why the Western Balkans can be attractive to investors. There are
seven features of the region that, in our view, are worth emphasising. They are: prospective
EU membership; macroeconomic stability; strategic location; favourable taxes; diverse
economies; and low labour costs combined with a relatively educated population. Each of
these will be discussed in turn.
Prospective EU membership
The new European Commission Enlargement Strategy,5 released in November 2015, has
reaffirmed the European prospective of all Western Balkans countries, without exception.
Although full membership is not on the cards for any of these countries during the mandate of
the present Commission (2014-19), the past year has seen further progress in most countries
in the enlargement process. The most advanced in this regard is Montenegro which, having
started membership negotiations in June 2012, had by December 2015 opened more than half
of the negotiation chapters of the EU acquis communautaire, including the most challenging
Chapters 23 and 24 relating to judiciary and fundamental rights; and justice, freedom and
security, respectively. Serbia opened its first chapters in December 2015, including the one
on normalisation of its relations with Kosovo, almost two years after the symbolic opening of
the accession negotiations in January 2014. Albania, a candidate country since June 2014, is
deemed in the latest European Commission report to be “making steady progress” while
Bosnia and Herzegovina – not yet a candidate – is judged to be “back on track” (see Box 2,
p39) and submitted its application for membership on 15 February 2016. Kosovo and the
European Union signed a Stabilisation and Association Agreement (SAA) in October 2015
(see Box 3, p40). Only FYR Macedonia, a candidate since 2005, has failed to make
demonstrable progress since then as its name dispute with Greece remains unresolved.
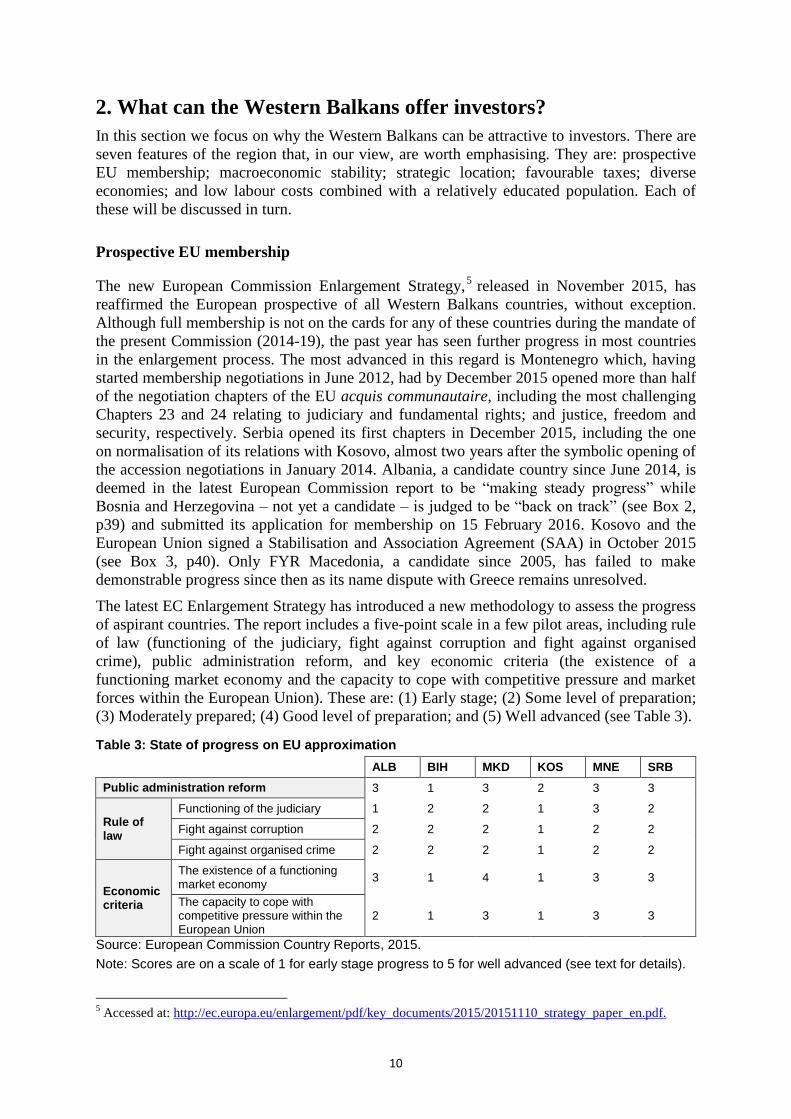
The latest EC Enlargement Strategy has introduced a new methodology to assess the progress
of aspirant countries. The report includes a five-point scale in a few pilot areas, including rule
of law (functioning of the judiciary, fight against corruption and fight against organised
crime), public administration reform, and key economic criteria (the existence of a
functioning market economy and the capacity to cope with competitive pressure and market
forces within the European Union). These are: (1) Early stage; (2) Some level of preparation;
(3) Moderately prepared; (4) Good level of preparation; and (5) Well advanced (see Table 3).
Table 3: State of progress on EU approximation
ALB BIH MKD KOS MNE SRB
Public administration reform 3 1 3 2 3 3
Rule of law
Functioning of the judiciary 1 2 2 1 3 2
Fight against corruption 2 2 2 1 2 2
Fight against organised crime 2 2 2 1 2 2
Economic criteria
The existence of a functioning market economy
3 1 4 1 3 3
The capacity to cope with competitive pressure within the European Union
2 1 3 1 3 3
Source: European Commission Country Reports, 2015.
Note: Scores are on a scale of 1 for early stage progress to 5 for well advanced (see text for details).
5 Accessed at: http://ec.europa.eu/enlargement/pdf/key_documents/2015/20151110_strategy_paper_en.pdf.
11
Based on this, the country currently most advanced on its EU track – Montenegro – is at the
top end regarding public administration, the judicial system, proximity to a functioning
market economy, capacity to cope with pressure and market forces within the European
Union, and in the ability to take on the obligations of membership, in all of which it is
deemed to be “moderately prepared” (scoring 3 on the 1-5 scale). In contrast, Kosovo and
Bosnia and Herzegovina are in general poorly prepared for EU membership, particularly
regarding the economic criteria where both countries are “at an early stage” (scoring just 1 on
the 1-5 scale) in the existence of a functioning market economy, and their ability to cope with
competitive pressures and market forces within the European Union.
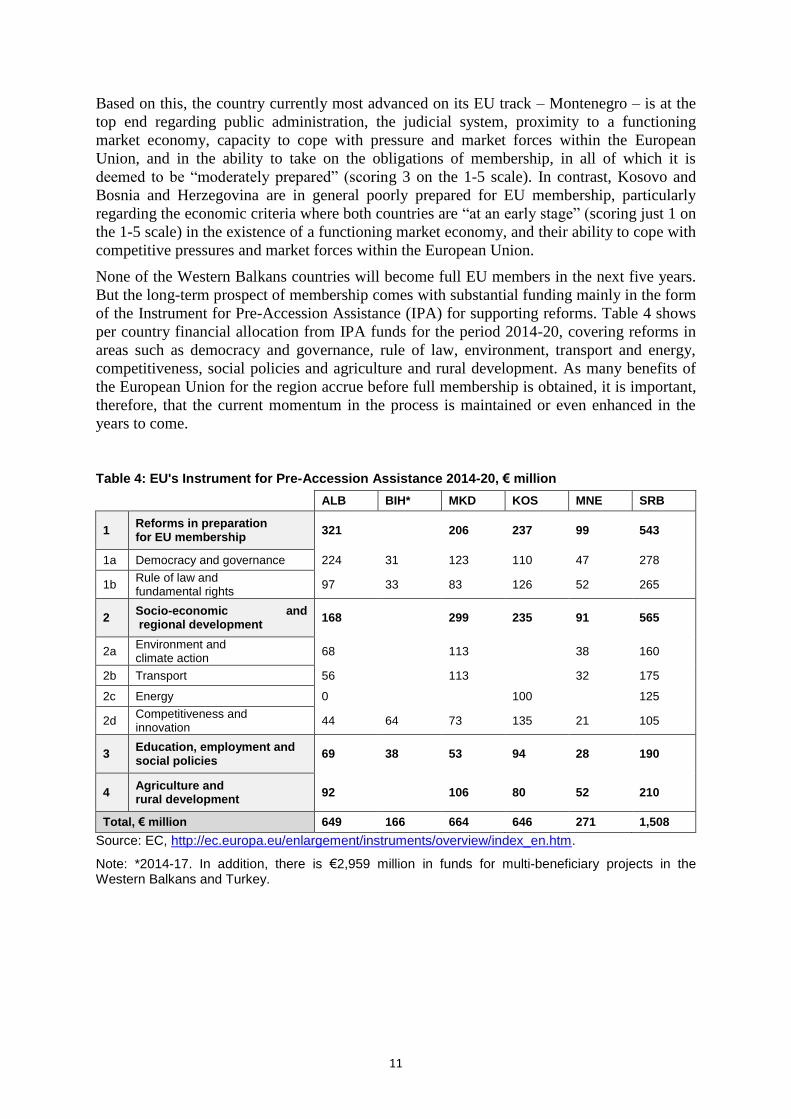
None of the Western Balkans countries will become full EU members in the next five years.
But the long-term prospect of membership comes with substantial funding mainly in the form
of the Instrument for Pre-Accession Assistance (IPA) for supporting reforms. Table 4 shows
per country financial allocation from IPA funds for the period 2014-20, covering reforms in
areas such as democracy and governance, rule of law, environment, transport and energy,
competitiveness, social policies and agriculture and rural development. As many benefits of
the European Union for the region accrue before full membership is obtained, it is important,
therefore, that the current momentum in the process is maintained or even enhanced in the
years to come.
Table 4: EU's Instrument for Pre-Accession Assistance 2014-20, € million
ALB BIH* MKD KOS MNE SRB
1 Reforms in preparation for EU membership
321 206 237 99 543
1a Democracy and governance 224 31 123 110 47 278
1b Rule of law and fundamental rights
97 33 83 126 52 265
2 Socio-economic and regional development
168 299 235 91 565
2a Environment and climate action
68
113
38 160
2b Transport 56
113
32 175
2c Energy 0
100
125
2d Competitiveness and innovation
44 64 73 135 21 105
3 Education, employment and social policies
69 38 53 94 28 190
4 Agriculture and rural development
92 106 80 52 210
Total, € million 649 166 664 646 271 1,508
Source: EC, http://ec.europa.eu/enlargement/instruments/overview/index_en.htm.
Note: *2014-17. In addition, there is €2,959 million in funds for multi-beneficiary projects in the Western Balkans and Turkey.
12
Macroeconomic stability
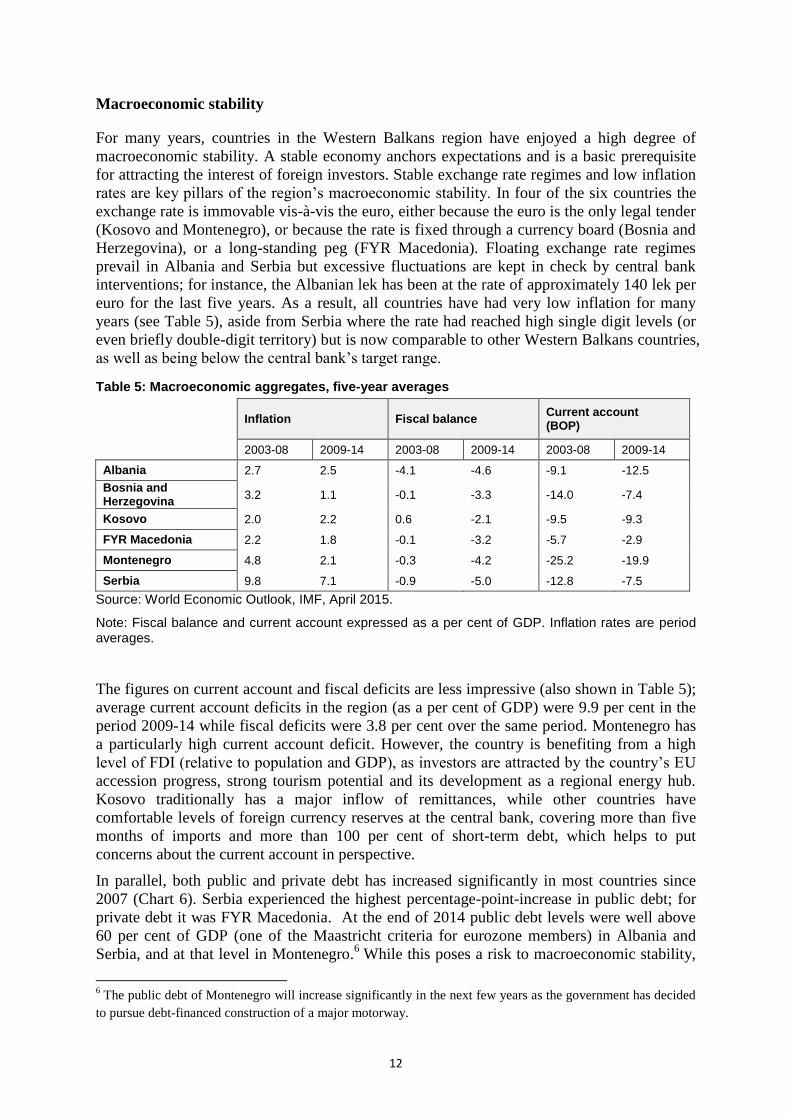
For many years, countries in the Western Balkans region have enjoyed a high degree of
macroeconomic stability. A stable economy anchors expectations and is a basic prerequisite
for attracting the interest of foreign investors. Stable exchange rate regimes and low inflation
rates are key pillars of the region’s macroeconomic stability. In four of the six countries the
exchange rate is immovable vis-à-vis the euro, either because the euro is the only legal tender
(Kosovo and Montenegro), or because the rate is fixed through a currency board (Bosnia and
Herzegovina), or a long-standing peg (FYR Macedonia). Floating exchange rate regimes
prevail in Albania and Serbia but excessive fluctuations are kept in check by central bank
interventions; for instance, the Albanian lek has been at the rate of approximately 140 lek per
euro for the last five years. As a result, all countries have had very low inflation for many
years (see Table 5), aside from Serbia where the rate had reached high single digit levels (or
even briefly double-digit territory) but is now comparable to other Western Balkans countries,
as well as being below the central bank’s target range.
Table 5: Macroeconomic aggregates, five-year averages
Inflation Fiscal balance
Current account (BOP)
2003-08 2009-14 2003-08 2009-14 2003-08 2009-14
Albania 2.7 2.5 -4.1 -4.6 -9.1 -12.5
Bosnia and Herzegovina
3.2 1.1 -0.1 -3.3 -14.0 -7.4
Kosovo 2.0 2.2 0.6 -2.1 -9.5 -9.3
FYR Macedonia 2.2 1.8 -0.1 -3.2 -5.7 -2.9
Montenegro 4.8 2.1 -0.3 -4.2 -25.2 -19.9
Serbia 9.8 7.1 -0.9 -5.0 -12.8 -7.5
Source: World Economic Outlook, IMF, April 2015.
Note: Fiscal balance and current account expressed as a per cent of GDP. Inflation rates are period averages.
The figures on current account and fiscal deficits are less impressive (also shown in Table 5);
average current account deficits in the region (as a per cent of GDP) were 9.9 per cent in the
period 2009-14 while fiscal deficits were 3.8 per cent over the same period. Montenegro has
a particularly high current account deficit. However, the country is benefiting from a high
level of FDI (relative to population and GDP), as investors are attracted by the country’s EU
accession progress, strong tourism potential and its development as a regional energy hub.
Kosovo traditionally has a major inflow of remittances, while other countries have
comfortable levels of foreign currency reserves at the central bank, covering more than five
months of imports and more than 100 per cent of short-term debt, which helps to put
concerns about the current account in perspective.
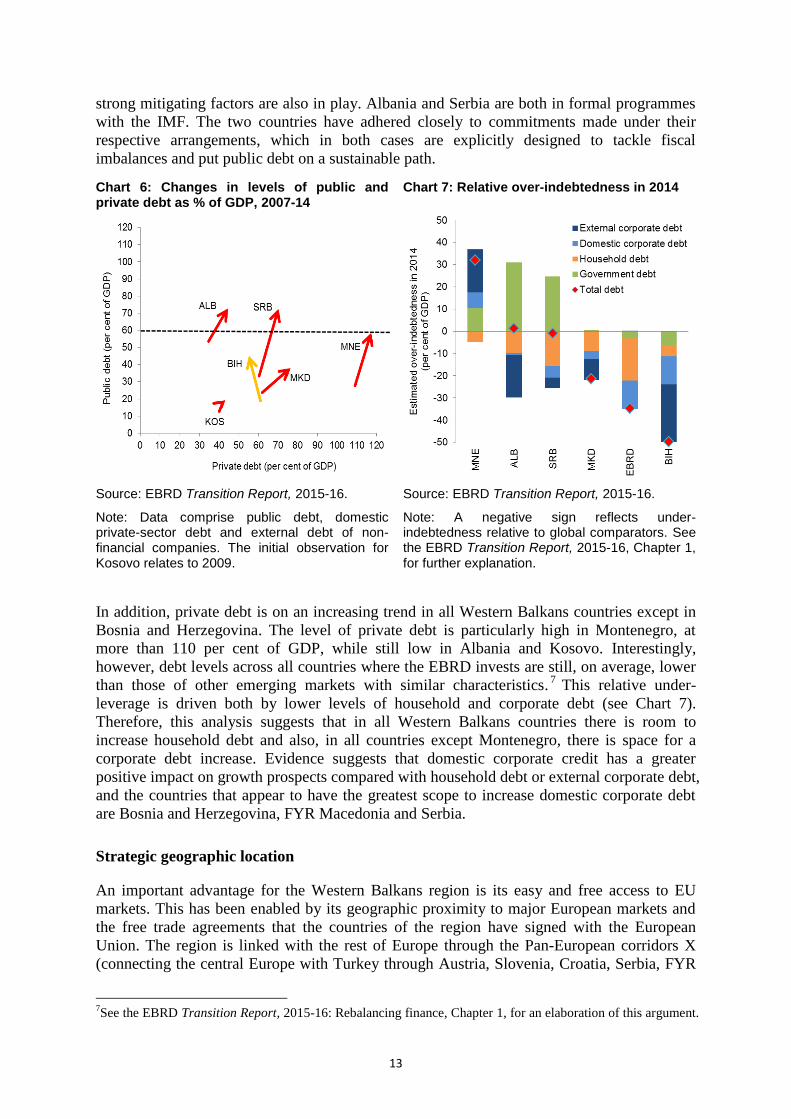
In parallel, both public and private debt has increased significantly in most countries since
2007 (Chart 6). Serbia experienced the highest percentage-point-increase in public debt; for
private debt it was FYR Macedonia. At the end of 2014 public debt levels were well above
60 per cent of GDP (one of the Maastricht criteria for eurozone members) in Albania and
Serbia, and at that level in Montenegro.6 While this poses a risk to macroeconomic stability,
6 The public debt of Montenegro will increase significantly in the next few years as the government has decided
to pursue debt-financed construction of a major motorway.
13
strong mitigating factors are also in play. Albania and Serbia are both in formal programmes
with the IMF. The two countries have adhered closely to commitments made under their
respective arrangements, which in both cases are explicitly designed to tackle fiscal
imbalances and put public debt on a sustainable path.
Chart 6: Changes in levels of public and private debt as % of GDP, 2007-14
Chart 7: Relative over-indebtedness in 2014
Source: EBRD Transition Report, 2015-16.
Note: Data comprise public debt, domestic private-sector debt and external debt of non-financial companies. The initial observation for Kosovo relates to 2009.
Source: EBRD Transition Report, 2015-16.
Note: A negative sign reflects under-indebtedness relative to global comparators. See the EBRD Transition Report, 2015-16, Chapter 1, for further explanation.
In addition, private debt is on an increasing trend in all Western Balkans countries except in
Bosnia and Herzegovina. The level of private debt is particularly high in Montenegro, at
more than 110 per cent of GDP, while still low in Albania and Kosovo. Interestingly,
however, debt levels across all countries where the EBRD invests are still, on average, lower
than those of other emerging markets with similar characteristics.7 This relative under-
leverage is driven both by lower levels of household and corporate debt (see Chart 7).
Therefore, this analysis suggests that in all Western Balkans countries there is room to
increase household debt and also, in all countries except Montenegro, there is space for a
corporate debt increase. Evidence suggests that domestic corporate credit has a greater
positive impact on growth prospects compared with household debt or external corporate debt,
and the countries that appear to have the greatest scope to increase domestic corporate debt
are Bosnia and Herzegovina, FYR Macedonia and Serbia.
Strategic geographic location
An important advantage for the Western Balkans region is its easy and free access to EU
markets. This has been enabled by its geographic proximity to major European markets and
the free trade agreements that the countries of the region have signed with the European
Union. The region is linked with the rest of Europe through the Pan-European corridors X
(connecting the central Europe with Turkey through Austria, Slovenia, Croatia, Serbia, FYR
7See the EBRD Transition Report, 2015-16: Rebalancing finance, Chapter 1, for an elaboration of this argument.
14
Macedonia and Greece), VII (connecting the Black Sea with the Ionian Sea and passing
through Bulgaria, FYR Macedonia and Albania), and Vc (connecting central Europe with the
Adriatic Sea via Hungary, Croatia, Bosnia and Herzegovina and Croatia again).
Owing to its geographic position between the East and West, the region is often referred to as
a gateway to Europe. As sea shipping remains the cheapest way to transport goods from the
Far East to Europe, China plans to establish a rapid transport connection from the Greek port
of Piraeus, the first major European container port for ships entering the Mediterranean from
the Suez Channel, through the Balkans further to the EU markets – the Balkan Silk Road.
This will come as the part of the “One Belt, One Road” initiative unveiled by the Chinese
President in 2013. The Balkan Silk Road will be based on the existing railroad network
linking central Europe with the Aegean Sea via Serbia, FYR Macedonia and Greece. The first
operational move to realise the plan was made when the Chinese shipping giant Cosco Pacific
took over half of the Piraeus port in a 35-year concession with the aim of turning the port into
one of Europe’s top five container ports. However, to take full advantage of the port,
investments into transport links across the Western Balkans are needed, such as the €1.5
billion worth high-speed railway between Belgrade and Budapest as signed between China,
Hungary and Serbia.
Location is also a major factor why the Western Balkans could play a role in improving the
EU’s energy security through possible investments in new gas pipelines. This topic is
discussed further in Section 3.
Diverse economies
Economies in the Western Balkans region tend to be quite diverse, rather than relying on one
or a few sectors, and therefore offer a wide range of opportunities for investors. A diverse
economy is also one that allows human capital development to expand in many different
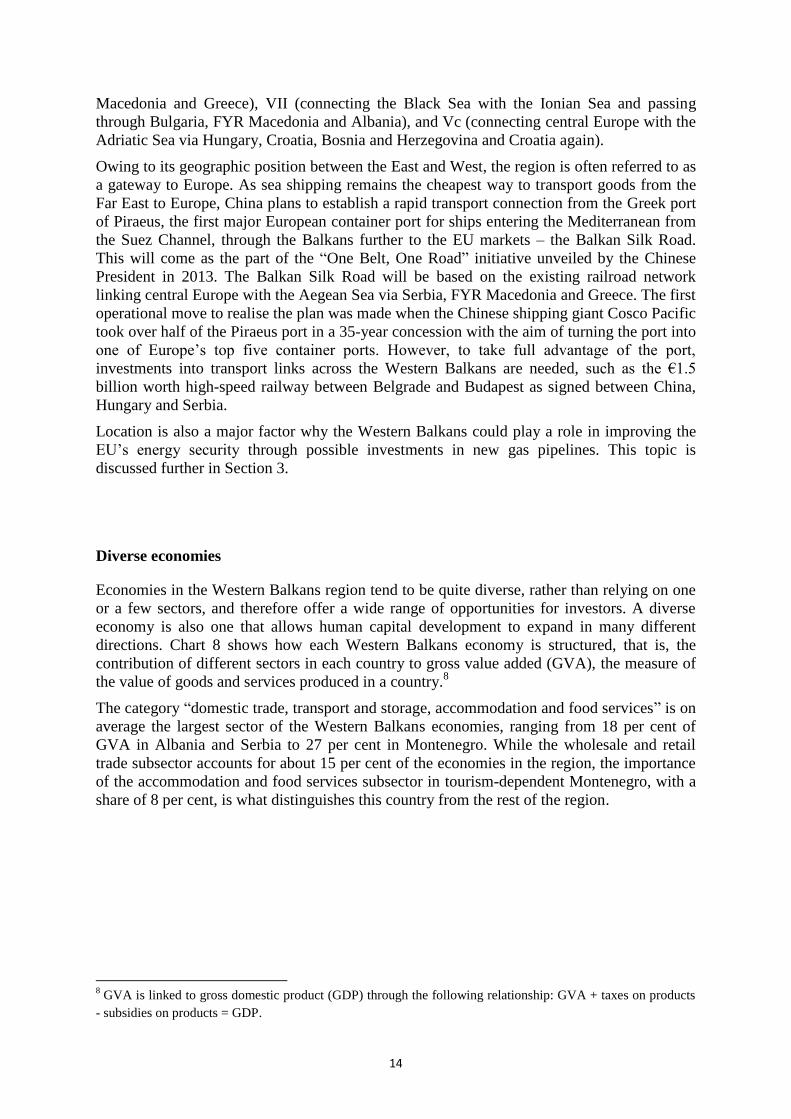
directions. Chart 8 shows how each Western Balkans economy is structured, that is, the
contribution of different sectors in each country to gross value added (GVA), the measure of
the value of goods and services produced in a country.8
The category “domestic trade, transport and storage, accommodation and food services” is on
average the largest sector of the Western Balkans economies, ranging from 18 per cent of
GVA in Albania and Serbia to 27 per cent in Montenegro. While the wholesale and retail
trade subsector accounts for about 15 per cent of the economies in the region, the importance
of the accommodation and food services subsector in tourism-dependent Montenegro, with a
share of 8 per cent, is what distinguishes this country from the rest of the region.
8 GVA is linked to gross domestic product (GDP) through the following relationship: GVA + taxes on products
- subsidies on products = GDP.
15
Chart 8: Structure of economy, per cent of gross value added, 2014
Sources: National statistical offices.
Industry accounts for one-fifth of GVA on average. However, this varies significantly across
the countries. The role of industry is particularly important in Serbia (where it represents an
equally important part of the economy as in EU-11) and, to a slightly lesser extent, in Bosnia
and Herzegovina and Kosovo. Manufacturing is the predominant industrial subsector,
especially in Serbia, FYR Macedonia and Kosovo. The utilities subsector of industry,
including energy production, is important for Bosnia and Herzegovina and Montenegro. The
mining subsector plays a minor role; from 1 per cent to 3 per cent of the economy in the case
of Kosovo.
Meanwhile public administration, defence, education and social services account for 17 per
cent of economic activity on average, from 13 per cent in Albania to over one-fifth of the
economy in Bosnia and Herzegovina.
In general, the region is quite agriculture-intensive, and agriculture (together with forestry
and fishing) accounts for 12 per cent of value added on average, ranging from only 7 per cent
in Bosnia and Herzegovina to 23 per cent in Albania. Agriculture plays a vital role in the
Western Balkans, both socially and in terms of employment. This contrasts significantly with
the EU-11 where on average the sector accounts for only 4 per cent of economies. Serbia
stands out as having a clear comparative advantage in farming, mainly due to fertile
agricultural soil in its northern province of Vojvodina. Some large producers have been able
to take advantage of both economies of scale and access to major export markets, primarily
the European Union but also Russia, with which Serbia has a free trade agreement (the only
country in the region to do so). The other five countries have less advanced agricultural
sectors, mainly consisting of small-scale and inefficient subsistence farming. The potential
for agribusiness to develop further in the region is significant provided countries can
consolidate agricultural holdings, improve the quality of collection, storage and marketing,
and develop agricultural support services such as insurance.
Real-estate-related activities account for one-tenth of economies, on average, and
construction around 7 per cent, on average, but more than 10 per cent in Albania. The
financial sector, professional/scientific/technical sector and ICT each account for just 4 per
cent of value added, on average. This is again in contrast with the EU-11, where these sectors
16
account for a larger share, in particular the professional sector which is twice the size. These
areas can be important attractors for future FDI.
Furthermore, several countries have strong potential for further growth in the tourism sector.
In 2013, receipts from international tourists amounted to 21 per cent of GDP in Montenegro
and 13 per cent of GDP in Albania.9 Both countries, as well as others in the region, expect
tourism numbers to increase significantly in the coming years, especially as the quality of
infrastructure and services improves towards the standards of the most advanced western
markets.
Favourable taxes
A stable and favourable tax climate and incentives for foreign businesses are sometimes
deciding factors when foreign investors make decisions about location of investment. Most
countries in the Western Balkans have made significant progress in reforming their tax
systems in line with best international practice. During the past decade, tax rates in the region
have been relatively stable, there has been a fall in the administrative burden of submitting
taxes and efforts have been made towards widening the tax base.
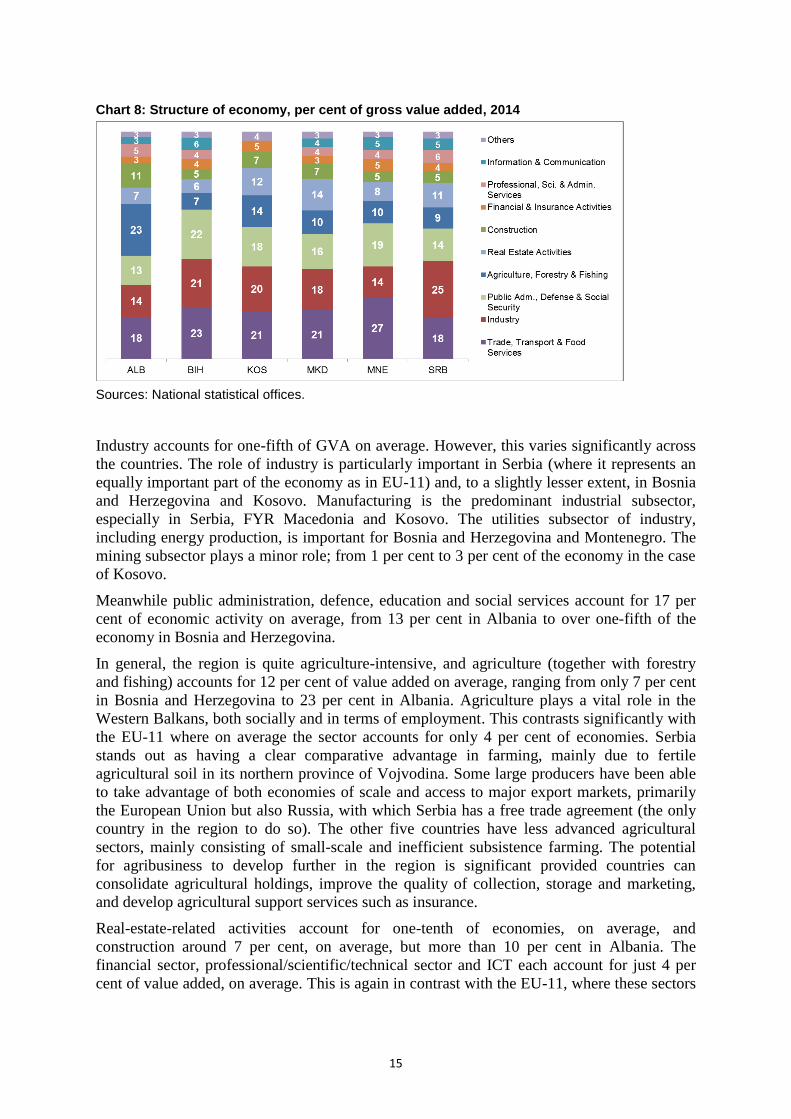
To substantiate these points, we draw on various sources. First, the World Bank’s Doing
Business report, together with PwC for this area, covers three dimensions of paying taxes:
total tax rate with contributions of different types of taxes; number of tax payments per year;
and time needed to comply with the tax rules.10
Chart 9 shows the total tax burden as a
percentage of firms’ profits and its composition: profit tax, labour tax and contributions, and
other taxes.
Chart 9: Total tax burden as a per cent of profit, 2015
Source: The World Bank’s Doing Business database.
9 See World Bank, World Development Indicators, International tourism, receipts (current US dollars).
10 As with other Doing Business sub-indices, the category “paying taxes” uses a case study scenario. This means
that the same set of financial statements and assumptions about the company and transactions is used by a
number of tax experts in each country to calculate what the company would have to do to satisfy tax procedures.
Results are therefore comparable across the countries and give a richer picture than that obtained by simply
looking at rates prescribed by laws.
17
Although there are differences among the countries in the Western Balkans region, the total
tax burden is clearly lower than in any of the benchmarks (EU-11, EU, and EU-15). This is
driven by both lower profit and a smaller labour tax burden. In fact, FYR Macedonia has one
of the lowest total tax burdens in the world – largely because there are no labour taxes (that is,
social insurance contributions borne by companies), but also because it levies taxes on
corporate profits only once they are distributed as dividends and has low levels of other
taxes.11
Bosnia and Herzegovina, Kosovo and Montenegro also have a relatively low tax
burden. Albania and Serbia are the only two Western Balkans countries where the total tax
share of profits is almost at the EU-11 level of 40 per cent.
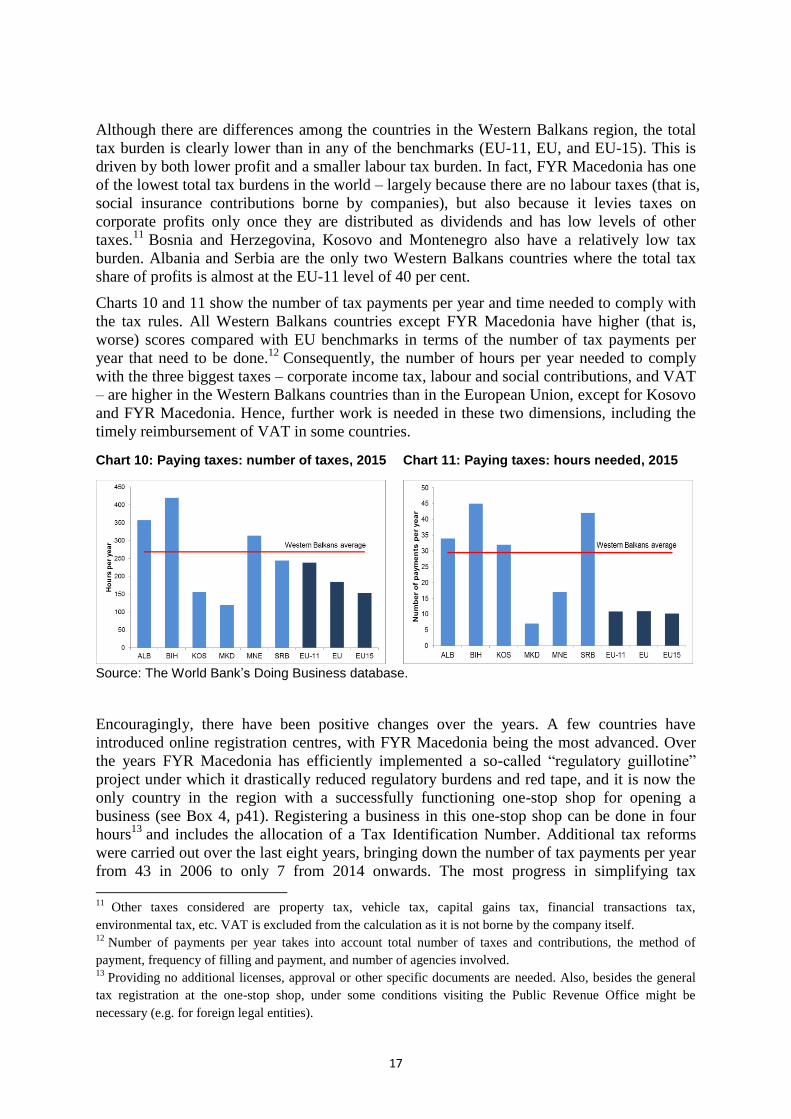
Charts 10 and 11 show the number of tax payments per year and time needed to comply with
the tax rules. All Western Balkans countries except FYR Macedonia have higher (that is,
worse) scores compared with EU benchmarks in terms of the number of tax payments per
year that need to be done.12
Consequently, the number of hours per year needed to comply
with the three biggest taxes – corporate income tax, labour and social contributions, and VAT
– are higher in the Western Balkans countries than in the European Union, except for Kosovo
and FYR Macedonia. Hence, further work is needed in these two dimensions, including the
timely reimbursement of VAT in some countries.
Chart 10: Paying taxes: number of taxes, 2015 Chart 11: Paying taxes: hours needed, 2015
Source: The World Bank’s Doing Business database.
Encouragingly, there have been positive changes over the years. A few countries have
introduced online registration centres, with FYR Macedonia being the most advanced. Over
the years FYR Macedonia has efficiently implemented a so-called “regulatory guillotine”
project under which it drastically reduced regulatory burdens and red tape, and it is now the
only country in the region with a successfully functioning one-stop shop for opening a
business (see Box 4, p41). Registering a business in this one-stop shop can be done in four
hours13
and includes the allocation of a Tax Identification Number. Additional tax reforms
were carried out over the last eight years, bringing down the number of tax payments per year
from 43 in 2006 to only 7 from 2014 onwards. The most progress in simplifying tax
11
Other taxes considered are property tax, vehicle tax, capital gains tax, financial transactions tax,
environmental tax, etc. VAT is excluded from the calculation as it is not borne by the company itself. 12
Number of payments per year takes into account total number of taxes and contributions, the method of
payment, frequency of filling and payment, and number of agencies involved. 13
Providing no additional licenses, approval or other specific documents are needed. Also, besides the general
tax registration at the one-stop shop, under some conditions visiting the Public Revenue Office might be
necessary (e.g. for foreign legal entities).
18
payments was made by introducing electronic filing and payment systems in 2008, and
further improving and encouraging their use for corporate income and value added taxes in
2014.
Low labour costs combined with a relatively educated population
A further advantage of the region is the relatively low cost of labour, as shown by unit labour
costs (ULC), defined as gross labour cost divided by GDP. While ULC is not a perfect
approximation of representative firm labour costs, it gives a good idea of a country’s labour
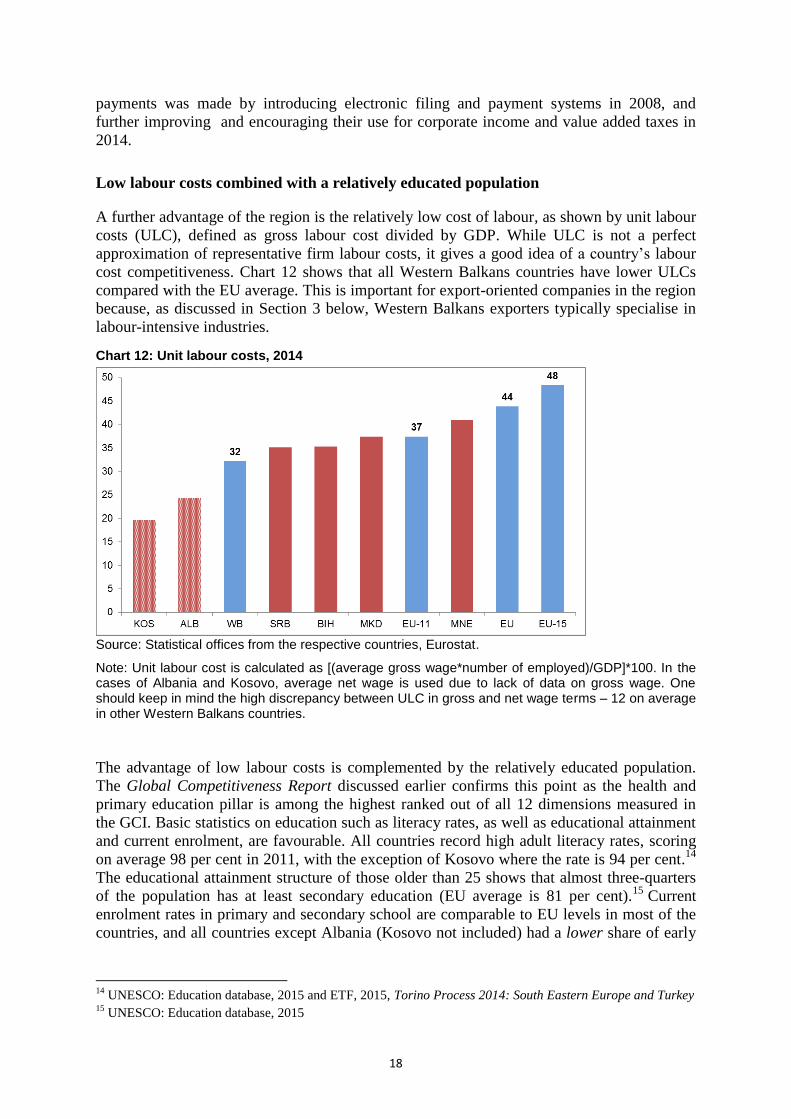
cost competitiveness. Chart 12 shows that all Western Balkans countries have lower ULCs
compared with the EU average. This is important for export-oriented companies in the region
because, as discussed in Section 3 below, Western Balkans exporters typically specialise in
labour-intensive industries.
Chart 12: Unit labour costs, 2014
Source: Statistical offices from the respective countries, Eurostat.
Note: Unit labour cost is calculated as [(average gross wage*number of employed)/GDP]*100. In the cases of Albania and Kosovo, average net wage is used due to lack of data on gross wage. One should keep in mind the high discrepancy between ULC in gross and net wage terms – 12 on average in other Western Balkans countries.
The advantage of low labour costs is complemented by the relatively educated population.
The Global Competitiveness Report discussed earlier confirms this point as the health and
primary education pillar is among the highest ranked out of all 12 dimensions measured in
the GCI. Basic statistics on education such as literacy rates, as well as educational attainment
and current enrolment, are favourable. All countries record high adult literacy rates, scoring
on average 98 per cent in 2011, with the exception of Kosovo where the rate is 94 per cent.14
The educational attainment structure of those older than 25 shows that almost three-quarters
of the population has at least secondary education (EU average is 81 per cent).15
Current
enrolment rates in primary and secondary school are comparable to EU levels in most of the
countries, and all countries except Albania (Kosovo not included) had a lower share of early
14
UNESCO: Education database, 2015 and ETF, 2015, Torino Process 2014: South Eastern Europe and Turkey 15
UNESCO: Education database, 2015
19
school leavers than the EU average in 2013, with a decreasing trend over the last three
years.16
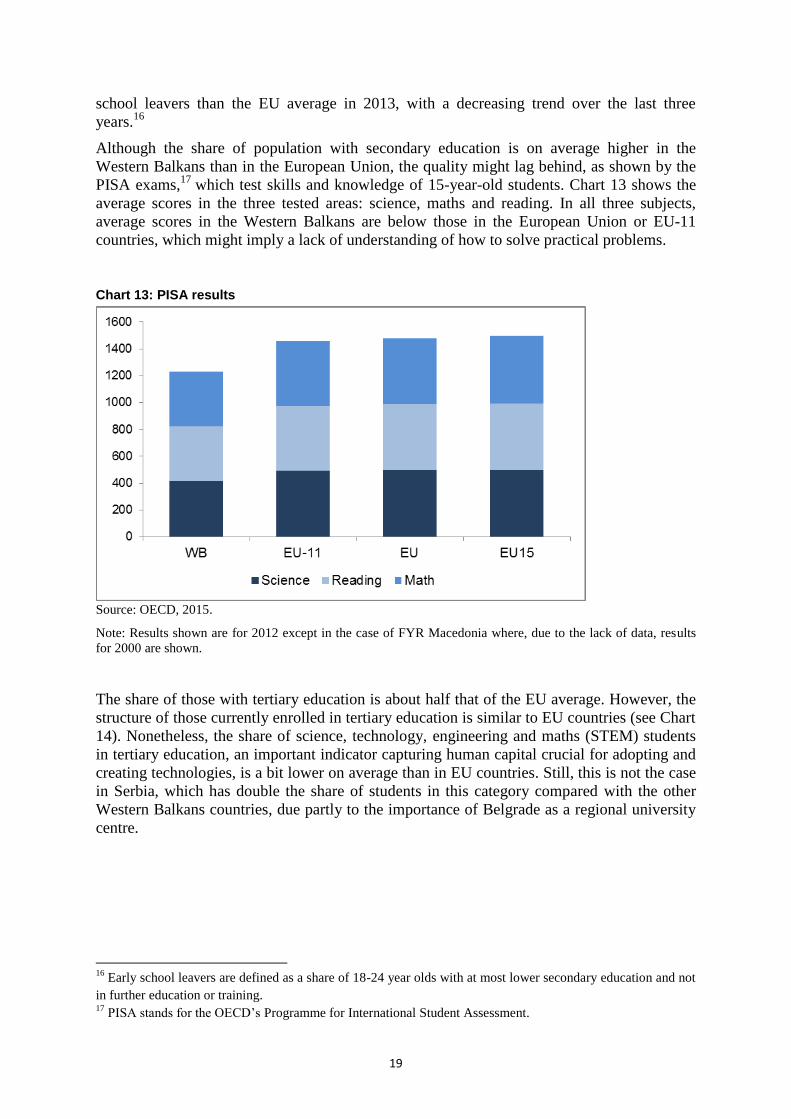
Although the share of population with secondary education is on average higher in the
Western Balkans than in the European Union, the quality might lag behind, as shown by the
PISA exams,17
which test skills and knowledge of 15-year-old students. Chart 13 shows the
average scores in the three tested areas: science, maths and reading. In all three subjects,
average scores in the Western Balkans are below those in the European Union or EU-11
countries, which might imply a lack of understanding of how to solve practical problems.
Chart 13: PISA results
Source: OECD, 2015.
Note: Results shown are for 2012 except in the case of FYR Macedonia where, due to the lack of data, results
for 2000 are shown.
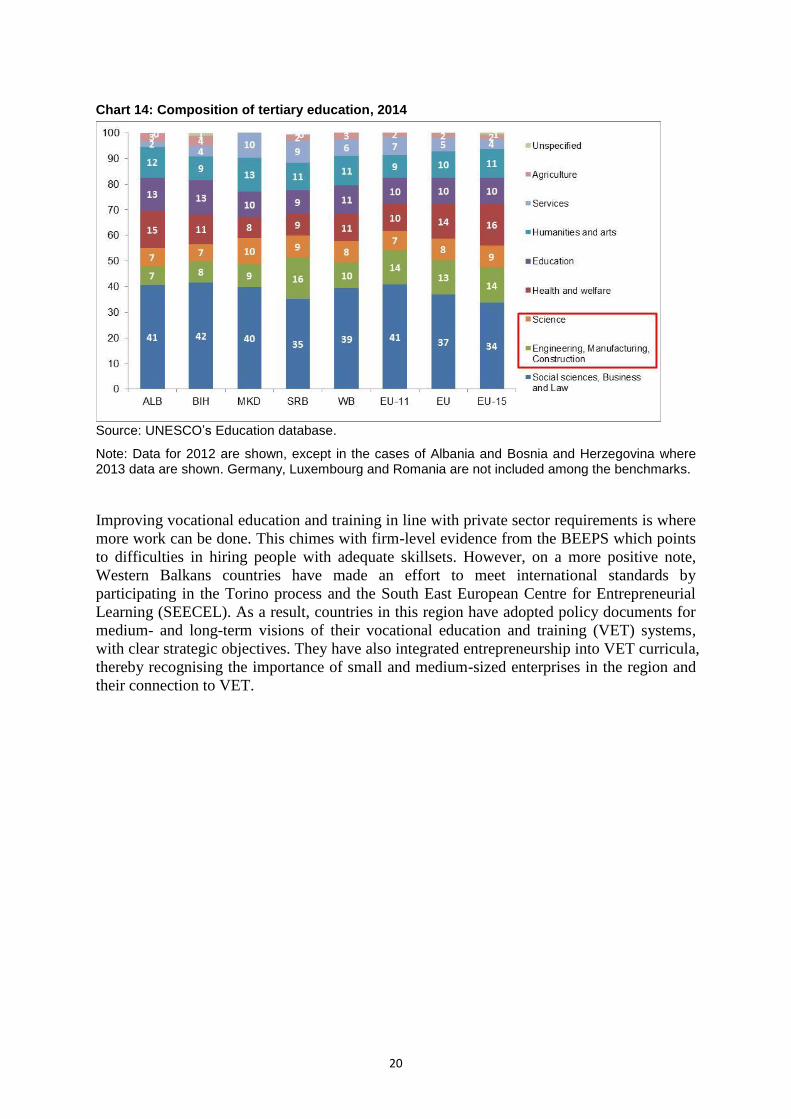
The share of those with tertiary education is about half that of the EU average. However, the
structure of those currently enrolled in tertiary education is similar to EU countries (see Chart
14). Nonetheless, the share of science, technology, engineering and maths (STEM) students
in tertiary education, an important indicator capturing human capital crucial for adopting and
creating technologies, is a bit lower on average than in EU countries. Still, this is not the case
in Serbia, which has double the share of students in this category compared with the other
Western Balkans countries, due partly to the importance of Belgrade as a regional university
centre.
16
Early school leavers are defined as a share of 18-24 year olds with at most lower secondary education and not
in further education or training. 17
PISA stands for the OECD’s Programme for International Student Assessment.
20
Chart 14: Composition of tertiary education, 2014
Source: UNESCO’s Education database.
Note: Data for 2012 are shown, except in the cases of Albania and Bosnia and Herzegovina where 2013 data are shown. Germany, Luxembourg and Romania are not included among the benchmarks.
Improving vocational education and training in line with private sector requirements is where
more work can be done. This chimes with firm-level evidence from the BEEPS which points
to difficulties in hiring people with adequate skillsets. However, on a more positive note,
Western Balkans countries have made an effort to meet international standards by
participating in the Torino process and the South East European Centre for Entrepreneurial
Learning (SEECEL). As a result, countries in this region have adopted policy documents for
medium- and long-term visions of their vocational education and training (VET) systems,
with clear strategic objectives. They have also integrated entrepreneurship into VET curricula,
thereby recognising the importance of small and medium-sized enterprises in the region and
their connection to VET.
21
3. Where will growth come from in the coming decade?
In the previous sections we have shown that competitiveness is improving in the Western
Balkans and that the region has a number of attractive features to offer investors. But these
factors, while necessary, are not sufficient for future growth and convergence. In this section
we explore some of the potential growth drivers in the coming decade. We first examine the
structure of previous FDI to the region and we point to the growing importance of non-
traditional source countries such as those in the Gulf and China. We then look at the
importance of trade and the removal of cross-border barriers, followed by the impetus that
can be expected from major transport and energy projects. Lastly, we highlight the role of
innovation, another underdeveloped area that has major potential and will likely become
increasingly prominent in the years to come.
Foreign direct investment
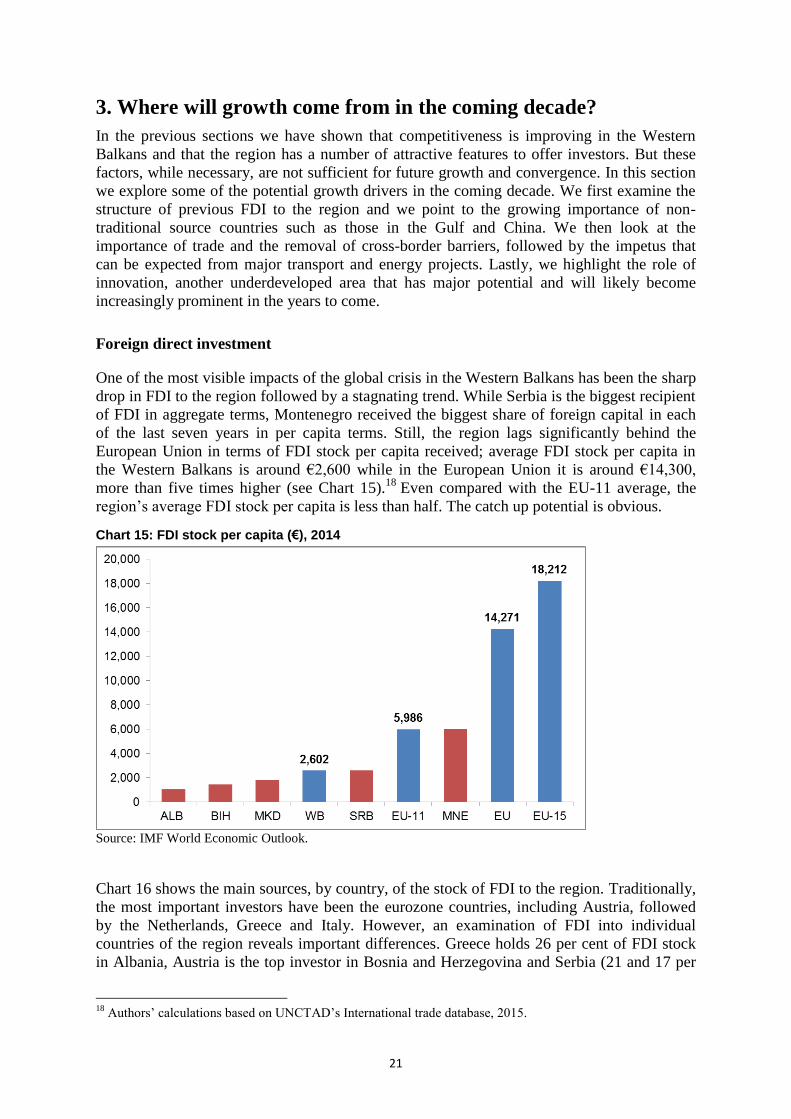
One of the most visible impacts of the global crisis in the Western Balkans has been the sharp
drop in FDI to the region followed by a stagnating trend. While Serbia is the biggest recipient
of FDI in aggregate terms, Montenegro received the biggest share of foreign capital in each
of the last seven years in per capita terms. Still, the region lags significantly behind the
European Union in terms of FDI stock per capita received; average FDI stock per capita in
the Western Balkans is around €2,600 while in the European Union it is around €14,300,
more than five times higher (see Chart 15).18
Even compared with the EU-11 average, the
region’s average FDI stock per capita is less than half. The catch up potential is obvious.
Chart 15: FDI stock per capita (€), 2014
Source: IMF World Economic Outlook.
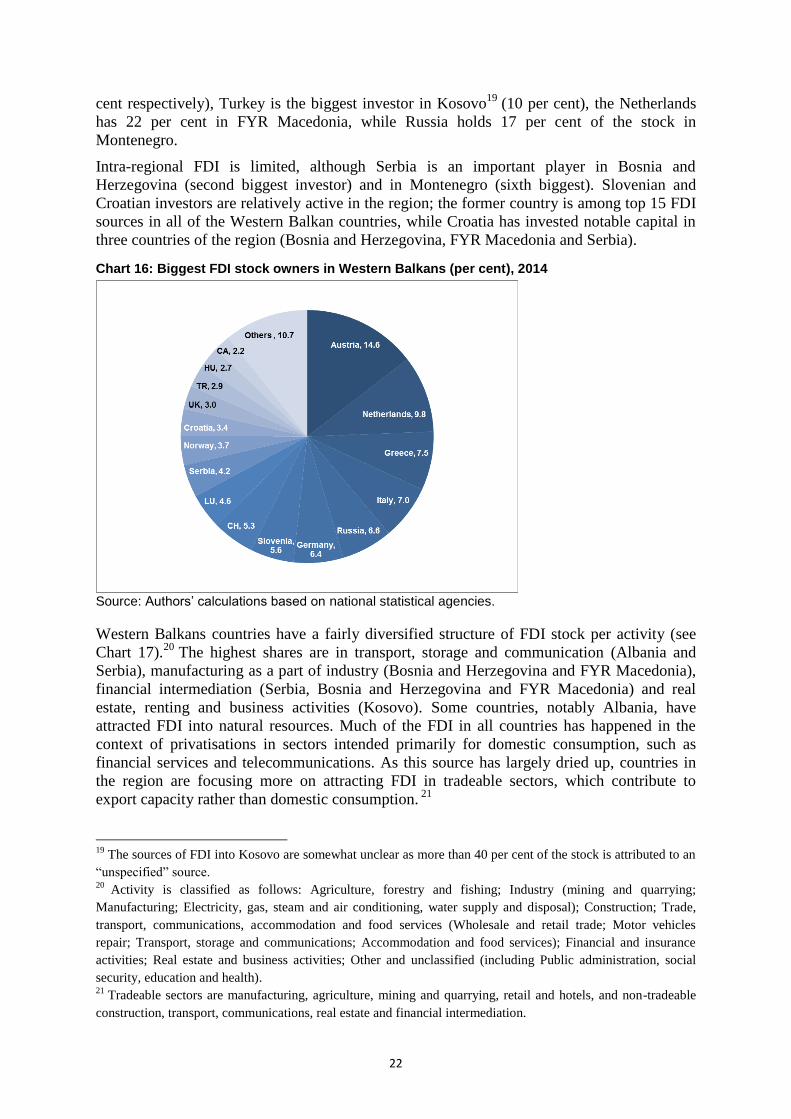
Chart 16 shows the main sources, by country, of the stock of FDI to the region. Traditionally,
the most important investors have been the eurozone countries, including Austria, followed
by the Netherlands, Greece and Italy. However, an examination of FDI into individual
countries of the region reveals important differences. Greece holds 26 per cent of FDI stock
in Albania, Austria is the top investor in Bosnia and Herzegovina and Serbia (21 and 17 per
18
Authors’ calculations based on UNCTAD’s International trade database, 2015.
22
cent respectively), Turkey is the biggest investor in Kosovo19
(10 per cent), the Netherlands
has 22 per cent in FYR Macedonia, while Russia holds 17 per cent of the stock in
Montenegro.
Intra-regional FDI is limited, although Serbia is an important player in Bosnia and
Herzegovina (second biggest investor) and in Montenegro (sixth biggest). Slovenian and
Croatian investors are relatively active in the region; the former country is among top 15 FDI
sources in all of the Western Balkan countries, while Croatia has invested notable capital in
three countries of the region (Bosnia and Herzegovina, FYR Macedonia and Serbia).
Chart 16: Biggest FDI stock owners in Western Balkans (per cent), 2014
Source: Authors’ calculations based on national statistical agencies.
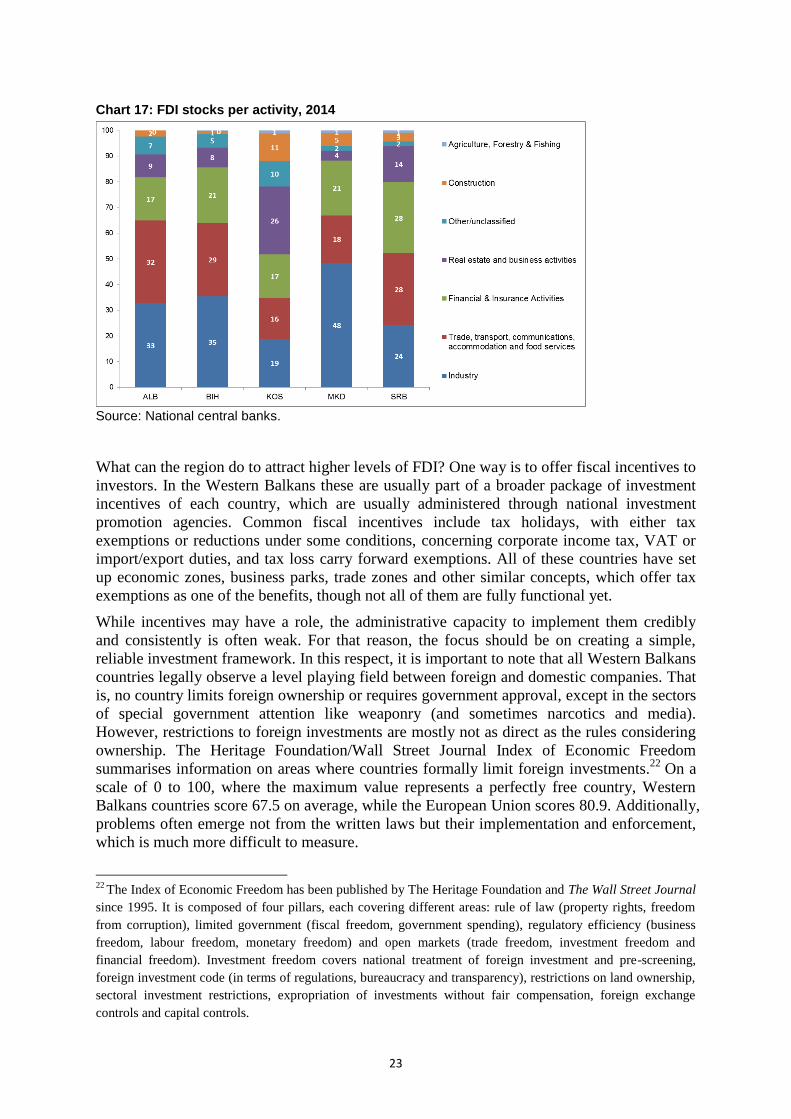
Western Balkans countries have a fairly diversified structure of FDI stock per activity (see
Chart 17).20
The highest shares are in transport, storage and communication (Albania and
Serbia), manufacturing as a part of industry (Bosnia and Herzegovina and FYR Macedonia),
financial intermediation (Serbia, Bosnia and Herzegovina and FYR Macedonia) and real
estate, renting and business activities (Kosovo). Some countries, notably Albania, have
attracted FDI into natural resources. Much of the FDI in all countries has happened in the
context of privatisations in sectors intended primarily for domestic consumption, such as
financial services and telecommunications. As this source has largely dried up, countries in
the region are focusing more on attracting FDI in tradeable sectors, which contribute to
export capacity rather than domestic consumption. 21
19
The sources of FDI into Kosovo are somewhat unclear as more than 40 per cent of the stock is attributed to an
“unspecified” source. 20
Activity is classified as follows: Agriculture, forestry and fishing; Industry (mining and quarrying;
Manufacturing; Electricity, gas, steam and air conditioning, water supply and disposal); Construction; Trade,
transport, communications, accommodation and food services (Wholesale and retail trade; Motor vehicles
repair; Transport, storage and communications; Accommodation and food services); Financial and insurance
activities; Real estate and business activities; Other and unclassified (including Public administration, social
security, education and health). 21
Tradeable sectors are manufacturing, agriculture, mining and quarrying, retail and hotels, and non-tradeable
construction, transport, communications, real estate and financial intermediation.
23
Chart 17: FDI stocks per activity, 2014
Source: National central banks.
What can the region do to attract higher levels of FDI? One way is to offer fiscal incentives to
investors. In the Western Balkans these are usually part of a broader package of investment
incentives of each country, which are usually administered through national investment
promotion agencies. Common fiscal incentives include tax holidays, with either tax
exemptions or reductions under some conditions, concerning corporate income tax, VAT or
import/export duties, and tax loss carry forward exemptions. All of these countries have set
up economic zones, business parks, trade zones and other similar concepts, which offer tax
exemptions as one of the benefits, though not all of them are fully functional yet.
While incentives may have a role, the administrative capacity to implement them credibly
and consistently is often weak. For that reason, the focus should be on creating a simple,
reliable investment framework. In this respect, it is important to note that all Western Balkans
countries legally observe a level playing field between foreign and domestic companies. That
is, no country limits foreign ownership or requires government approval, except in the sectors
of special government attention like weaponry (and sometimes narcotics and media).
However, restrictions to foreign investments are mostly not as direct as the rules considering
ownership. The Heritage Foundation/Wall Street Journal Index of Economic Freedom
summarises information on areas where countries formally limit foreign investments.22
On a
scale of 0 to 100, where the maximum value represents a perfectly free country, Western
Balkans countries score 67.5 on average, while the European Union scores 80.9. Additionally,
problems often emerge not from the written laws but their implementation and enforcement,
which is much more difficult to measure.
22
The Index of Economic Freedom has been published by The Heritage Foundation and The Wall Street Journal
since 1995. It is composed of four pillars, each covering different areas: rule of law (property rights, freedom
from corruption), limited government (fiscal freedom, government spending), regulatory efficiency (business
freedom, labour freedom, monetary freedom) and open markets (trade freedom, investment freedom and
financial freedom). Investment freedom covers national treatment of foreign investment and pre-screening,
foreign investment code (in terms of regulations, bureaucracy and transparency), restrictions on land ownership,
sectoral investment restrictions, expropriation of investments without fair compensation, foreign exchange
controls and capital controls.
24
The other way for the region to enhance FDI is to cast the net wider in terms of source
countries. In this respect, the growing importance of the Gulf countries and China is
encouraging. A glance at the FDI for 2014 only shows that the United Arab Emirates has
become an important investor in several countries of the region, while China was among the
top seven investor countries in Serbia. The UAE’s high-profile “Belgrade waterfront” real
estate project in the Serbian capital is perhaps the most prominent example of this new-found
interest. Meanwhile, China’s involvement in the Western Balkans region has grown rapidly
in recent years and can be expected to lead to further investments as the new “Silk Road”
project (mentioned above) takes hold in the coming years.
Trade
All countries in the Western Balkans realise that sustainable growth must be built on an
improved export performance, rather than on cheap and plentiful supplies of foreign capital
and credit, much of which has gone into non-export-oriented sectors. But how realistic is it to
expect enhanced trade and export activity in the region in the coming years? In order to
answer this question it is important to understand that these countries currently trade less than
one would expect when one takes into account size, level of development and geographical
location.
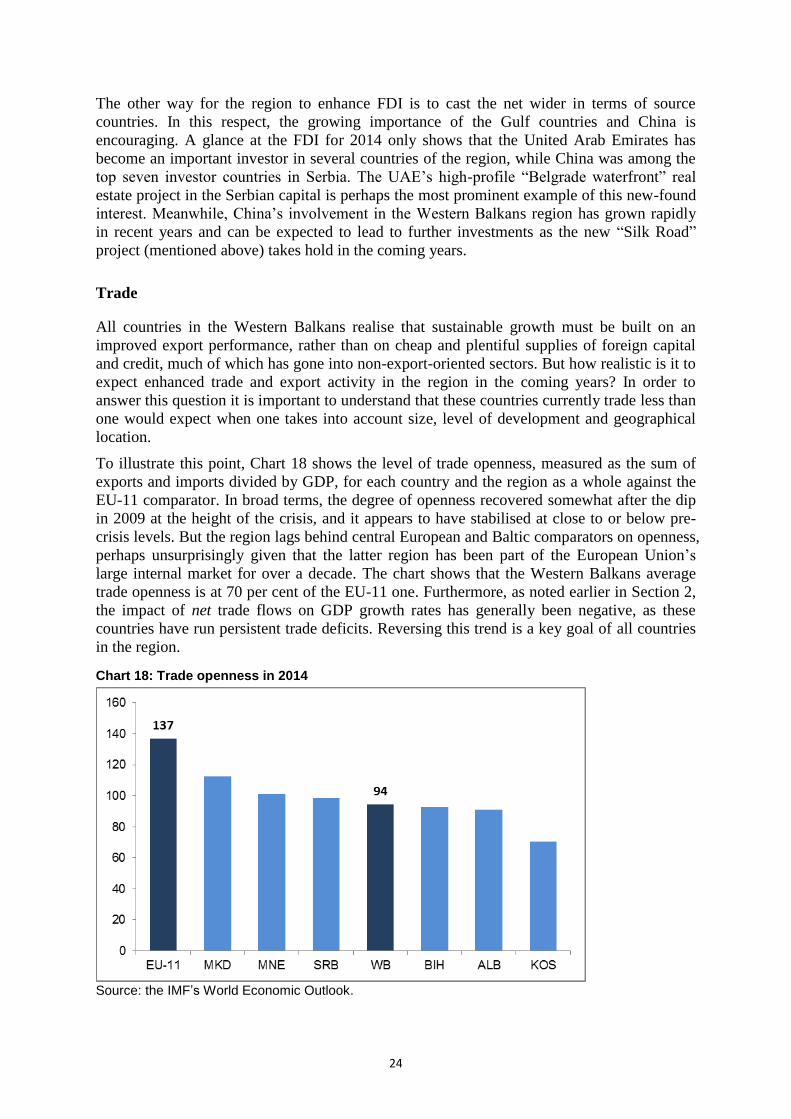
To illustrate this point, Chart 18 shows the level of trade openness, measured as the sum of
exports and imports divided by GDP, for each country and the region as a whole against the
EU-11 comparator. In broad terms, the degree of openness recovered somewhat after the dip
in 2009 at the height of the crisis, and it appears to have stabilised at close to or below pre-
crisis levels. But the region lags behind central European and Baltic comparators on openness,
perhaps unsurprisingly given that the latter region has been part of the European Union’s
large internal market for over a decade. The chart shows that the Western Balkans average
trade openness is at 70 per cent of the EU-11 one. Furthermore, as noted earlier in Section 2,
the impact of net trade flows on GDP growth rates has generally been negative, as these
countries have run persistent trade deficits. Reversing this trend is a key goal of all countries
in the region.
Chart 18: Trade openness in 2014
Source: the IMF’s World Economic Outlook.
25
Why is trade below potential? One reason is that it is a legacy of the break-up of Yugoslavia
and conflicts in the region in the 1990s, and the many years of neglect and under-investment
in infrastructure. But there are other related reasons associated with the product mix,
inadequate inclusion in the European Union and global value chains and the obstacles faced
by exporters.
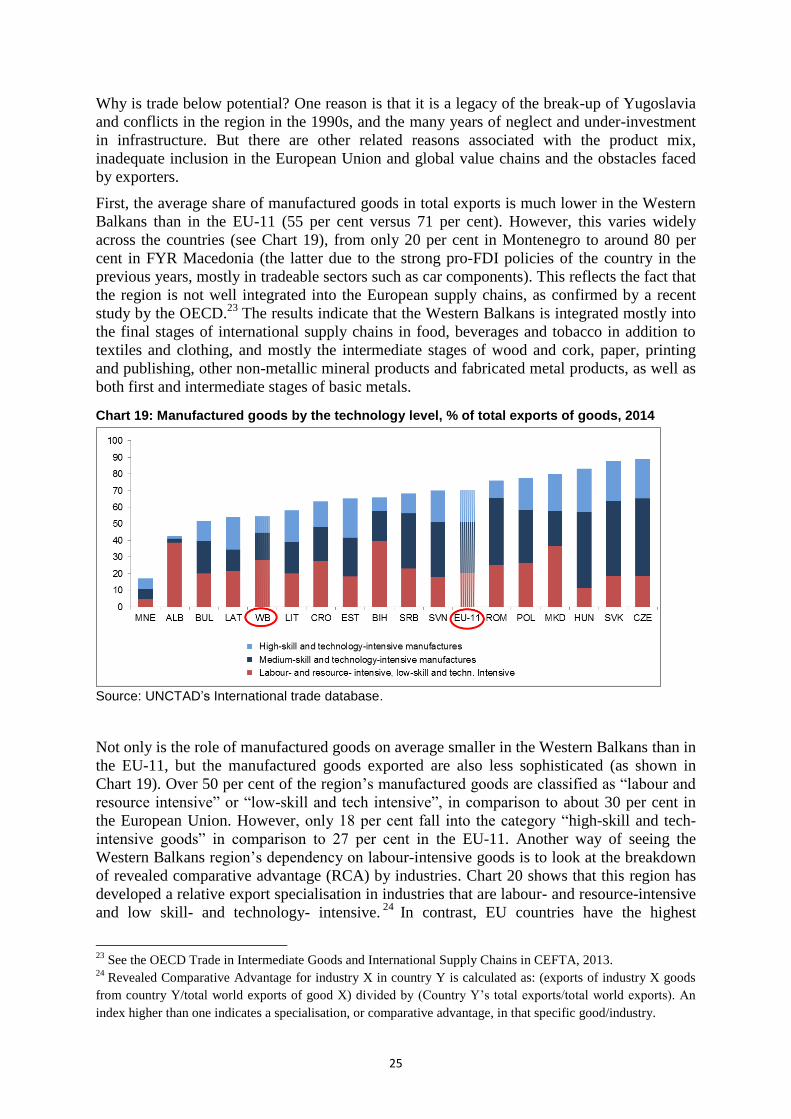
First, the average share of manufactured goods in total exports is much lower in the Western
Balkans than in the EU-11 (55 per cent versus 71 per cent). However, this varies widely
across the countries (see Chart 19), from only 20 per cent in Montenegro to around 80 per
cent in FYR Macedonia (the latter due to the strong pro-FDI policies of the country in the
previous years, mostly in tradeable sectors such as car components). This reflects the fact that
the region is not well integrated into the European supply chains, as confirmed by a recent
study by the OECD.23
The results indicate that the Western Balkans is integrated mostly into
the final stages of international supply chains in food, beverages and tobacco in addition to
textiles and clothing, and mostly the intermediate stages of wood and cork, paper, printing
and publishing, other non-metallic mineral products and fabricated metal products, as well as
both first and intermediate stages of basic metals.
Chart 19: Manufactured goods by the technology level, % of total exports of goods, 2014
Source: UNCTAD’s International trade database.
Not only is the role of manufactured goods on average smaller in the Western Balkans than in
the EU-11, but the manufactured goods exported are also less sophisticated (as shown in
Chart 19). Over 50 per cent of the region’s manufactured goods are classified as “labour and
resource intensive” or “low-skill and tech intensive”, in comparison to about 30 per cent in
the European Union. However, only 18 per cent fall into the category “high-skill and tech-
intensive goods” in comparison to 27 per cent in the EU-11. Another way of seeing the
Western Balkans region’s dependency on labour-intensive goods is to look at the breakdown
of revealed comparative advantage (RCA) by industries. Chart 20 shows that this region has
developed a relative export specialisation in industries that are labour- and resource-intensive
and low skill- and technology- intensive.24
In contrast, EU countries have the highest
23
See the OECD Trade in Intermediate Goods and International Supply Chains in CEFTA, 2013. 24
Revealed Comparative Advantage for industry X in country Y is calculated as: (exports of industry X goods
from country Y/total world exports of good X) divided by (Country Y’s total exports/total world exports). An
index higher than one indicates a specialisation, or comparative advantage, in that specific good/industry.

26
revealed comparative advantage in medium skill- and technology-intensive industries, and
are above the Western Balkans in terms of high skill- and technology-intensive industries. A
more detailed analysis by specific industries shows that the strong comparative advantages in
the region are in industries such as beverages and tobacco, food, clothes and raw materials.
Chart 20: Revealed comparative advantage in industries grouped by technology levels, 2014
Source:UNCTAD’s International trade database.
Second, exports in the Western Balkans typically face bigger obstacles to doing business than
those in comparator countries. To see this, we can use once again the World Bank’s Doing
Business report (see Charts 21 and 22). The main difference between this region and the EU-
11 lies in the cost to export, with costs in the Western Balkans countries more than double
that in the EU-11. Time to export is also longer although the differences are less pronounced.
Any improvement over time on these measures has been slow.
Chart 21: Cost to export, 2015 Chart 22: Time to export, 2015
Source: Doing Business, The World Bank.
Note: Kosovo is presented separately from other Western Balkans countries as it is a clear outlier on these indicators.
This analysis points to two areas where further progress is needed in order for trade to be a
major growth driver in the region. First, more needs to be done to tackle non-tariff barriers to
27
trade. Efforts in this direction are ongoing within the CEFTA agreement, to which all
countries in the region are signatories, but visible results on the problem areas would be a
welcome signal to traders and investors. Second, the region should step up its integration into
European (and regional) supply chains. Western Balkans countries now have an opportunity
to find their place on the map of global suppliers and reap the benefits. For this to happen,
though, these countries need to improve the quality of products and efficiency of processes
(especially logistics and delivery methods), but also be ready for constant improvements to
stay in the value chain. These enhancements are often fostered by higher levels of technology
transfer and diffusion (in terms of adopting new technologies and enhancing skills in the
workforce) among participating companies. As a result, firms participating in the global value
chains tend to be more innovative that those restricted to more local activities.25
Transport infrastructure
Good quality infrastructure is an important pre-condition for a region’s competitiveness and
economic development. Unfortunately, as anyone who travels around the Western Balkans
knows, the quality of transport infrastructure often leaves a lot to be desired. Years of neglect
and under-investment have left even major road and railway networks in a poor state. The
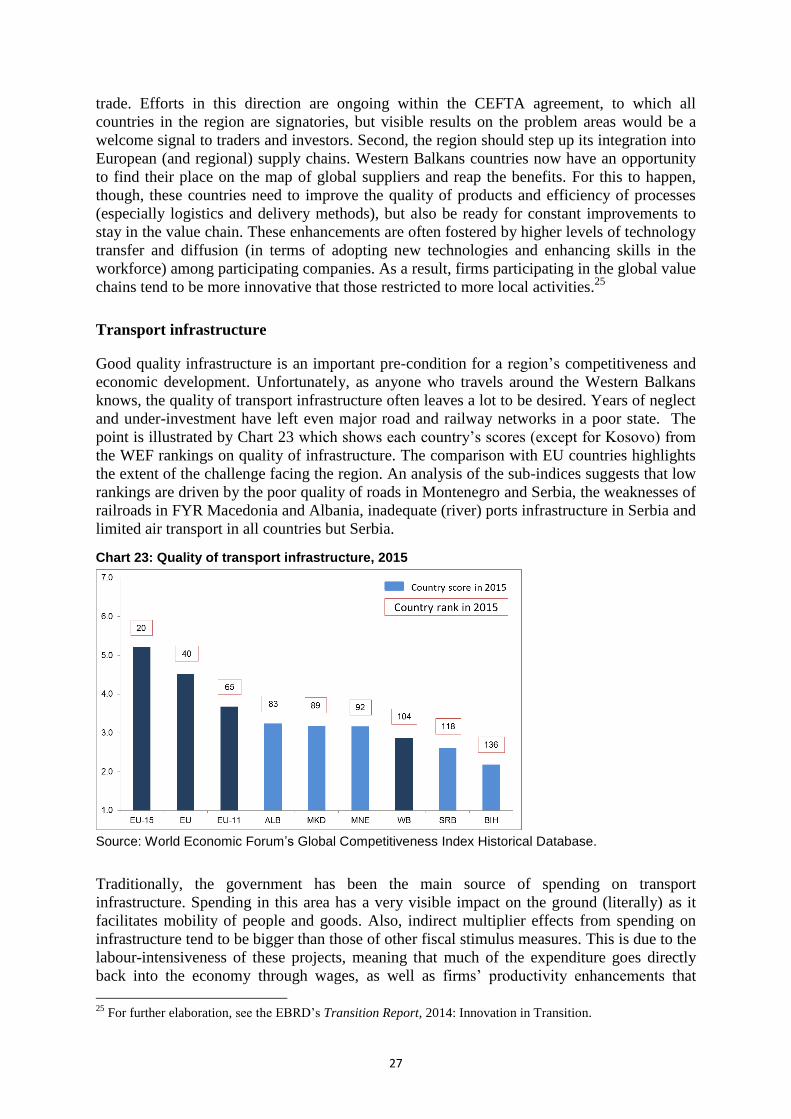
point is illustrated by Chart 23 which shows each country’s scores (except for Kosovo) from
the WEF rankings on quality of infrastructure. The comparison with EU countries highlights
the extent of the challenge facing the region. An analysis of the sub-indices suggests that low
rankings are driven by the poor quality of roads in Montenegro and Serbia, the weaknesses of
railroads in FYR Macedonia and Albania, inadequate (river) ports infrastructure in Serbia and
limited air transport in all countries but Serbia.
Chart 23: Quality of transport infrastructure, 2015
Source: World Economic Forum’s Global Competitiveness Index Historical Database.
Traditionally, the government has been the main source of spending on transport
infrastructure. Spending in this area has a very visible impact on the ground (literally) as it
facilitates mobility of people and goods. Also, indirect multiplier effects from spending on
infrastructure tend to be bigger than those of other fiscal stimulus measures. This is due to the
labour-intensiveness of these projects, meaning that much of the expenditure goes directly
back into the economy through wages, as well as firms’ productivity enhancements that
25
For further elaboration, see the EBRD’s Transition Report, 2014: Innovation in Transition.
28
benefit from improved transport links. This is why increased infrastructure spending is also a
desirable policy option for governments searching for ways to boost overall GDP growth.
According to current National Economic Programmes, all Western Balkans countries except
Kosovo plan to have higher public capital spending in the next two years in comparison to the
previous two years. But in order for the benefits to be realised, there are three important pre-
conditions: institutional capacity, regional coordination and appropriate form of funding.
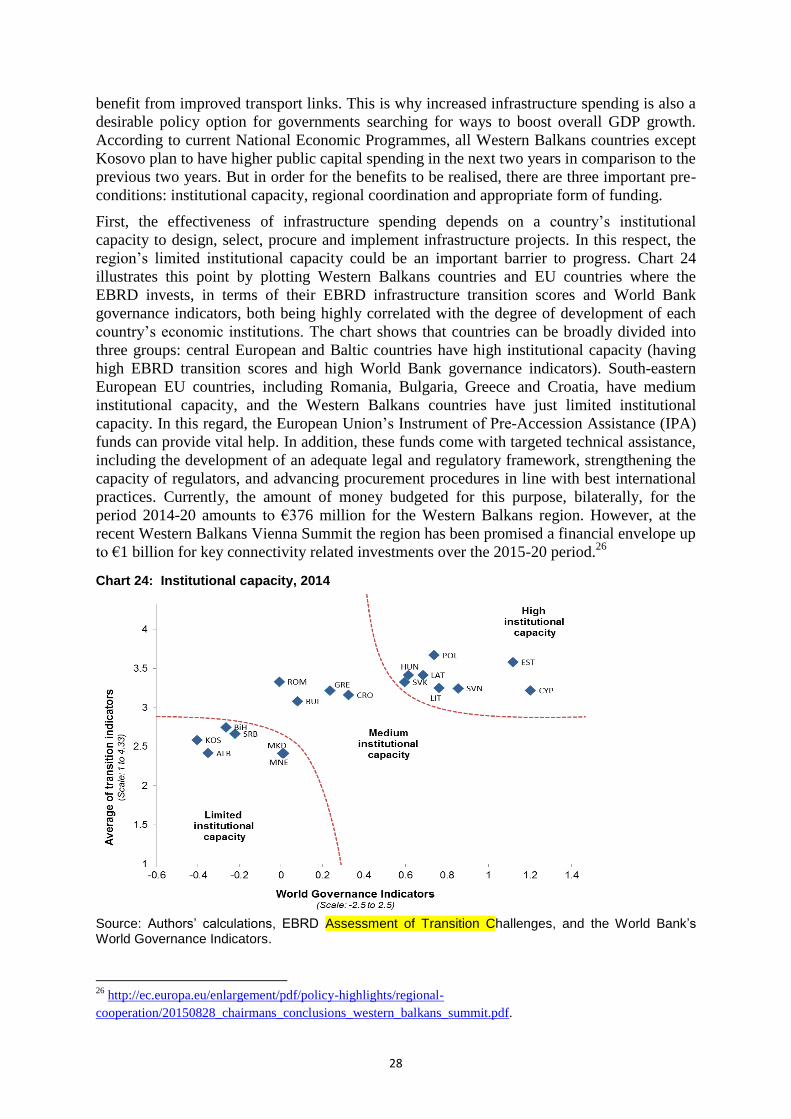
First, the effectiveness of infrastructure spending depends on a country’s institutional
capacity to design, select, procure and implement infrastructure projects. In this respect, the
region’s limited institutional capacity could be an important barrier to progress. Chart 24
illustrates this point by plotting Western Balkans countries and EU countries where the
EBRD invests, in terms of their EBRD infrastructure transition scores and World Bank
governance indicators, both being highly correlated with the degree of development of each
country’s economic institutions. The chart shows that countries can be broadly divided into
three groups: central European and Baltic countries have high institutional capacity (having
high EBRD transition scores and high World Bank governance indicators). South-eastern
European EU countries, including Romania, Bulgaria, Greece and Croatia, have medium
institutional capacity, and the Western Balkans countries have just limited institutional
capacity. In this regard, the European Union’s Instrument of Pre-Accession Assistance (IPA)
funds can provide vital help. In addition, these funds come with targeted technical assistance,
including the development of an adequate legal and regulatory framework, strengthening the
capacity of regulators, and advancing procurement procedures in line with best international
practices. Currently, the amount of money budgeted for this purpose, bilaterally, for the
period 2014-20 amounts to €376 million for the Western Balkans region. However, at the
recent Western Balkans Vienna Summit the region has been promised a financial envelope up
to €1 billion for key connectivity related investments over the 2015-20 period.26
Chart 24: Institutional capacity, 2014
Source: Authors’ calculations, EBRD Assessment of Transition Challenges, and the World Bank’s World Governance Indicators.
26
http://ec.europa.eu/enlargement/pdf/policy-highlights/regional-
cooperation/20150828_chairmans_conclusions_western_balkans_summit.pdf.
29
Second, to make full use of the assistance available, close regional cooperation and
coordination are required. The Western Balkans region has in recent years achieved notable
progress in this respect. The main platform for regional cooperation on the transport
connectivity agenda is the South East Europe Transport Observatory (SEETO), the regional
transport organisation established in 2004 for the development of the Core Regional
Transport Network.27
The main aims of SEETO are to promote regional cooperation
regarding the extension of the Trans-European Transport Network to the Western Balkans,
improve and harmonise regional transport policies and technical standards and enhance local
capacity for the implementation of investment programmes. SEETO’s Flagship Axes
Initiative identifies physical and non-physical barriers for selected corridors/routes from the
SEETO Comprehensive Network, and the development and analysis of plausible remedial
measures for reducing travel times and transport costs. From those measures, implementation
should be sought for those with the highest cost-benefit ratio.
Third, financing for these projects must be found. Earlier we highlighted the severe fiscal
constraints facing the region. It would therefore benefit the region to explore private sector
participation in the provision of new infrastructure. However, so far there have been no
successful public-private partnerships (PPPs) in the road or railway sectors. Several projects
have been attempted, most recently in Bosnia and Herzegovina, but efforts so far have been
unsuccessful. The reasons for failure are complex, but in essence boil down to the inability to
reconcile the limited risk appetite of private investors with the capacities of governments in
the region to make credible, long-term commitments. For this reason, it will be important in
the coming period to explore innovative ways in which donors and international financial
institutions could mitigate the risks to private sector investors. One way is perhaps through
some sort of guarantee fund that would back governments’ commitments to private investors
without unduly burdening the budget or increasing the stock of government debt (including
contingent debt liabilities).
China is also playing a major role, and one that will only increase in the coming years, in
developing transport infrastructure in the region. In the roads sector, the Chinese are
financing three major road projects with a combined amount of approximately €2 billion in
Montenegro, Bosnia and Herzegovina and FYR Macedonia. In railways, modernisation
across the region, such as the €1.5 billion high-speed railway between Belgrade and Budapest,
is part of the overall Balkan Silk Road plan discussed earlier. This would not only provide
infrastructure to transport Chinese manufactured goods to Europe, but would also improve
regional connectivity.
Energy sector
Similarly to transport, the energy sector in the Western Balkans has been plagued for many
years by under-investment, poor management and a non-commercial approach to operations.
The combined picture from WEF rankings and the EBRD’s energy sector transition scores
paint a similar picture to those from transport, pointing to a significant gap with respect to
central European countries.
The ownership of the electricity system is almost entirely in state hands in all countries. But
numerous initiatives and projects are under way or in preparation that, taken together, have
the capacity to transform the region’s energy supply and foster economic growth.
Modernisation of the existing energy infrastructure and the building of new energy facilities,
along with an increased inclusion of renewable energy sources (RES), as private sector
27
www.seetoint.org.
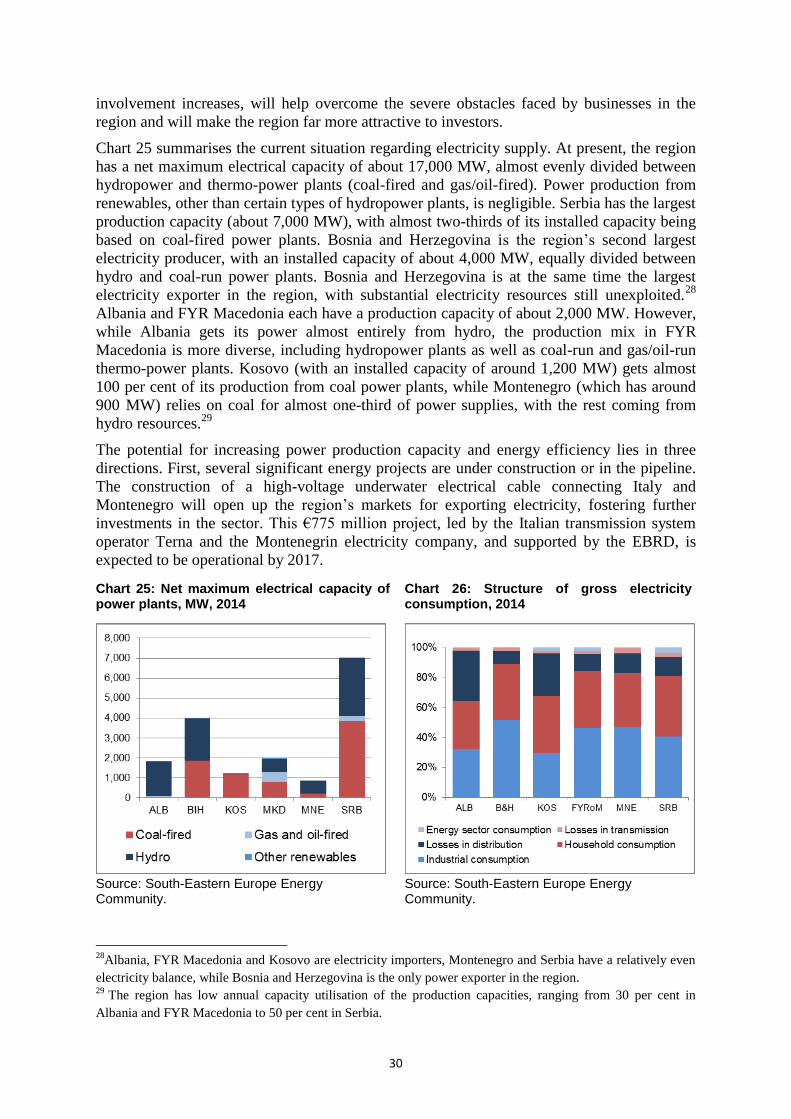
30
involvement increases, will help overcome the severe obstacles faced by businesses in the
region and will make the region far more attractive to investors.
Chart 25 summarises the current situation regarding electricity supply. At present, the region
has a net maximum electrical capacity of about 17,000 MW, almost evenly divided between
hydropower and thermo-power plants (coal-fired and gas/oil-fired). Power production from
renewables, other than certain types of hydropower plants, is negligible. Serbia has the largest
production capacity (about 7,000 MW), with almost two-thirds of its installed capacity being
based on coal-fired power plants. Bosnia and Herzegovina is the region’s second largest
electricity producer, with an installed capacity of about 4,000 MW, equally divided between
hydro and coal-run power plants. Bosnia and Herzegovina is at the same time the largest
electricity exporter in the region, with substantial electricity resources still unexploited.28
Albania and FYR Macedonia each have a production capacity of about 2,000 MW. However,
while Albania gets its power almost entirely from hydro, the production mix in FYR
Macedonia is more diverse, including hydropower plants as well as coal-run and gas/oil-run
thermo-power plants. Kosovo (with an installed capacity of around 1,200 MW) gets almost
100 per cent of its production from coal power plants, while Montenegro (which has around
900 MW) relies on coal for almost one-third of power supplies, with the rest coming from
hydro resources.29
The potential for increasing power production capacity and energy efficiency lies in three
directions. First, several significant energy projects are under construction or in the pipeline.
The construction of a high-voltage underwater electrical cable connecting Italy and
Montenegro will open up the region’s markets for exporting electricity, fostering further
investments in the sector. This €775 million project, led by the Italian transmission system
operator Terna and the Montenegrin electricity company, and supported by the EBRD, is
expected to be operational by 2017.
Chart 25: Net maximum electrical capacity of power plants, MW, 2014
Chart 26: Structure of gross electricity consumption, 2014
Source: South-Eastern Europe Energy Community.
Source: South-Eastern Europe Energy Community.
28
Albania, FYR Macedonia and Kosovo are electricity importers, Montenegro and Serbia have a relatively even
electricity balance, while Bosnia and Herzegovina is the only power exporter in the region. 29
The region has low annual capacity utilisation of the production capacities, ranging from 30 per cent in
Albania and FYR Macedonia to 50 per cent in Serbia.
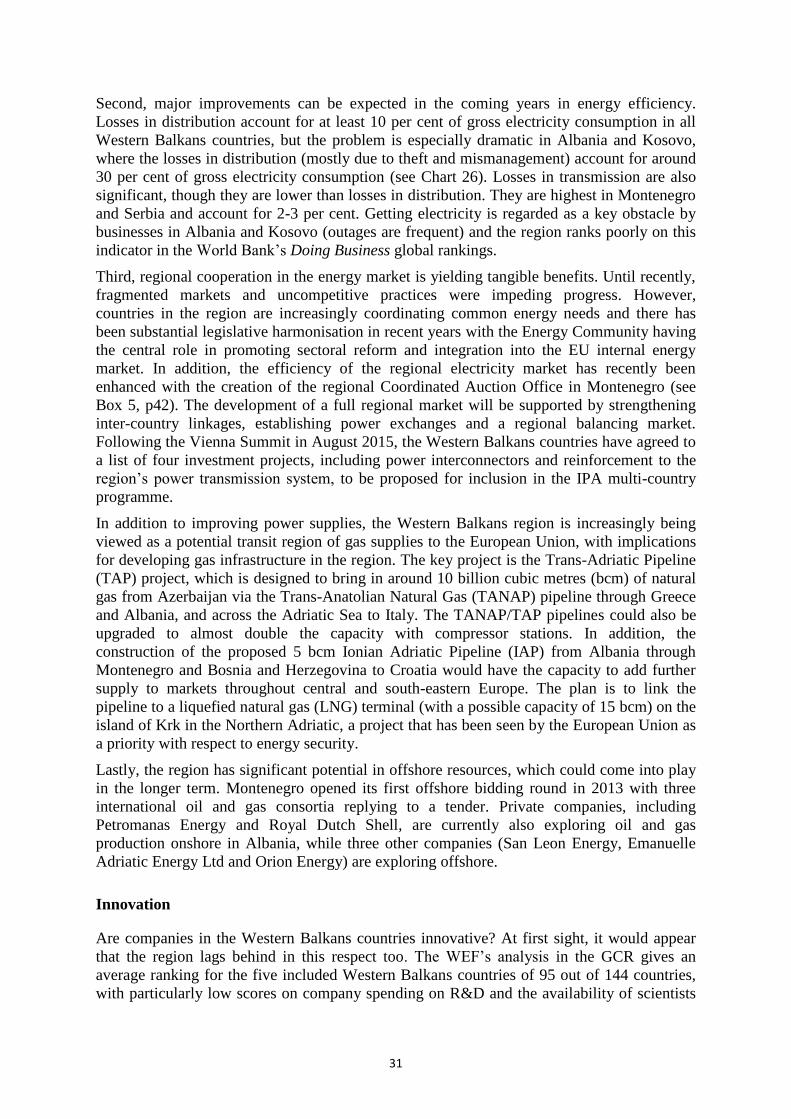
31
Second, major improvements can be expected in the coming years in energy efficiency.
Losses in distribution account for at least 10 per cent of gross electricity consumption in all
Western Balkans countries, but the problem is especially dramatic in Albania and Kosovo,
where the losses in distribution (mostly due to theft and mismanagement) account for around
30 per cent of gross electricity consumption (see Chart 26). Losses in transmission are also
significant, though they are lower than losses in distribution. They are highest in Montenegro
and Serbia and account for 2-3 per cent. Getting electricity is regarded as a key obstacle by
businesses in Albania and Kosovo (outages are frequent) and the region ranks poorly on this
indicator in the World Bank’s Doing Business global rankings.
Third, regional cooperation in the energy market is yielding tangible benefits. Until recently,
fragmented markets and uncompetitive practices were impeding progress. However,
countries in the region are increasingly coordinating common energy needs and there has
been substantial legislative harmonisation in recent years with the Energy Community having
the central role in promoting sectoral reform and integration into the EU internal energy
market. In addition, the efficiency of the regional electricity market has recently been
enhanced with the creation of the regional Coordinated Auction Office in Montenegro (see
Box 5, p42). The development of a full regional market will be supported by strengthening
inter-country linkages, establishing power exchanges and a regional balancing market.
Following the Vienna Summit in August 2015, the Western Balkans countries have agreed to
a list of four investment projects, including power interconnectors and reinforcement to the
region’s power transmission system, to be proposed for inclusion in the IPA multi-country
programme.
In addition to improving power supplies, the Western Balkans region is increasingly being
viewed as a potential transit region of gas supplies to the European Union, with implications
for developing gas infrastructure in the region. The key project is the Trans-Adriatic Pipeline
(TAP) project, which is designed to bring in around 10 billion cubic metres (bcm) of natural
gas from Azerbaijan via the Trans-Anatolian Natural Gas (TANAP) pipeline through Greece
and Albania, and across the Adriatic Sea to Italy. The TANAP/TAP pipelines could also be
upgraded to almost double the capacity with compressor stations. In addition, the
construction of the proposed 5 bcm Ionian Adriatic Pipeline (IAP) from Albania through
Montenegro and Bosnia and Herzegovina to Croatia would have the capacity to add further
supply to markets throughout central and south-eastern Europe. The plan is to link the
pipeline to a liquefied natural gas (LNG) terminal (with a possible capacity of 15 bcm) on the
island of Krk in the Northern Adriatic, a project that has been seen by the European Union as
a priority with respect to energy security.
Lastly, the region has significant potential in offshore resources, which could come into play
in the longer term. Montenegro opened its first offshore bidding round in 2013 with three
international oil and gas consortia replying to a tender. Private companies, including
Petromanas Energy and Royal Dutch Shell, are currently also exploring oil and gas
production onshore in Albania, while three other companies (San Leon Energy, Emanuelle
Adriatic Energy Ltd and Orion Energy) are exploring offshore.
Innovation
Are companies in the Western Balkans countries innovative? At first sight, it would appear
that the region lags behind in this respect too. The WEF’s analysis in the GCR gives an
average ranking for the five included Western Balkans countries of 95 out of 144 countries,
with particularly low scores on company spending on R&D and the availability of scientists
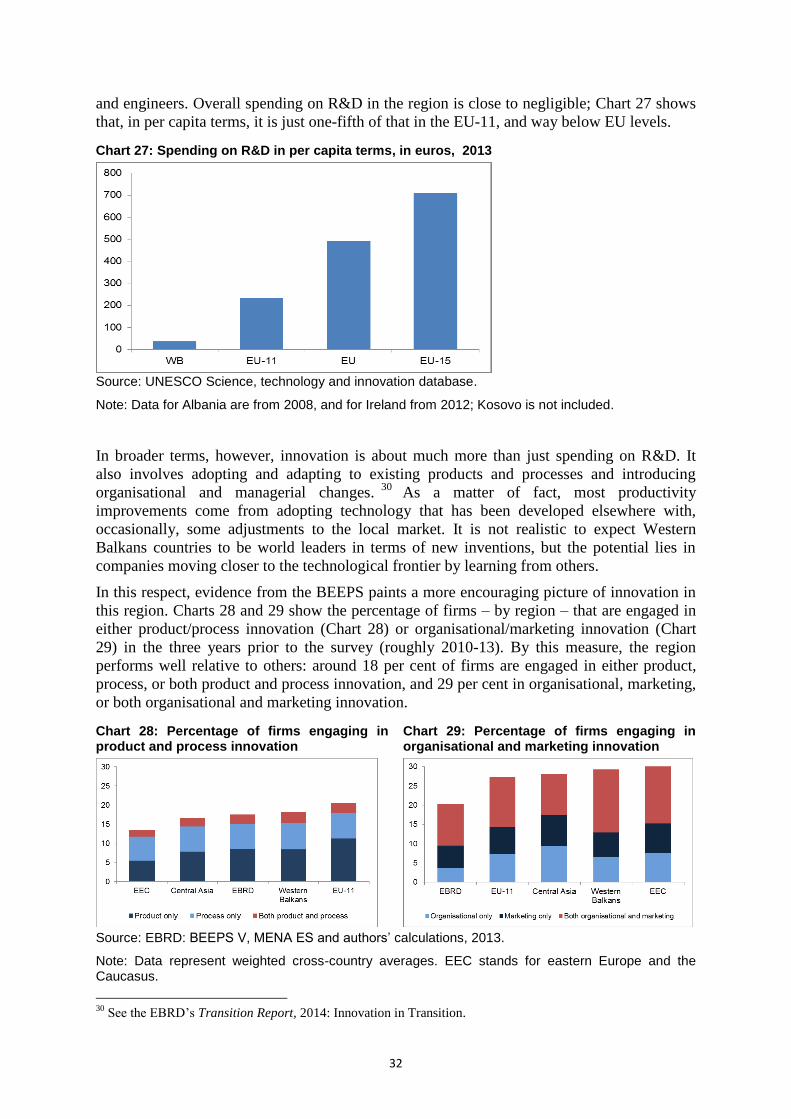
32
and engineers. Overall spending on R&D in the region is close to negligible; Chart 27 shows
that, in per capita terms, it is just one-fifth of that in the EU-11, and way below EU levels.
Chart 27: Spending on R&D in per capita terms, in euros, 2013
Source: UNESCO Science, technology and innovation database.
Note: Data for Albania are from 2008, and for Ireland from 2012; Kosovo is not included.
In broader terms, however, innovation is about much more than just spending on R&D. It
also involves adopting and adapting to existing products and processes and introducing
organisational and managerial changes.30
As a matter of fact, most productivity
improvements come from adopting technology that has been developed elsewhere with,
occasionally, some adjustments to the local market. It is not realistic to expect Western
Balkans countries to be world leaders in terms of new inventions, but the potential lies in
companies moving closer to the technological frontier by learning from others.
In this respect, evidence from the BEEPS paints a more encouraging picture of innovation in
this region. Charts 28 and 29 show the percentage of firms – by region – that are engaged in
either product/process innovation (Chart 28) or organisational/marketing innovation (Chart
29) in the three years prior to the survey (roughly 2010-13). By this measure, the region
performs well relative to others: around 18 per cent of firms are engaged in either product,
process, or both product and process innovation, and 29 per cent in organisational, marketing,
or both organisational and marketing innovation.
Chart 28: Percentage of firms engaging in product and process innovation
Chart 29: Percentage of firms engaging in organisational and marketing innovation
Source: EBRD: BEEPS V, MENA ES and authors’ calculations, 2013.
Note: Data represent weighted cross-country averages. EEC stands for eastern Europe and the Caucasus.
30
See the EBRD’s Transition Report, 2014: Innovation in Transition.
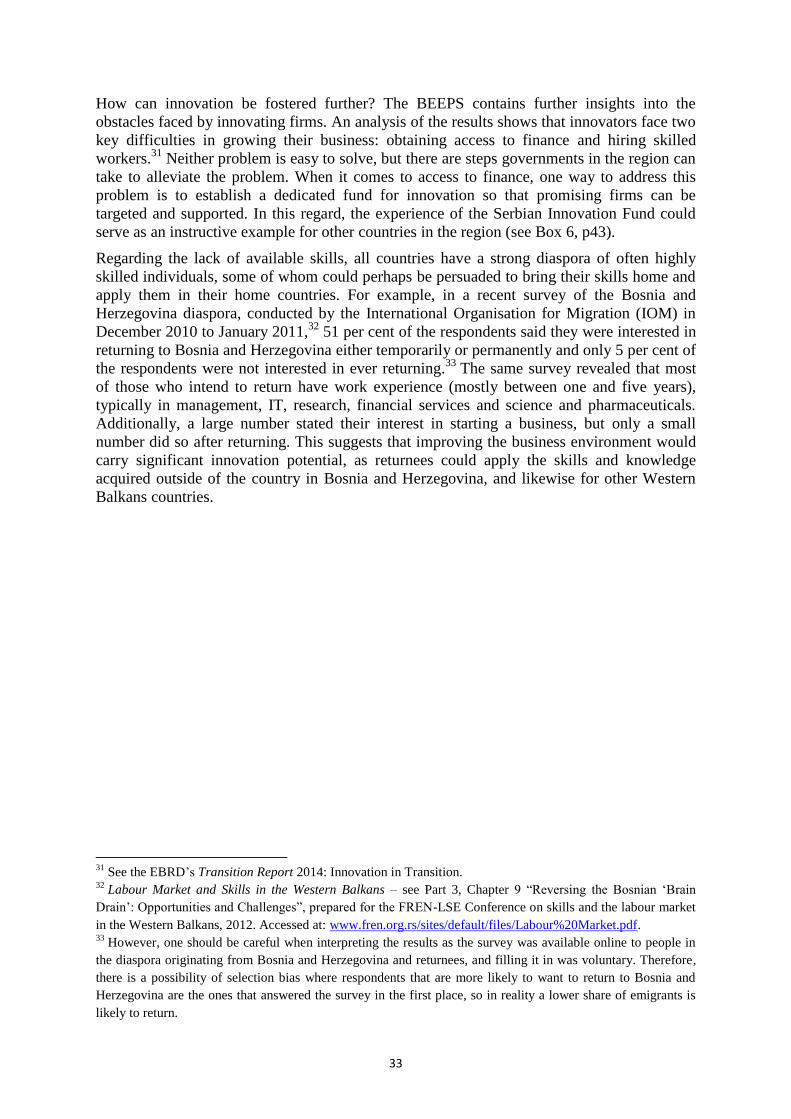
33
How can innovation be fostered further? The BEEPS contains further insights into the
obstacles faced by innovating firms. An analysis of the results shows that innovators face two
key difficulties in growing their business: obtaining access to finance and hiring skilled
workers.31
Neither problem is easy to solve, but there are steps governments in the region can
take to alleviate the problem. When it comes to access to finance, one way to address this
problem is to establish a dedicated fund for innovation so that promising firms can be
targeted and supported. In this regard, the experience of the Serbian Innovation Fund could
serve as an instructive example for other countries in the region (see Box 6, p43).
Regarding the lack of available skills, all countries have a strong diaspora of often highly
skilled individuals, some of whom could perhaps be persuaded to bring their skills home and
apply them in their home countries. For example, in a recent survey of the Bosnia and
Herzegovina diaspora, conducted by the International Organisation for Migration (IOM) in
December 2010 to January 2011,32
51 per cent of the respondents said they were interested in
returning to Bosnia and Herzegovina either temporarily or permanently and only 5 per cent of
the respondents were not interested in ever returning.33
The same survey revealed that most
of those who intend to return have work experience (mostly between one and five years),
typically in management, IT, research, financial services and science and pharmaceuticals.
Additionally, a large number stated their interest in starting a business, but only a small
number did so after returning. This suggests that improving the business environment would
carry significant innovation potential, as returnees could apply the skills and knowledge
acquired outside of the country in Bosnia and Herzegovina, and likewise for other Western
Balkans countries.
31
See the EBRD’s Transition Report 2014: Innovation in Transition. 32
Labour Market and Skills in the Western Balkans – see Part 3, Chapter 9 “Reversing the Bosnian ‘Brain
Drain’: Opportunities and Challenges”, prepared for the FREN-LSE Conference on skills and the labour market
in the Western Balkans, 2012. Accessed at: www.fren.org.rs/sites/default/files/Labour%20Market.pdf. 33
However, one should be careful when interpreting the results as the survey was available online to people in
the diaspora originating from Bosnia and Herzegovina and returnees, and filling it in was voluntary. Therefore,
there is a possibility of selection bias where respondents that are more likely to want to return to Bosnia and
Herzegovina are the ones that answered the survey in the first place, so in reality a lower share of emigrants is
likely to return.
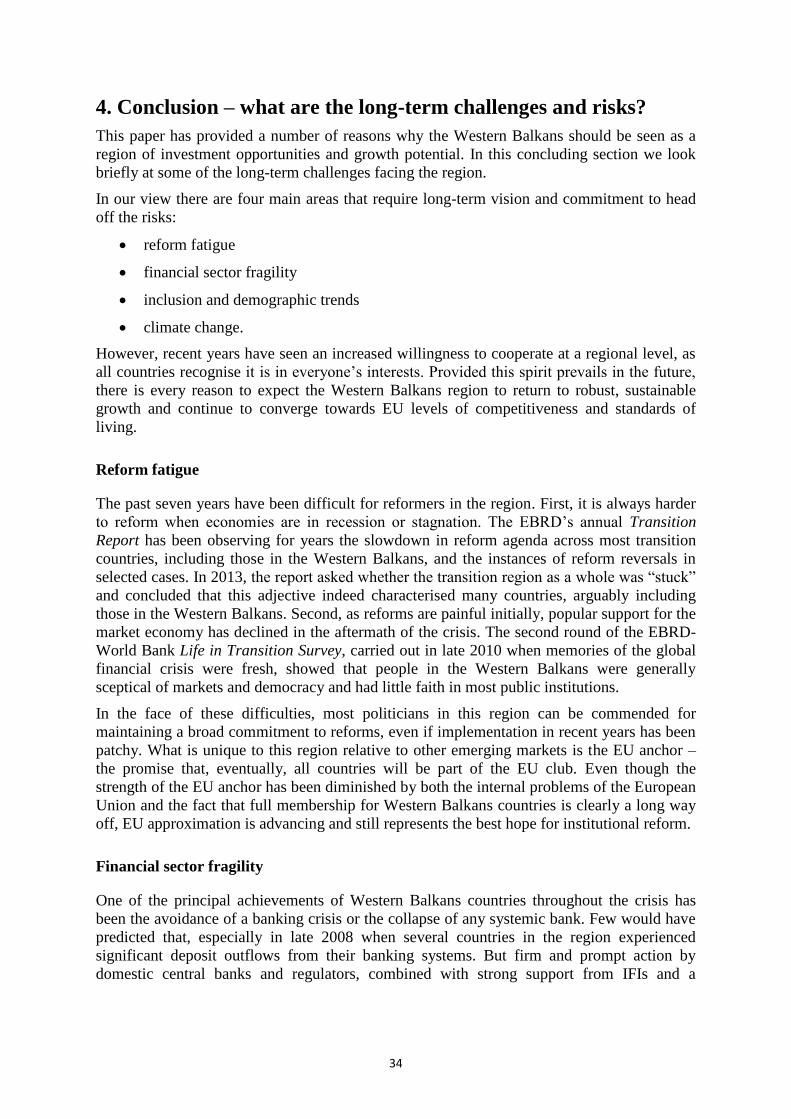
34
4. Conclusion – what are the long-term challenges and risks?
This paper has provided a number of reasons why the Western Balkans should be seen as a
region of investment opportunities and growth potential. In this concluding section we look
briefly at some of the long-term challenges facing the region.
In our view there are four main areas that require long-term vision and commitment to head
off the risks:
reform fatigue
financial sector fragility
inclusion and demographic trends
climate change.
However, recent years have seen an increased willingness to cooperate at a regional level, as
all countries recognise it is in everyone’s interests. Provided this spirit prevails in the future,
there is every reason to expect the Western Balkans region to return to robust, sustainable
growth and continue to converge towards EU levels of competitiveness and standards of
living.
Reform fatigue
The past seven years have been difficult for reformers in the region. First, it is always harder
to reform when economies are in recession or stagnation. The EBRD’s annual Transition
Report has been observing for years the slowdown in reform agenda across most transition
countries, including those in the Western Balkans, and the instances of reform reversals in
selected cases. In 2013, the report asked whether the transition region as a whole was “stuck”
and concluded that this adjective indeed characterised many countries, arguably including
those in the Western Balkans. Second, as reforms are painful initially, popular support for the
market economy has declined in the aftermath of the crisis. The second round of the EBRD-
World Bank Life in Transition Survey, carried out in late 2010 when memories of the global
financial crisis were fresh, showed that people in the Western Balkans were generally
sceptical of markets and democracy and had little faith in most public institutions.
In the face of these difficulties, most politicians in this region can be commended for
maintaining a broad commitment to reforms, even if implementation in recent years has been
patchy. What is unique to this region relative to other emerging markets is the EU anchor –
the promise that, eventually, all countries will be part of the EU club. Even though the
strength of the EU anchor has been diminished by both the internal problems of the European
Union and the fact that full membership for Western Balkans countries is clearly a long way
off, EU approximation is advancing and still represents the best hope for institutional reform.
Financial sector fragility
One of the principal achievements of Western Balkans countries throughout the crisis has
been the avoidance of a banking crisis or the collapse of any systemic bank. Few would have
predicted that, especially in late 2008 when several countries in the region experienced
significant deposit outflows from their banking systems. But firm and prompt action by
domestic central banks and regulators, combined with strong support from IFIs and a
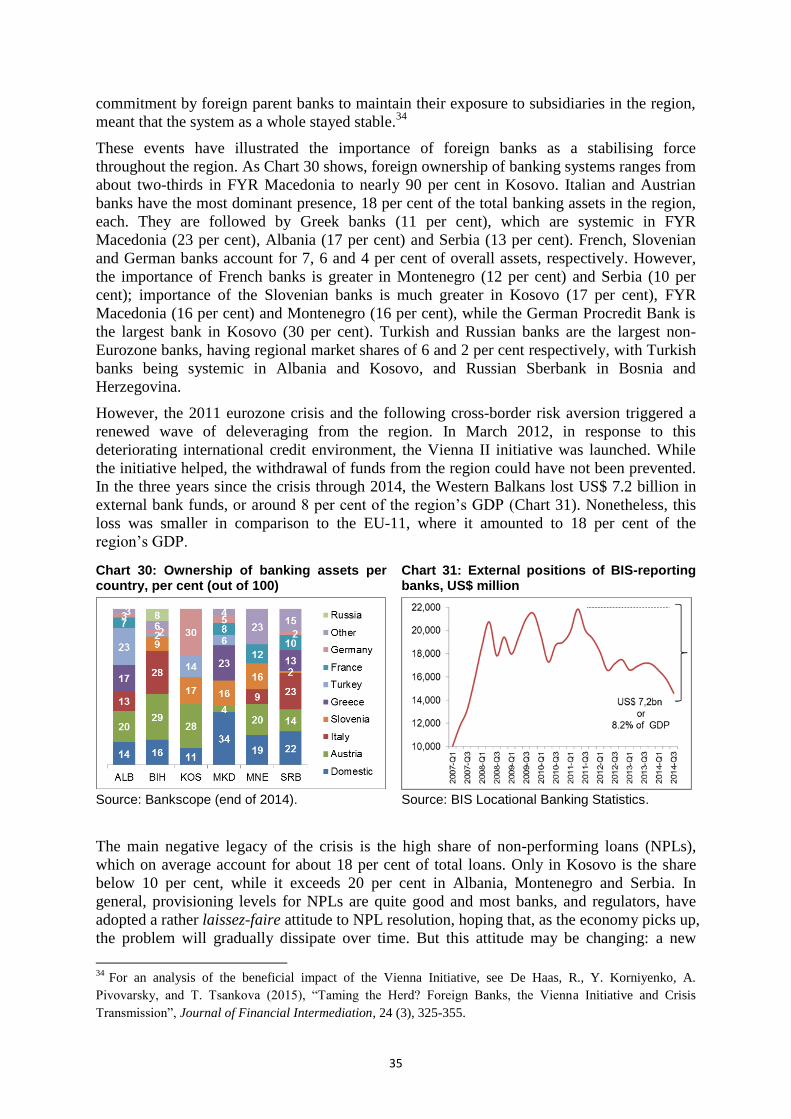
35
commitment by foreign parent banks to maintain their exposure to subsidiaries in the region,
meant that the system as a whole stayed stable.34
These events have illustrated the importance of foreign banks as a stabilising force
throughout the region. As Chart 30 shows, foreign ownership of banking systems ranges from
about two-thirds in FYR Macedonia to nearly 90 per cent in Kosovo. Italian and Austrian
banks have the most dominant presence, 18 per cent of the total banking assets in the region,
each. They are followed by Greek banks (11 per cent), which are systemic in FYR
Macedonia (23 per cent), Albania (17 per cent) and Serbia (13 per cent). French, Slovenian
and German banks account for 7, 6 and 4 per cent of overall assets, respectively. However,
the importance of French banks is greater in Montenegro (12 per cent) and Serbia (10 per
cent); importance of the Slovenian banks is much greater in Kosovo (17 per cent), FYR
Macedonia (16 per cent) and Montenegro (16 per cent), while the German Procredit Bank is
the largest bank in Kosovo (30 per cent). Turkish and Russian banks are the largest non-
Eurozone banks, having regional market shares of 6 and 2 per cent respectively, with Turkish
banks being systemic in Albania and Kosovo, and Russian Sberbank in Bosnia and
Herzegovina.
However, the 2011 eurozone crisis and the following cross-border risk aversion triggered a
renewed wave of deleveraging from the region. In March 2012, in response to this
deteriorating international credit environment, the Vienna II initiative was launched. While
the initiative helped, the withdrawal of funds from the region could have not been prevented.
In the three years since the crisis through 2014, the Western Balkans lost US$ 7.2 billion in
external bank funds, or around 8 per cent of the region’s GDP (Chart 31). Nonetheless, this
loss was smaller in comparison to the EU-11, where it amounted to 18 per cent of the
region’s GDP.
Chart 30: Ownership of banking assets per country, per cent (out of 100)
Chart 31: External positions of BIS-reporting banks, US$ million
Source: Bankscope (end of 2014). Source: BIS Locational Banking Statistics.
The main negative legacy of the crisis is the high share of non-performing loans (NPLs),
which on average account for about 18 per cent of total loans. Only in Kosovo is the share
below 10 per cent, while it exceeds 20 per cent in Albania, Montenegro and Serbia. In
general, provisioning levels for NPLs are quite good and most banks, and regulators, have
adopted a rather laissez-faire attitude to NPL resolution, hoping that, as the economy picks up,
the problem will gradually dissipate over time. But this attitude may be changing: a new
34
For an analysis of the beneficial impact of the Vienna Initiative, see De Haas, R., Y. Korniyenko, A.
Pivovarsky, and T. Tsankova (2015), “Taming the Herd? Foreign Banks, the Vienna Initiative and Crisis
Transmission”, Journal of Financial Intermediation, 24 (3), 325-355.
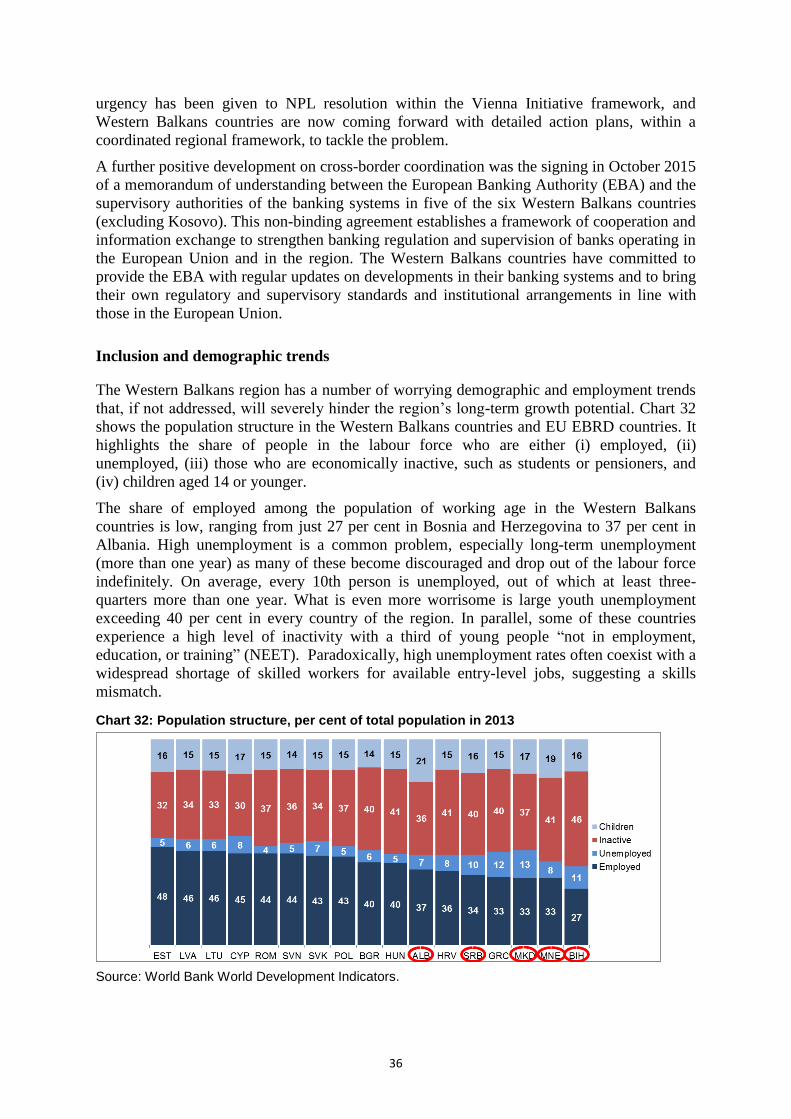
36
urgency has been given to NPL resolution within the Vienna Initiative framework, and
Western Balkans countries are now coming forward with detailed action plans, within a
coordinated regional framework, to tackle the problem.
A further positive development on cross-border coordination was the signing in October 2015
of a memorandum of understanding between the European Banking Authority (EBA) and the
supervisory authorities of the banking systems in five of the six Western Balkans countries
(excluding Kosovo). This non-binding agreement establishes a framework of cooperation and
information exchange to strengthen banking regulation and supervision of banks operating in
the European Union and in the region. The Western Balkans countries have committed to
provide the EBA with regular updates on developments in their banking systems and to bring
their own regulatory and supervisory standards and institutional arrangements in line with
those in the European Union.
Inclusion and demographic trends
The Western Balkans region has a number of worrying demographic and employment trends
that, if not addressed, will severely hinder the region’s long-term growth potential. Chart 32
shows the population structure in the Western Balkans countries and EU EBRD countries. It
highlights the share of people in the labour force who are either (i) employed, (ii)
unemployed, (iii) those who are economically inactive, such as students or pensioners, and
(iv) children aged 14 or younger.
The share of employed among the population of working age in the Western Balkans
countries is low, ranging from just 27 per cent in Bosnia and Herzegovina to 37 per cent in
Albania. High unemployment is a common problem, especially long-term unemployment
(more than one year) as many of these become discouraged and drop out of the labour force
indefinitely. On average, every 10th person is unemployed, out of which at least three-
quarters more than one year. What is even more worrisome is large youth unemployment
exceeding 40 per cent in every country of the region. In parallel, some of these countries
experience a high level of inactivity with a third of young people “not in employment,
education, or training” (NEET). Paradoxically, high unemployment rates often coexist with a
widespread shortage of skilled workers for available entry-level jobs, suggesting a skills
mismatch.
Chart 32: Population structure, per cent of total population in 2013
Source: World Bank World Development Indicators.
Source: World Development Indicators
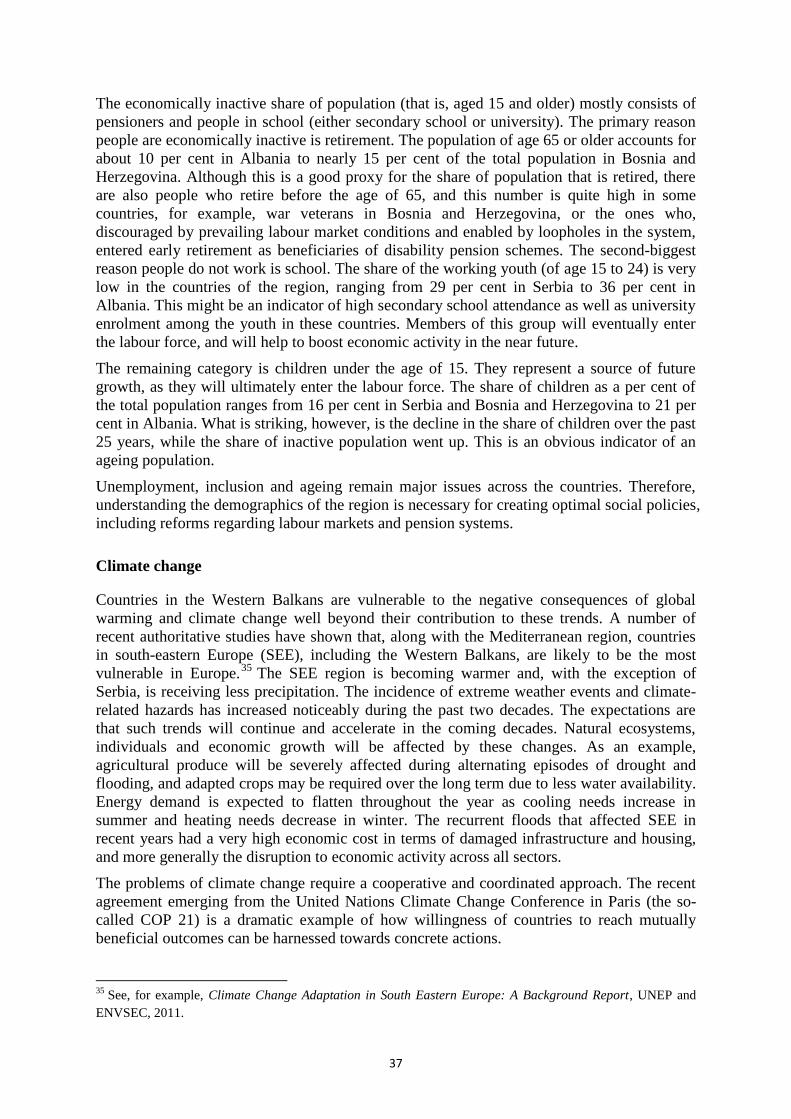
37
The economically inactive share of population (that is, aged 15 and older) mostly consists of
pensioners and people in school (either secondary school or university). The primary reason
people are economically inactive is retirement. The population of age 65 or older accounts for
about 10 per cent in Albania to nearly 15 per cent of the total population in Bosnia and
Herzegovina. Although this is a good proxy for the share of population that is retired, there
are also people who retire before the age of 65, and this number is quite high in some
countries, for example, war veterans in Bosnia and Herzegovina, or the ones who,
discouraged by prevailing labour market conditions and enabled by loopholes in the system,
entered early retirement as beneficiaries of disability pension schemes. The second-biggest
reason people do not work is school. The share of the working youth (of age 15 to 24) is very
low in the countries of the region, ranging from 29 per cent in Serbia to 36 per cent in
Albania. This might be an indicator of high secondary school attendance as well as university
enrolment among the youth in these countries. Members of this group will eventually enter
the labour force, and will help to boost economic activity in the near future.
The remaining category is children under the age of 15. They represent a source of future
growth, as they will ultimately enter the labour force. The share of children as a per cent of
the total population ranges from 16 per cent in Serbia and Bosnia and Herzegovina to 21 per
cent in Albania. What is striking, however, is the decline in the share of children over the past
25 years, while the share of inactive population went up. This is an obvious indicator of an
ageing population.
Unemployment, inclusion and ageing remain major issues across the countries. Therefore,
understanding the demographics of the region is necessary for creating optimal social policies,
including reforms regarding labour markets and pension systems.
Climate change
Countries in the Western Balkans are vulnerable to the negative consequences of global
warming and climate change well beyond their contribution to these trends. A number of
recent authoritative studies have shown that, along with the Mediterranean region, countries
in south-eastern Europe (SEE), including the Western Balkans, are likely to be the most
vulnerable in Europe.35
The SEE region is becoming warmer and, with the exception of
Serbia, is receiving less precipitation. The incidence of extreme weather events and climate-
related hazards has increased noticeably during the past two decades. The expectations are
that such trends will continue and accelerate in the coming decades. Natural ecosystems,
individuals and economic growth will be affected by these changes. As an example,
agricultural produce will be severely affected during alternating episodes of drought and
flooding, and adapted crops may be required over the long term due to less water availability.
Energy demand is expected to flatten throughout the year as cooling needs increase in
summer and heating needs decrease in winter. The recurrent floods that affected SEE in
recent years had a very high economic cost in terms of damaged infrastructure and housing,
and more generally the disruption to economic activity across all sectors.
The problems of climate change require a cooperative and coordinated approach. The recent
agreement emerging from the United Nations Climate Change Conference in Paris (the so-
called COP 21) is a dramatic example of how willingness of countries to reach mutually
beneficial outcomes can be harnessed towards concrete actions.
35
See, for example, Climate Change Adaptation in South Eastern Europe: A Background Report, UNEP and
ENVSEC, 2011.
38
Box 1
Albania: campaign against the informal sector
The problem of informality is long-standing in
the Western Balkans economies. In September
2015 the Albanian government initiated a
high-profile campaign to tackle informality.
The programme is at an early stage but has
already yielded some results.
Informal activities are pervasive in Albania and
other Western Balkans countries, holding back
the development of legitimate businesses,
depressing tax revenues and hindering labour
protection. In the fifth round of the EBRD-World
Bank Business Environment and Enterprise
Performance Survey (BEEPS V), more than 40
per cent of the firms surveyed in Albania reported
competing against firms in the informal sector.
The problem is particularly acute in the
agricultural sector, where obtaining value added
tax (VAT) receipts has been very difficult. This
leads to tax revenue losses and undersupply of
public goods.
The informal sector is an important contributor to
employment in Albania. For instance, according
to the International Labour Organization, 30 per
cent of the total workforce in the construction
sector is employed informally. These workers
typically suffer from a lack of labour protection.
On 1 September 2015 the government of Albania
launched a comprehensive campaign against
informality. The main purpose of the campaign is
to promote formal activity in order to increase
payment of taxes and formal employment. Teams
of trained “awareness raisers”, including tax
inspectors, have been visiting businesses in the
country to help bring them into the formal
economy. The tax office has been showing
businesses how to avoid incorrect reporting and
implementation of legislation. The initiative was
perhaps triggered by fiscal underperformance in
the past year, and it will primarily aim to tackle
tax evasion.
The campaign is based on three pillars:
communication, legislation and location.
Communication activities are aimed at delivering
a clear message to the general public on positive
aspects of formality, making sure that the public
understands the social losses associated with
informality and encouraging them to take an
active part in the fight against it.
The second pillar of the campaign is legislation,
aimed at amending the law in order to put in
place appropriate incentives, including harsher
penalties on businesses breaking the law by non-
declaration of turnover, registered employees,
VAT coupons and so on. New legislation in this
area was stopped by the Constitutional Court in
December 2015 pending a final decision on the
new procedures. The government also plans to
reform the public administration – a key factor in
the campaign’s success.
Under the third pillar, namely location, the
authorities will identify the regions, sectors and
businesses at high risk from informality and
create a common task force, including tax and
customs authorities as well as the economic crime
police and labour inspectorate, that is able to fight
informality effectively. The tax directorate is
implementing a new IT system that will classify
businesses according to their risk profile, which
would decrease the number of unnecessary
inspections and reduce costs for both tax
administration and businesses.
The results of the first two months of the
informality campaign include: a rise in the
number of registered businesses (more than
27,000 in September and October 2015 alone); an
increase of the registered workforce (more than
70,000 employees during September and
October); and increased declared turnover from
businesses. However, to maintain momentum it is
important that the government formulates a clear,
written plan for the medium term. This plan is in
preparation and is expected to be published in
early 2016.
39
Box 2
Bosnia and Herzegovina: reform agenda
In July 2015, after lengthy discussions,
governments at state and entity levels in
Bosnia and Herzegovina adopted a new
reform agenda. This agenda includes six
priority areas: public finances, taxes and tax
sustainability; business climate and
competitiveness; labour market; social
protection and pensions; the rule of law and
good governance; and public authorities. The
agenda is aligned with the European Union’s
new emphasis on economic governance in
Bosnia and Herzegovina and other Western
Balkans countries.
The adoption of a new reform agenda in Bosnia
and Herzegovina is an important step forward for
the country and has helped to put it back onto its
EU approximation path. Encouraged by this
progress, in April 2015 the Council of the
European Union decided to unfreeze the
Stabilisation and Association Agreement (SAA)
with Bosnia and Herzegovina, signed in 2008 but
not adopted because of the lack of progress in
reforms. The SAA entered into force on 1 June
2015.
Implementation of the reform agenda has begun.
Reforms can be broadly grouped into three areas:
socio-economic; the rule of law and the fight
against corruption; and – critical for the success
of the entire project – the strengthening of
administrative capacity. More specific action
plans have been developed by the state and entity
governments, and some significant legislative
reforms (notably, new labour laws) have been
adopted in both entities. Implementation is a joint
process, with local institutions working closely
with the European Union and supporting IFIs. A
broad set of subject areas – as set out in the table
– have been distilled into specific initial measures
and undertakings that will be prepared and
implemented during 2016 individually with each
institution. The reform agenda includes six
subject areas, with a lead international
organisation (or two) for each area.
In the area of business climate and
competitiveness, where the EBRD and the
International Finance Corporation (IFC) are the
Table 1: The reform agenda’s main subject areas and lead institutions
Subject area
Lead institution
1 Public finance, taxation and fiscal sustainability
IMF and World Bank
2 Business climate and competitiveness
EBRD and IFC
3 The labour market IMF and World Bank
4 Social welfare and pension reform
World Bank
5 Rule of law and good governance
European Union
6 Public administration reform
European Union
lead IFIs to assist the governments, the actions
agreed include: (i) for the Federation of Bosnia
and Herzegovina (FBIH), a restructuring
programme for mines and railways, and
privatisation of companies with a minority share
held by the FBIH government; and (ii) for the
Republika Srpska (RS), a programme for
restructuring loss-making public enterprises, and
a privatisation and restructuring programme for
RS Railways.
What can we expect in 2016? According to the
latest EC Progress Report, Bosnia and
Herzegovina is “at an early stage” in public
administration reform, in developing a
functioning market economy, approximation with
European standards in general and in the ability
to cope with competitive pressures and market
forces within the Union in particular. However,
Bosnia and Herzegovina may be allowed to
formally apply for EU membership in early 2016
– a reward for beginning to implement the reform
agenda. The official European Council
formulation of the main conditions for inviting an
application for membership from Bosnia and
Herzegovina is the achievement of “meaningful
progress” in the implementation of the country’s
recently adopted reform agenda.
40
Box 3
Kosovo: Stabilisation and Association Agreement
On 27 October 2015 the European Union and
Kosovo signed a Stabilisation and Association
Agreement (SAA), two years after the start of
negotiations. As the first contractual
relationship between the two sides, the
agreement is a milestone in Kosovo’s EU
approximation. It serves as a framework for
cooperation and political dialogue between
Kosovo and the European Union, formalising
the country’s preferential access to EU
markets in exchange for commitments on
required reforms.
The European Union has been active in Kosovo
since 1999, following the end of the conflict
between NATO forces and the then Federal
Republic of Yugoslavia. The European Union has
helped Kosovo with more than €2 billion of
financial assistance, which makes it by far the
single biggest donor. In addition, Kosovo hosts
the largest community of EU civil servants
outside of Brussels through the European Union
Rule of Law Mission in Kosovo (EULEX), as
well as the European Union Special
Representative (EUSR).
Kosovo was formally given a “European
perspective” in 2003 within the Stabilisation and
Association Process (SAP), the EU policy
framework designed to prepare all Western
Balkans countries for potential membership. The
European Commission launched a feasibility
study for an SAA in March 2012. The report
recommended that negotiations start as soon as
Kosovo made progress in the areas of rule of law,
public administration, protection of minorities
and trade. Following Kosovo’s commitment to
the necessary steps, and an agreement between
Kosovo and Serbia under which both committed
not to block or encourage others to block the
other side in the EU integration process, SAA
negotiations started in October 2013.
Kosovo has continued to address the priorities set
out in the Progress Reports and the feasibility
study for SAA, with most progress done in the
area on EU-facilitated dialogue with Serbia and
requirements for visa liberalisation, which
continues to be one of the key priorities. Also,
further arrangements for financial assistance have
been carried out and the Financing Agreement for
the Instrument for Pre-accession Assistance (IPA)
II was signed in April 2015. Kosovo has been
allocated up to €645.5 million under the
European Union’s new IPA II for 2014-20, with
€79.3 million already signed off for 212 projects.
This assistance will support reforms in
preparation for EU membership, socio-economic
and regional development, social policies and
rural development.
After a political stalemate following elections,
which caused a slight delay, the European
Commission adopted the SAA in April 2015 and
it was signed on 27 October 2015. The agreement
maps out a framework for political and economic
dialogue and cooperation in several areas and
sectors in which the country is obliged to meet
European standards. The agreement is likely to
enter into force in 2016. It was ratified by the
European Parliament in January 2016 and all that
now remains is final approval by the European
Council.
Not only are things looking positive for the
country politically in terms of a European future,
but investors can also take comfort in the fact that
Kosovo now has contractual obligations to adhere
to certain standards in terms of regulations and
the business environment.
41
Box 4
FYR Macedonia: reforming the business environment
Doing business in FYR Macedonia has become
a great deal easier over the last nine years: in
the World Bank’s 2007 Doing Business report,
the country was ranked 96th in the world; in
2016 it was placed 12th. This improvement
reflects a concerted effort by successive
governments to tackle obstacles to doing
business. These efforts have helped to improve
the country’s image and achieve some success
in attracting foreign direct investment (FDI).
During the past decade, FYR Macedonia has
implemented a comprehensive package of policy
reforms and capacity-building in the areas of
business environment, institutional strengthening,
land and real estate registration and the judiciary.
The Business Environment Reform and
Institutional Strengthening (BERIS) programme
addressed many of the priority areas identified by
the European Partnership (EP) and signed
between the European Commission and the
government in 2004. BERIS was designed and
implemented in 2006-10 as a loan of €6.4 million
(after revision) from the International Bank for
Reconstruction and Development.
There were five main components of the reform
programme. First, it focused on developing the
government’s capacity and implementing
business-friendly regulatory regimes in two
phases: (i) launching a regulatory guillotine and
(ii) setting the basis for a regulatory impact
analysis system. The regulatory guillotine is a
way of reviewing, streamlining, eliminating and
updating laws and procedures by avoiding huge
administrative, legal and political costs, as the
unjustified procedures are eliminated in a single
decision. It is usually used as a quick and
efficient way of making procedures more
business friendly. The regulatory impact
assessment is an element of evidence-based
policy-making as it uses a systematic approach to
critically assess existing and new regulations. By
the end of the reform programme, regulatory
impact assessments were carried out for over 100
new laws, and the regulatory guillotine
streamlined 564 laws and by-laws.
Second, the programme led to improvements in
the national Metrology, Standard, Testing and
Quality (MSTQ) System, making it consistent
with EU regulations in order to help companies
compete in both domestic and foreign markets.
After a series of reforms, one of the consequences
was an increase in the number of standards
harmonised with the European Union from 18 in
2005 to 3,477 in 2010.
Third, a competition policy regime was
introduced to strengthen capacity to implement a
competition policy compliant with EU standards.
This subsequently grew into an Industrial and
Enterprise Policy and Competitiveness Support,
mostly helping to increase FYR Macedonia’s
compliance with Chapter 20 (Enterprise and
Industrial Policy) of the EU’s acquis
communautaire.
Fourth, an access to information component of
the programme was designed to, among other
things, address poor access to information by
implementing a credit information registry. This
would establish a “one-stop shop” for business
registration and connect with the Employment
Agency and health and pension insurance funds.
This had the most visible impact on businesses as
it not only drastically shortened business
registration time but also allowed existing
businesses to deal with employee-related issues
electronically.
Lastly, a project coordination support scheme
was set up to ensure that activities were properly
implemented, coordinated and monitored.
FYR Macedonia has continued to improve the
business environment. Starting a business was
made easier by further improving the one-stop
shop and simplifying the requirements and
procedures, making online registration free of
charge and carried out by certified agents. At the
same time, FYR Macedonia lowered taxes for
businesses, worked on making credit more
accessible, developed more efficient frameworks
for resolving insolvency and protecting minority
investors, streamlined dealing with registering
property and construction permits by decreasing
the time and cost needed, and digitised the real
estate cadastre.
42
Box 5
Montenegro: coordinated auction office in SEE
The coordinated auction office (CAO) in
south-eastern Europe (SEE), established in
March 2014 and based in Podgorica,
Montenegro, is responsible for managing
cross-border capacity for electricity trading in
the region. Having a central point for cross-
border capacity allocation makes trade in
electricity simpler, cheaper and more
transparent, and promotes the development of
a regional power market.
The CAO came into being as a result of extensive
discussions between key stakeholders such as the
Energy Community Secretariat (established with
the aim of extending the energy acquis of the
European Union to the Western Balkans,
Moldova and Ukraine), the European
Commission and the transmission system
operators (TSOs) from the region. IFIs, including
the EBRD, have provided significant support in
terms of technical assistance, procurement and
grants for the IT platform necessary for capacity
allocation. Current shareholders are the TSOs of
Albania, Bosnia and Herzegovina, Croatia,
Greece, Kosovo, FYR Macedonia, Montenegro,
Romania, Slovenia and Turkey.
To understand the contribution of the CAO, it is
important to understand that power traders
wishing to export to another country must reserve
transmission capacity in each of the countries
through which they want to transport the energy.
For example, to transfer power from Bosnia and
Herzegovina to Albania, power traders must
reserve capacity on the Montenegrin power grid.
This capacity allocation used to be performed by
each TSO, using a variety of methods such as
bilateral auctions or even non-market-based
methods, with the risk of a resulting lack of
transparency and efficiency.
The creation of a coordinated single point to
auction transmission capacity in the region – the
CAO – enables efficient and economic access to
cross-border transmission capacity through a
transparent, market-based auction. This helps the
region to comply with EU regulations on
transmission capacity access and is a key step
towards a functioning and integrated regional
power market in south-eastern Europe.
The SEE CAO not only enhances the regional
integration of energy markets but also, by doing
so, it supports related investments in physical
infrastructure. It increases efficiency for energy
traders and sends a clear signal to investors that
the region, characterised by many borders and
different capacity allocation mechanisms, is
moving in the right direction regarding the
common energy market.
In technical terms, the creation of the CAO first
required the development of a complete set of
harmonised auction rules and internal procedures
between all shareholding TSOs. This was
followed by the implementation of the IT
Auction Platform and the education of power
traders, prior to the first auctions which took
place in late 2014. Now, the region enjoys a
single set of auction rules and the possibility for
power traders to allocate cross-border capacity
from Croatia to Turkey by using the SEE CAO as
a one-stop shop.
During the CAO’s first year of operations, all
yearly, monthly and daily auctions were
successfully conducted, with no disputes or
cancellations. The CAO has therefore proven its
pivotal role for the development of an open and
competitive SEE electricity market. Nevertheless,
to complete the regional perimeter, it would be
desirable to include the remaining SEE TSOs, in
particular Serbia, into the SEE CAO auction
process.
43
Box 6
Serbia: Innovation Fund
The Innovation Fund in Serbia was
established by the Law on Innovation Activity
in 2011, and is funded by the EU’s Instrument
for Pre-accession Assistance (IPA) with expert
support from the World Bank. The Fund’s
main goal is supporting innovation in science
and technology, and commercialising
technology transfer in Serbian enterprises. In
three years of functioning it has spent €6
million on 53 projects, and is continuing to
work on new projects supporting
commercialisation of R&D through
encouraging collaboration among
stakeholders.
The Innovation Fund provides financial help to
research and development (R&D) and innovation
in commercial enterprises in Serbia. It is among
few sources providing risk financing, as other
sources of private funding for businesses in initial
stages of development, such as business angels’
networks, crowd funding and venture capital,
barely exist in the country. It therefore
complements existing government support for
innovation projects.
The Fund operates through two different
programmes: mini grants and matching grants.
Both programmes require applicants to be
majority owned Serbian enterprises, and the
projects can be targeted at any field of science
and technology, as well as other sectors.
Mini grants are aimed at early-stage micro- and
small enterprises that have market-oriented
technological innovation with a high potential for
commercialisation. Projects must be designed to
be completed in under a year, and those receiving
awards get an unconditional grant amounting to a
maximum 85 per cent (or €80,000) of the total
funds necessary for successful execution.
Matching grants target existing micro-, small-
and medium-sized enterprises (defined by the
revenue ceiling in the last two years) looking to
scale up their production and translate research
efforts into commercial projects.
A project has to be designed to be completed in
under two years and the Fund is willing to
dispense a maximum of 70 per cent (up to
€300,000), with the remainder having to be
secured by a co-financer independent from the
Fund.
Grants in this category are not unconditional. If
the project is successful, the applicant will be
required to pay royalties or pay back the grant
with interest. The risk of not succeeding is shared
between the applicant and the Fund and, in cases
of unsuccessful commercialisation, no payment is
required. In three years of functioning, the Fund
went through four public calls for projects, with
471 applications, mostly from hi-tech companies
in ICT, energy efficiency and nanotechnology,
but also food and agriculture, machine and
mechanical engineering and electromechanical
device production. It disbursed all planned funds,
equally divided between mini grants and
matching grants.
By 2014 the results had been encouraging. Out of
53 awarded projects, 23 patent applications had
been submitted (plus 8 trademark and 6 copyright
applications), 13 companies had established new
business relationships or partnerships, 11
companies had generated revenue from the sale
or lease of products or services, and 7 companies
had established strategic international
cooperation.
Currently, the Innovation Fund is preparing a
Serbia Research, Innovation and Technology
Transfer Project, supported by €6.9 million from
IPA funds, with the goal of promoting technology
transfer and commercialising R&D efforts by
stimulating collaboration between academia and
industry, in addition to offering collaborative
R&D grant schemes. The Fund is also actively
representing the government of Serbia in the
dialogue and designing of new financial
instruments for private sector development within
the framework of the Western Balkans Enterprise
Development and Innovation Facility.