How the EPA is Ignoring Atrazine Contamination in … Wetzler. Poisoning the Well ... How the EPA Is...
33
August 2009 Poisoning the Well How the EPA is Ignoring Atrazine Contamination in Surface and Drinking Water in the Central United States Authors Mae Wu Mayra Quirindongo Jennifer Sass Andrew Wetzler
-
Upload
hoangkhuong -
Category
Documents
-
view
219 -
download
1
Transcript of How the EPA is Ignoring Atrazine Contamination in … Wetzler. Poisoning the Well ... How the EPA Is...

Blank Page i
August 2009 Poisoning the Well
How the EPA is Ignoring Atrazine Contamination in Surface and Drinking Water in the Central United States
AuthorsMae Wu
Mayra Quirindongo
Jennifer Sass
Andrew Wetzler
Poisoning the Well: How the EPA Is Ignoring Atrazine Contamination in Surface and Drinking Water in the Central United States
ii
About NRDCThe Natural Resources Defense Council (NRDC) is a national nonprofit environmental organization with more than 1.2 million members and online activists. Since 1970, our lawyers, scientists, and other environmental specialists have worked to protect the world’s natural resources, public health, and the environment. NRDC has offices in New York City, Washington, D.C., Los Angeles, San Francisco, Chicago, Montana, and Beijing. Visit us at www.nrdc.org.
AcknowledgmentsThe Natural Resources Defense Council gratefully acknowledges the Holthues and the Park Foundation for their generous support of our work. The authors would also like to thank those people that provided review and com-ments on this report, including NRDC scientific staff and scientific experts from government and academia.
NRDC Director of Communications: Phil GutisNRDC Marketing and Operations Director: Alexandra KennaughNRDC Publications Director: Lisa GoffrediNRDC Publications Editor: Anthony ClarkProduction: Tanja Bos, [email protected]
Copyright 2009 by the Natural Resources Defense Council.
This report is printed on paper that is 100 percent post-consumer recycled fiber, processed chlorine free.
iii
Table of Contents
Executive Summary iv
Chapter 1: An Atrazine Primer 3 Atrazine’s Uses and Risks The Recent Lackluster Regulatory Record
Chapter 2: Harmful Effects of Atrazine 5 Early Life Stages are Particularly Sensitive to Toxic Exposures Atrazine is an Endocrine-Disrupting Chemical Atrazine May Increase Risk of Cancer Synergistic Effects of Atrazine with Other Pesticides Additional Points of Concern
Chapter 3: Atrazine Contamination is a Widespread Problem 8 NRDC’s New Analysis and Synthesis of Atrazine Data Watersheds are Excessively Contaminated with Atrazine High levels of Atrazine in Drinking Water Systems is Cause for Alarm There Are Minimal Benefits from Atrazine Use
Chapter 4: Atrazine Monitoring is Misleading and Its Regulation Insufficient 17 The EPA is Ignoring the Atrazine Problem Monitoring Programs Were Not Designed to Find the Biggest Problems Screening Levels Are Too Permissive The EPA Monitoring Program Ignores More Than 1000 Vulnerable Watersheds
Chapter 5: Recommendations 21
Endnotes 23
Poisoning the Well: How the EPA Is Ignoring Atrazine Contamination in Surface and Drinking Water in the Central United States
iv
Executive Summary
Banned in the European Union and clearly linked to harm to wildlife and
potentially to humans, the pesticide atrazine provides little benefit to offset
its risks. In this report, NRDC brings together for the first time the results
of surface water and drinking water monitoring required by the U.S. EPA to create
a more comprehensive analysis of atrazine pollution across the Midwestern and
Southern United States. We found that the U.S. EPA’s inadequate monitoring systems
and weak regulations have compounded the problem, allowing levels of atrazine in
watersheds and drinking water to peak at extremely high concentrations. Given the
pesticide’s limited usefulness and the ease with which safer agricultural methods can
be substituted to achieve similar results, NRDC recommends phasing out the use of
atrazine, more effective atrazine monitoring, the adoption of farming techniques that
can help minimize the use of atrazine and prevent it from running into waterways,
and the use of home filtration systems by consumers.
An Atrazine PrimerAtrazine is a selective herbicide applied to fields at the beginning of the growing season to kill weeds.1 In the United States alone, between 60 and 80 million pounds of atrazine are used each year, mainly on corn crops. Because of its widespread use, atrazine is the most commonly detected pesticide in U.S. waters. Approximately 75 percent of stream water and about 40 percent of all groundwater samples from agricultural areas tested in an extensive U.S. Geological Survey study contained atrazine.2 Although the European Union banned the pesticide in 2004, atrazine is still widely used in the United States.
The U.S. Environmental Protection Agency (EPA) regulates the use of atrazine as well as the presence of atrazine in drinking water. Under the Safe Drinking Water Act (SDWA), the EPA has determined that no more than 3 parts per billion (ppb) of atrazine (as a running annual average)3 may be present in drinking water. Under the Federal Insecticide, Fungicide, and Rodenticide Act (FIFRA), the EPA allows atrazine to be used on, among other things, corn, sorghum, sugarcane, and lawns. Despite the fact that atrazine used in fields eventually ends up in surface water and treated drinking water, the regulation of atrazine under these two statutes is not coordinated.
Poisoning the Well: How the EPA Is Ignoring Atrazine Contamination in Surface and Drinking Water in the Central United States
v
The Dangers of Atrazine Are Well Documented The toxicity associated with atrazine has been documented extensively. The adverse reproductive effects of atrazine have been seen in amphibians, mammals, and humans—even at low levels of exposure. Concentrations as low as 0.1 ppb have been shown to alter the development of sex characteristics in male frogs, resulting in male frogs with female sex characteristics, hermaphroditism and the presence of eggs in male frog testes.4 When exposure coincides with the development of the brain and reproductive organs, that timing may be even more critical than the dose.5,
6 Also of great concern is the potential for atrazine to act synergistically with other pesticides to increase their toxic effects.
NRDC’s New Analysis Reveals Widespread Atrazine Contamination and Inadequate Regulation and MonitoringNRDC analyzed—in combination for the first time—the results of surface water and drinking water monitoring required by the EPA across the Midwestern and Southern United States. NRDC obtained these data from the EPA’s Ecological Watershed Monitoring Program (surface water) and the EPA’s Atrazine Monitoring Program (drinking water) as part of the settlement of litigation brought against the EPA and in response to two Freedom of Information Act (FOIA) requests submitted to the agency. Our analysis resulted in seven major findings:
WATERSHEDS ARE PESTICIDES CoNTAMINATED WITH ATRAzINEOur analysis of the Ecological Monitoring Program data confirms that the surface waters of the Midwestern and Southern United States suffer from pervasive contamination with atrazine. 4 All 40 watersheds tested showed detectable levels
of atrazine, and 25 had average concentrations above 1 ppb, which is the concentration at which the primary production of aquatic non-vascular plants (such as algae) is reduced.
4 The watersheds with the 10 highest peak concentrations of atrazine are in Indiana, Missouri, and Nebraska.
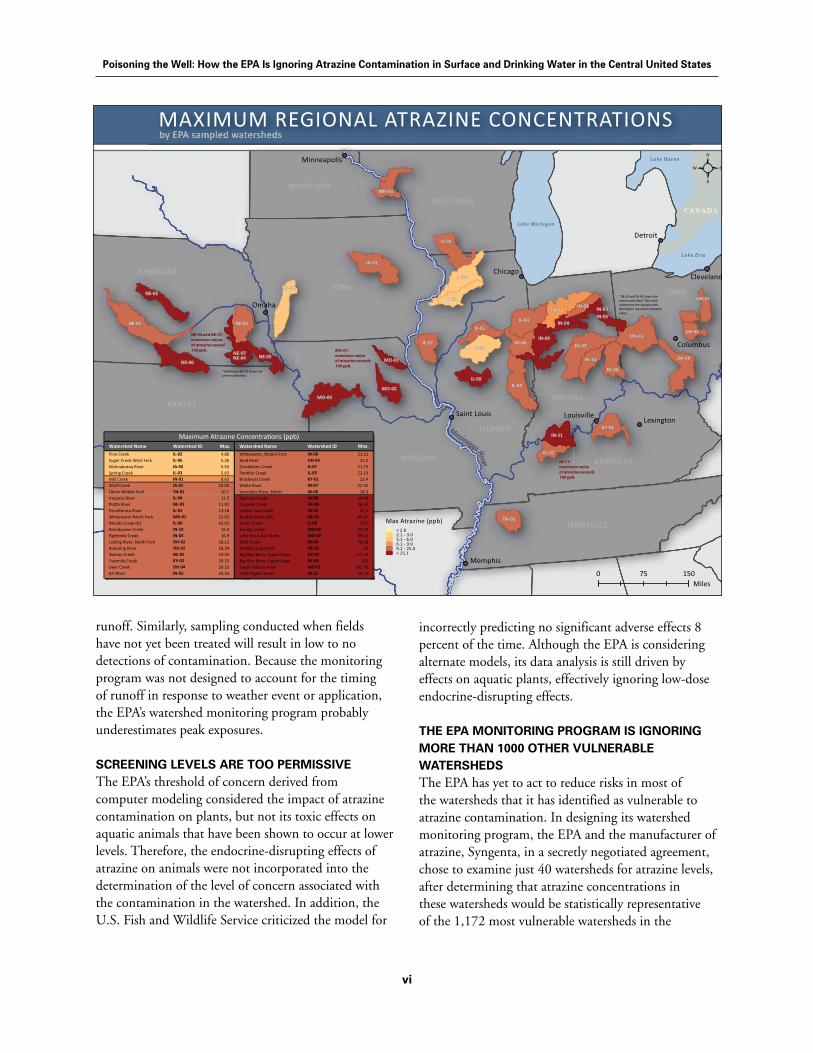
4Nine of the monitored watersheds (22 percent) had at least one sample showing atrazine levels above 50 ppb, and four watersheds (10 percent) had peak maximum concentrations of atrazine exceeding 100 ppb. At Little Pigeon Creek in Indiana, the annual average atrazine concentration was 18.56 ppb, but the maximum concentration was a staggering 237.5 ppb, detected in May 2005.
HIgH LEvELS of ATRAzINE IN MANy DRINkINg WATER SySTEMS ARE ALSo CAUSE foR ALARMOur analysis of the EPA’s Atrazine Monitoring Program data also reveals disturbingly high levels of atrazine contamination in the drinking water in some public water systems. 4More than 90 percent of the samples taken in 139
water systems had measurable levels of atrazine in both 2003 and 2004.
4 Three water systems had running annual averages for atrazine in finished (tap)7 water that exceeded the 3 ppb drinking water standard: Versailles Water Works in Indiana (4.60 ppb), Mount Olive Water Works in Illinois (3.79 ppb), and Evansville in Illinois (3.20 ppb).
4 Fifty-four water systems (39 percent) had a one-time peak atrazine concentration above 3 ppb. The highest peak concentration of atrazine in finished water among all tested public water systems was 39.69 ppb in the Evansville water system in Randolph County, Illinois.
THE EPA IS IgNoRINg THE ATRAzINE PRoBLEMBecause of the potential adverse effects associated with even short exposures to atrazine, the spikes detected in the watersheds and the public drinking water systems are particularly alarming. Yet, because the EPA focuses on average concentrations of atrazine, it has ignored these peaks.
MoNIToRINg PRogRAMS WERE NoT DESIgNED To fIND THE BIggEST PRoBLEMSThe EPA’s monitoring program for atrazine was poorly designed and is not apt to find the most troubling results, which makes the statistics even more alarming. For example, samples taken before a rainstorm washes pesticides into a watershed will show much lower concentrations of pesticide than samples taken after a rainstorm, which can capture the contaminated field
Poisoning the Well: How the EPA Is Ignoring Atrazine Contamination in Surface and Drinking Water in the Central United States
vi
runoff. Similarly, sampling conducted when fields have not yet been treated will result in low to no detections of contamination. Because the monitoring program was not designed to account for the timing of runoff in response to weather event or application, the EPA’s watershed monitoring program probably underestimates peak exposures.
SCREENINg LEvELS ARE Too PERMISSIvEThe EPA’s threshold of concern derived from computer modeling considered the impact of atrazine contamination on plants, but not its toxic effects on aquatic animals that have been shown to occur at lower levels. Therefore, the endocrine-disrupting effects of atrazine on animals were not incorporated into the determination of the level of concern associated with the contamination in the watershed. In addition, the U.S. Fish and Wildlife Service criticized the model for
incorrectly predicting no significant adverse effects 8 percent of the time. Although the EPA is considering alternate models, its data analysis is still driven by effects on aquatic plants, effectively ignoring low-dose endocrine-disrupting effects.
THE EPA MoNIToRINg PRogRAM IS IgNoRINg MoRE THAN 1000 oTHER vULNERABLE WATERSHEDSThe EPA has yet to act to reduce risks in most of the watersheds that it has identified as vulnerable to atrazine contamination. In designing its watershed monitoring program, the EPA and the manufacturer of atrazine, Syngenta, in a secretly negotiated agreement, chose to examine just 40 watersheds for atrazine levels, after determining that atrazine concentrations in these watersheds would be statistically representative of the 1,172 most vulnerable watersheds in the
CANADA
IN-11: maximum value of atrazine exceeds 100 ppb.
MO-01: maximum value of atrazine exceeds 100 ppb.
NE-04 and NE-07: maximum values of atrazine exceed 100 ppb.
* NE-04 and NE-07 share thesame watershed.
* IN-03 and IN-05 share thesame watershed. The colorrepresents the sample with the higher maximum atrazine value.
Mississippi
Tulsa
Omaha
Memphis
Wichita
Chicago
Detroit
Columbus
Lexington
Cleveland
LouisvilleSaint Louis
Minneapolis
Oklahoma City
River
NE-03
IN-07
IL-09
IA-01
IL-02
IL-04
IN-09
MO-03
OH-03
IL-06
IL-01
NE-06
IN-01
OH-04
IL-07
NE-01
IN-08
IN-06
IN-11
KY-01
IL-05
IL-08
IL-03
NE-04
TN-01
MO-02
KY-02
IA-02
IN-05
IN-03
NE-02
IN-10NE-07
MN-01
NE-05
OH-01IN-02
OH-02
IN-04
MO-01
KANSAS
MISSOURI
NEBRASKA
IOWA
MINNESOTA
WISCONSIN
ILLINOIS
INDIANA
OHIO
KENTUCKY
TENNESSEE
0510 75Miles
by EPA sampled watersheds
Watershed Name Watershed ID Watershed Name Watershed ID Max. Max.
Pine Creek IL-02 4.86 Whitewater, Nolans Fork IN-08 21.11Suger Creek West Fork IL-06 5.26 Mad River OH-03 21.5Nishnabotna River IA-02 5.53 Grindstone Creek IL-07 21.75Spring Creek IL-03 5.63 Panther Creek IL-05 22.13Mill Creek IN-01 8.63 Brashears Creek KY-01 22.4Wolf Creek IA-01 10.03 White River IN-07 22.55Obion Middle Fork TN-01 10.7 Vermilion River, North IN-06 24.3Iroquois River IL-04 11.5 Raccoon Creek IN-09 34.49Pla e River NE-03 11.92 Crooked Creek NE-06 36.13Peca onica River IL-01 13.18 Limber Lost Creek IN-05 41.3Whitewater North Fork MN-01 15.03 Muddy Creek (NE) NE-05 49.87Muddy Creek (IL) IL-09 16.02 Horse Creek IL-08 50.7Brandywine Creek IN-10 16.4 Youngs Creek MO-02 53.75Eightmile Creek IN-03 16.9 Li le Sni-A-Bar Creek MO-03 59.03Licking River, North Fork OH-02 18.13 Rock Creek IN-04 78.08Kokosing River OH-01 18.34 Middle Loup Creek NE-02 82Wahoo Creek NE-01 19.25 Big Blue River, Lower Gage NE-07 112.19Twomile Creek KY-02 19.33 Big Blue River, Upper Gage NE-04 125Deer Creek OH-04 20.15 South Fabious River MO-01 182.75Eel River IN-02 20.33 Li le Pigeon Creek IN-11 237.5
Maximum Atrazine Concentra ons (ppb)
MAXIMUM REGIONAL ATRAZINE CONCENTRATIONS
Max Atrazine (ppb)< 2.02.1 - 3.03.1 - 6.06.1 - 9.09.1 - 25.0> 25.1
Poisoning the Well: How the EPA Is Ignoring Atrazine Contamination in Surface and Drinking Water in the Central United States
vii
country. Indeed, based on the results of its watershed monitoring program, the EPA itself preliminarily estimated that 101 (9 percent) of the 1,172 watersheds would exceed the (inadequate) level of concern for atrazine contamination and would require risk mitigation measures.8 To date the EPA has still not ordered mitigation steps in these watersheds.
ATRAzINE USE BRINgS MINIMAL BENEfITS Data suggest that atrazine provides, at best, only minimal economic benefits to the farmers who use it. The U.S. Department of Agriculture estimates a ban on atrazine would result in crop losses of only 1.19 percent and decrease corn acreage in production by just 2.35 percent. Italy and Germany (both of which banned atrazine nearly 20 years ago) have not seen any drop in corn productivity or total acreage of land in production for corn since their ban on atrazine was put in place, although this was due in part to the use of other hazardous pesticides. However, Integrated Pest Management techniques could help farmers eliminate the use of atrazine and control weeds while reducing their use of other dangerous chemicals.
Recommendations for Protecting Human Health and the Environment NRDC recommends the following steps be taken to reduce atrazine contamination in U.S. waters and minimize its impacts on human health and the environment:
1. The United States should phase out the use of atrazine.
Given the evidence of atrazine’s toxic effects on sensitive wildlife species and its potential risk to human health, the currently high contamination levels in the Midwestern and Southern United States, and the lack of compelling evidence that the herbicide is particularly useful to farmers, NRDC strongly recommends that atrazine be phased out of all uses in the United States, including home gardens and golf courses.
2. Farmers should take interim steps to reduce their atrazine use.
Farmers can take immediate steps to reduce their use of atrazine, including implementing a variety
of nonchemical techniques for weed control. These include crop rotation, the use of winter cover crops, alternating rows of different crops, and mechanical weed control methods. Timing fertilizer applications to coincide with periods of greatest nutrient uptake by crops can avoid unnecessary fertilizer use that would fuel weed growth.
3. The EPA should monitor all vulnerable watersheds and require all future monitoring plans to identify worst case scenarios.
The EPA should broaden the monitoring program to assess all watersheds identified as vulnerable. Future monitoring plans should be designed to identify the worst case scenarios occurring in vulnerable watersheds and in public water systems. Proper timing for sampling after big rainstorms and after fields have been treated with atrazine is recommended. This would provide a much more realistic view of the actual severity of the atrazine problem.
4. The EPA should publish monitoring results for each watershed and public water system sampled.
Monitoring results on the watersheds and the public water systems that were sampled under the two different monitoring programs were first made available to NRDC through FOIA requests and litigation. However, people who live downstream of atrazine-treated fields have a right to know about high levels of atrazine contamination in their watersheds or drinking water systems. A publicly available website posting sampling data as it is analyzed and regular reports about spikes of atrazine contamination would be a strong step in the right direction, providing accessible information to the public.
5. The public should use home water filtration
systems and demand transparency of information from their water utilities.
NRDC recommends that consumers concerned about atrazine contamination in their water use a simple and economical household water filter, such as one that fits on the tap. Consumers should make sure that the filter they choose is certified
Poisoning the Well: How the EPA Is Ignoring Atrazine Contamination in Surface and Drinking Water in the Central United States
viii
by NSF International to meet American National Standards Institute (ANSI) Standard 53 for VOC (volatile organic compounds) reduction and therefore capable of significantly reducing many health-related contaminants, including atrazine and other pesticides. A list of NSF/ANSI 53 certified drinking water filters is available at http://www.nsf.org/certified/dwtu.
Make our Drinking Water SaferNRDC wants to know how public water systems treat for atrazine and other dangerous contaminants. Consumers should contact their local water utility and ask about treatment of the water supply, fill in the online form and send NRDC the results. Providing this information to NRDC will help us collect information on how public water systems are treating for contaminants.
Visit the NRDC SimpleSteps site at www.simplesteps.org/atrazine to view the questions and form.
Poisoning the Well: How the EPA Is Ignoring Atrazine Contamination in Surface and Drinking Water in the Central United States
1
Atrazine’s Uses and Risks Because it is applied in the spring before crops are planted, when rains are frequent, atrazine is often transported in runoff from fields to nearby streams and other surface water. Atrazine is the most frequently detected pesticide in U.S. waters.11 Between 1992 and 2001, atrazine and its metabolites (over time, atrazine breaks down into toxic and persistent chemical compounds called chlorotriazines) were detected in more than 75 percent of stream samples and about 40 percent of shallow groundwater samples in agricultural areas across the United States.12
This report compiles results collected by the U.S. Environmental Protection Agency (EPA) on atrazine concentrations in vulnerable rivers and streams and in raw and finished drinking water throughout the central and southern United States.13 Presented here together for the first time, these data show that atrazine is a frequent contaminant of our waterways at levels that pose an ongoing risk to wildlife and possibly also human health, saddling many small municipal and rural drinking water systems with costly treatment burdens, and providing little economic benefit to farmers.
CHAPTER 1
An Atrazine Primer
Atrazine, one of the most commonly used herbicides, is applied to soil before
crop planting to selectively suppress the growth of broadleaf and grassy
weeds. In the United States alone, an estimated 60 to 80 million pounds of
atrazine active ingredient are applied annually to corn, sugarcane, and sorghum crops.
Worldwide, approximately 154 million pounds of atrazine are produced annually,9
primarily by Syngenta Crop Protection, a Swiss-based company (formerly a unit of
Novartis and, before that, CibaGeigy).10
The Recent Lackluster Regulatory RecordThe EPA registers pesticides under the authority of the Federal Insecticide, Fungicide, and Rodenticide Act (FIFRA). To approve a pesticide for use, the EPA must find that it can be used without causing “unreasonable adverse effects on the environment.”14 This finding must “take into account the economic, social, and environmental costs and benefits…that result from a use of a pesticide.”15 FIFRA also required the EPA to reevaluate and reregister all pesticides, such as atrazine, registered before November 1, 1984.16 If the EPA determines that a pesticide poses a significant hazard, it has the authority to conduct an administrative review of the chemical at any time. If it is shown that continued use would pose unreasonable risks to humans or wildlife, the EPA is obligated to suspend or cancel the pesticide’s registration to take it off the market.17
The EPA separately regulates atrazine contamination in drinking water through the Safe Drinking Water Act (SDWA). Under the SDWA, the EPA sets Maximum Contaminant Level Goals (MCLGs) for drinking water
Poisoning the Well: How the EPA Is Ignoring Atrazine Contamination in Surface and Drinking Water in the Central United States
2
at which “no known or anticipated adverse effects” on human health occur and that “allow for an adequate margin of safety.”18 Once MCLGs are established for a contaminant, the EPA then sets enforceable Maximum Contaminant Levels (MCLs) as close as is “feasible” to the MCLGs, considering the costs and benefits of compliance.19
Recently, the EPA’s regulatory decisions about atrazine have been riddled with questions of impropriety because of the significant and illegal discussions and negotiations between the EPA and the manufacturer spanning two years.20 In the end, the EPA allowed the continued widespread use of a hazardous herbicide that is contaminating many of our streams, rivers, and drinking water.
Atrazine was first registered for use in the United States in 1958. In 1988, the EPA announced its preliminary intention to conduct a “special review” of atrazine under FIFRA because of concerns about “the carcinogenic potential of atrazine and possible risks resulting from exposure to atrazine in the diet from treated food and drinking water.”21 A few years later, in 1991, the EPA’s Office of Water began regulating atrazine in drinking water under the SDWA, by setting the MCL for atrazine in drinking water at 3 parts per billion (ppb). This MCL is calculated as a running annual average and is more permissive than the World Health Organization’s international drinking water guidance of an annual average of 2 ppb for atrazine.22,23
In 1991, Germany and Italy banned the use of atrazine.24,25 In 2003, European regulators announced their ban on atrazine use throughout the European Union, because of an inability to keep levels below 0.1 ppb, the European Union’s uniform limit for any pesticide residue in drinking and ground water.26
In 1994, the EPA initiated the special review of the registration for atrazine. Despite determining that there were ecological concerns associated with the use of atrazine, the EPA nonetheless affirmed the reregistration of atrazine in 2006, which allowed the use of this herbicide to continue.27 Moreover, rather than opting for a plan to reduce the use of atrazine, the EPA instead chose to require only additional sampling of watersheds vulnerable to atrazine contamination.
To implement the monitoring decision, the EPA and Syngenta, the manufacturer of atrazine, together identified some 10,000 watersheds at some risk from atrazine contamination, and 1,172 watersheds
in particular that are at highest risk from atrazine contamination. Subsequently, the EPA and Syngenta privately negotiated that Syngenta would monitor atrazine pollution for two to three years in a small subset of the 1,172 high-risk streams. They agreed Syngenta would begin monitoring 20 of the highest risk streams in 2004, and add 20 more in 2005, thus ignoring more than 96 percent of the streams that it had identified as being at highest risk. The EPA has since done little to protect these and other at-risk watersheds from atrazine contamination.
Worse yet, carefully documented investigations by NRDC revealed that the EPA’s monitoring and assessment plans were based on reports from two advisory groups that were comprised solely of EPA and Syngenta employees.28 One advisory group was tasked with identifying the watersheds to be monitored and designing the monitoring study. The other group was tasked with establishing the amount of atrazine that aquatic plants could be exposed to without adverse effects on the ecosystem. This use of non-public industry-government workgroups to make regulatory determinations violated the Federal Advisory Committee Act (FACA). Based on all this improper assistance from the manufacturer of atrazine, the EPA irresponsibly finalized its decision to allow atrazine to remain on the shelves in the United States.
Poisoning the Well: How the EPA Is Ignoring Atrazine Contamination in Surface and Drinking Water in the Central United States
3
Early Life Stages are Particularly Sensitive to Toxic ExposuresThe regulation of hazardous materials in the U.S. is generally based on the scientific dogma that the dose makes the poison: the notion that larger doses are more toxic than smaller doses. This belief leads to the presumption that the chemical is “safer” at lower doses. For this reason, and also because testing with low doses is often not done for practical reasons, we rarely have reliable toxicity data of potential hazardous effects at low doses. Moreover, for chemicals that interfere with the development of critical organs or systems, such as organs of the immune system, reproductive system, and nervous system, there is now a substantial amount of scientific proof that when exposure occurs at the same time that these critical systems are developing, even transient low-dose exposures can cause irreparable harm. That is, the timing of exposure may actually be even more critical than the dose.29, 30 For example, prebirth exposure to mercury, at levels so low that effects are not detectable in an adult, will prevent proper connections between the brain cells of the fetus, resulting in lifelong alterations in brain structure and function.31 Exposures to endocrine- (or hormone-) disrupting chemicals such as atrazine during critical windows of development also have been shown to have permanent effects.32 Some of these effects,
CHAPTER 2
Harmful Effects of Atrazine
NRDC has been fighting for nearly a decade to phase out the use of atrazine
because of the adverse environmental and health effects associated with
its contamination of our waterways. The toxicity associated with atrazine
has been well documented, ranging from hormone-disrupting effects to carcinogenic
effects in animals and possibly in humans.
such as infertility or cancer, may not be obvious until adulthood even though the exposure occurred during fetal or neonatal life.33 This phenomenon has been demonstrated for atrazine in laboratory animals such as amphibians, where short exposures during early developmental stages have had long lasting or even permanent irreversible effects on adult behavior and longevity, including increased susceptibility to infection,34 alterations in survival behavior,35, 36 and reduced long-term survival.37 Laboratory studies and field studies have consistently reported that exposure of animals to atrazine during critical periods of early development can lead to serious adverse health effects on hormone-dependent systems (discussed in more detail in the following section).
Atrazine is an Endocrine-Disrupting ChemicalAtrazine has been shown in numerous studies to disrupt hormone activity in amphibians, particularly those exposed during early stages of development.38,39 For example, exposure to 21 ppb of atrazine during metamorphosis for as little as two days has been shown to impair development of the reproductive organs in male and female frogs.40, 41 In fact, concentrations
Poisoning the Well: How the EPA Is Ignoring Atrazine Contamination in Surface and Drinking Water in the Central United States
4
as low as 0.1 ppb have been shown to affect the development of female sex characteristics in male frogs and cause the development of eggs in male frog testes.42 This suggests that exposure to elevated spikes of atrazine during critical windows of development, even for short durations, may be the most relevant for predicting toxic effects.
The hormone-disrupting effects of atrazine are not just limited to amphibians. Even before evidence of hormone disruption activity had emerged in amphibians, EPA scientists and others had already reported that atrazine disrupts the normal progression of sexual development in mammals. For example, one study reported that atrazine reduced sperm motility in male rats.43 In addition, there is disturbing evidence of reproductive effects, such as low sperm count and motility, in farm workers and rural populations exposed to atrazine and other triazine pesticides.44, 45, 46
The U.S. Fish and Wildlife Service (USFWS) has stated that “studies of the effects of atrazine have documented potential adverse effects to fish and bivalves at exposure concentrations below those predicted by EPA and recorded through monitoring.”47 Among those adverse effects are “organ tissue damage [and] disruption to endocrine and olfactory systems affecting important behavioral functions related to survival and reproduction….”48 The National Marine Fisheries Service has also noted risks of adverse effects on the reproduction and behavior of fish and sea turtles from environmental concentrations of atrazine.49
Atrazine May Increase Risk of CancerThere is also evidence that links atrazine to cancer. A robust review of all available science on atrazine conducted by the International Agency for Research on Cancer (IARC) reported numerous studies finding an increase in mammary gland tumors in female rats treated with atrazine from early life until adulthood.50 Another series of rodent studies suggest that prenatal atrazine exposure may alter breast development and increase the risk of breast cancer in adulthood.51, 52 Limited studies of people occupationally exposed to atrazine suggested that atrazine exposure may be linked to an increased incidence of cancers in humans, in particular non-Hodgkin’s lymphoma.53, 54 In 1991 and 1999, the IARC Monographs Programme convened a workshop of scientific experts to review available data
relevant to cancer risks from atrazine. The workgroups concluded that atrazine causes cancer in experimental animals. However, the workgroups felt the evidence from human data was insufficient to draw conclusions with confidence.55
While the EPA continues to classify atrazine as “not likely” to cause cancer in humans,56 this determination ignores the recommendations of its scientific advisory panel that the EPA consider all the science, including whether hormonal effects in childhood or adolescence may have an impact on cancer occurrence in later years.57, 58
Synergistic Effects of Atrazine with other PesticidesAlthough many laboratory studies are designed with care and precision to examine the effects of a single chemical, usually at high doses, on biological systems, this often represents an unlikely exposure scenario for wildlife and human populations, which are almost always exposed to multiple chemicals at the same time, and often at lower doses than are tested in the lab. These single-chemical studies can thus underestimate risks from exposure to a chemical when it is confronted as a toxic mixture that commonly occurs in the real world.59, 60 Atrazine has the potential to act synergistically with other chemicals to increase their toxic effects. For example, one assessment reported that atrazine is more likely to cause non-Hodgkin’s lymphoma in men when they are exposed to it in combination with other pesticides.61 A laboratory study of frogs also reported an increase in mortality of tadpoles exposed to multiple pesticides at levels that were non-lethal when occurring individually (0.1 ppb).62
A recent study published in Nature provided strong evidence from frog studies that atrazine suppresses the immune system. This study found the presence of atrazine to be a strong predictor of parasitic flatworm larvae, which can cause severe limb deformities and kidney damage to amphibians, in declining populations of northern leopard frogs. Importantly, the study also concluded that the combination of atrazine and phosphate—widely used in fertilizer for corn and sorghum production—significantly increased the presence of the flatworm.63
Poisoning the Well: How the EPA Is Ignoring Atrazine Contamination in Surface and Drinking Water in the Central United States
5
These studies raise serious concerns, since simultaneous exposure to multiple pesticides is routine for human and wildlife populations. A U.S. Geological Survey study of 51 major hydrologic systems in the U.S. found that about 90 percent of the time, stream waters in agricultural, urban and mixed land use areas contained two or more pesticides or their metabolites.64 About 20 percent of the time they contained ten or more pesticide contaminants.65 By failing to consider exposure to atrazine with other co-contaminants, the risks posed by atrazine in the real world are likely to be underestimated significantly.
Additional Points of ConcernThe EPA recognized several endpoints of concern for atrazine when developing its Interim Reregistration Eligibility Decision (IRED) for atrazine in 2003, based on laboratory and field studies involving exposure to the pesticide for various durations. For example, a particularly important ecological endpoint is phytotoxicity: the reduction in aquatic plants that are crucial to the proper functioning of the food chain in a watershed. Just one week of exposure to atrazine at 1 ppb caused adverse effects on these aquatic plants, as the EPA acknowledged in the IRED.66 The EPA set its level of concern for the Ecological Watershed Monitoring Program based on atrazine’s effects on aquatic plants, but the model and assumptions it uses fail to account for other effects occurring at lower doses—such as endocrine-disrupting effects at levels below 1 ppb—in establishing its benchmark level of concern.
Poisoning the Well: How the EPA Is Ignoring Atrazine Contamination in Surface and Drinking Water in the Central United States
6
NRDC’s New Analysis and Synthesis of Atrazine DataNRDC obtained these data directly from the EPA. The data were collected under two separate agency programs: the Ecological Watershed Monitoring Program and the Atrazine Monitoring Program.67 The Ecological Watershed Monitoring Program data were released as a condition of a lawsuit brought by NRDC against the EPA for approving the continued use of atrazine without adequately considering its risk to endangered species. The Atrazine Monitoring Program data were obtained through two Freedom of Information Act requests submitted to the EPA.
Under the Ecological Watershed Monitoring Program, companies trying to register atrazine for use under FIFRA were required to monitor surface water in vulnerable watersheds.68, 69 After identifying 1,172 watersheds at high risk of atrazine contamination, 40 watersheds (in nine Midwestern and Southern states) were selected for stream water testing for atrazine. The samples were taken every four days between April and late summer from 2004 to 2006. These results represent all the data taken under this program.
Under the Atrazine Monitoring Program, registrants are required to test both raw and finished drinking water samples from selected public water systems.70, 71
CHAPTER 3
Atrazine Contamination is a Widespread Problem
This report provides the first publicly available analysis of the EPA’s monitoring
results for atrazine in surface water and in drinking water. NRDC obtained
and analyzed data on thousands of monitoring samples from rivers, streams,
and public drinking water systems in the Midwest and the South.
Raw water refers to drinking water before it is treated, and finished water refers to treated drinking water that has undergone disinfection and/or filtration and is ready to be sent to consumers. Samples from the 139 public water systems in ten Midwestern and Southern states in the program were tested for both atrazine and total chlorotriazines (compounds formed from atrazine as it degrades). These water systems were frequently tested for atrazine: once per week during the atrazine use season (spring and summer), and once every two weeks during the rest of the year. Sampling still continues under the Atrazine Monitoring Program.
Watersheds are Excessively Contaminated with Atrazine After analyzing the data from the Ecological Watershed Monitoring Program, we were alarmed to find that in all the areas sampled (especially large parts of the Midwest) atrazine contamination is pervasive. Not only was every watershed sampled contaminated with some amounts of atrazine, the contamination in many watersheds exceeded atrazine concentrations that the EPA acknowledges are associated with adverse effects. Out of the 40 watersheds sampled, 25 had annual average atrazine levels above 1 ppb—the level
Poisoning the Well: How the EPA Is Ignoring Atrazine Contamination in Surface and Drinking Water in the Central United States
7
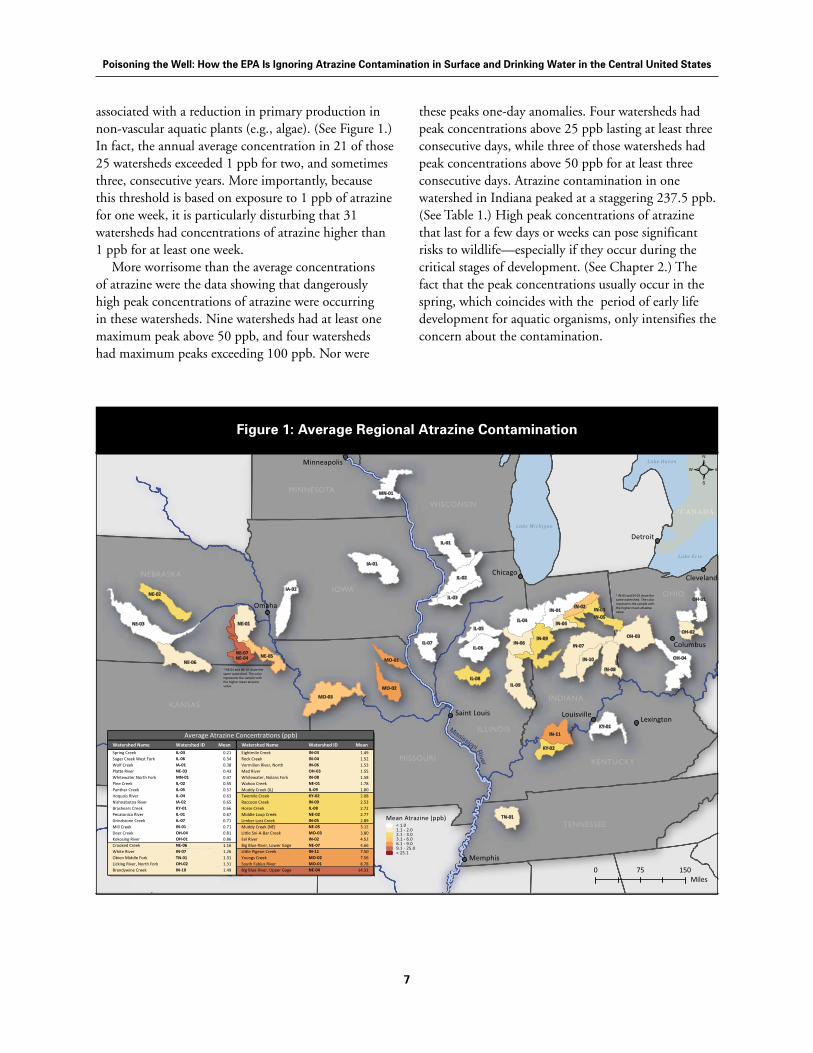
associated with a reduction in primary production in non-vascular aquatic plants (e.g., algae). (See Figure 1.) In fact, the annual average concentration in 21 of those 25 watersheds exceeded 1 ppb for two, and sometimes three, consecutive years. More importantly, because this threshold is based on exposure to 1 ppb of atrazine for one week, it is particularly disturbing that 31 watersheds had concentrations of atrazine higher than 1 ppb for at least one week.
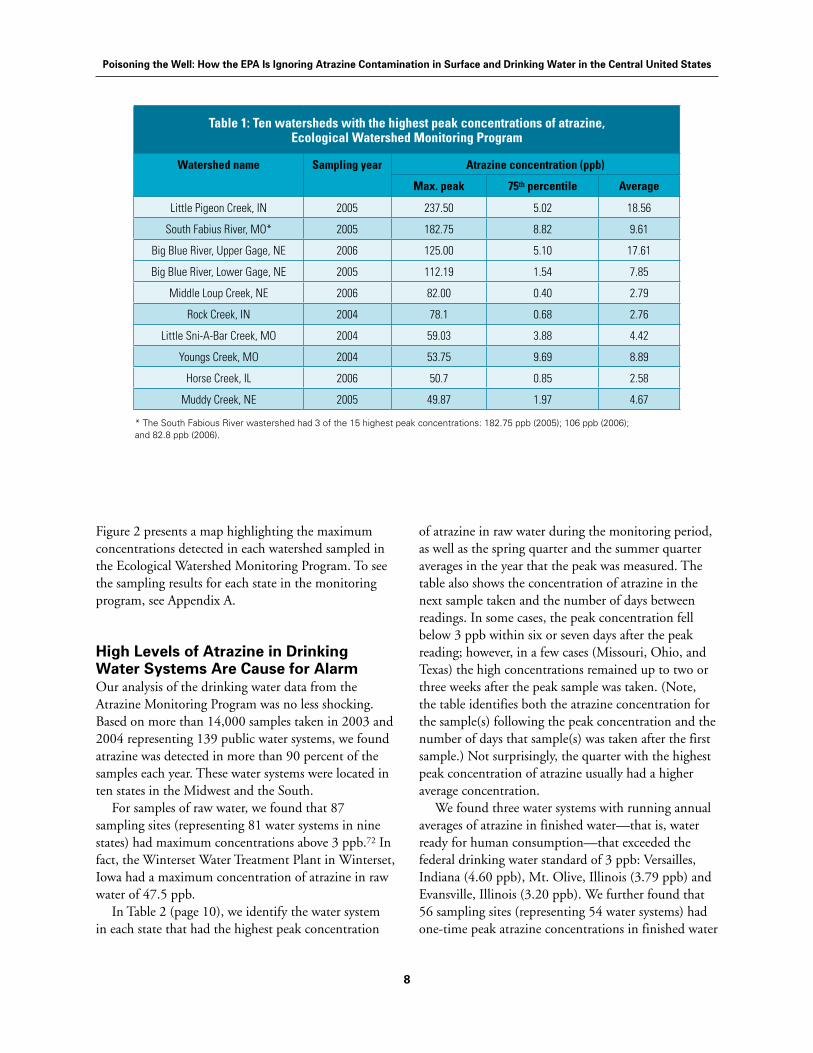
More worrisome than the average concentrations of atrazine were the data showing that dangerously high peak concentrations of atrazine were occurring in these watersheds. Nine watersheds had at least one maximum peak above 50 ppb, and four watersheds had maximum peaks exceeding 100 ppb. Nor were
these peaks one-day anomalies. Four watersheds had peak concentrations above 25 ppb lasting at least three consecutive days, while three of those watersheds had peak concentrations above 50 ppb for at least three consecutive days. Atrazine contamination in one watershed in Indiana peaked at a staggering 237.5 ppb. (See Table 1.) High peak concentrations of atrazine that last for a few days or weeks can pose significant risks to wildlife—especially if they occur during the critical stages of development. (See Chapter 2.) The fact that the peak concentrations usually occur in the spring, which coincides with the period of early life development for aquatic organisms, only intensifies the concern about the contamination.
CANADACANADA
Mississippi
Tulsa
Omaha
Memphis
Wichita
Chicago
Detroit
Columbus
Lexington
Cleveland
LouisvilleSaint Louis
Minneapolis
Oklahoma City
NE-03
IN-07
IL-09
IA-01
IL-02
IL-04
IN-09
MO-03
OH-03
IL-06
IL-01
NE-06
IN-01
OH-04
IL-07
NE-01
IN-08
IN-06
IN-11
KY-01
IL-05
IL-08
IL-03
NE-04
TN-01
MO-02
KY-02
IA-02
IN-05
IN-03
NE-02
IN-10NE-07
MN-01
NE-05
OH-01IN-02
OH-02
IN-04
MO-01
River
KANSAS
MISSOURI
NEBRASKA
IOWA
MINNESOTA
WISCONSIN
ILLINOIS
INDIANA
OHIO
KENTUCKY
TENNESSEE
* NE-04 and NE-07 share thesame watershed. The colorrepresents the sample with the higher mean atrazine value.
* IN-03 and IN-05 share thesame watershed. The colorrepresents the sample with the higher mean atrazine value.
Lake Michigan
Lake Huron
Lake Er ie
AVERAGE ATRAZINE CONCENTRATIONS
0510 75Miles
Watershed Name Watershed ID Mean Watershed Name Watershed ID Mean
Spring Creek IL-03 0.21 Eightmile Creek IN-03 1.49Suger Creek West Fork IL-06 0.34 Rock Creek IN-04 1.52Wolf Creek IA-01 0.38 Vermilion River, North IN-06 1.53Pla e River NE-03 0.43 Mad River OH-03 1.55Whitewater North Fork MN-01 0.47 Whitewater, Nolans Fork IN-08 1.58Pine Creek IL-02 0.55 Wahoo Creek NE-01 1.78Panther Creek IL-05 0.57 Muddy Creek (IL) IL-09 1.80Iroquois River IL-04 0.63 Twomile Creek KY-02 2.08Nishnabotna River IA-02 0.65 Raccoon Creek IN-09 2.53Brashears Creek KY-01 0.66 Horse Creek IL-08 2.72Pecatonica River IL-01 0.67 Middle Loup Creek NE-02 2.77Grindstone Creek IL-07 0.71 Limber Lost Creek IN-05 2.89Mill Creek IN-01 0.71 Muddy Creek (NE) NE-05 3.12Deer Creek OH-04 0.81 Li le Sni-A-Bar Creek MO-03 3.80Kokosing River OH-01 0.86 Eel River IN-02 4.52Crooked Creek NE-06 1.16 Big Blue River, Lower Gage NE-07 4.66White River IN-07 1.26 Li le Pigeon Creek IN-11 7.50Obion Middle Fork TN-01 1.31 Youngs Creek MO-02 7.56Licking River, North Fork OH-02 1.31 South Fabius River MO-01 8.78Brandywine Creek IN-10 1.49 Big Blue River, Upper Gage NE-04 14.31
Average Atrazine Concentra ons (ppb)
Mean Atrazine (ppb)
1.1 - 2.02.1 - 3.03.1 - 6.06.1 - 9.09.1 - 25.0> 25.1
by EPA sampled watersheds
< 1.0
figure 1: Average Regional Atrazine Contamination
Poisoning the Well: How the EPA Is Ignoring Atrazine Contamination in Surface and Drinking Water in the Central United States
8
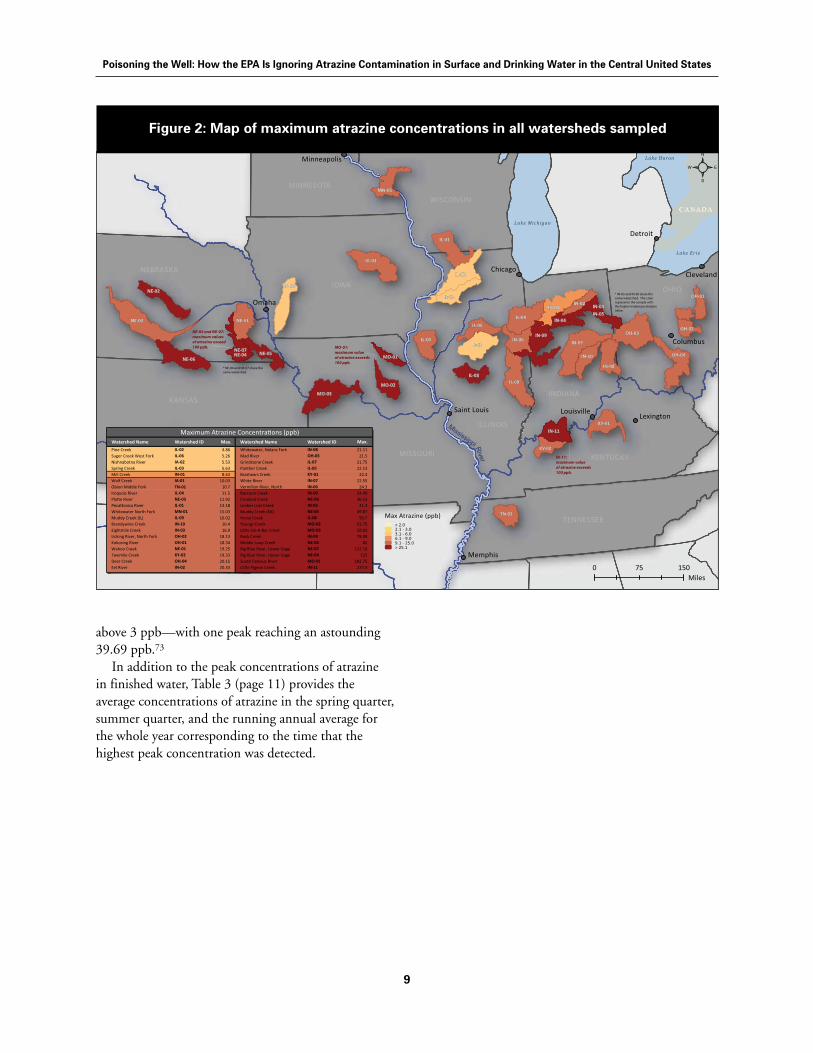
Figure 2 presents a map highlighting the maximum concentrations detected in each watershed sampled in the Ecological Watershed Monitoring Program. To see the sampling results for each state in the monitoring program, see Appendix A.
High Levels of Atrazine in Drinking Water Systems Are Cause for AlarmOur analysis of the drinking water data from theAtrazine Monitoring Program was no less shocking.Based on more than 14,000 samples taken in 2003 and 2004 representing 139 public water systems, we found atrazine was detected in more than 90 percent of the samples each year. These water systems were located in ten states in the Midwest and the South.
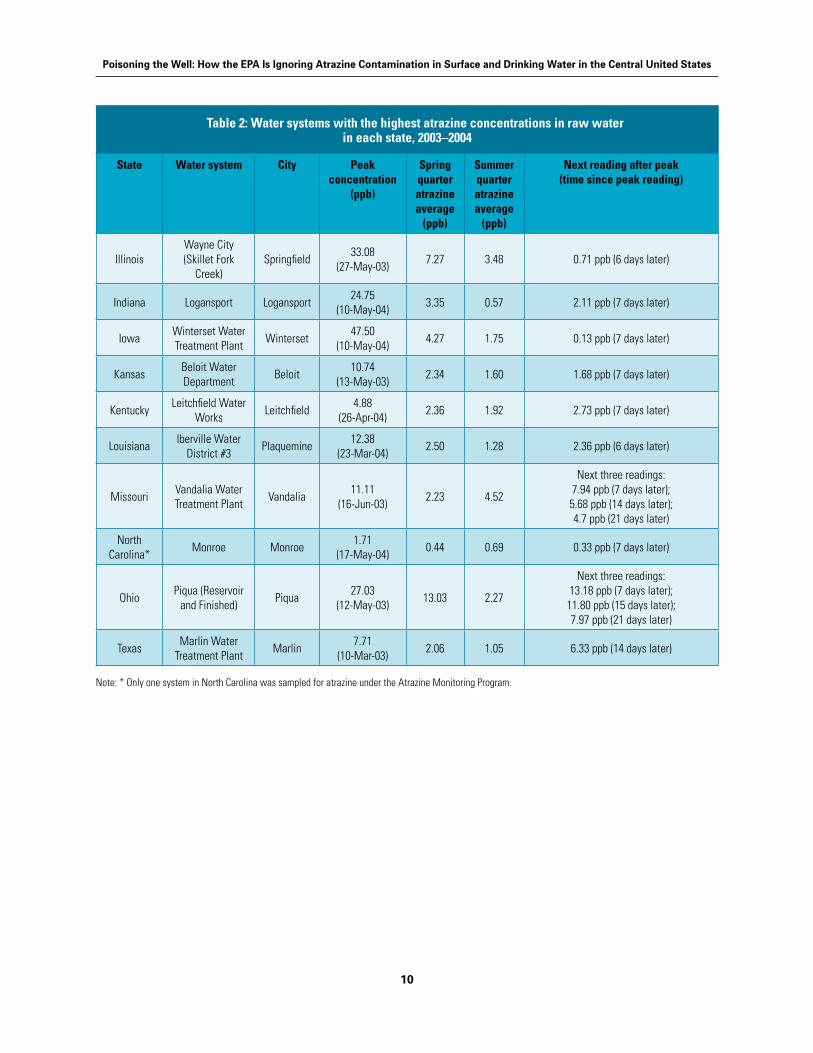
For samples of raw water, we found that 87 sampling sites (representing 81 water systems in nine states) had maximum concentrations above 3 ppb.72 In fact, the Winterset Water Treatment Plant in Winterset, Iowa had a maximum concentration of atrazine in raw water of 47.5 ppb.
In Table 2 (page 10), we identify the water system in each state that had the highest peak concentration
Table 1: Ten watersheds with the highest peak concentrations of atrazine, Ecological Watershed Monitoring Program
Watershed name Sampling year Atrazine concentration (ppb)
Max. peak 75th percentile Average
Little Pigeon Creek, IN 2005 237.50 5.02 18.56
South Fabius River, MO* 2005 182.75 8.82 9.61
Big Blue River, Upper Gage, NE 2006 125.00 5.10 17.61
Big Blue River, Lower Gage, NE 2005 112.19 1.54 7.85
Middle Loup Creek, NE 2006 82.00 0.40 2.79
Rock Creek, IN 2004 78.1 0.68 2.76
Little Sni-A-Bar Creek, MO 2004 59.03 3.88 4.42
Youngs Creek, MO 2004 53.75 9.69 8.89
Horse Creek, IL 2006 50.7 0.85 2.58
Muddy Creek, NE 2005 49.87 1.97 4.67
of atrazine in raw water during the monitoring period, as well as the spring quarter and the summer quarter averages in the year that the peak was measured. The table also shows the concentration of atrazine in the next sample taken and the number of days between readings. In some cases, the peak concentration fell below 3 ppb within six or seven days after the peak reading; however, in a few cases (Missouri, Ohio, and Texas) the high concentrations remained up to two or three weeks after the peak sample was taken. (Note, the table identifies both the atrazine concentration for the sample(s) following the peak concentration and the number of days that sample(s) was taken after the first sample.) Not surprisingly, the quarter with the highest peak concentration of atrazine usually had a higher average concentration.
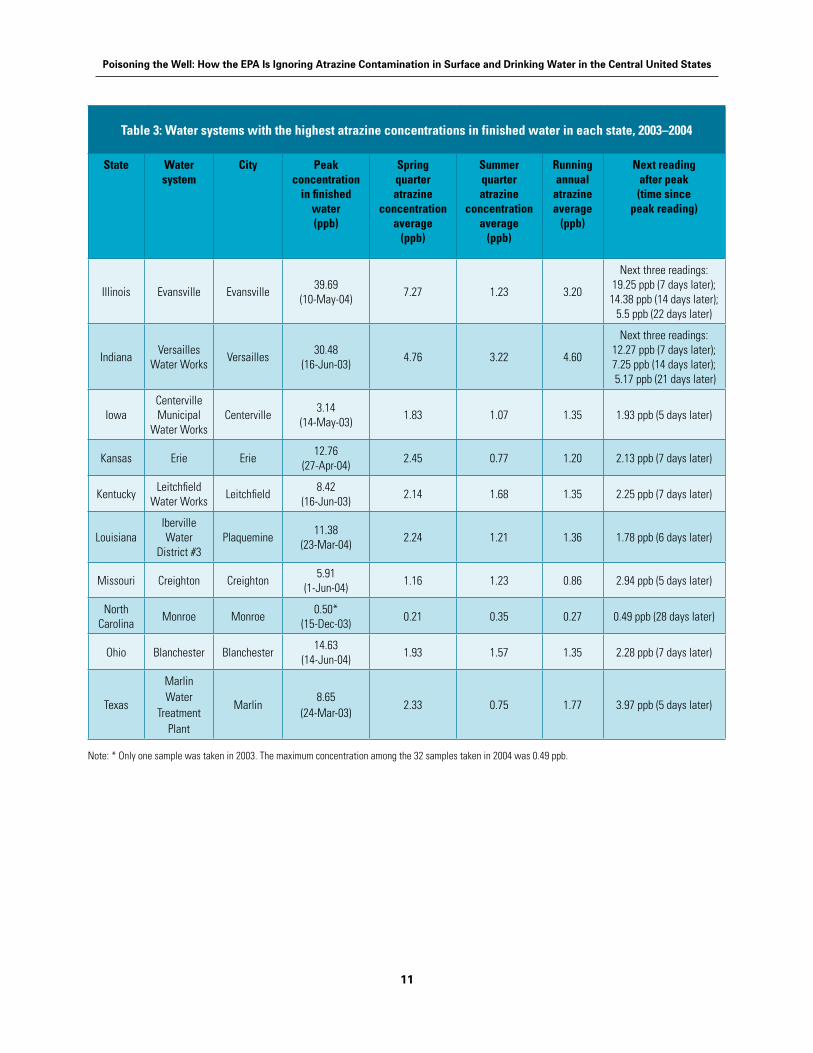
We found three water systems with running annual averages of atrazine in finished water—that is, water ready for human consumption—that exceeded the federal drinking water standard of 3 ppb: Versailles, Indiana (4.60 ppb), Mt. Olive, Illinois (3.79 ppb) and Evansville, Illinois (3.20 ppb). We further found that 56 sampling sites (representing 54 water systems) had one-time peak atrazine concentrations in finished water
* The South Fabious River wastershed had 3 of the 15 highest peak concentrations: 182.75 ppb (2005); 106 ppb (2006); and 82.8 ppb (2006).
Poisoning the Well: How the EPA Is Ignoring Atrazine Contamination in Surface and Drinking Water in the Central United States
9
above 3 ppb—with one peak reaching an astounding 39.69 ppb.73
In addition to the peak concentrations of atrazine in finished water, Table 3 (page 11) provides the average concentrations of atrazine in the spring quarter, summer quarter, and the running annual average for the whole year corresponding to the time that thehighest peak concentration was detected.
CANADA
IN-11: maximum value of atrazine exceeds 100 ppb.
MO-01: maximum value of atrazine exceeds 100 ppb.
NE-04 and NE-07: maximum values of atrazine exceed 100 ppb.
* NE-04 and NE-07 share thesame watershed.
* IN-03 and IN-05 share thesame watershed. The colorrepresents the sample with the higher maximum atrazine value.
Mississippi
Tulsa
Omaha
Memphis
Wichita
Chicago
Detroit
Columbus
Lexington
Cleveland
LouisvilleSaint Louis
Minneapolis
Oklahoma City
River
NE-03
IN-07
IL-09
IA-01
IL-02
IL-04
IN-09
MO-03
OH-03
IL-06
IL-01
NE-06
IN-01
OH-04
IL-07
NE-01
IN-08
IN-06
IN-11
KY-01
IL-05
IL-08
IL-03
NE-04
TN-01
MO-02
KY-02
IA-02
IN-05
IN-03
NE-02
IN-10NE-07
MN-01
NE-05
OH-01IN-02
OH-02
IN-04
MO-01
KANSAS
MISSOURI
NEBRASKA
IOWA
MINNESOTA
WISCONSIN
ILLINOIS
INDIANA
OHIO
KENTUCKY
TENNESSEE
0510 75Miles
by EPA sampled watersheds
Watershed Name Watershed ID Watershed Name Watershed ID Max. Max.
Pine Creek IL-02 4.86 Whitewater, Nolans Fork IN-08 21.11Suger Creek West Fork IL-06 5.26 Mad River OH-03 21.5Nishnabotna River IA-02 5.53 Grindstone Creek IL-07 21.75Spring Creek IL-03 5.63 Panther Creek IL-05 22.13Mill Creek IN-01 8.63 Brashears Creek KY-01 22.4Wolf Creek IA-01 10.03 White River IN-07 22.55Obion Middle Fork TN-01 10.7 Vermilion River, North IN-06 24.3Iroquois River IL-04 11.5 Raccoon Creek IN-09 34.49Pla e River NE-03 11.92 Crooked Creek NE-06 36.13Peca onica River IL-01 13.18 Limber Lost Creek IN-05 41.3Whitewater North Fork MN-01 15.03 Muddy Creek (NE) NE-05 49.87Muddy Creek (IL) IL-09 16.02 Horse Creek IL-08 50.7Brandywine Creek IN-10 16.4 Youngs Creek MO-02 53.75Eightmile Creek IN-03 16.9 Li le Sni-A-Bar Creek MO-03 59.03Licking River, North Fork OH-02 18.13 Rock Creek IN-04 78.08Kokosing River OH-01 18.34 Middle Loup Creek NE-02 82Wahoo Creek NE-01 19.25 Big Blue River, Lower Gage NE-07 112.19Twomile Creek KY-02 19.33 Big Blue River, Upper Gage NE-04 125Deer Creek OH-04 20.15 South Fabious River MO-01 182.75Eel River IN-02 20.33 Li le Pigeon Creek IN-11 237.5
Maximum Atrazine Concentra ons (ppb)
MAXIMUM REGIONAL ATRAZINE CONCENTRATIONS
Max Atrazine (ppb)< 2.02.1 - 3.03.1 - 6.06.1 - 9.09.1 - 25.0> 25.1
figure 2: Map of maximum atrazine concentrations in all watersheds sampled
Poisoning the Well: How the EPA Is Ignoring Atrazine Contamination in Surface and Drinking Water in the Central United States
10
Table 2: Water systems with the highest atrazine concentrations in raw water in each state, 2003–2004
State Water system City Peak concentration
(ppb)
Spring quarter atrazine average
(ppb)
Summer quarter atrazine average
(ppb)
Next reading after peak (time since peak reading)
IllinoisWayne City (Skillet Fork
Creek)Springfield
33.08 (27-May-03)
7.27 3.48 0.71 ppb (6 days later)
Indiana Logansport Logansport24.75
(10-May-04)3.35 0.57 2.11 ppb (7 days later)
IowaWinterset Water Treatment Plant
Winterset47.50
(10-May-04)4.27 1.75 0.13 ppb (7 days later)
KansasBeloit Water Department
Beloit10.74
(13-May-03)2.34 1.60 1.68 ppb (7 days later)
KentuckyLeitchfield Water
WorksLeitchfield
4.88 (26-Apr-04)
2.36 1.92 2.73 ppb (7 days later)
LouisianaIberville Water
District #3Plaquemine
12.38 (23-Mar-04)
2.50 1.28 2.36 ppb (6 days later)
MissouriVandalia Water Treatment Plant
Vandalia11.11
(16-Jun-03)2.23 4.52
Next three readings: 7.94 ppb (7 days later); 5.68 ppb (14 days later); 4.7 ppb (21 days later)
North Carolina*
Monroe Monroe1.71
(17-May-04)0.44 0.69 0.33 ppb (7 days later)
OhioPiqua (Reservoir
and Finished)Piqua
27.03 (12-May-03)
13.03 2.27
Next three readings: 13.18 ppb (7 days later); 11.80 ppb (15 days later); 7.97 ppb (21 days later)
TexasMarlin Water
Treatment PlantMarlin
7.71 (10-Mar-03)
2.06 1.05 6.33 ppb (14 days later)
Note: * Only one system in North Carolina was sampled for atrazine under the Atrazine Monitoring Program.
Poisoning the Well: How the EPA Is Ignoring Atrazine Contamination in Surface and Drinking Water in the Central United States
11
Table 3: Water systems with the highest atrazine concentrations in finished water in each state, 2003–2004
State Water system
City Peak concentration
in finished water(ppb)
Spring quarter atrazine
concentration average
(ppb)
Summer quarter atrazine
concentration average
(ppb)
Running annual
atrazine average
(ppb)
Next reading after peak (time since
peak reading)
Illinois Evansville Evansville39.69
(10-May-04)7.27 1.23 3.20
Next three readings: 19.25 ppb (7 days later); 14.38 ppb (14 days later);
5.5 ppb (22 days later)
IndianaVersailles
Water WorksVersailles
30.48(16-Jun-03)
4.76 3.22 4.60
Next three readings: 12.27 ppb (7 days later); 7.25 ppb (14 days later); 5.17 ppb (21 days later)
IowaCenterville Municipal
Water WorksCenterville
3.14(14-May-03)
1.83 1.07 1.35 1.93 ppb (5 days later)
Kansas Erie Erie12.76
(27-Apr-04)2.45 0.77 1.20 2.13 ppb (7 days later)
KentuckyLeitchfield
Water WorksLeitchfield
8.42(16-Jun-03)
2.14 1.68 1.35 2.25 ppb (7 days later)
LouisianaIberville Water
District #3Plaquemine
11.38(23-Mar-04)
2.24 1.21 1.36 1.78 ppb (6 days later)
Missouri Creighton Creighton5.91
(1-Jun-04)1.16 1.23 0.86 2.94 ppb (5 days later)
North Carolina
Monroe Monroe0.50*
(15-Dec-03)0.21 0.35 0.27 0.49 ppb (28 days later)
Ohio Blanchester Blanchester14.63
(14-Jun-04)1.93 1.57 1.35 2.28 ppb (7 days later)
Texas
Marlin Water
Treatment Plant
Marlin8.65
(24-Mar-03)2.33 0.75 1.77 3.97 ppb (5 days later)
Note: * Only one sample was taken in 2003. The maximum concentration among the 32 samples taken in 2004 was 0.49 ppb.
Poisoning the Well: How the EPA Is Ignoring Atrazine Contamination in Surface and Drinking Water in the Central United States
12
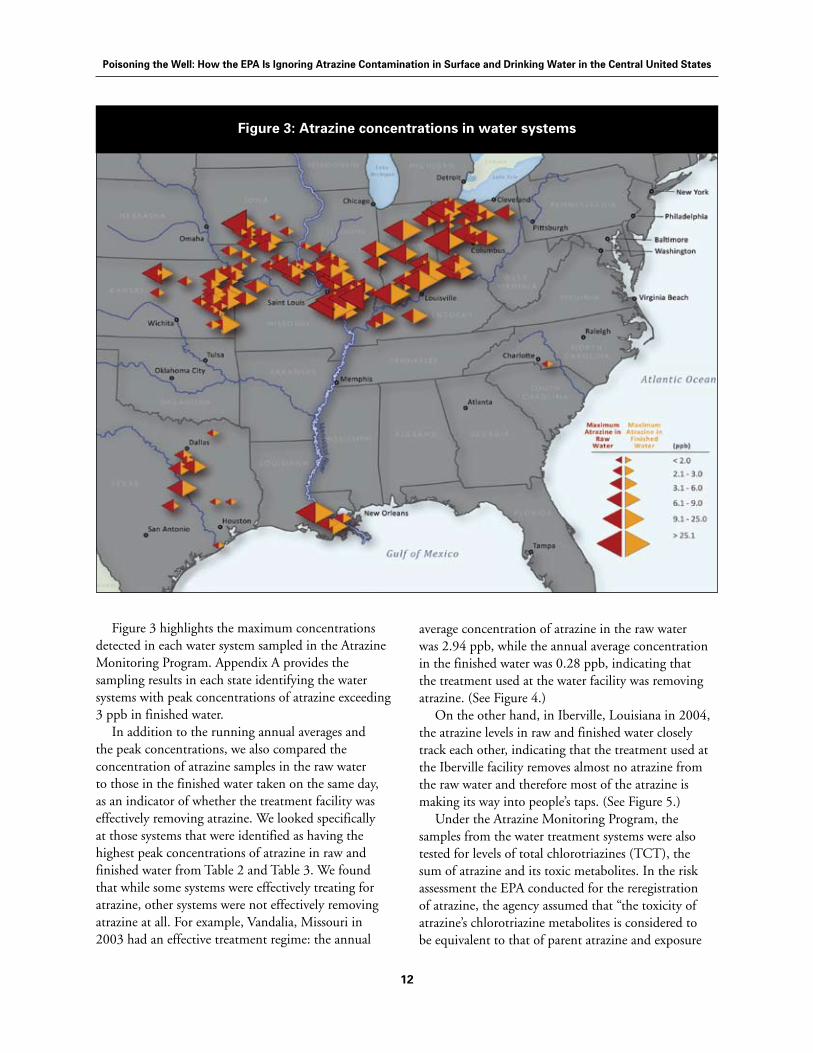
Figure 3 highlights the maximum concentrations detected in each water system sampled in the Atrazine Monitoring Program. Appendix A provides the sampling results in each state identifying the water systems with peak concentrations of atrazine exceeding 3 ppb in finished water.
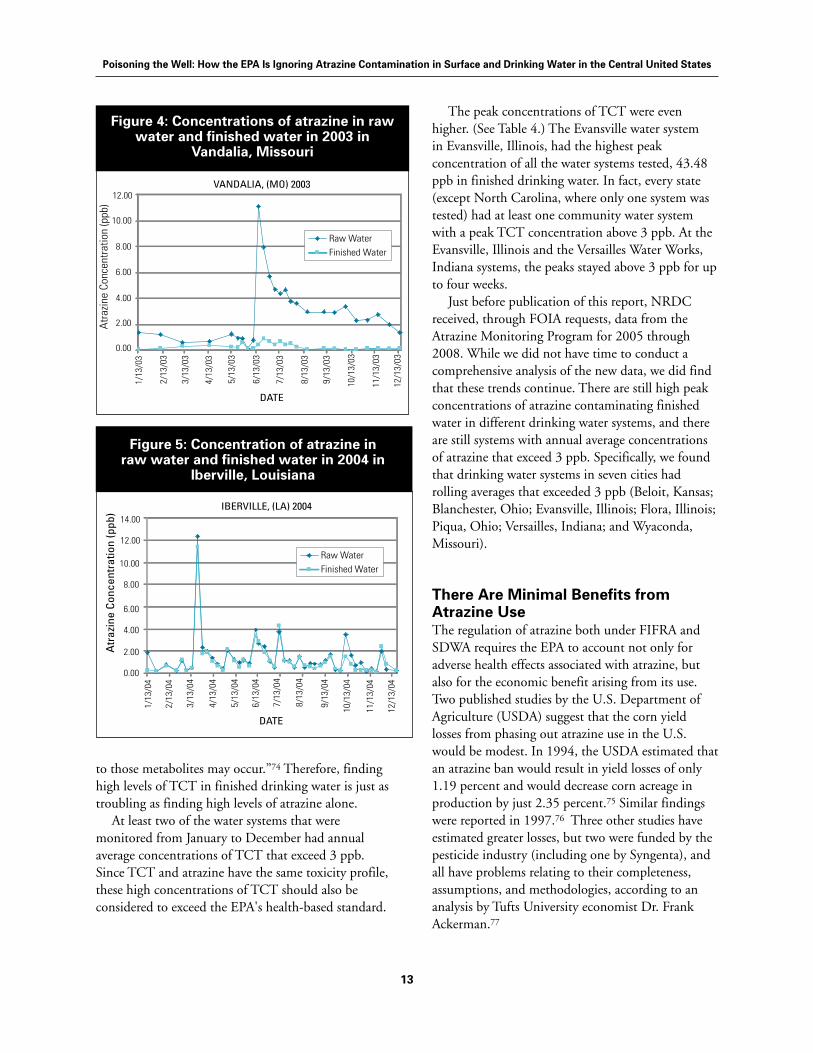
In addition to the running annual averages and the peak concentrations, we also compared the concentration of atrazine samples in the raw water to those in the finished water taken on the same day, as an indicator of whether the treatment facility was effectively removing atrazine. We looked specifically at those systems that were identified as having the highest peak concentrations of atrazine in raw and finished water from Table 2 and Table 3. We found that while some systems were effectively treating for atrazine, other systems were not effectively removing atrazine at all. For example, Vandalia, Missouri in 2003 had an effective treatment regime: the annual
figure 3: Atrazine concentrations in water systems
average concentration of atrazine in the raw water was 2.94 ppb, while the annual average concentration in the finished water was 0.28 ppb, indicating that the treatment used at the water facility was removing atrazine. (See Figure 4.)
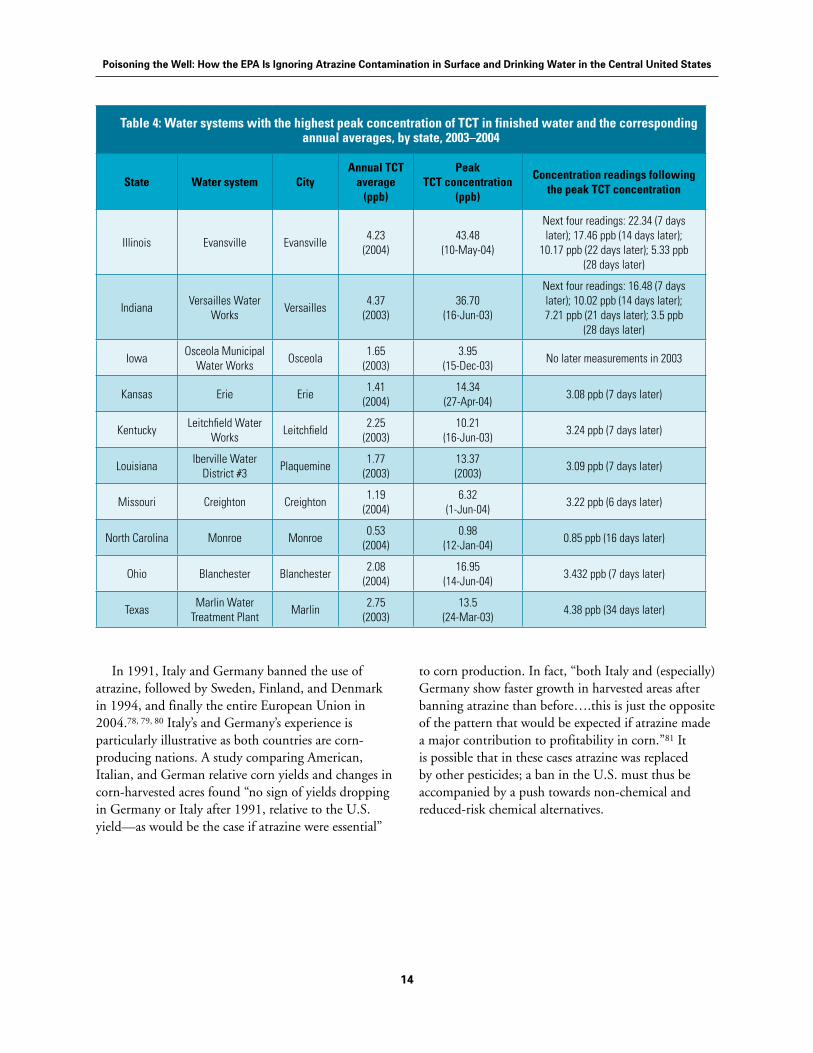
On the other hand, in Iberville, Louisiana in 2004, the atrazine levels in raw and finished water closely track each other, indicating that the treatment used at the Iberville facility removes almost no atrazine from the raw water and therefore most of the atrazine is making its way into people’s taps. (See Figure 5.)
Under the Atrazine Monitoring Program, the samples from the water treatment systems were also tested for levels of total chlorotriazines (TCT), the sum of atrazine and its toxic metabolites. In the risk assessment the EPA conducted for the reregistration of atrazine, the agency assumed that “the toxicity of atrazine’s chlorotriazine metabolites is considered to be equivalent to that of parent atrazine and exposure
Poisoning the Well: How the EPA Is Ignoring Atrazine Contamination in Surface and Drinking Water in the Central United States
13
Atr
azin
e Co
ncen
trat
ion
(ppb
)
Raw Water
Finished Water
DATE
DATE
0.00
2.00
4.00
6.00
8.00
10.00
12.00
14.00
0.00
2.00
4.00
6.00
8.00
10.00
12.00
IBERVILLE, (LA) 2004
VANDALIA, (MO) 2003
1/13
/03
2/13
/03
3/13
/03
4/13
/03
5/13
/03
6/13
/03
7/13
/03
8/13
/03
9/13
/03
10/1
3/03
11/1
3/03
12/1
3/03
Atr
azin
e C
once
ntra
tion
(ppb
)
1/13
/04
2/13
/04
3/13
/04
4/13
/04
5/13
/04
6/13
/04
7/13
/04
8/13
/04
9/13
/04
10/1
3/04
11/1
3/04
12/1
3/04
Raw Water
Finished Water
Atr
azin
e Co
ncen
trat
ion
(ppb
)
Raw Water
Finished Water
DATE
DATE
0.00
2.00
4.00
6.00
8.00
10.00
12.00
14.00
0.00
2.00
4.00
6.00
8.00
10.00
12.00
IBERVILLE, (LA) 2004
VANDALIA, (MO) 2003
1/13
/03
2/13
/03
3/13
/03
4/13
/03
5/13
/03
6/13
/03
7/13
/03
8/13
/03
9/13
/03
10/1
3/03
11/1
3/03
12/1
3/03
Atr
azin
e C
once
ntra
tion
(ppb
)
1/13
/04
2/13
/04
3/13
/04
4/13
/04
5/13
/04
6/13
/04
7/13
/04
8/13
/04
9/13
/04
10/1
3/04
11/1
3/04
12/1
3/04
Raw Water
Finished Water
figure 4: Concentrations of atrazine in raw water and finished water in 2003 in
vandalia, Missouri
to those metabolites may occur.”74 Therefore, finding high levels of TCT in finished drinking water is just as troubling as finding high levels of atrazine alone.
At least two of the water systems that were monitored from January to December had annual average concentrations of TCT that exceed 3 ppb. Since TCT and atrazine have the same toxicity profile, these high concentrations of TCT should also be considered to exceed the EPA's health-based standard.
figure 5: Concentration of atrazine in raw water and finished water in 2004 in
Iberville, Louisiana
The peak concentrations of TCT were even higher. (See Table 4.) The Evansville water system in Evansville, Illinois, had the highest peak concentration of all the water systems tested, 43.48 ppb in finished drinking water. In fact, every state (except North Carolina, where only one system was tested) had at least one community water system with a peak TCT concentration above 3 ppb. At the Evansville, Illinois and the Versailles Water Works, Indiana systems, the peaks stayed above 3 ppb for up to four weeks.
Just before publication of this report, NRDC received, through FOIA requests, data from the Atrazine Monitoring Program for 2005 through 2008. While we did not have time to conduct a comprehensive analysis of the new data, we did find that these trends continue. There are still high peak concentrations of atrazine contaminating finished water in different drinking water systems, and there are still systems with annual average concentrations of atrazine that exceed 3 ppb. Specifically, we found that drinking water systems in seven cities had rolling averages that exceeded 3 ppb (Beloit, Kansas; Blanchester, Ohio; Evansville, Illinois; Flora, Illinois; Piqua, Ohio; Versailles, Indiana; and Wyaconda, Missouri).
There Are Minimal Benefits from Atrazine UseThe regulation of atrazine both under FIFRA and SDWA requires the EPA to account not only for adverse health effects associated with atrazine, but also for the economic benefit arising from its use. Two published studies by the U.S. Department of Agriculture (USDA) suggest that the corn yield losses from phasing out atrazine use in the U.S. would be modest. In 1994, the USDA estimated that an atrazine ban would result in yield losses of only 1.19 percent and would decrease corn acreage in production by just 2.35 percent.75 Similar findings were reported in 1997.76 Three other studies have estimated greater losses, but two were funded by the pesticide industry (including one by Syngenta), and all have problems relating to their completeness, assumptions, and methodologies, according to an analysis by Tufts University economist Dr. Frank Ackerman.77
Poisoning the Well: How the EPA Is Ignoring Atrazine Contamination in Surface and Drinking Water in the Central United States
14
Table 4: Water systems with the highest peak concentration of TCT in finished water and the corresponding annual averages, by state, 2003–2004
State Water system CityAnnual TCT
average (ppb)
PeakTCT concentration
(ppb)
Concentration readings following the peak TCT concentration
Illinois Evansville Evansville4.23
(2004)43.48
(10-May-04)
Next four readings: 22.34 (7 days later); 17.46 ppb (14 days later);
10.17 ppb (22 days later); 5.33 ppb (28 days later)
IndianaVersailles Water
WorksVersailles
4.37(2003)
36.70(16-Jun-03)
Next four readings: 16.48 (7 days later); 10.02 ppb (14 days later); 7.21 ppb (21 days later); 3.5 ppb
(28 days later)
IowaOsceola Municipal
Water WorksOsceola
1.65(2003)
3.95(15-Dec-03)
No later measurements in 2003
Kansas Erie Erie1.41
(2004)14.34
(27-Apr-04)3.08 ppb (7 days later)
KentuckyLeitchfield Water
WorksLeitchfield
2.25(2003)
10.21(16-Jun-03)
3.24 ppb (7 days later)
LouisianaIberville Water
District #3Plaquemine
1.77(2003)
13.37(2003)
3.09 ppb (7 days later)
Missouri Creighton Creighton1.19
(2004)6.32
(1-Jun-04)3.22 ppb (6 days later)
North Carolina Monroe Monroe0.53
(2004)0.98
(12-Jan-04)0.85 ppb (16 days later)
Ohio Blanchester Blanchester2.08
(2004)16.95
(14-Jun-04)3.432 ppb (7 days later)
TexasMarlin Water
Treatment PlantMarlin
2.75(2003)
13.5 (24-Mar-03)
4.38 ppb (34 days later)
In 1991, Italy and Germany banned the use of atrazine, followed by Sweden, Finland, and Denmark in 1994, and finally the entire European Union in 2004.78, 79, 80 Italy’s and Germany’s experience is particularly illustrative as both countries are corn-producing nations. A study comparing American, Italian, and German relative corn yields and changes in corn-harvested acres found “no sign of yields dropping in Germany or Italy after 1991, relative to the U.S. yield—as would be the case if atrazine were essential”
to corn production. In fact, “both Italy and (especially) Germany show faster growth in harvested areas after banning atrazine than before….this is just the opposite of the pattern that would be expected if atrazine made a major contribution to profitability in corn.”81 It is possible that in these cases atrazine was replaced by other pesticides; a ban in the U.S. must thus be accompanied by a push towards non-chemical and reduced-risk chemical alternatives.
Poisoning the Well: How the EPA Is Ignoring Atrazine Contamination in Surface and Drinking Water in the Central United States
15
CHAPTER 4
Atrazine Monitoring is Misleading and Its Regulation is Insufficient
NRDC’s analysis of atrazine sampling data indicate that there are troubling
concentrations of atrazine in the surface and drinking waters in the
Midwest and the South. However, what makes these findings even more
troubling is that the EPA relied on a fatally flawed analytical method to conclude that
there was no cause for concern.
The EPA is Ignoring the Atrazine ProblemThe most glaring flaw in the EPA’s analysis of the monitoring data for community water systems is its exclusive focus on long-period running averages, rather than peak atrazine concentrations. The EPA decided to focus on a 90-day running average TCT concentration to decide whether to order atrazine manufacturers to take risk mitigation measures and they ignored the peak concentrations of atrazine detected. However, the occurrence of peaks of atrazine contamination may be just as important as the level of contamination over many months. Overwhelming data described in this report show that amphibians raised in atrazine-contaminated water for days or weeks show serious and irreversible effects, particularly on male reproductive development. Because human fetuses also develop in a completely aquatic environment, we are naturally concerned about the risk of adverse human health effects associated with atrazine contamination. Rather
than be concerned about finding 54 public drinking water systems with peak concentrations of atrazine in the finished water exceeding 3 ppb, the EPA ignored those findings and instead focused on 90-day average concentrations of TCT which never exceeded the screening level in any public water system. Relying on the average concentration of TCT obfuscates the real problem—that is, that high peak concentrations of atrazine are occurring in finished drinking water. (See box on page 16 for example.)
This flaw is compounded by the EPA’s decision to set the level of concern at a 90-day average of 37.5 ppb of TCT, despite the fact that TCT has a similar toxicological profile as atrazine itself, according to its own findings. Therefore, rather than using its own health-based standard of an annual average of 3 ppb of atrazine in drinking water, the agency based its determinations on a weaker level of concern for atrazine metabolites in raw water to determine that no water systems were of concern.
Poisoning the Well: How the EPA Is Ignoring Atrazine Contamination in Surface and Drinking Water in the Central United States
16
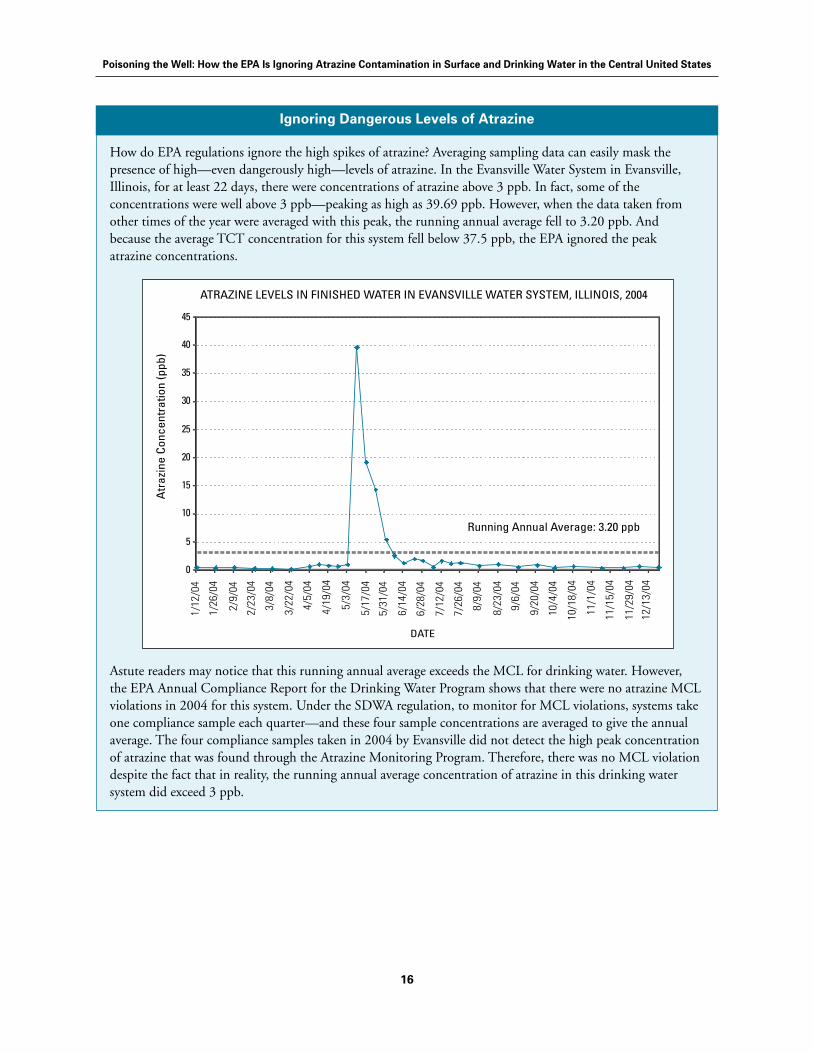
How do EPA regulations ignore the high spikes of atrazine? Averaging sampling data can easily mask the presence of high—even dangerously high—levels of atrazine. In the Evansville Water System in Evansville, Illinois, for at least 22 days, there were concentrations of atrazine above 3 ppb. In fact, some of the concentrations were well above 3 ppb—peaking as high as 39.69 ppb. However, when the data taken from other times of the year were averaged with this peak, the running annual average fell to 3.20 ppb. And because the average TCT concentration for this system fell below 37.5 ppb, the EPA ignored the peak atrazine concentrations.
Astute readers may notice that this running annual average exceeds the MCL for drinking water. However, the EPA Annual Compliance Report for the Drinking Water Program shows that there were no atrazine MCL violations in 2004 for this system. Under the SDWA regulation, to monitor for MCL violations, systems take one compliance sample each quarter—and these four sample concentrations are averaged to give the annual average. The four compliance samples taken in 2004 by Evansville did not detect the high peak concentration of atrazine that was found through the Atrazine Monitoring Program. Therefore, there was no MCL violation despite the fact that in reality, the running annual average concentration of atrazine in this drinking water system did exceed 3 ppb.
DATE
Atr
azin
e C
once
ntra
tion
(ppb
)
ATRAZINE LEVELS IN FINISHED WATER IN EVANSVILLE WATER SYSTEM, ILLINOIS, 2004
Running Annual Average: 3.20 ppb
1/12
/04
1/26
/04
2/9/
04
2/23
/04
3/8/
04
3/22
/04
4/5/
04
4/19
/04
5/3/
04
5/17
/04
5/31
/04
6/14
/04
6/28
/04
7/12
/04
7/26
/04
8/9/
04
8/23
/04
9/6/
04
9/20
/04
10/4
/04
10/1
8/04
11/1
/04
11/1
5/04
11/2
9/04
12/1
3/04
0
5
10
15
20
25
30
35
40
45
Ignoring Dangerous Levels of Atrazine
Poisoning the Well: How the EPA Is Ignoring Atrazine Contamination in Surface and Drinking Water in the Central United States
17
The EPA’s interpretation of the data did not account for the fact that 54 water systems had spikes of atrazine in finished drinking water that exceeded 3 ppb. Because the drinking water standard is based on an annual average, these peak concentrations were not regulatory violations. Even the drinking water MCL standard is problematic. It is based on a running annual average, meaning that high levels exceeding 3 ppb in the spring and summer (when most atrazine contamination occurs) could be averaged with low readings from the winter and fall and this average would then hide levels of atrazine that should be of concern to the agency.82
Monitoring Programs Were Not Designed to find the Biggest ProblemsAntoher troubling aspect of the EPA’s ignoring the peak concentration data is the fact that its water-monitoring program was not specifically designed to detect pesticide peaks. Atrazine is rapidly transported to surface water with rain runoff. If a water sample is taken the day before rain washes over a treated field, it will likely miss a large influx of pesticide into a stream, whereas a sample taken the day of or day after a rainstorm will be more likely to reflect a high peak of pesticide contamination, especially if the treated field is close by and if the pesticide was applied recently.83 The peaks in surface water may remain in the monitored area for hours, days, or even weeks, depending on the amount of rainfall, the duration of rainfall, and the flow rate of the surface water. Or they may flush down the stream fairly rapidly. It is much more likely that a monitoring program would miss peak concentrations than catch them. Therefore, findings of high peak concentrations in monitoring data should be treated seriously—not averaged away.
Screening Levels Are Too PermissiveThe EPA has relied on a computer model to determine whether the amount of atrazine exposure in a watershed would be likely to cause changes in the plants and plant community structure in a particular watershed. For watersheds that exceeded the screening level, the EPA would run the model and, based on the results, determine whether to require atrazine manufacturers to implement certain
risk mitigation measures in that watershed. The model—called the Comprehensive Aquatic Systems Model (CASM)—calculates the “community similarity index” (CSI),84 which reflects the average change in biomass for individual plant species at a site. If atrazine exposure at a site is expected to result in a change in CSI of 5 percent or more, atrazine concentrations exceed the EPA’s “level of concern.” If the level of concern is exceeded during two years of monitoring, atrazine manufacturers must employ an existing Total Maximum Daily Load program, as established by the federal Clean Water Act and implemented by states, or establish a similar program, to reduce atrazine contamination by continuing to monitor concentrations in surface water, identifying the sources of pollution, reaching out to users, managing uses in the watershed and allocating atrazine loads between sources.85 If the computer model predicts a CSI change greater than 15 percent in any monitoring year, atrazine manufacturers must immediately implement risk mitigation measures, without waiting for another year of data.
Using this model, the EPA determined that atrazine manufacturers must undertake mitigation measures in only two watersheds of the forty that were monitored: South Fabius River and Youngs Creek (both in Missouri). These two sites were the only two to exceed the CSI 5 percent level of concern for two years in the EPA's original assessment. However, the only mitigation measures being taken for the South Fabius River and Youngs Creek watersheds are outreach efforts to inform farmers about best management practices for reducing atrazine contamination and continued monitoring for atrazine levels. No sites exceeded the 15 percent change screening level. Just before this report went to press the EPA made the determination—after additional review of its model—that the Big Blue River watershed in Upper Gage County also exceeded the Agency's level of concern and therefore ordered similar mitigation measures.
The EPA’s reliance on the CASM was misplaced. One major flaw with the CASM-derived level of concern is that it is based on the effects of atrazine contamination on plants in the aquatic system, which the EPA says is the most sensitive endpoint. By focusing on plant effects, the EPA is ignoring the toxic effects of atrazine at lower doses on the aquatic animals themselves. In other words, the CSI 5 percent level of
Poisoning the Well: How the EPA Is Ignoring Atrazine Contamination in Surface and Drinking Water in the Central United States
18
concern does not account for the endocrine-disrupting and other harmful effects of atrazine contamination at very low doses that have been demonstrated in the literature.
Secondly, even if the impact on photosynthesis were the only appropriate endpoint to consider, the model itself has many problems. The United States Fish and Wildlife Service (FWS) has critiqued the CASM model.86 The FWS noted that the EPA’s own verification efforts showed that the model had an 8 percent rate of false negatives for predicting significant adverse effects (i.e., 8 percent of the time the model predicted no effects when, in fact, significant adverse effects could be expected) and a 16 percent rate of false negatives for slight effects.87, 88 The FWS concluded that “based on our current understanding, this model may not be conservative enough in its estimation of adverse effects thresholds to thoroughly predict effects to listed [threatened or endangered] species.”89 Indeed, both the FWS and the National Marine Fisheries Service noted that the scientific evidence indicates that atrazine concentrations below these screening levels are likely to have negative effects on aquatic plant communities.90, 91
Given these two major flaws, the levels of concern set by the EPA are simply too high to be protective of the watershed. For example, exposure to 21 ppb of atrazine for as little as two days has been shown to impair development of the reproductive organs in male and female frogs.92, 93 We discovered that 5 of the 40 watersheds sampled had at least one peak atrazine concentration above 21 ppb for two or more days. Only three of these watersheds were flagged by the CASM for mitigation, leaving the other three without any response.
As of the date of this report, the EPA is considering two alternate computer models to determine which watersheds will need risk mitigation. However, the EPA is still setting its level of concern based on effects on aquatic plants and is ignoring endocrine-disrupting effects on wildlife.
The EPA Monitoring Program Ignores More Than 1000 vulnerable Watersheds The Ecological Watershed Monitoring Program was created ostensibly to focus on the watersheds that are most vulnerable to atrazine contamination. For
the Ecological Watershed Monitoring Program, the EPA identified 1,172 watersheds that are at highest risk from atrazine contamination. However, rather than sample all of those watersheds, in a private deal with the EPA, Syngenta agreed to monitor atrazine pollution in only 40 streams, which were selected for monitoring to “give a statistical representation of the third tier of 1,172 such watersheds predicted to be most potentially vulnerable.”94 As such, more than 96 percent of the streams that the EPA has identified as being at highest risk were not monitored by Syngenta.
Based on the results of the Ecological Monitoring, the EPA made a preliminary estimate that 101 (9 percent) of the 1,172 most vulnerable watersheds may exceed its level of concern for two years, therefore needing mitigation measures.95 Yet, to date, the EPA has not taken steps to order atrazine manufacturers to address these watersheds. In fact, the EPA has done very little to address the many unmonitored watersheds in the Midwest and the South that are highly vulnerable to routine atrazine contamination. New ecological models now being considered by the EPA may identify additional watersheds for mitigation.96
Poisoning the Well: How the EPA Is Ignoring Atrazine Contamination in Surface and Drinking Water in the Central United States
19
Recommendation 1: The United States should phase out the use of atrazine. Atrazine use is not essential to maintaining high yields of corn and its phase-out would not significantly decrease the number of acres of corn under production. As such, atrazine should fail the cost-benefit evaluation required for pesticide registration because the economic benefits of the pesticide must outweigh its risks to human and environmental health. Given this evidence, it is difficult to justify the widespread contamination of the United States’ surface and drinking water caused by the continued use of atrazine from either a legal or public policy perspective. Atrazine use should therefore be phased out in the United States. However, it should be noted that in many cases other hazardous pesticides are substituted for atrazine. Rather than just risk-trading from one toxic chemical to another, NRDC recommends reducing overall chemical use.
Recommendation 2: Farmers should be encouraged to take take interim steps to reduce their atrazine use.There are concrete steps that farmers can take to reduce their reliance on atrazine and other pesticides. Farmers
CHAPTER 5
Recommendations
The widespread atrazine contamination in the waters of the Midwestern and
Southern United States is a serious problem. These levels of exposure are
likely having significant effects on wildlife populations. And there is concern
for the potential human health effects from elevated levels in drinking water. In
contrast, there are few, if any, benefits of continued atrazine use. NRDC makes the
following recommendations to address this problem.
often choose pesticides not because they are more effective than other farming methods, but because they are familiar and cheap. As with many pesticides, farmers can often use less atrazine than the label recommendations, especially by using targeted spraying or by applying atrazine in a narrow band in crop rows.97 Applying atrazine after the corn has emerged could reduce runoff by half.98
Using Integrated Pest Management (IPM) for weed management relies on weed prevention, field monitoring, and the use of effective lower risk control methods. Farmers set an action threshold—the point at which the number of weeds reaches a level that indicates that control is necessary, and control methods are utilized only when the action threshold is exceeded. These methods include mechanical and natural methods of weed control and low-risk pesticides. Conventional pesticides are used only as a last resort.99 IPM techniques may include, among others:
4 Cover crops: Winter cover crops are a prevention strategy that can greatly reduce weed growth by competing with weeds for light, water, and nutrients, and protect soil from erosion. Legumes
Poisoning the Well: How the EPA Is Ignoring Atrazine Contamination in Surface and Drinking Water in the Central United States
20
used as cover crops can also increase nitrogen in the soil.100
4Mechanical weed control methods: Rotary hoes can be used after weed seeds have germinated, but before the weeds emerge, to significantly reduce weed growth; cultivators can remove emergent weeds before they become established. 101
4Delayed fertilizer application: Delaying application of half of the fertilizer used on corn crops until after the ears emerge can deprive weeds of nutrients during key periods of growth, while ensuring that these nutrients are available to the crop when it is best able to absorb them.102, 103
4 Intercrops: Alternating rows of different crops helps reduce weeds and results in higher crop yields.104
4 Crop rotation: Weed density and pesticide use can be reduced substantially by shifting from a two-year corn/soy rotation, typical of Midwestern agriculture, to a multi-species three- or four-year rotation that adds species such as alfalfa and oats.105, 106
Recommendation 3: The EPA should monitor all vulnerable watersheds and require all future monitoring plans to identify worst case scenarios.Any future monitoring plans should be designed to identify the worst case scenarios occurring in vulnerable watersheds and in public water systems. Monitoring programs should be designed to increase the chances of detecting contamination if it exists. This would include requiring samples to be taken within a certain time after big rainstorms and after fields have been treated with atrazine, which would increase the likelihood of finding out the severity of the atrazine problem.
Recommendation 4: The EPA should publish monitoring results for each watershed and public water system sampled.Monitoring results on the watersheds and the public water systems that were sampled under the two different monitoring programs were first made available through Freedom of Information Act requests and through litigation. However, the public has a right to know if there is an atrazine problem which they must treat, especially people who live downstream of atrazine-treated fields and who may
have sensitive subpopulations—such as pregnant women and infants—in their households. A publicly available website posting sampling data as they are analyzed, or even regular reports about spikes of atrazine contamination, would at least provide more information than the public receives now. Furthermore, the data must be presented comprehensively, rather than just in summary form. For example, drinking water systems that have been monitored must be identified by name, along with the monitoring results.
Recommendation 5: The public should use home water filtration systems and demand transparency of information from their water utilities.NRDC recommends that consumers who are concerned about atrazine in their drinking water use a water filter certified by NSF International to meet NSF/American National Standard Institute (ANSI) Standard 53 for VOC (volatile organic compounds) reduction. This standard includes some faucet-mounted charcoal filters. While systems that meet this certification do not always eliminate atrazine entirely, to earn NSF certification a filter must be able to reduce atrazine levels in drinking water from 9 ppb of atrazine to 3 ppb.107
Make our Drinking Water Safer Consumers should contact their local water utility and ask what type of treatment they use, whether they are treating for atrazine and otherpesticides, and how effectively atrazine is being removed from their raw water.
Consumers should then provide this information to NRDC through our website www.simplesteps.org to help us to collect information about how public water systems are treating for contaminants.
Poisoning the Well: How the EPA Is Ignoring Atrazine Contamination in Surface and Drinking Water in the Central United States
21
Endnotes
EXECUTIVE SUMMARY
1 Throughout this report we refer to atrazine as both an herbicide and a pesticide. Pesticide is the overarching term for describing a substance used to kill an unwanted organism. An herbicide is a type of pesticide used specifically to kill plants.
2 Gilliom RJ, et al. 2006. The Quality of Our Nation’s Waters: Pesticides in the Nation’s Streams and Ground Water, 1992–2001. U.S. Geological Survey Circular 1291.
3 A running annual average is calculated by averaging the data from one date with all the data from the previous 365 days, then averaging the data from the next point and the previous 365 days, and so on.
4 Hayes TB, et al. 2002. Atrazine-induced hermaphroditism at 0.1 ppb in American leopard frogs (Rana pipiens): laboratory and field evidence. Environ Health Perspect 111:568–575.
5 Colborn T. 2006. A case for revisiting the safety of pesticides: a closer look at neurodevelopment. Environ Health Perspect 114(1):10–17. Review.
6 Colborn T. 2004. Commentary: setting aside tradition when dealing with endocrine disruptors. ILAR J 45(4):394–400. Review.
7 Finished water refers to drinking water that is ready for consumption.
8 U.S. EPA. 2007. Preliminary Interpretation of the Ecological Significance of Atrazine Stream-Water Concentrations Using a Statistically-Designed Monitoring Program. In Support of an Interim Reregistration Eligibility Decision on Atrazine. Submitted to the FIFRA Scientific Advisory Panel for Review and Comment (November). http://epa.gov/oscpmont/sap/meetings/2007/december/whitepaper_sap.pdf. Accessed August 12, 2008.
CHAPTER 1
9 U.S. EPA. 2003. Interim Reregistration Eligibility Decision for Atrazine. Washington, DC: U.S. EPA (January 31).
10 Ibid.
11 Gilliom RJ, et al. 2006. The Quality of Our Nation’s Waters: Pesticides in the Nation’s Streams and Ground Water, 1992–2001. U.S. Geological Survey Circular 1291.
12 Ibid.
13 These data were obtained as part of an agreement to settle litigation brought by NRDC and as the result of several requests under the Freedom of Information Act (FOIA).
14 7 U.S.C. § 136a(c)(5)(C)
15 7 U.S.C. § 136(bb)
16 7 U.S.C. § 136a-1(a).
17 7 U.S.C. § 136d.
18 42 U.S.C. § 300g-1.
19 42 U.S.C. § 300g-1(b).
20 Sass JB and Colangelo A. 2006. European union bans atrazine, while the United States negotiates continued use. Int J Occup Environ Health (Jul–Sep) 12(3): 260–267.
21 U.S. EPA. 2006. Atrazine: Finalization of Interim Reregistration Eligibility Decision and Completion of Tolerance Reassessment and Reregistration Eligibility Process (April), p. 9. http://www.epa.gov/oppsrrd1/REDs/atrazine_combined_docs.pdf.
22 U.S. EPA. 1991. Federal Register Notice (56 FR 3526). January 30.
23 World Health Organization. 2003. Atrazine in Drinking-water; Background Document for Development of WHO Guidelines for Drinking-water Quality. WHO/SDE/WSH/03.04/32. https://www.who.int/water_sanitation_health/dwq/atrazinerev0305.pdf.
24 Giupponi C. 2001. The Substitution of Hazardous Molecules in Production Processes: The Atrazine Case Study in Italian Agriculture. Milan, Italy: Fondazione Eni Enrico Mattei.
25 Chynoweth E. 1992. Atrazine gets reprieve from European Commission. Chemical Week, London, U.K. (July 22).
26 Only four pesticides have a cutoff of 0.3 ppb: aldrin, dieldrin, heptachlor, and heptachlor epoxide. European Community Council Directive on the Quality of Water Intended for Human Consumption, 98/83/EC, November 3, 1998, Annex I. 1998; Commission E. Review report for the active substance atrazine; Finalized in the Standing Committee on the Food Chain and Animal Health at its meeting on 3 October 2003 in support of a decision concerning the non-inclusion of atrazine in Annex I of Directive 91/414/EEC, and the withdrawal of authorization for plant protection products containing this active substance; European Commission Health and Consumer Protection Directorate-General; 2003; SANCO/10496/2003-final.
27 U.S. EPA. 2006. Atrazine Reregistration Eligibility Decision (RED). April. http://www.epa.gov/oppsrrd1/REDs/atrazine_combined_docs.pdf.
28 Sass JB and Colangelo A. 2006. European Union bans atrazine, while the United States negotiates continued use. Int J Occup Environ Health (Jul–Sep) 12(3): 260–267.
Poisoning the Well: How the EPA Is Ignoring Atrazine Contamination in Surface and Drinking Water in the Central United States
22
CHAPTER 2
29 Colborn T. 2006. A case for revisiting the safety of pesticides: a closer look at neurodevelopment. Environ Health Perspect 114(1):10–17. Review.
30 Colborn T. 2004. Commentary: setting aside tradition when dealing with endocrine disruptors. ILAR J 45(4):394–400. Review.
31 Grandjean P, et al. 2008. The Faroes statement: human health effects of developmental exposure to chemicals in our environment. Basic Clin Pharmacol Toxicol (Feb) 102(2): 73–5.
32 Colborn T. 2004. Neurodevelopment and endocrine disruption. Environ Health Perspect (Jun) 112(9): 944–9. Review; Crain DA, et al. 2008. Female reproductive disorders: the roles of endocrine-disrupting compounds and developmental timing. Fertil Steril 90(4): 911–40. Review; Main KM, Skakkebaek NE, and Toppari J. 2009. Cryptorchidism as part of the testicular dysgenesis syndrome: the environmental connection. Endocr Dev 14:167–73.
33 Grandjean P, et al. 2008. The Faroes statement: human health effects of developmental exposure to chemicals in our environment. Basic Clin Pharmacol Toxicol (Feb) 102(2): 73–5.
34 Kiesecker JM. 2002. Synergism between trematode infection and pesticide exposure: a link to amphibian limb deformities in nature? Proc Natl Acad Sci USA 99:9900–4.
35 Rohr JR and Palmer B. 2005. Aquatic herbicide exposure increases salamander desiccation risk eight months later in a terrestrial environment. Environ Toxicol Chem 24:1253–1258.
36 Moore A, et al. 2007. The impact of a pesticide on migratory activity and olfactory function in Atlantic salmon (Salmo salar L.) smolts. Aquaculture 273:350–359.
37 Rohr JR, et al. 2006. Exposure, post-exposure, and density-mediated effects of atrazine on amphibians: Breaking down net effects into their parts. Environmental Health Perspect 114:46–50.
38 There are at least two demonstrated mechanisms of toxicity for atrazine; one is activation of the enzyme aromatase which results in increased conversion of testosterone to estrogens (i.e. males become females), and the other is up-regulation of luteinizing hormone which is thought to be the mechanism for mammary tumor formation observed in lab rats treated with atrazine. Cooper RL, et al. 2007. Atrazine and reproductive function: mode and mechanism
of action studies. Birth Defects Res B Dev Reprod Toxicol (Apr) 80(2): 98–112. Review.
39 Much of the discussion of the science has been published and is freely accessible in the following open-access citation: Sass JB and Colangelo A. 2006. European union bans atrazine, while the United States negotiates continued use. Int J Occup Environ Health (Jul–Sep) 12(3): 260–267.
40 Tavera-Mendoza L, et al. 2002. Response of the amphibian tadpole (Xenopus laevis) to atrazine during sexual differentiation of the testis. Environ Toxicol Chem 21:527–531.
41 Tavera-Mendoza L, et al. 2002. Response of the amphibian tadpole Xenopus laevis to atrazine during sexual differentiation of the ovary. Environ Toxicol Chem 21:1264–1267.
42 Hayes TB, et al. 2002. Atrazine-induced hermaphroditism at 0.1 ppb in American leopard frogs (Rana pipiens): laboratory and field evidence. Environ Health Perspect 111:568–575.
43 Kniewald J, et al. 2000. Disorders of male rat reproductive tract under the influence of atrazine. J Appl Toxicol 20:61–8.
44 Swan SH, et al. 2003. Semen quality in relation to biomarkers of pesticide exposure. Environ Health Perspect 111:1478–84.
45 Swan SH. 2006. Semen quality in fertile US men in relation to geographical area and pesticide exposure. Int J Androl 29:62–8.
46 Curwin BD, et al. Urinary and hand wipe pesticide levels among farmers and nonfarmers in Iowa. 2005. J Expo Anal Environ Epidemiol (Nov) 15(6): 500–8.
47 Letter from Marjorie A. Nelson, U.S. Fish and Wildlife Service, to Arthur-Jean B. Williams, U.S. EPA, RE: Informal Consultation on the Effects of Atrazine Re-registration on the Endangered Alabama Sturgeon and Endangered Dwarf Wedgemussel. Dated February 11, 2008. FWS/AES/DCHRS/032435.
48 Ibid.
49 Letter from James H. Lecky, National Marine Fisheries Service, to Arthur-Jean Williams, U.S. EPA, RE: Request for Endangered Species Act Section 7 Informal Consultation on the Environmental Protection Agency’s Re-Registration and Use of Atrazine in the Chesapeake Bay Watershed, September 1, 2006. Dated May 29, 2007.
50 International Agency for Research on Cancer (IARC). 1999. Monographs of the evaluation of carcinogenic risks to humans. IARC Monograph 73:59–113.
Poisoning the Well: How the EPA Is Ignoring Atrazine Contamination in Surface and Drinking Water in the Central United States
23
51 Birnbaum LS and Fenton SE. 2003. Cancer and developmental exposure to endocrine disruptors. Environ Health Perspect 111:389–94; Rayner JL, et al. 2007. Atrazine-induced reproductive tract alterations after transplacental and/or lactational exposure in male Long-Evans rats. Toxicol Appl Pharmacol (Feb 1) 218(3): 238–48. Epub 2006 Nov 23. Rayner JL, Enoch RR and Fenton SE. 2005. Adverse effects of prenatal exposure to atrazine during a critical period of mammary gland growth. Toxicol Sci (Sep) 87(1): 255–66. Epub 2005 Jun 2.
52 Enoch RR, et al. 2006. Mammary gland development as a sensitive end point after acute prenatal exposure to an atrazine metabolite mixture in female Long-Evans rats. Environ Health Perspect (Apr) 115(4):541–7. Epub 2006 Dec 18. PubMed PMID: 17450222; PubMed Central
53 Sass JB and Colangelo A. 2006. European union bans atrazine, while the United States negotiates continued use. Int J Occup Environ Health (Jul–Sep) 12(3): 260–267.
54 IARC. 1999. Monographs of the evaluation of carcinogenic risks to humans. IARC Monograph 73:59–113.
55 Ibid.
56 U.S. EPA. 2006. Atrazine: Finalization of Interim Reregistration Eligibility Decision and Completion of Tolerance Reassessment and Reregistration Eligibility Process (April), p. 9. http://www.epa.gov/oppsrrd1/REDs/ atrazine_combined_docs.pdf.
57 U.S. EPA. 2003. FIFRA Scientific Advisory Panel meeting: Characterization of Epidemiology Data Relating to Prostate Cancer and Exposure to Atrazine (EPA Dockets - OPP-2003-0186). Transmittal of Meeting Minutes of the FIFRA Scientific Advisory Panel Meeting Held July 17, 2003 (August 29).
58 U.S. EPA. 2000. FIFRA Scientific Advisory Panel Report. Atrazine: hazard and dose-response assessment and characterization. SAP Report No. 2000–05. Washington, DC (June 27). http://www.epa.gov/scipoly/sap/2000/index.htm.
59 Chevre N, et al. 2006. Including mixtures in the determination of water quality criteria for herbicides in surface water. Environ Sci Technol (Jan 15) 40: 426–35.
60 Christin MS, et al. 2004. Effects of agricultural pesticides on the immune system of Xenopus laevis and Rana pipiens. Aquat Toxicol (Mar 30) 67: 33–43.
61 De Roos AJ, et al. 2003. Integrative assessment of multiple pesticides as risk factors for non-Hodgkin’s lymphoma among men. Occup Environ Med 60:E11.
62 Hayes TB, et al. 2006. Pesticide mixtures, endocrine disruption, and amphibian declines: Are we underestimating the impact? Environ Health Perspect (Apr) 114(S-1): 40–50. doi:10.1289/ehp.8051.
63 Rohr JR, et al. 2008. Agrochemicals increase trematode infections in a declining amphibian species. Nature (Oct 30) (455)7217: 1235–9.
64 Gilliom RJ, et al. 2006. The Quality of Our Nation’s Waters: Pesticides in the Nation’s Streams and Ground Water, 1992–2001. U.S. Geological Survey Circular 1291.
65 Ibid.
66 U.S. EPA. 2006. Atrazine: Finalization of Interim Reregistration Eligibility Decision and Completion of Tolerance Reassessment and Reregistration Eligibility Process (April), p. 68. http://www.epa.gov/oppsrrd1/REDs/atrazine_combined_docs.pdf.
CHAPTER 3
67 U.S. EPA. Atrazine Updates. http://www.epa.gov/oppsrrd1/reregistration/atrazine/atrazine_update.htm
68 U.S. EPA. Atrazine Ecological Study — Analytical Data. Data provided by the U.S. EPA to NRDC as a result of a settlement agreement signed with the EPA in 2006 resulting from a lawsuit NRDC brought against the EPA for unlawfully approving the continued use of atrazine without adequately considering its risks to endangered species.
69 U.S. EPA. 2008. Atrazine Updates. http://www.epa.gov/pesticides/reregistration/atrazine/atrazine_update.htm. Accessed August 14.
70 Merrit A. 2004. FIFRA Section 6(a)(2) Annual Report for Atrazine and Total Chlorotriazine (TCT) Monitoring Data from the 2003 Voluntary Atrazine Monitoring Program (VMP) and the 2003 Atrazine Monitoring Program (AMP) for Selected Community Water Systems (CWS) on Surface Water Sources [Syngenta Number T007009-04]. Greensboro, NC: Syngenta Crop Protection.
71 Merrit A. 2005. FIFRA Section 6(a)(2) Annual Report for Atrazine and Total Chlorotriazine (TCT) Monitoring Data from the 2004 Atrazine Monitoring Program (AMP) for Selected Community Water Systems (CWS) on Surface Water Sources [Syngenta Number T003233-05]. 2005. Greensboro, NC: Syngenta Crop Protection.
72 While these maximum levels exceeded 3 ppb, they are not a violation of federal drinking water standards. The drinking water standard for atrazine is based on the average of at least four quarterly finished water samples, not the maximum concentration in raw water. However, these
Poisoning the Well: How the EPA Is Ignoring Atrazine Contamination in Surface and Drinking Water in the Central United States
24
values indicate the widespread occurrence of elevated levels of atrazine in drinking water sources.
73 The peak spike occurred in Evansville water system in Illinois. While these maximum levels are not by themselves a violation of the federal drinking water standard for atrazine, which is based on annual average concentrations, they indicate the widespread occurrence of elevated levels of atrazine in treated drinking water.
74 U.S. EPA. 2002. Revised Human Health Risk Assessment for Atrazine (April 16); U.S. EPA. 2002. Addendum to the Revised Human Health Risk Assessment for Atrazine (January 31). Table 2.
75 Ribaudo MO and, Bouzaher A. 1994. Atrazine: Environmental Characteristics and Economics of Management. United States Department of Agriculture (USDA) Agricultural Economic Report. Number 699. Washington, DC: USDA.
76 Ribaudo MO. 1997. Economic and environmental effects associated with reducing the use of atrazine: An example of cross-disciplinary research. J Agricultural and Applied Economics 29:87–97.
77 Ackerman F. 2007. The economics of atrazine. International Journal of Occupational and Environmental Health 13(4):437–45.
78 Ibid.
79 Sass JB and Colangelo A. 2006. European union bans atrazine, while the United States negotiates continued use. Int J Occup Environ Health (Jul–Sep) 12(3): 260–267. www.ijoeh.com/pfds/IJOEH_1203_Sass.pdf
80 European Commission. 2003. Opinion of the Scientific Committee on Plants on Specific Questions from the Commission Concerning the Evaluation of Atrazine in the context of Council Directive 91/414/EEC. Brussels, Belgium: Health and Consumer Protection Directorate-General, Scientific Committee on Plants. SCP/ATRAZINE/002-Final.
81 Ackerman F. 2007. The economics of atrazine. International Journal of Occupational and Environmental Health 13(4):437–45.
CHAPTER 4
82 Compliance with the Safe Drinking Water Act is based on the requirement that a water system only take one sample each quarter, that is, four samples per year. Those systems in the Atrazine Monitoring Program took samples more frequently, but for SDWA compliance, only the four “compliance” samples are used in the calculation.
83 Personal communication with Jennifer Sass, NRDC and Robert Gilliom, USGS
84 This is also called Steinhaus Similarity Index.
85 U.S. EPA. 2003. Revised Atrazine Interim Reregistration Eligibility Decision (IRED). Washington, DC: U.S. EPA. October 31. http://www.epa.gov/pesticides/reregistration/atrazine/atrazineadd.pdf
86 Letter from Marjorie A. Nelson, U.S. Fish and Wildlife Service, to Arthur-Jean B. Williams, U.S. EPA, RE: Informal Consultation on the Effects of Atrazine Re-registration on the Endangered Alabama Sturgeon and Endangered Dwarf Wedgemussel. Dated February 11, 2008. FWS/AES/DCHRS/032435.
87 Ibid.
88 U.S. EPA. 2006. Risks of Atrazine Use to Federally Listed Endangered Barton Springs Salamanders (Eurycea sosorum), Appendix B: Supporting Information for the Aquatic Community-Level Threshold Concentrations (August 22). http://epa.gov/oppfead1/endanger/litstatus/effects/atrazine/appendix-b.pdf.
89 Letter from Marjorie A. Nelson, U.S. Fish and Wildlife Service, to Arthur-Jean B. Williams, U.S. EPA, RE: Informal Consultation on the Effects of Atrazine Re-registration on the Endangered Alabama Sturgeon and Endangered Dwarf Wedgemussel. Dated February 11, 2008. FWS/AES/DCHRS/032435, p. 10.
90 Ibid.
91 Letter from James H. Lecky, National Marine Fisheries Service, to Arthur-Jean Williams, U.S. EPA, RE: Request for Endangered Species Act Section 7 Informal Consultation on the Environmental Protection Agency’s Re-Registration and Use of Atrazine in the Chesapeake Bay Watershed, September 1, 2006. Dated May 29, 2007.
92 Tavera-Mendoza L, et al. 2002. Response of the amphibian tadpole (Xenopus laevis) to atrazine during sexual differentiation of the testis. Environ Toxicol Chem 21:527–531.
93 Tavera-Mendoza L, et al. 2002. Response of the amphibian tadpole Xenopus laevis to atrazine during sexual differentiation of the ovary. Environ Toxicol Chem 21:1264–1267.
94 U.S. EPA. 2006. Atrazine Reregistration Eligibility Decision (RED). April. http://www.epa.gov/oppsrrd1/REDs/atrazine_combined_docs.pdf
95 U.S. EPA. 2007. Preliminary Interpretation of the Ecological Significance of Atrazine Stream-Water Concentrations Using a Statistically-Designed Monitoring Program. In Support of an Interim Reregistration
Poisoning the Well: How the EPA Is Ignoring Atrazine Contamination in Surface and Drinking Water in the Central United States
25
Eligibility Decision on Atrazine. Submitted to the FIFRA Scientific Advisory Panel for Review and Comment (November). http://epa.gov/oscpmont/sap/meetings/2007/december/whitepaper_sap.pdf. Accessed August 12, 2008.
96 FIFRA Scientific Advisory Panel Public Meeting. The Ecological Significance of Atrazine Effects on Primary Producers in Surface Water Streams in the Corn and Sorghum Growing Region of the United States (Part II). Federal Register: February 20, 2009 (Volume 74, Number 33)
CHAPTER 5
97 Land Stewardship Project. Land Stewardship Project Fact Sheet #18: Atrazine—Alternatives to a Controversial Herbicide. http://www.landstewardshipproject.org/pdf/factsheets/18_atrazine_alternatives_2009.pdf. Accessed May 4, 2009.
98 Ibid.
99 U.S. EPA. 2008. Integrated Pest Management (IPM) Principles. Factsheet. http://www.epa.gov/opp00001/factsheets/ipm.htm. Accessed August 15, 2008.
100 Liebman M and Davis AS. 2000. Integration of soil, crop and weed management in low-external-input farming systems. Weed Res 40:27–47.
101 Franti TG, et al. Agricultural Management Practices to Reduce Atrazine in Surface Water. 1996. Cooperative Extension, Institute of Agriculture and Natural Resources, University of Nebraska-Lincoln. http://www.p2pays.org/ref/09/08380.htm. Accessed August 14, 2008.
102 Liebman M and Davis AS. 2000. Integration of soil, crop and weed management in low-external-input farming systems. Weed Res 40:27–47.
103 National Research Council. 2000. Professional Societies and Ecologically Based Management. Proceedings of a workshop. Washington, DC. National Academies Press.
104 Liebman M and Davis AS. 2000. Integration of soil, crop and weed management in low-external-input farming systems. Weed Res 40:27–47.
105 Liebman M, et al. 2008. Argomic and economic performance characteristics of conventional and low-external-input cropping systems in the central corn belt. Agronomy J 100: 600–610.
106 Westerman P, et al. 2005. Are many little hammers effective? Velvetleaf (Abutilon theophrasti) population dynamics in two- and four-year crop rotation systems. Weed Science 53:382–392.
107 National Science Foundation (NSF). Contaminant Testing Protocols. http://www.nsf.org/consumer/drinking_water/dw_contaminant_protocols.asp?program=WaterTre