How Teacher Evaluation is Affected by Class ... · PDF fileAffected by Class Characteristics:...
12
How Teacher Evaluation is Affected by Class Characteristics: Are Observations Biased? PRESENTED AT THE ANNUAL MEETING OF THE ASSOCIATION FOR EDUCATION FINANCE AND POLICY (AEFP) ON FEBRUARY 27, 2015 IN WASHINGTON, DC Valeriy Lazarev Denis Newman Empirical Education Inc. Cite as: Lazarev, V., & Newman, D. (2015). How Teacher Evaluation is Affected by Class Characteristics: Are Observations Biased? Paper presented at the Annual Meeting of AEFP, Washington, DC, February 27, 2015. Available from http://ssrn.com/abstract=2574897
Transcript of How Teacher Evaluation is Affected by Class ... · PDF fileAffected by Class Characteristics:...
How Teacher Evaluation is
Affected by Class Characteristics:
Are Observations Biased? PRESENTED AT THE ANNUAL MEETING OF THE ASSOCIATION FOR
EDUCATION FINANCE AND POLICY (AEFP) ON FEBRUARY 27, 2015
IN WASHINGTON, DC
Valeriy Lazarev
Denis Newman
Empirical Education Inc.
Cite as: Lazarev, V., & Newman, D. (2015). How Teacher Evaluation is Affected by Class Characteristics: Are Observations Biased? Paper
presented at the Annual Meeting of AEFP, Washington, DC, February 27, 2015. Available from http://ssrn.com/abstract=2574897

Background Classroom observation is an important component of teacher evaluation systems. Most states are
implementing systems that assign a composite score to each teacher based on weights assigned to several
different measures. Policy discussions often address this weighting, with many states adopting formulas
with high weights for the summative scores from observations conducted by school principals or other
administrators. Given the weighting of this one measure, it is important to ensure the validity of
observation rubrics and equitability of the resulting teacher rankings.
In this paper, we address the problem of observation scores being affected by characteristics of the
students in the class being taught. We explore this in two phases. First, we demonstrate an alternative to
the common (often implicit) assumption that the components or elements of the observation score are
measuring a single underlying concept and all have the same relevance to any personnel decision that is
to be based on the evaluation score. Second, we show how the multifaceted nature of observations can be
used to better understand how observation scores are affected by class characteristics. Most observation
rubrics in wide use, such as the Framework for Teaching (FFT), have been designed and are used as
universal instruments. They are applied without any modifications in classrooms at different grades
levels, in different subjects, and with students of widely different abilities, backgrounds, and resources.
This implicit assumption of instrument invariance is however questionable. Furthermore, the nature of the
invariance may be different for different components of the instrument. The goal of the analyses reported
here is to provide a stronger basis for making observations a useful part of teacher evaluation by
addressing these facets of variability.
Several recent studies have pointed to the problems with the application of observation instruments in the
context of teacher evaluation, in particular significant correlations between teachers’ observation scores
and characteristics of classes they teach. Using the data collected by Measures of Effective Teaching (MET)
project, Mihaly & McCaffrey (2014) reported negative correlations between teachers’ observation scores
and grade level. They formulated several testable hypotheses concerning the causes of this but found
empirical support for none of them. Lazarev and Newman (2013), using the same dataset, showed that
relationships between observation and value-added scores vary by grade and subject. For example,
observation items related to classroom management tend to be linearly related to value-added in the
elementary school, but the relationship becomes non-linear in middle range of observation scores being
correlated to value-added only for lower performing teachers.
While the above-mentioned studies point to the problems with vertical alignment of observation scores,
two recent studies that used data from local teacher evaluation systems elucidate issues with the use of an
observation instrument within a single cohort. In particular, Whitehurst, Chingos, and Lindquist (2014)
report a positive association between the teacher’s average observation score and the class-average pretest
score, while Chaplin, Gill , Thompkins, and Miller (2014) report negative correlations between the score
and class shares of minority and free lunch-eligible students.
While the nature of these relationships remains unclear, these results can be interpreted as suggesting that
teachers may benefit unfairly from being assigned a more able group of students. Observation scores
therefore could be adjusted for the disparity in class characteristics to produce more robust results.
Whitehurst et al. (2014) show that adjusting the observation scores for class characteristics reduces what

they term “observation bias,” i.e., this operation reduces the differences in average observation scores
between quintiles of classroom distribution of pretest scores.
As a policy suggestion, however, such an adjustment may be inappropriate if teacher assignment is not
random. If less proficient teachers are assigned to classes made up of lower-performing students or if
schools serving low-income communities are less successful in retaining effective teachers, then such an
adjustment would undermine the validity of an evaluation system by obscuring the real differences
among teachers. Rigorous statistical correction for non-random teacher-class matching could be
technically challenging and possibly not feasible at all because it would require collection of data beyond
the scope of a teacher evaluation system.
It is also possible that the observed empirical regularities result from a measurement problem. In pre-
certification training courses, observers encounter a relatively small number of cases used in observer
calibration exercises typically conducted in person or with video-recorded lessons used as examples of
teaching practice. Adapting the underlying meaning of instrument categories to specifics of various
classrooms may require more experience than can be obtained in the course of a single academic study or
in one or two rounds of annual observation for evaluation purposes.
Study Design and Data In this study, we focus on the association between observation scores and class characteristics, and
attempt to develop an alternative approach to teacher observation data that may lead to results that are
easier to interpret and more robust against disparities across classrooms. While the earlier studies have
been limited to the analysis of summative observation scores obtained by averaging item (component)
scores, we take a step back to examine disaggregated component data and revise the aggregation strategy.
Evidence abounds that components of observation instruments vary in their statistical characteristics and
are interrelated in complex ways.1 If so, simple averaging or summation of items scores is unlikely to
produce an effective composite metric. Moreover, it is possible that observation rubrics reveal not the
single concept of teacher effectiveness but several independent aspects of teaching practice.
The hypothesis that we test in this study is that components of observation instruments vary in their
sensitivity to certain class characteristics and that it may be possible to design composite metrics such that
some of them are uncorrelated with class characteristics. Specifically, we consider correlations between
class characteristics and factor scores obtained from the model developed in our earlier study of latent
structure of teacher evaluation data (Lazarev & Newman, 2014). We report our analysis and findings in
two steps. We start by describing the factor analysis that we can use to break apart relevant facets of the
classroom observations. We then apply these factors in examining the relation between observations and
class characteristics.
1 See Chaplin et al. (2014) and Lazarev, et al. (2014) for recent examples of analyses of variation and
correlation of observation data in teacher evaluation systems.

In this research program, we have been working primarily with the data collected by the MET project—
the largest existing corpus of teacher evaluation data collected in multiple large districts using a common
set of instruments—student academic growth metric, observation rubric, and student survey (Kane &
Staiger, 2012). By design, the composition of this dataset resembles data from teacher evaluation systems
adopted by many states, with three instruments and multiple elementary measurements averaged to
obtain component scores. Instead of limiting the analysis to a few aggregate scores for each teacher, we
compiled a dataset with disaggregated measurements – survey items and observational components. In
addition to value added scores assigned to each teacher, this dataset includes 20 observable components
of two generic observation rubrics2 —8 of the FFT3 and 12 of CLASS protocol—and 36 items of the Tripod
student survey. These 36 items are categorized into seven broad characteristics of teacher performance as
assessed by their students, the so called “7 Cs”. These 7Cs categories include: Care, Clarify, Control,
Challenge, Captivate, Confer, and Consolidate. Each category includes between three and eight yes/no
questions. The dataset therefore contains a total of 57 variables—elementary measurements—for each
teacher.
The MET project estimated two types of value-added models (VAM): one based on state test (distinct test
in each of the five participating states) and another based on a study administered test (BAM for math and
SAT9 for ELA). In our analyses, we only use the VAM based on the study administered tests because the
underlying tests are better aligned with Common Core and are the same for all teachers in the dataset.
Analysis and Results: Factor Analysis In the initial study, we developed a three-factor model of teacher evaluation data using 57 evaluation
variables from the MET project database, which included observation component scores from two rubrics
(FFT and CLASS), teacher value-added, and Tripod student survey items. For this analysis, we limited our
sample to middle school teachers (grades 6-8), which constitutes a majority of records and cannot be
pooled together with the elementary grades because of the differences in the composition of the survey.4
The model was obtained applying a target rotation such that only one factor should have a non-zero
loading of the teacher value-added score. The rationale behind this approach is that it would allow
separating evaluation metrics into those associated with short-term student achievement gains as
measured by the standardized test results vs. those that may be related to longer-term cognitive and non-
cognitive outcomes. We labeled the three factors “Effective”, “Constructive”, and “Positive” dimensions
of teaching based on the interpretation of loadings. Figure 1 schematically represents associations between
2 MET also used three subject-specific rubrics. We do not use those because they cannot be pooled
together for the purposes of our analysis. Videos were scored by multiple teams of observers, so that most
teachers have scores from several rubrics. We include in the dataset all teachers who have both CLASS
and FFT scores. 3 FFT has 22 components but only 8 of them are observable in the classroom, whereas the remaining 14 are
based on administrator assessments of lesson plans, contribution to the school community, etc. Only the
former eight components were observed and scored by the MET project. 4 We have established that correlations between measurements differ between grade levels and that
measurements, especially teacher observation and value added scores, are more closely interrelated in
middle grades than in elementary grades (Lazarev & Newman, 2013).

factors and evaluation items (where survey items are represented by groups known as “7Cs” and
observation items are the observable elements of FFT), and Table 1 lists factor loadings for observation
rubric items.

“Effective” factor is the factor associated with the value-added score by design. It is also associated with
observational items reflecting teachers’ skills in managing classroom and student behavior and following
procedures. Among the student survey items, only questions relating to the notion of “Control” (one of
Tripod’s “seven Cs”), were associated with this factor. The “Constructive” factor was associated with the
classroom observational items reflecting mastery of such pedagogical devices as instructional dialog,
feedback, and discussion, although some observational items are shared between the two factors. The

“Positive” factor consisted primarily of student survey items, many of which deal with the teacher’s
connection to students and students’ positive feelings.
Two of the three factors—“effective” and “constructive”—are of particular interest for the next step of this
study because both are associated primarily with observation items, but only the first of them is correlated
with value-added scores. Since the “effective” factor is associated with value added and the
“constructive” factor is associated with advanced pedagogy, it is reasonable to expect that the former will
be more strongly correlated with incoming student achievement level (pretest), while the latter will be
more strongly associated with grade level.
ANALYSIS AND RESULTS: CLASS CHARACTERISTICS AND FACTORS OF OBSERVATIONS
We started this phase of our analysis by replicating the analysis in Whitehurst et al. (2014). Figure 2 shows
that MET data produce—for both FFT and CLASS—associations between class-average incoming
achievement level and teacher observation scores, similar to those reported in Whitehurst et al. (2014) for
an unspecified observation rubric. Table 2 reports linear correlation coefficients (R) between FFT and
CLASS composite scores (component averages), on the one hand, and incoming student achievement level
(pretest) and grade level on the other. Both composite metrics have similar positive statistical association
with the pretest and negative association with the grade level.
-
5
10
15
20
25
30
35
Low High Low High Low High
Teac
he
r o
bse
rvat
ion
sco
res,
%
low
an
d h
igh
sco
rin
g te
ach
ers
Whitehurst et al. MET: FFT* MET: CLASS*
Incoming Achievement Level of Teacher's Students
Teacher observation scores ranking:
Low
High
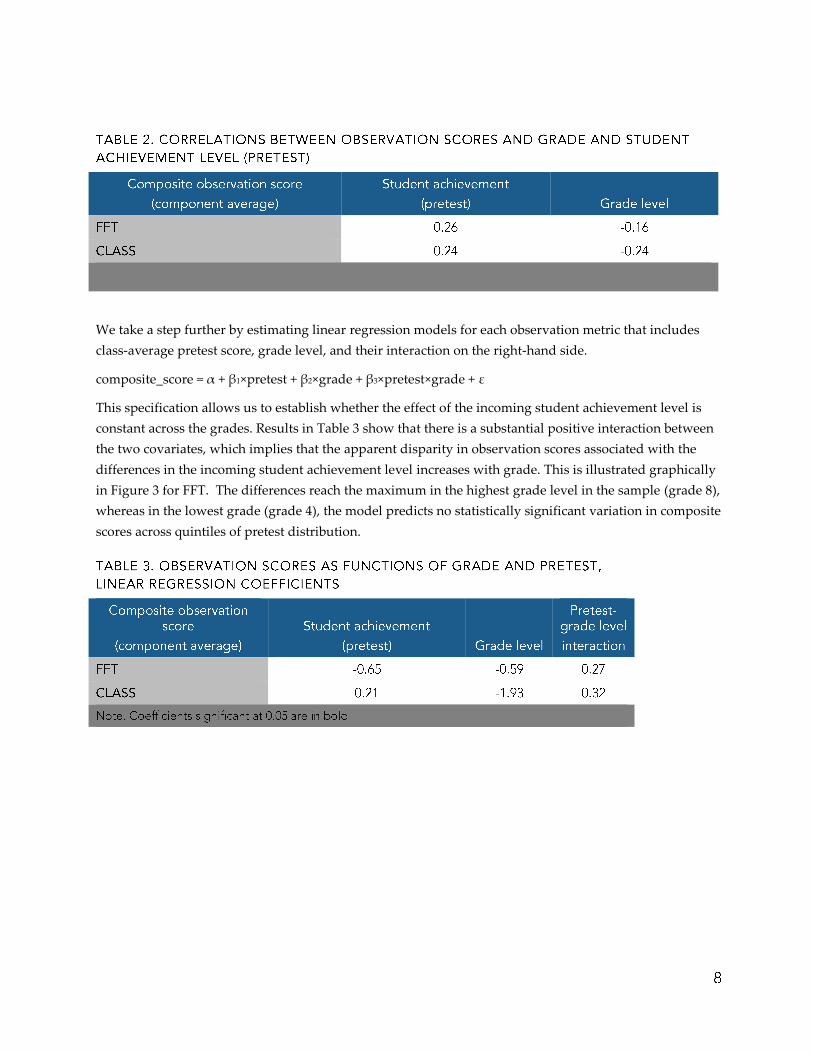
We take a step further by estimating linear regression models for each observation metric that includes
class-average pretest score, grade level, and their interaction on the right-hand side.
composite_score = α + β1×pretest + β2×grade + β3×pretest×grade + ε
This specification allows us to establish whether the effect of the incoming student achievement level is
constant across the grades. Results in Table 3 show that there is a substantial positive interaction between
the two covariates, which implies that the apparent disparity in observation scores associated with the
differences in the incoming student achievement level increases with grade. This is illustrated graphically
in Figure 3 for FFT. The differences reach the maximum in the highest grade level in the sample (grade 8),
whereas in the lowest grade (grade 4), the model predicts no statistically significant variation in composite
scores across quintiles of pretest distribution.
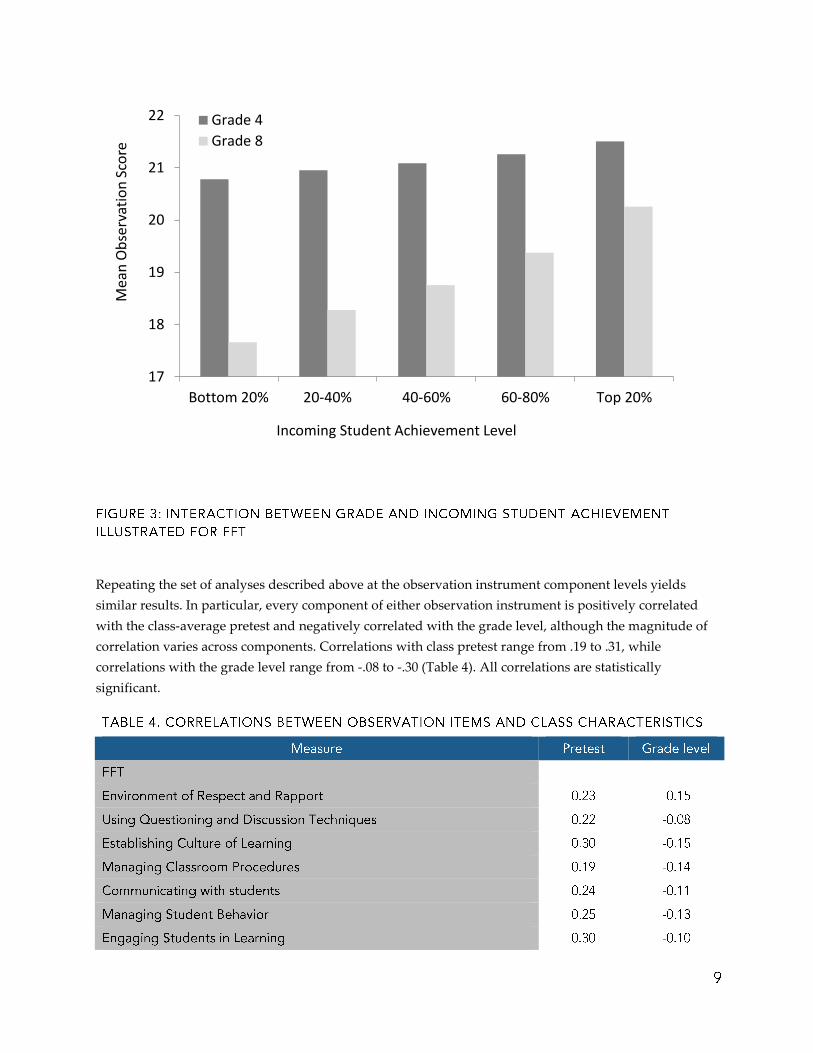
Repeating the set of analyses described above at the observation instrument component levels yields
similar results. In particular, every component of either observation instrument is positively correlated
with the class-average pretest and negatively correlated with the grade level, although the magnitude of
correlation varies across components. Correlations with class pretest range from .19 to .31, while
correlations with the grade level range from -.08 to -.30 (Table 4). All correlations are statistically
significant.
17
18
19
20
21
22
Bottom 20% 20-40% 40-60% 60-80% Top 20%
Mea
n O
bse
rvat
ion
Sco
re
Incoming Student Achievement Level
Grade 4
Grade 8

While the correlation of class characteristics and observation scores is consistent and pervasive we are still
left with the puzzling interaction, which complicates any plan to adjust observation scores using class
characteristics. To explore this interaction and to get closer to a productive explanation, we conducted an
analysis using factor scores obtained from the model described earlier. Using the factor scores rather than
the composite scores produces a completely different result (Table 5). The “Effective” factor is correlated
only with pretest scores (.39) but not with the grade level, while “Constructive” is correlated only with the
grade level (-.29). In addition, regression analysis shows no significant interaction between the pretest and
the grade level. Using factor scores allows us, therefore, to obtain composite metrics that are robust
against variation in at least some class characteristics. We can use the “Constructive” factor score without
adjustments to rank teachers within a grade level across classrooms varying in incoming student
achievement levels. What we call the “Effective” factor carries the relationship to class-average pretest.
Using the teachers’ score on the Effective factor would allow comparing teachers across grades in
classrooms with similar characteristics.

Discussion Teacher evaluation has been introduced as a policy in order to support personnel decisions that include
assignment to appropriate professional development, as well as promotions, salary increases, and
dismissals. Insofar as a composite score composed of weighted scores from a variety of measures
conflates a diverse set of teacher characteristics and skills, it will have limited practical value. We have
shown that the multiple measures typically used in state-mandated evaluation systems can be
productively broken out into distinct factors. Furthermore, with respect to observations of teachers, we
have shown that empirically-derived factors can be productive in understanding correlations between
class characteristics and evaluation scores. The factors we identified may point to substantial sets of
teaching skills. However, within each set, the useful practices may vary with class characteristics, and so
observational frameworks should not be assumed to be universal instruments.
Existing observation frameworks in wide use can still be very useful. Our findings suggest that a valid
composite evaluation metric can be obtained without introducing additional adjustments. “Constructive”
factor scores that do not discriminate against teachers working in different classrooms could be used in
place of simple averages as the composite observation metric. “Effective” factor score might serve as an
indicator of teacher-classroom interaction, but additional research is needed to understand what drives
the variability in the association between components of observation rubrics and class characteristics. By
identifying and isolating the subset of observational elements that are associated with pretest, we have
taken a useful initial step in that research.
Clearly, a single composite teacher effectiveness score obtained by adding up the multiple measures is
generally not an adequate approach to evaluation, and adjusting it for apparent bias may not serve the
purpose of producing valid evaluation metrics. Administrative datasets now being compiled in school
systems need to be studied in order to find statistically sound and meaningful composite scoring formulas
that will produce robust results to guide teacher professional development and other personnel decisions.

References Chaplin D., Gill B., Thompkins A., & Miller H. (2014). Professional Practice, Student Surveys, and Value-
Added: Multiple Measures of Teacher Effectiveness in the Pittsburgh Public Schools. Mathematica
Policy Research report.
Kane, T., & Staiger, D.O. (2012). Gathering feedback for teaching: Combining high-quality observations
with student surveys and achievement gains (research report). Seattle, WA: Bill & Melinda Gates
Foundation.
Lazarev, V., & Newman, D. (2013). How Non-Linearity and Grade-Level Differences Complicate the Validation of
Observation Protocols. Paper presented at the Fall 2013 SREE conference, Washington, DC, September
2013.
Lazarev, V., & Newman, D. (2014). Can multifactor models of teaching improve teacher effectiveness measures?
Paper presented at the Annual Meeting of AEFP, San Antonio, TX, March 2014.
Lazarev, V., Newman, D., & Sharp, A. (2014). Combining classroom observations with other measures of
educator effectiveness in Arizona’s pilot teacher evaluation model (REL 2014-050). Washington, DC: U.S.
Department of Education, Institute of Education Sciences, National Center for Education Evaluation
and Regional Assistance, Regional Educational Laboratory West.
Mihaly, K., & McCaffrey, D. (2014). “Grade-Level Variation in Observational Measures of Teacher
Effectiveness” In: Kane, T., Kerr, K., & Pianta R., eds. Designing Teacher Evaluation Systems: New
Guidance from the Measures of Effective Teaching Project. New York: John Wiley & Sons.
Whitehurst, G., Chingos, M., & Lindquist, K. (2014). Evaluating Teachers with Classroom Observations:
Lessons Learned in Four Districts. Brown Center on Education Policy at the Brookings Institution.