
How Sweet It Is: Perceptions, Behaviors, Attitudes, and...
23
How Sweet It Is: Perceptions, Behaviors, Attitudes, and Messages Regarding Sugary Drink Consumption and Its Reduction Interlex Communications yale rudd center Center for science in the public interest 05/08/2012 Rudy Ruiz, MPP Roberta R. Friedman, ScM George Hacker Brittani Peña Nicole Novak, MS Krista Patlovich, MPH
Transcript of How Sweet It Is: Perceptions, Behaviors, Attitudes, and...

How Sweet It Is: Perceptions, Behaviors, Attitudes, and Messages Regarding Sugary Drink Consumption and Its Reduction
Interlex Communicationsyale rudd centerCenter for science in the public interest
05/08/2012
Rudy Ruiz, MPP
Roberta R. Friedman, ScM
George Hacker
Brittani Peña
Nicole Novak, MS
Krista Patlovich, MPH

page 2
sugary drinks research report
How Sweet It Is: Perceptions, Behaviors, Attitudes, and Messages Regarding Sugary Drink Consumption and Its Reduction
Executive SummaryWe began this project with the seemingly simple goal of identifying a clear term that advocates can use universally to describe the category of products known by a variety of names: sugary drinks, sugar-sweetened beverages, sugar loaded beverages, etc. We wanted to help create a unified front against those that wish to sell their products indiscriminately to a population that has been numbed to the truth. Our aim has never been to eliminate sugary drinks completely – just to educate individuals about what they are drinking and encourage them to reduce their consumption to more appropriate levels1.
To aid in this goal, we have partnered with the Center for Science in the Public Interest and Yale’s Rudd Center for Food Policy and Obesity. Both agencies have a track record for taking on tough challenges as it relates to food consumption and policy. As sugary drinks have been shown to contribute greatly to the expanding waistlines of the average American (especially the average American teen)1, this issue is rightly top of mind for public health advocates.
As often happens in research, we found much more information in this study than we ever thought we would. Here is what we learned:• Vulnerable populations such as minorities and children have been targeted by the beverage industry
and can benefit the most from outreach efforts to reduce sugary drink consumption.• The beverage industry has done an excellent job of linking their products with happiness, family,
and even patriotism. • In order to create effective messaging to convince consumers that sugary drink consumption should
be limited, we must stay positive and show the benefits of drinking less sugar.• The ground is fertile for engaging in creative policy measures to curb consumption, but these measures
must progress carefully and should be linked to efforts that directly protect children.• Most people know that sugary drinks contribute to obesity and would like to consume less, however
most people have a hard time understanding what is a sugary drink and what is not.• The term “sugary drinks” is the most effective and appealing term for consumers. It was the most effective
term at helping people correctly identify drinks they should avoid and it was appealing as a term that could be used universally for all types of audiences.
It is clear that Americans drink too many sugary drinks, and we must engage this problem head-on. Advocates around the country are already doing so, but the more unified our approach is, the more effective it will be. Our findings are promising, and we see hope for the future. Together we can keep that future bright.
1 Ogden Cynthia, Kit Brian, Carroll Margaret, Sohyon Park. Consumption of Sugar Drinks in the U.S. 2005-2008. NCHS Data Brief. 71; 2011.

page 3
Purpose of StudyThe goal of this research study is to raise awareness and understanding among consumers, public health professionals, and policy makers about consumer attitudes, barriers to change, multicultural knowledge gaps, multicultural perspectives, and marketing insights relevant to sugary drinks, behavior change interventions, and social marketing campaigns aimed at preventing and reducing obesity through reductions in the consumption of sugary drinks.
Partnership OverviewThe Center for Science in the Public Interest (CSPI), Yale Rudd Center for Food Policy and Obesity (Rudd), and Interlex Communications, Inc. (Interlex) collaborated on a qualitative and quantitative study of general and multicultural market consumer perceptions, behaviors, and attitudes towards sugary drinks as well as messaging and imagery evaluation to develop a campaign to reduce the consumption of sugary drinks.
About the Authors • Rudy Ruiz, MPP, is the President and CEO of Interlex Communications, Inc.• Roberta R. Friedman, ScM, is the Director of Public Policy at the Rudd Center for Food Policy
& Obesity at Yale University• George Hacker is the Senior Policy Advisor for Health Promotion Policy at The Center for Science
in the Public Interest • Brittani Peña is the Director of Research at Interlex Communications, Inc.• Nicole Novak, MS, is a Research Associate at the Rudd Center for Food Policy & Obesity
at Yale University• Krista Patlovich, MPH, is a Research Associate at Interlex Communications, Inc.
Key Findings• The most motivating messages for reducing sugary drink consumption among the total surveyed
population were:o Sugary drink consumption’s negative effects on child health.o Knowing there are healthier options.o Sugary drink consumption’s increase risk of obesity.o Knowing that sugary drinks are harmful to health.
• “Sugary drink” is the term that best facilitates correct identification of beverages and elicits positive responses to beverage-related policies.
• Most Americans agree that sugary drink companies contribute to obesity in the U.S.• It is not clear to consumers what is considered a sugary drink and what is not.• Most respondents would like to reduce their sugary drink consumption.• Most respondents think drinking no more than two sugary drinks a week is healthy.• Most respondents believe non-profit health organizations should not receive financial support from
sugary drink companies.• Most respondents think sugary drink companies unfairly target young children and minorities with their
advertising practices.• The majority of respondents think that sugary drink companies do not care about their health.
sugary drinks research report

page 4
Research Objectives• Evaluate key messages, concepts, and imagery to aid in the development of a communication campaign
platform to reduce sugary drink consumption.• Assess perceptions and attitudes toward sugary drinks.• Understand and identify barriers and motivations toward supporting policies to reduce the consumption
of sugary drinks.• Identify messaging to strengthen the resolve of the American public to support policies to reduce the
consumption of sugary drinks.• Identify triggers to motivate public thinking to drive political action.• Understand people’s attitudes and support of policies concerning sugary drinks e.g. taxes, marketing
restrictions, labeling requirements, etc.• Evaluate and assess terminology for sugary drinks.
o Understand preference, perceptions, and meanings of potential terms for sugary drinks.o Understand knowledge of each term’s association with specific beverages.
• Capture target’s demographics, behaviors, and psychographics concerning sugary drinks.
MethodologyQuantitativeA national online survey was conducted among general market adults 18 and over. Interlex and Rudd collaborated on the questionnaire design to ensure that all objectives were met among the different target audiences. Interlex also incorporated messaging statements to be evaluated in the online survey. The survey was executed and fielded by Rudd.
QualitativeA total of four traditional focus groups were conducted in San Antonio by Interlex. Each group consisted of eight to ten respondents. One group consisted of Spanish-dominant Hispanics, while the other groups consisted of parents with children under the age of fourteen (multicultural), low-income (multicultural), and teen (multicultural) participants.
The focus groups were conducted utilizing the Metaphor Elicitation Technique, a technique that uses pictures and visual imagery to tap into the participant’s psyche. Before the focus groups were conducted, respondents were asked to create a collage (using a collection of pre-selected images) that represents how they feel about sugary drinks.
During the groups, respondents explained why they chose the images they did, and they were asked to provide keywords describing their feelings toward sugary drinks. These keywords were put on cards, sorted, and probed to obtain a cluster, or an overall theme, to which they best relate.
Respondents were also asked to construct key phrases that describe their feelings about sugary drinks and their perceived impacts on health. The moderator also probed on how anti-sugary drink campaigns should be communicated, specifically probing on imagery, terminology, and messaging points. In addition,
sugary drinks research report

page 5
respondents were asked to evaluate creative concepts and logos using a rating sheet assessing overall preference, motivation to act, and relevance.
Target (Focus Group criteria)Qualitative:• Adults 21-55
o Multicultural parents (Mix of Caucasian, African Americans, and Hispanic parents of children under the age of 14)
• Adults 21-49o Hispanic (Spanish speaking only)o Low-income (Under $35,000, appropriate ethnic mix)
• Teens 14 to 17 o Teen Group (Mix of Caucasian, African Americans, and Hispanics)
• Have consumed soda in the past seven days• Have not participated in a research focus group in the past 6 months• Not employed in marketing, advertising, or beverage-related industries
Detailed Analysis and InterpretationQualitative ReportTest ProcedureA total of four traditional focus groups were conducted in San Antonio by Interlex. Each group consisted of eight to ten respondents. These groups included Spanish-dominant Hispanics, parents with children under the age of fourteen (multicultural), low-income (multicultural), and teen (multicultural) participants.
Focus Group Outline• Warm-up/Introduction• Collage and Free Association
o Before participants entered the focus groups they were asked to create their own collages to describe how they feel about sugary drinks
o They were also asked to come up with words to describe or categorize sugary drinks• Concept and Evaluation
o Participants were asked to evaluate four creative concepts• Evaluation of Policy
o Participants were asked about their thoughts on proposed sugary drink policies designed to reduce consumption of sugary drinks, and to make suggestions for policy recommendations or community ideas
sugary drinks research report

page 6
Subjects The focus group respondents represent both adult and teen groups shown below.• Adults (21-55)
o Multicultural Parents Group (Mix of Caucasian, African Americans, and Hispanic parents of children under the age of 14)
• Adults (21-49)o Hispanic Group (Spanish speaking only)o Low-income Group (Under $35,000, appropriate ethnic mix)
• Teens (14-17)o Teen Group (Mix of Caucasian, African Americans, and Hispanics)
• Have consumed soda in the past seven days• Have not participated in a research focus group in the past six months• Not employed in marketing, advertising, or beverage-related industries
Collage AnalysisFocus group participants were shown the following image prior to creating their respective collages:
Our analysis of each group participants’ collages began with identifying the most frequently used photosand words that described the participants’ feelings towards sugary drinks (pictured above). The wordclouds presented in this report include the most common photos used among the groups. A larger sizedword in the word cloud indicates a greater frequency of use.
sugary drinks research report

page 7
Focus Group 1 Spanish-Speaking Parents Image AnalysisThe most frequently selected images represented gatherings of friends having fun together with and without sugary drinks. The images also emphasized happiness and joy, and many were action-oriented. In some cases, the images depicted scenarios in which the subjects were actively playing sports and having fun together.
In some of the collages, respondents chose images that showed people alone and the images were mostly positive. In most cases, these images focused on healthy individuals participating in active scenarios like lifting weights or running a race. Within this group, two people did not use any negative words to express their feelings towards sugary drinks indicating their positive perceptions of sugary drinks.
Spanish-Speaking Parents Word Analysis
The words used in the collages to describe their feelings mirrored that of the images selected. They were overwhelmingly positive and included words such as energy, relaxed, comfortable, friends, and healthy. Participants also used words like happiness, energy, and relaxed to describe the benefits associated with drinking some of the sugary drinks. Some participants mentioned that sugary drinks taste good but require exercise, indicating their understanding of the health consequences of over consumption. Participants also linked sugary drinks such as sports drinks and the energy they are thought to provide during exercise or sporting activities.
sugary drinks research report

page 8
Focus Group 2 Low Income Image AnalysisThe most frequently selected images represented gatherings of friends having fun together, usually without sodas present in the pictures. The images were strongly linked with happiness, energy, and companionship. A few images depicted images of individuals exercising. One of the most popular image selections was an American flag. Images were mostly positive, focusing strongly on activity and having fun. A few images were connected to negative concepts, like a chalk outline, and a tired individual in an office scenario. Several of the selected images depicted food, showing a clear link with eating.
Low Income Word Analysis
The words used in the collages to describe their feelings mirrored the images selected. They were overwhelmingly positive and included words such as energetic, refreshed, fun, sweet, and happy. Some respondents within the group used words like quenching, hydrating, and refresh to describe the associated benefits of drinking sugary drinks. Within this group, very few negative words were used; however, headache, tired, bitterness, and restless were used to describe the taste and effects of caffeine. The most common word used to describe sugary drinks was fun, thus showing the connection between sugary drinks and a good life.
sugary drinks research report

page 9
Focus Group 3 Teens Image AnalysisAlmost all of the teen participants (five out of seven) selected an image depicting three happy teen boys drinking soda. They picked an assortment of images of friends having fun, with and without sugary drinks. Images of solitary individuals were rare, showing a connection between togetherness and sugary drinks. One of the most popular image choices (selected by five out of seven participants) was the American Flag, possibly linking sugary drinks to American identity. Though many of the images selected depicted energy and action, the teen audience all included at least one negative image, showing teens have an awareness of the negative consequences of sugary drink consumption.
Teens Word Analysis
The words used in the teen collages were much more geared towards the concept of energy and the jolt that these drinks provide. Examples of words used to describe the jolt include caffeine, rush, juice (used in context as a synonym for energy), sugar, and energy. Contrary to their understanding of negative consequences exhibited in the image selection, the words they used were overwhelmingly positive. Soda (also used as sodas and soda’s) was the most commonly used word, signaling that teens strongly associate sugary drinks specifically with soda.
sugary drinks research report

page 10
Focus Group 4English Speaking Parents Image Analysis
The most frequently selected images represented physical activity, all-American culture, and gatherings. Photos also included friends enjoying hanging out/taking part in physical activity. Selected images depicted subjects in need of a pick-me-up.
Participants also selected images that demonstrated exercising and energy. Images also represented the consequences of over-indulgence in sugary drinks, the dependency they create and the subsequent crash that follows the stimulation from caffeine and sugar. English Speaking Parents Word Analysis
Happy and energy were two of the most commonly used words by the English parents. In this group, participants talked about being in need of a sugary drink to boost their energy and then later feeling tired or like crashing. They were able to connect sugary drinks’ perceived benefits of energy with the negative consequences of crashing. The group also described sugary drinks as all-American and as something for everyone of all ages to consume together during holidays or parties. Sports drinks made participants think of sports and working out.
Some participants described sugary drinks as sweet and in the case of juice, healthy. Sugary drinks were also associated with fast food and tasting good.
sugary drinks research report

page 11
Free AssociationMethod: Participants were asked to write down words they would use to describe the picture below:
Results: • A majority of respondents described the above drinks positively using words like energizing, refreshing,
and fun (See combined word cloud below).• Many of the participants did not recognize that drinks were possibly harmful to their health.• There was a wide perception that some drinks were better for you than others.
Free Association Word Cloud
sugary drinks research report

page 12
TerminologyWhen respondents were asked to come up with a term to categorize the drinks in the picture provided to them, most said drinks with sugar, but many had difficulty coming up with a term on their own.
When respondents were provided several terms to categorize the drinks and asked to rank them (1 being the best and 5 being the worst), the most preferred term was sugary drinks followed by sugary-sweetened beverages.
Policy EvaluationThe majority of respondents were in denial and do not see sugary drinks as being harmful to their health. Respondents said they needed to take small steps to make progress in reducing their consumption of sugary drinks.
When asked about potential recommendations to reduce consumption of sugary drinks, most said they would like to see educational campaigns about the health consequences of drinking too many sugary drinks, and they would also support taking vending machines out of public schools.
Multiple groups suggested placing warning labels on sugary drinks. Interestingly, most respondents said they would join a movement to help educate people about the harms of drinking too many sugary drinks.
Quantitative Evaluation of Messaging and Policy Report
BackgroundReducing consumption of sugary drinks can be tied to many factors inclusive of implementing a beverage tax, campaign messaging, behavior, awareness, and overall personal beliefs. The Rudd Center for Food Policy & Obesity and Interlex Communications, Inc. developed and administered an Internet survey to identify and analyze those factors that best resonate with respondents.
Terms
Sugary Drinks
Sugar-Sweetened
Beverages
Sugar-Loaded
Beverages
Sodas
Table 1: Terminology Ranking
Rank
1.60
2.00
2.85
3.55
sugary drinks research report

page 13
Test ProcedureThe Rudd Center conducted an Internet survey of 1,894 adults recruited through a survey panel administered by Survey Sampling International. Panelists were recruited via thousands of websites to maximize the representativeness of the panel to the online U.S. population. The sample was augmented to include sufficient proportions of Hispanic and African American respondents to allow for analyses of racial and ethnic differences.
SubjectsThe survey respondents represent a wide range of demographic groups. There are slightly more females (61 percent) than males. The sample has high proportions of African-American (20 percent) and Hispanic (29 percent) respondents.
Survey LanguageEnglish 83.5%
Spanish 16.5%
Race (Multiple Selections Possible)African American 20.2%
Asian/Pacific Islander 2.5%
Caucasian 66.5%
Native American 1.8%
Other 10%
EthnicityHispanic 29.4%
Age18-24 15.2%
25-34 22.6%
35-44 12%
45-54 18.7%
55-64 19.9%
65 and Older 11.6%
Income<$25,000 30%
$25,000-$49,999 32.2%
$50,000-$74,999 19.8%
$75,000-$99,999 9.8%
$100,000 or More 8.2%
SexFemale 61%
Male 39%
EducationSome High School or Less 3.7%
High School Graduate 25.2%
Some College 35%
College Graduate 27.7%
Post-Graduate School 8.4%
Political OrientationStrongly Liberal 6.1%
Liberal 7%
Somewhat Liberal 8.3%
Moderate 52.5%
Somewhat Conservative 7.2%
Conservative 8.6%
Strongly Conservative 10.3%
Body Weight (Self-Described)Underweight 4.6%
Normal Weight 50.2%
Overweight 39.5%
Obese 5.7%
Table 2: Demographic Characteristics of Sample (1,894 Respondents)
sugary drinks research report

page 14
Table 3: Percentage of respondents indicating their knowledge and behavior with regards to sugary drinks
Caucasian(n=1259)
African American (n=382)
Hispanic (n=556)
Republican (n=410)
Democrat (n=785)
Low Income < $25K
(n=531)
Education< high school (n=70)
Total (n=1894)
Would you like to reduce your sugary drink consumption?
Yes 44.5** 56.5** 57.2** 43.4** 53.8** 52.0 58.0 49.3
No 46.5** 30.6** 32.7** 48.8** 36.6** 38.8 26.1* 40.9
How knowledgeable do you feel when it comes to making healthy decisions about nutrition?
Very knowledgeable/knowledgeable
68.4 62.8* 70.3 73.4** 69.0 61.2** 68.1 67.4
How many sugary drinks do you think are healthy to drink in one week?
0 21.0 16.8 17.6 18.3 21.1 19.4 18.8 19.9
1-2 37.0 42.7 42.1 34.4 41.8 37.9 46.4 39.4
3-4 23.0 26.2 23.9 26.1 23.1 24.5 18.8 23.5
5-7 14.6 9.7 12.2 14.4 11.2 12.6 13.0 12.9
8-14 2.9 1.6 2.9 3.4 2.2 2.8 1.5 2.6
15-21 0.7 1.0 0.5 1.2 0.4 0.9 0.0 0.7
22 or more 0.9 2.1 0.7 2.2 0.3 1.9 1.5 1.1
How old do you think children should be when their parents introduce them to sugary drinks?
Less than 1.9 2.9 1.8 2.4 2.2 3.2 5.8 2.3
1 year
1-4 years 13.5 12.0 13.1 16.6 11.7 12.1 14.5 13.1
4-6 years 18.4 19.1 21.0 19.0 17.5 18.6 13.0 18.6
6-10 years 20.0 19.1 22.5 18.0 17.6 21.5 17.4 20.1
10 years 20.3 24.6 22.8 19.5 26.1 20.9 15.9 21.7
or older
Never 26.0 22.2 18.7 24.4 25.0 23.7 33.3 24.2
*p<0.05, **p<0.01 for significant difference from total percentage ( i.e. * indicates robust evidence that the agreement rates for that subgroup are measurably different from the rest of the respondents, and ** indicates very robust evidence that the rates differ for that subgroup)
Results
Respondents were asked to answer questions with regards to their current behavior, knowledge, and beliefs about sugary drinks. (See Table 3)
BehaviorFive of the seven demographic groups responded with assurance (more than 50 percent for each) that they would like to reduce the amount of sugary drinks consumed; however, there was a slight variation in response among the Caucasian and Republican groups as 46.5 percent and 48.8 percent respectively said that they would not like to reduce their intake. Irrespective of this outcome among
sugary drinks research report

page 15
Caucasians and Republicans, both responded (68.4 percent and 73.4 percent) convincingly about being knowledgeable when making healthy decisions about nutrition. This resonated among all groups as response rates for being knowledgeable was above 60 percent.
KnowledgeRespondents were also asked how many sugary drinks they think are healthy to drink in one week and were given seven options to choose from. The highest percentages were shown among all demographic groups for the option of consuming 1 to 2 beverages per week.
BeliefsAdjunct to the above questions, respondents were asked to choose an age when a child should be introduced to sugary drinks. Responses varied, however, four of the seven demographic groups preferred “never” introducing these beverages. The remaining groups (African American, Hispanic, and Democrat) thought 10 years or older was appropriate. While it’s true that the majority of respondents agreed that children should be 10 or older before they are fed sugary drinks, it’s notable that over 30 percent of respondents thought it is acceptable to introduce these beverages to children at young ages (under 6). The American Heart Association recommends that young children (4 to 8 years) have no more than 12g of added sugar TOTAL per day – that’s less sugar than 4oz of Coca-Cola or one CapriSun pouch.
sugary drinks research report
page 16
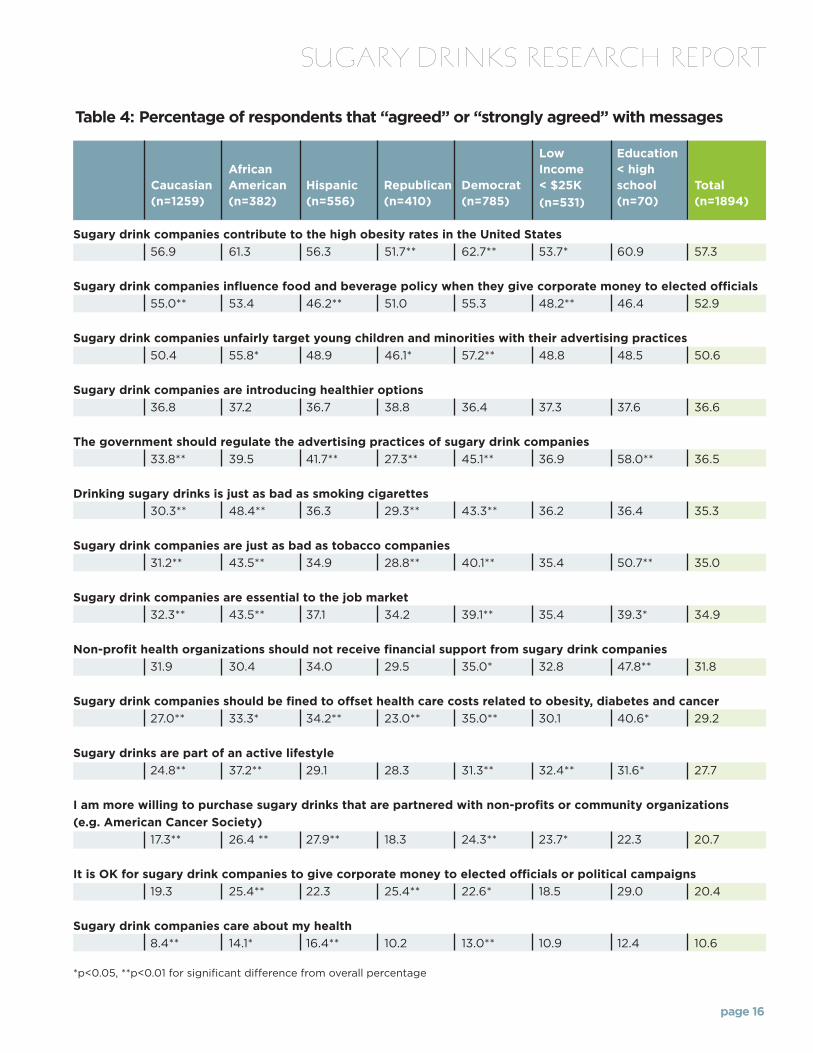
Table 4: Percentage of respondents that “agreed” or “strongly agreed” with messages
Caucasian(n=1259)
African American (n=382)
Hispanic (n=556)
Republican (n=410)
Democrat (n=785)
Low Income < $25K
(n=531)
Education< high school (n=70)
Total (n=1894)
Sugary drink companies contribute to the high obesity rates in the United States
56.9 61.3 56.3 51.7** 62.7** 53.7* 60.9 57.3
Sugary drink companies influence food and beverage policy when they give corporate money to elected officials
55.0** 53.4 46.2** 51.0 55.3 48.2** 46.4 52.9
Sugary drink companies unfairly target young children and minorities with their advertising practices
50.4 55.8* 48.9 46.1* 57.2** 48.8 48.5 50.6
Sugary drink companies are introducing healthier options
36.8 37.2 36.7 38.8 36.4 37.3 37.6 36.6
The government should regulate the advertising practices of sugary drink companies
33.8** 39.5 41.7** 27.3** 45.1** 36.9 58.0** 36.5
Drinking sugary drinks is just as bad as smoking cigarettes
30.3** 48.4** 36.3 29.3** 43.3** 36.2 36.4 35.3
Sugary drink companies are just as bad as tobacco companies
31.2** 43.5** 34.9 28.8** 40.1** 35.4 50.7** 35.0
Sugary drink companies are essential to the job market
32.3** 43.5** 37.1 34.2 39.1** 35.4 39.3* 34.9
Non-profit health organizations should not receive financial support from sugary drink companies
31.9 30.4 34.0 29.5 35.0* 32.8 47.8** 31.8
Sugary drink companies should be fined to offset health care costs related to obesity, diabetes and cancer
27.0** 33.3* 34.2** 23.0** 35.0** 30.1 40.6* 29.2
Sugary drinks are part of an active lifestyle
24.8** 37.2** 29.1 28.3 31.3** 32.4** 31.6* 27.7
I am more willing to purchase sugary drinks that are partnered with non-profits or community organizations
(e.g. American Cancer Society)
17.3** 26.4 ** 27.9** 18.3 24.3** 23.7* 22.3 20.7
It is OK for sugary drink companies to give corporate money to elected officials or political campaigns
19.3 25.4** 22.3 25.4** 22.6* 18.5 29.0 20.4
Sugary drink companies care about my health
8.4** 14.1* 16.4** 10.2 13.0** 10.9 12.4 10.6
*p<0.05, **p<0.01 for significant difference from overall percentage
sugary drinks research report

page 17
Overall, the messages that best resonated with the survey panel were those about sugary drink companies contributing to high rates of obesity in the U.S. (57 percent agreement), influencing elected officials when they donate money (53 percent), and unfairly targeting youth and minorities (51 percent). Messages comparing sugary drinks to cigarettes or sugary drink companies to tobacco companies did not gain very much support (35 percent for both). Respondents also had low rates of agreement with the two messages about fining or regulating sugary drink companies (29 percent and 37 percent agreement, respectively). Messages that presented sugary drinks and sugary drink companies favorably had little support and included “Sugary drink companies are introducing healthier options” (37 percent support), “Sugary drink companies are essential to the job market” (35 percent), “Sugary drinks are part of an active lifestyle” (28 percent), and “Sugary drink companies care about my health” (11 percent).
Responses to messages varied among different demographic subgroups of the sample. African American respondents were more likely to agree with tobacco-related messaging, with 48 percent of respondents agreed that sugary drink consumption was “just as bad as smoking cigarettes” (as compared to 35 percent in the total sample), and 44 percent of respondents agreed that sugary drink companies were “just as bad as tobacco companies” (cf. 35 percent). African American respondents were also more likely to agree that youth and minorities are unfairly targeted in marketing (56 percent cf. 51 percent). However, African-American respondents also tended to agree with messages sympathetic to industry, with 44 percent of respondents agreeing that sugary drink companies are essential to the job market (cf. 35 percent in the general sample), 37 percent agreeing that sugary drinks are “part of an active lifestyle” (cf. 28 percent), and 14 percent agreeing that “sugary drink companies care about my health” (cf. 11 percent).
Hispanic respondents had high rates of agreement with messages related to government regulation of sugary drink companies, with 42 percent agreeing that “the government should regulate the advertising practices of sugary drink companies (cf. 37 percent in the total sample), and 34 percent agreeing that sugary drink companies should be fined to offset health care costs (cf. 29 percent in the total sample). However, Hispanic respondents were less likely to agree that sugary drink companies influenced food policy when they gave money to elected officials (46 percent cf. 53 percent), and more likely to favor sugary drink companies that partner with non-profit organizations (28 percent cf. 21 percent). Hispanic respondents were also more likely to agree that “sugary drink companies care about my health” (16 percent cf. 11 percent). Respondents who were Democrats were most likely to view sugary drink companies negatively, with 63 percent saying that sugary drink companies contribute to the high obesity rates in the United States and 57 percent saying that sugary drink companies unfairly target young children and minorities with their advertising practices. 43 percent of Democrats also said that drinking sugary drinks was just as bad as smoking cigarettes. Democratic respondents were also more likely to favor government regulation of sugary drink companies, with 45 percent saying the government should regulate the advertising practices of sugary drink companies and 35 percent saying that sugary drink companies should be fined to offset health care costs related to obesity, diabetes, and cancer. In contrast to Democrats, Republicans were the least likely to favor government regulation (27 percent) and think that sugary drink companies should be fined to offset health care costs related to obesity, diabetes, and cancer (23 percent).
sugary drinks research report

page 18
Motivation-related messagingThe survey showed respondents a number of possible arguments for reducing their soda consumption and asked them to rate the argument on a five-point scale from “least motivating-1” to “most motivating-5.” Tables 5 and 6 show the percent of respondents who ranked each message a five or four for more motivating and a two or one for less motivating respectively.
Table 5: Percentage of respondents that found message motivating to reduce consumption
Caucasian(n=1259)
African American (n=382)
Hispanic (n=556)
Republican (n=410)
Democrat (n=785)
Low Income < $25K
(n=531)
Education< high school (n=70)
Total (n=1894)
Knowing how sugary drink consumption can negatively affect their child’s health
65.3** 69.6** 66.2 63.4 70.7** 66.1 72.5* 66.7
Knowing there are healthier options
60.2** 67.5* 64.0 62.0 64.8 64.2 65.2** 62.9
Knowing how sugary drinks are harmful to health
53.6** 59.7** 56.7* 53.4 60.5** 55.9 58.0 55.9
Knowing that sugary drink consumption increases the risk of obesity
56.5** 64.4** 61.0 52.2 65.9** 58.6 66.7** 59.3
Knowing what kind of predatory marketing practices sugary drink companies use
41.1** 52.4** 50.4** 37.8 49.6** 48.2* 59.4** 45.1
*p<0.05, **p<0.01 for significant difference from overall percentage
sugary drinks research report

page 19
The most motivating message for all groups was related to sugary drink consumption’s negative effects on child health, especially among African-American respondents (67 percent listed as motivating in total sample, 70 percent in African-American sample). “Knowing there are healthier options” was rated as motivating by 63 percent of respondents, and knowing that sugary drinks “are harmful to health” and “increase the risk of obesity” were rated as “most motivating” by 56 and 59 percent of respondents, respectively.
Although over half of respondents had agreed that sugary drink marketing unfairly targets youth and minorities, only 26 percent of respondents found that knowing what kind of predatory marketing practices sugary drink companies use to be a motivating argument to reduce their own sugary drink consumption. This rate was slightly higher among Caucasian (31 percent) and Republican (33 percent) respondents, but it was still the lowest ranked of all five messages and had the highest rates of respondents selecting it as “least motivating”.
Policy optionsLastly, respondents were asked to state their degree of support for a number of policies, given the hypothetical situation that they “could be convinced that sugary drink companies and their products are as harmful as tobacco companies and their products.” Their responses to the various policy options presented are listed in Table 7.
Table 6: Percentage of respondents that found message less motivating to reduce consumption
Caucasian(n=1259)
African American (n=382)
Hispanic (n=556)
Republican (n=410)
Democrat (n=785)
Low Income < $25K
(n=531)
Education< high school (n=70)
Total (n=1894)
Knowing what kind of predatory marketing practices sugary drink companies use
30.6** 19.6* 16.5** 32.9** 21.0** 23.9 14.5 26.4
Knowing how sugary drinks are harmful to health
16.0 13.1 14.2 18.3* 13.1 16.6 18.8 15.3
Knowing that sugary drink consumption increases the risk of obesity
14.9 13.1 12.9 17.3 11.1 15.1 16.5 14.2
Knowing there are healthier options
15.8 14.1 10.3** 14.6 13.5 13.4** 13.0* 14.7
Knowing how sugary drink consumption can negatively affect their child’s health
10.6 9.2 9.0 11.5 8.4 18.5 8.7 10.3
*p<0.05, **p<0.01 for significant difference from overall percentage
sugary drinks research report

page 20
Quantitative Evaluation of Terminology and Policy ReportBackgroundEffectively educating and promoting the reduction of sugary drinks is challenging, yet essential. The first step towards proper understanding amongst the general public is to identify how people are communicating the problem at hand. After consulting with a number of key public health advocates devoted to this issue, we identified three possible terms: SSBs, sugar-loaded beverages, and sugary drinks. The Rudd Center for Food Policy & Obesity and Interlex Communications, Inc. developed and administered a short Internet survey to identify which term was best for 1) helping consumers to correctly identify the set of beverages that would be taxed, and 2) eliciting positive responses to the possibility of a sugary drink tax.
Test ProcedureWe conducted an Internet survey of 1,581 adults recruited through a survey panel administered by Survey Sampling International. Panelists are recruited via thousands of websites to maximize the representativeness of the panel to the online U.S. population. The sample was augmented to include sufficient proportions of Hispanic and African American respondents to allow for analyses of racial and ethnic differences.
After collecting demographic information including age, sex, race, ethnicity, income, education level, and political orientation, participants were randomized to one of three beverage terms: sugar sweetened beverages (SSBs), sugar-loaded beverages (SLBs), and sugary drinks (SDs). The surveys presented to participants were identical except for the term used to describe the beverages.
First, participants were asked to respond to a list of beverages and identify those they consider to be SLBs, SSBs, or SDs (depending on the term to which they were randomized). They were then asked to respond to three policy proposals: a tax on the beverages, a tax with revenue earmarked for obesity prevention, and a tax with revenue earmarked for childhood obesity prevention.
Table 7: Percentage of respondents indicating they would “support” policies if they could be convinced that sugary drink products are as harmful as tobacco products:
Caucasian(n=1259)
African American (n=382)
Hispanic (n=556)
Republican (n=410)
Democrat (n=785)
Low Income < $25K
(n=531)
Education< high school (n=70)
Total (n=1894)
Put warning labels on sugary drinks
70.2** 87.0** 75.2 63.4** 82.0** 74.5 80.0 74.5
Regulate placement of sugary drinks in stores
45.8** 57.6** 55.6** 39.4** 57.4** 51.8 63.8* 50.7
*p<0.05, **p<0.01 for significant difference from overall percentage
sugary drinks research report

page 21
SubjectsThe survey respondents represent a wide range of demographic groups. As you can see in Table 8, there are slightly more females (61 percent) than males (39 percent). The sample has high proportions of African-American (23 percent) and Hispanic (17 percent) respondents.
SexFemale 60.6%
Male 39.4%
RaceAfrican American 23.2%
Asian/Pacific Islander 2.4%
Caucasian 68.6%
Native American 1.8%
Other 5.1%
EthnicityHispanic 17.1%
Age18-24 13.8%
25-34 20.4%
35-44 11.3%
45-54 18.9%
55-64 22.2%
65 and Older 13.3%
Income<$25,000 29.8%
$25,000-$49,999 32.5%
$50,000-$74,999 19.8%
$75,000-$99,999 10.1%
$100,000 or More 7.9%
EducationSome High School or Less 3%
High School Graduate 25.4%
Some College 35.8%
College Graduate 27.9%
Post-Graduate School 8%
Political OrientationStrongly Liberal 6.2%
Liberal 6.7%
Somewhat Liberal 8.5%
Moderate 51.9%
Somewhat Conservative 7.9%
Conservative 9%
Strongly Conservative 9.9%
Body Weight (Self-Described)Underweight 4%
Normal Weight 49.1%
Overweight 41.8%
Obese 5.1%
Table 8: Demographic Characteristics of Sample (1,581 Respondents)
sugary drinks research report

page 22
ResultsBeverage identification:Respondents were shown the list of beverages below and were asked, “Which of the following beverages do you consider to be _______?”, using the beverage term to which they were randomized. The list of beverages was presented in random order and included both sugary drinks and non-sugary drinks. Respondents completed this portion of the survey before seeing any formal definition of the terms. The percentage of respondents identifying each beverage as a SLB, SSB, or SD is listed below in Table 9 indicating the beverages for which the term used led to significantly different responses.
Responses varied depending on the term used to describe the beverages. More respondents correctly identified sodas (Coca-Cola, Pepsi, Dr. Pepper, Fanta, and 7-Up) when exposed to the “sugary drinks” term than to the other two terms. For Powerade, Gatorade, and VitaminWater, “Sugar Sweetened Beverages” elicited more correct responses. In all, “Sugar Sweetened Beverages” elicited the highest percentage of correct responses (75.2 percent). “Sugar-loaded beverages” performed much worse than the other two terms with respondents correctly identifying only 67.2 percent of the beverages.
Table 9: Percent of respondents identifying each beverage as a sugary drink, by term
Beverage
SL
Bs
SS
Bs
an
d S
Ds
No
n-S
ug
ary
D
rin
ks
Sugar-Loaded Beverage
Sugar-SweetenedBeverage
Sugary Drink Average
Coca-Cola 90.7b 90.4b 94.9a 92.0
Pepsi 89.7b 88.8b 94.8a 91.1
Dr. Pepper 86.2b 88.4 90.4a 88.3
Hawaiian Punch 84.2b 88.6a 88.9a 87.3
Sweetened Iced Tea (non-diet) 76.9c 91.9a 84.8b 84.7
Fanta 77.1b 81.4b 86.3a 81.7
7-Up 72.7b 84.9a 83.0a 80.3
Lemonade 68.2c 87.8a 78.4b 78.4
Red Bull Energy Drink 74.1 70.9 72.8 72.6
Sunny Delight 59.7b 73.3a 70.5a 68.0
Powerade 49.6b 60.2a 52.4b 54.1
Gatorade 47.8b 62.6a 50.8b 53.9
Jarritos (Mexican soft drink) 46.4 49.5 47.8 47.9
Vitamin Water 17.6c 34.7a 25.0b 26.0
Average 67.2c 75.2a 72.9b 71.9
100% Orange Juice 45.5 49.8 48.2 47.9
Coke Zero 40.5b 49.8a 49.7a 46.8
Diet Pepsi 38.3b 46.1a 46.5a 43.8
Diet Coke 36.2b 44.3a 46.0a 42.3
Average 40.0b 47.5a 47.6a 45.2
Superscripts are significantly different from one another at the p<0.05 level. (The superscript a indicates that significantly more respondents identified the beverage as an SUGARY DRINK/SLB/SD when using that term than when using the terms marked with b. Where there is a c this indicates that the associated percentage is significantly lower than the two percentages marked with b and a.)
sugary drinks research report

page 23
References1. American Heart Association (AHA)2. Brownell K, Warner K. The Perils of Ignoring History: Big Tobacco Played Dirty and Millions Died. How Similar is Big Food? The Milbank Quarterly. Vol. 87:259-294.20093. Centers for Disease Control and Prevention (CDC)
sugary drinks research report


