![INDEX [] · imposed by the new green refrigerants (R -410A, etc.), adopted by major refrigeration and air conditioning unit manufacturers. TALOS® copper tubes have been awarded most](https://static.fdocuments.net/doc/165x107/5fde8d93a7321c01403f2637/index-imposed-by-the-new-green-refrigerants-r-410a-etc-adopted-by-major.jpg)
How Structural Costs Imposed on U.S. Manufacturers Harm Workers
30
How Structural Costs Imposed on U.S. Manufacturers Harm Workers and Threaten Competitiveness by Jeremy A. Leonard Economic Consultant Manufacturers Alliance/MAPI Prepared for The Manufacturing Institute of the National Association of Manufacturers
Transcript of How Structural Costs Imposed on U.S. Manufacturers Harm Workers
How Structural Costs Imposed on U.S. Manufacturers Harm
Workers and Threaten Competitiveness
by Jeremy A. Leonard
Economic Consultant Manufacturers Alliance/MAPI
Prepared for The Manufacturing Institute of the National Association of Manufacturers
© 2003 by MAPI, NAM, and The Manufacturing Institute. All rights reserved.
How Structural Costs Imposed on U.S. Manufacturers Harm Workers and Threaten Competitiveness
CONTENTS
FOREWORD iiiINTRODUCTION vExecutive Summary 1The Paradox of U.S. Manufacturing: Productivity and Innovation Leadership Amid Deteriorating International Competitiveness 4 Productivity and Innovation Leadership 4 Trends in International Trade 4 Deflationary Environment Is Squeezing Cash Flow 6
Raw Cost Competitiveness of U.S. Manufacturers 8The Cost Squeeze: Obstacles to the Competitive Posture of U.S. Manufacturers 10 High Corporate Tax Rates 10 Costs of Employee Benefits 13 Health care 13 Private pensions 14 Costs of Asbestos and Other Tort Litigation 16 Costs of Regulatory Compliance 17 Energy Costs 20 Total Effect of Five Cost Pressures 21The Talent Squeeze: Attracting Job Seekers to Manufacturing 21Easing the Burden: Policy Measures To Reduce Manufacturing “Overhead” Costs 22 Tax Policy 22 Health Reform 23 Pension Reform 23 Legal Reform 23 Regulatory Reform 23 Energy Costs 23Appendix: Derivation of Raw Manufacturing Cost Index for the United States and Its Nine Largest Trading Partners 24
i

iii
How Structural Costs Imposed on U.S. Manufacturers Harm Workers and Threaten Competitiveness
FOREWORD
St. Louis-based Emerson has been a long-time member of the NAM and a supporter of The Manufacturing Institute’s work. Emerson (www.gotoemerson.com) is a global leader in bringing technology and engineering together to provide innovative solutions to customers in electronics and telecommunications; process control; industrial automation; heating, ventilating, and air conditioning; appliances and tools. Sales in fiscal 2003 were $14 billion. During this period of crisis in our nation’s manufacturing sector, Emerson is pleased to sponsor Jeremy Leonard’s paper, How Structural Costs Imposed on U.S. Manufacturers Harm Workers and Threaten Competitiveness. We believe that this thoughtful study based on fact, not rhetoric, clearly identifies the issues that must be addressed if this country is to stem the decline of its critical industrial base. By now it is no secret that the United States has lost 2.8 million manufacturing jobs over the past three years and that, unlike previous recessions, job losses have continued long after the bottom was reached and output began growing again. Something has clearly changed. At Emerson we are concerned with this change because, while we are a global company, over half of our revenues are still in the United States. If the long-term health of this economy is threatened, then so are we. As Joel Popkin pointed out in a companion paper, Securing America’s Future: The Case for a Strong Manufacturing Base, economies whose manufacturing sectors are not vibrant and growing are doomed to low overall growth. Those who call for a conversion to a service-based economy need only look at Japan and Germany to get a glimpse of the consequences of manufacturing’s decline – not a pretty picture, and not one we want to see in this country. U. S. manufacturing has demonstrated the ability to overcome pure wage differentials with trading partners through innovation, capital investment and productivity. But when the structural cost multipliers Leonard describes in this paper are piled on, the task becomes unmanageable even for best-in-class companies. Concerted effort to get our state and federal legislators to focus on addressing and removing these penalties will yield positive results for the entire economy. It is clear that self-imposed cost penalties are the most important consideration in our competitiveness; it is critical that we move forward and get our own house in order and avoid at all costs the destructive path of protectionist tariff-based responses.
James G. Berges President
v
How Structural Costs Imposed on U.S. Manufacturers Harm Workers and Threaten Competitiveness
INTRODUCTION
By Jerry Jasinowski and Tom Duesterberg
It is relatively easy to identify some of the short-term causes of the severe downturn that has hit U.S.-based manufacturing over the past three years. While recent, rising GDP growth signals that general cyclical conditions are improving, manufacturing continues to lag the overall recovery. The lack of export growth and substantial new capital investment until now explains why the manufacturing recovery to date has been the slowest on record. But the more fundamental concern for manufacturers is a set of structural dis-advantages that are eroding U.S. competitiveness and offsetting much of the recent productivity gains spawned by innovation and relentless corporate cost cutting. This report breaks new ground in documenting those underlying structural costs that are slowly eating away at the ability of U.S. manufacturers to compete effectively. While manufacturers have many challenges in the current global environment, it is the finding of this report that domestically imposed costs—by omission or commission of federal, state, and local governments—are damaging manufacturing more than any foreign competitor and adding at least 22.4 percent to the cost of doing business from the United States. Such internal costs impose a larger burden on U.S. manufacturers than the strong dollar. Why should this nation care about a strong manufacturing base? The main reason is that during the boom of the 1990s, manufacturers in the United States contributed 22 percent of the economic growth and increased its share of total value added in the U.S. economy. Moreover, manufacturing is the source of much of the innovation and productivity growth of the last two decades, which underpins our success in international markets, helps drive productivity growth in the services sector, provides high quality jobs, and raises the standard of living throughout the United States. We should also never lose sight of the importance of the domestic technical prowess and production excellence, which are crucial to our national security. As job creation and strong investment have lagged historical patterns of recovery in the United States during 2003, it is clearer than ever before that getting manufacturing back on its feet is an important part of the formula for a full recovery. We undertook this report because U.S. manufacturers’ position in global trade has deteriorated, despite years of investment and operational streamlining:
• Import penetration of the U.S. market has risen markedly since 1980, advancing from 23 percent
of sectoral GDP to over 67 percent in 2002. • Over the past five years, U.S. export penetration has declined, falling from over 12 percent of
global merchandise trade in 1998 to 10.7 percent in 2002. • This intense global competition means that manufacturers—which account for three quarters of
total U.S. trade—cannot raise prices and find themselves caught in a cost-price squeeze, making any new incremental costs nearly impossible to pass on.
• Nearly 2.8 million jobs have been lost in manufacturing over the past 39 months. • Capital investment outside of information technology remains sluggish.
This report takes a close look at those costs—corporate tax rates, employee benefits, tort litigation, regulatory compliance and energy—and finds that they add a conservatively estimated 22.4 percent to the price of production for U.S. firms, relative to major foreign competitors. Once these underlying cost pressures are understood, it becomes clearer why much of U.S. production is moving offshore. The study establishes a raw cost index benchmark based on wage compensation relative to total value added in manufacturing, comparing the United States and nine major trading partners including Canada,

vi
China, and Mexico. The analysis demonstrates how even nominally more expensive locations such as Canada or the United Kingdom are, in fact, lower-cost locations for production when these expensive cost factors are weighed. Even more startling is that the added costs in the United States are nearly as high as the total production costs in China. Moreover, we believe this report significantly understates the costs imposed on U.S.-based manufac-turers, especially in assessing the impact of legal and regulatory costs. Reliable data on tort costs and regulatory compliance are not available for many developing countries and this study has not attributed a cost where there is not a good data source. We expect to follow up with additional cost studies that focus on these areas as well as update the data. These rising domestic cost pressures are even more important at a time when intense global competition and the resulting deflation in producer prices makes growth in top-line income all but impossible. The result has been a steady decline in the cash flow of manufacturing firms. If ever there were a wake-up call for U.S. policymakers about the costs they continue to impose on U.S. manufacturers, this is it. There is a wide range of policy steps that federal and state governments should immediately take to support stronger U.S. manufacturing. This report highlights the policies that would make the most differ-ence. We encourage elected officials to begin shaping a pro-manufacturing agenda for the near future. The loss of a strong manufacturing base will have unfortunate consequences for the U.S. standard of living as well as national security. We urge all Americans who are concerned about the future of our country to read this report and help foster a new appreciation for manufacturing in Washington, D.C., and all 50 state capitals. We would like to thank Emerson for supporting this study and providing valuable insights to its analysis. We also commend the author, Jeremy Leonard, economic consultant to the Manufacturers Alliance/MAPI, for his creativity in distilling huge amounts of sometimes disparate data to complete this project.
Jerry J. Jasinowski Thomas J. Duesterberg President President and Chief Executive Officer National Association of Manufacturers Manufacturers Alliance/MAPI

1
How Structural Costs Imposed on U.S. Manufacturers Harm Workers and Threaten Competitiveness
Executive Summary The U.S. manufacturing sector in the late 1990s was at the top of its game. Two decades of renewal, innovation, capital deepening, and management im-provement had borne impressive fruit: A remarkable acceleration in productivity growth and rapid inno-vation, combined with modest employment growth, returned the manufacturing sector to its historical role as the engine of U.S. economic growth. In spite of this renaissance, it now finds itself struggling with a painfully sluggish recovery and eroding competitiveness in export markets. The inescapable conclusion is that structural factors out-side of manufacturers’ direct control are eroding the leadership position that U.S. manufacturers have worked so hard to achieve. The raw competitive position of U.S. manufac-turing relative to its major trading partners (as repre-sented by unit wage costs measured in home curren-cies) has improved substantially, largely because domestic unit labor costs declined while those of many trading partners rose considerably. As of 2002, unit labor costs in U.S. manufacturing industries were lower than four of the nine largest U.S. trading partners and only marginally higher than three others. Despite this return to apparent competitive pre-eminence, the position of U.S. manufacturers in global trade has shown a marked deterioration, especially in the last five years. Since 1997, exports as a percent of gross domestic product (GDP) have stagnated, while import penetration has risen sharply, largely due to growing trade with Mexico and China. As a result, the trade deficit ballooned from $31 billion in 1991 (0.5 percent of GDP) to $418 billion (5.0 percent of GDP) in 2002. Furthermore, international competi-tion caused producer prices to stagnate (or even decline for some industries). In the context of strong demand, this would normally cause cash flow growth to decelerate somewhat. In fact, aggregate manu-facturing cash flow actually declined in absolute dollar terms from 1997 to 2000, the three strongest years of the 1990s expansion, indicating that costs were rising more rapidly than revenues. Against this backdrop, the industry downturn that began in June 2000 was a rude awakening. From June 2000 to December 2001 (the trough month for manu-facturing production in the latest recession), manufac-turing lost 1.6 million jobs and production declined by
7.2 percent. Both of these declines were mild by post-World War II historical standards; only the 1990-1991 recession was milder. Had December 2001 been the end of the story, the downturn might have been nothing more than a bump on an otherwise prosperous road. But the ensuing recovery since then has been far short of expectations and significantly weaker than in past recovery periods. Manufacturers have shed nearly 1.2 million additional jobs and production has increased by just 2.1 percent. Such trends immediately following a recession are un-precedented in post-World War II history. Even dur-ing the “jobless recovery” from the 1990-1991 reces-sion, manufacturing employment contracted by only 400,000 additional jobs before growing again, and production grew by an average of 4.5 percent per year. That the U.S. manufacturing sector, which has spent the better part of two decades remaking itself into the envy of the world, now finds itself mired in a slow recovery leads to the inescapable conclusion that cost pressures outside manufacturers’ direct control have conspired to threaten the U.S. manufacturing leadership. This report will, to the extent that data permit, quantify the most critical obstacles: • Excessive corporate taxation. • Escalating costs of health and pension benefits. • Escalating costs of actual or threatened tort
litigation. • Escalating compliance costs for regulatory
mandates, particularly those related to workplace safety, pollution abatement, and corporate governance.
• Rising energy costs, particularly natural gas. Table 1 summarizes the quantitative results of this report, which will be developed and discussed in detail in later sections. The first row shows the “raw cost index” of manufacturers, which is simply total wage compensation (excluding employee benefits) divided by value-added in manufacturing. In order to abstract from exchange rate fluctuations during the 1990s, the index for each country is measured from a 1990 benchmark and “inflated” by the growth in unit wage costs in the appropriate home currency from 1990 to 2002. (For more detail on construction of the index, please refer to the Appendix.) This is the most basic measure of the competitive posture of a given manufacturing sector. As explained in a later section, it takes into account international differences in

2 The Manufacturing Institute
Table 1 Effect of Key “Overhead Costs” on Raw Cost Index
of Nine Largest U.S. Trading Partners, 2002 (U.S. dollars per hour)
United States
Average of nine
partners Canada Mexico Japan China Germany United
Kingdom South Korea Taiwan France
Raw cost index 24.30 19.30
27.57 8.11 16.92 5.34 29.60
28.30 23.96 16.41 26.50
Difference relative to U.S. costs in percent
Corporate tax rate – -5.6% -3.4% -6.0% 2.0% -15.0% -0.4% -10.0% -10.3% -15.0% -5.7% Employee benefits – -5.5% -4.8% -9.4% -9.4% -12.6% 3.6% -5.1% 9.0% -11.5% 10.7% Tort costs – -3.2% -3.1% N/A -3.3% N/A -0.7% -3.4% N/A N/A -1.3% Natural gas costs – -0.5% -6.0% -2.3% 12.5% -2.3% 0.6% 2.1% 4.1% 15.3% -4.2% Pollution abatement – -3.5% -2.8% N/A -2.3% N/A -2.4% -3.0% N/A N/A -1.5%
Manufacturing production costs relative to the United States accounting for differences in overhead costs (dollars per hour)
Effective cost index 24.30 16.02
22.46 6.19 16.64 3.50 29.77
23.14 22.67 12.85 25.77
Source: Author’s calculations based on data in subsequent tables and charts Note: Data for tort costs and regulatory compliance costs are limited to the industrialized partners. Conservative assumptions have been made in estimating the missing values, as described in later sections. Thus, the absence of these data likely understates the overall cost advantage of U.S. trading partners. productivity, capital intensity, and raw material costs and thus indirectly measures the efficiency with which manufacturers use their nonlabor inputs in the pro-duction process. The United States is fairly well-positioned, with lower costs than in Canada, France, Germany, and the United Kingdom and a bit higher than in Japan and Taiwan. Perhaps surprisingly to some readers, South Korea’s rapid industrialization has pushed up its raw cost index too close to U.S. levels. Finally, as is well-known, lower wages in Mexico and China give those countries a considerable edge in terms of the raw cost index. Once the effect of cor-porate tax differentials, employee benefits, tort costs, energy costs, and regulatory compliance are accounted for, the competitive picture becomes much more ominous for the U.S. manufacturing sector, as the last row of Table 1 demonstrates. Canada (the largest U.S. trading partner) gains a substantial cost ad-vantage, and the U.S. cost advantage relative to the United Kingdom disappears altogether. Furthermore, the relative costs of developing partners—Mexico,
China, South Korea and Taiwan—drop considerably. U.S. manufacturers are at a cost disadvantage nearly across the board with respect to corporate tax rate differentials, employee benefits, and litigation costs. The United States enjoys a large advantage in energy
costs with regard to Japan, South Korea, and Taiwan. Nevertheless, recent spikes in natural gas prices have dis-proportionately affected U.S. manufacturers that have be-come more reliant on that fuel. As will be discussed later, the United States, should be able to exploit its gas reserves—one of the world’s largest—to give it a competitive edge over other major trading partners.
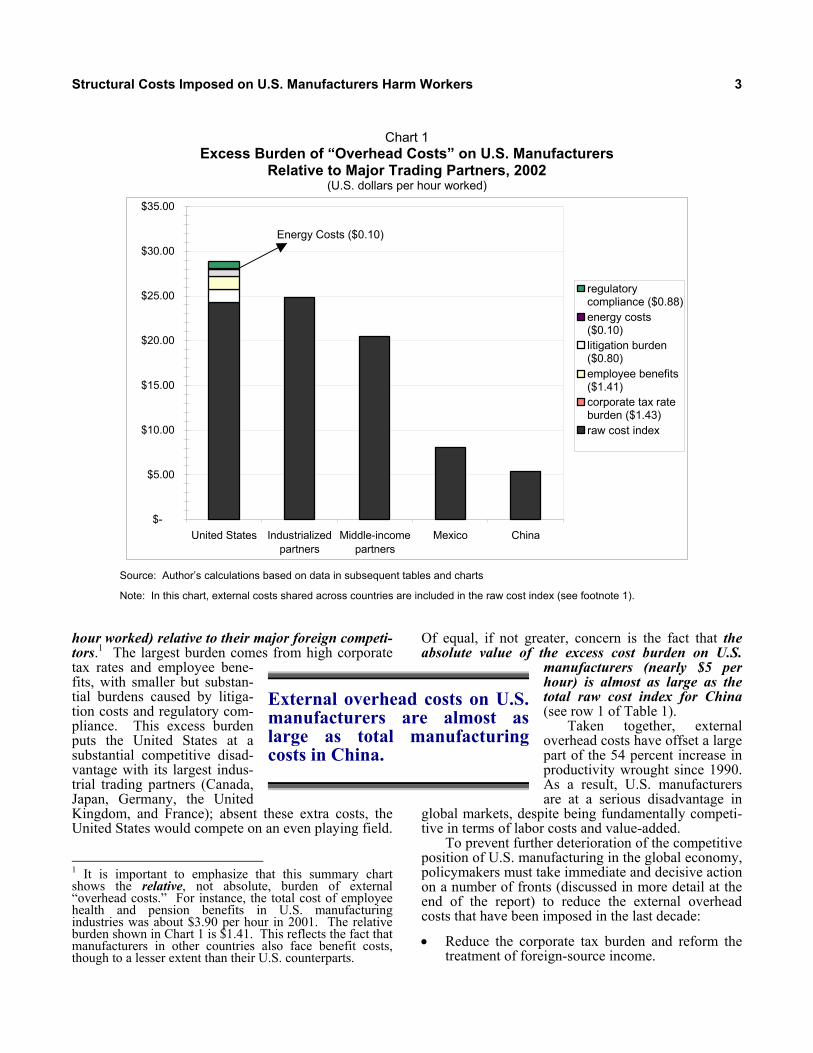
A different—and perhaps more concise—way to express the country-by-country data in Table 1 is as a burden to U.S. manufacturing costs. This is done in Chart 1 by aggregating the cost advantages of the nine largest U.S. trading partners (weighted by their re-spective trade shares) and “inverting” them into the equivalent U.S. cost burden. Chart 1 shows that external overhead costs add at least 22.4 percent to unit labor costs of U.S. manufacturers (nearly $5 per
External overhead costs add atleast 22.4 percent to unit laborcosts of U.S. manufacturers(nearly $5 per hour worked)relative to their major foreigncompetitors.
Structural Costs Imposed on U.S. Manufacturers Harm Workers 3
Chart 1
Excess Burden of “Overhead Costs” on U.S. Manufacturers Relative to Major Trading Partners, 2002
(U.S. dollars per hour worked)
$-
$5.00
$10.00
$15.00
$20.00
$25.00
$30.00
$35.00
United States Industrializedpartners
Middle-incomepartners
Mexico China
regulatorycompliance ($0.88)energy costs($0.10)litigation burden($0.80)employee benefits($1.41)corporate tax rateburden ($1.43)raw cost index
Source: Author’s calculations based on data in subsequent tables and charts
Note: In this chart, external costs shared across countries are included in the raw cost index (see footnote 1). hour worked) relative to their major foreign competi-tors.1 The largest burden comes from high corporate tax rates and employee bene-fits, with smaller but substan-tial burdens caused by litiga-tion costs and regulatory com-pliance. This excess burden puts the United States at a substantial competitive disad-vantage with its largest indus-trial trading partners (Canada, Japan, Germany, the United Kingdom, and France); absent these extra costs, the United States would compete on an even playing field. 1 It is important to emphasize that this summary chart shows the relative, not absolute, burden of external “overhead costs.” For instance, the total cost of employee health and pension benefits in U.S. manufacturing industries was about $3.90 per hour in 2001. The relative burden shown in Chart 1 is $1.41. This reflects the fact that manufacturers in other countries also face benefit costs, though to a lesser extent than their U.S. counterparts.
Of equal, if not greater, concern is the fact that the absolute value of the excess cost burden on U.S.
manufacturers (nearly $5 per hour) is almost as large as the total raw cost index for China (see row 1 of Table 1).
Taken together, external overhead costs have offset a large part of the 54 percent increase in productivity wrought since 1990. As a result, U.S. manufacturers are at a serious disadvantage in
global markets, despite being fundamentally competi-tive in terms of labor costs and value-added. To prevent further deterioration of the competitive position of U.S. manufacturing in the global economy, policymakers must take immediate and decisive action on a number of fronts (discussed in more detail at the end of the report) to reduce the external overhead costs that have been imposed in the last decade:
• Reduce the corporate tax burden and reform the treatment of foreign-source income.
External overhead costs on U.S.manufacturers are almost aslarge as total manufacturingcosts in China.
Energy Costs ($0.10)

4 The Manufacturing Institute
• Reduce the burden of rising health coverage costs and encourage greater consumer responsibility for health status and coverage costs.
• Reform rules for funding pension plans to avoid devastating cyclical swings in funding requirements.
• Undertake serious legal reform, such as curtailing frivolous lawsuits, placing large, nationwide class action lawsuits in federal court, and negotiating fair and equitable compensation to legitimate asbestos claims.
• Establish a more objective cost-benefit review process for proposed and existing regulations that takes full account of adverse business impacts.
• Adopt changes in land-use regulations that allow access to undeveloped domestic natural gas reserves.
The Paradox of U.S. Manufacturing: Productivity and Innovation Leadership
Amid Deteriorating International Competitiveness
Productivity and Innovation Leadership Over the past two decades (and especially since 1990), the U.S. manufacturing sector has undergone a startling renaissance characterized by strong capital investment, accelerating productivity growth, and innovation leadership.2 During the 1990s expansion, manufacturing output accounted for 22 percent of GDP growth, more than manufacturing’s 17 percent share of the overall economy. U.S. manufacturing productivity growth accelerated to 4.5 percent per year from 1995 to 2000, outpacing its industrialized trading partners by a significant margin. In fact, trend productivity growth in the 1990s was higher than in any previous post-World War II expansion.3 This resulted from an investment boom, particularly in information technology equipment. Use of this equipment and associated management improvements began to fan out to other sectors of the economy, more than doubling trend productivity growth in nonmanu-facturing industries. As a result, living standards in the United States—already the highest in the world—began to pull away from Western Europe, Canada, and Japan, reversing the tendency towards conver-gence experienced in prior decades.
2 For a detailed analysis of U.S. manufacturing leadership, see Thomas J. Duesterberg and Ernest H. Preeg, eds., U.S. Manufacturing: The Engine for Growth in a Global Economy (Westport, CT: Greenwood Press, 2003). 3 Jeremy A. Leonard, “The Productivity Acceleration Is Here To Stay,” Manufacturers Alliance/MAPI, ER-556e, June 2003.
Manufacturing is the engine of innovation. In addition to generating 90 percent of new patent approvals, it accounted for 90 percent of business research and development (R&D) in the 1980s and more than 75 percent through most of the 1990s (the drop reflected large R&D investments by the whole-sale trade, computer system design, and engineering services sectors, all of which are closely aligned with manufacturing). Manufacturing’s R&D share has fallen to just over 60 percent since 1997, in large part due to the cost pressures described in this report. Trends in International Trade International trade trends have shifted sharply to the detriment of U.S. manufacturers in spite of the productivity renaissance. The U.S. share of world manufactured exports increased from 12.1 percent to 14 percent in the early 1990s, but has declined sharply in the last five years. Over the same period, import penetration has jumped alarmingly. Much of this penetration is by newly industrializing countries, which are rapidly moving into high value-added markets such as transportation equipment, industrial machinery, and electrical and electronic equipment that historically have been dominated by industrial-ized nations. Increasing global competition also has brought about a soft pricing environment, which has squeezed cash flow and brought the issue of production costs to the forefront. Since 1980, the value of world trade has more than tripled, reaching $6.5 trillion in 2002. As of 2001 (the most recent year for which regional data are available), 46 percent of total trade occurred within the three major industrialized regions of the world: North America (excluding Mexico), Western Europe, and Japan. This reflects a decrease from the 49 percent registered in 1993 but an increase from the 42 percent recorded in 1983. This apparent trade stability hides major changes in U.S. trade patterns over the past two decades, particularly with respect to imports. The trade sector has grown rapidly relative to the rest of the economy, particularly during the strong economic expansion of the 1990s. Over the same period, nations other than Canada, Western Europe, and Japan have become important players in U.S. trade. Chart 2 shows U.S. imports and exports as a percent of GDP since 1960. In the era of fixed exchange rates prior to 1973, imports and exports each hovered between 4 percent and 6 percent of GDP. After that, the U.S. economy opened up rapidly to world markets, the trade share of GDP doubled by 1980. The 1980s saw a significant dip in exports brought on by the unusually strong U.S. dollar, while imports hovered at around 10 percent of GDP. Strong growth in imports in the 1990s, coupled with erratic export demand, caused a wide trade deficit to develop.

Structural Costs Imposed on U.S. Manufacturers Harm Workers 5
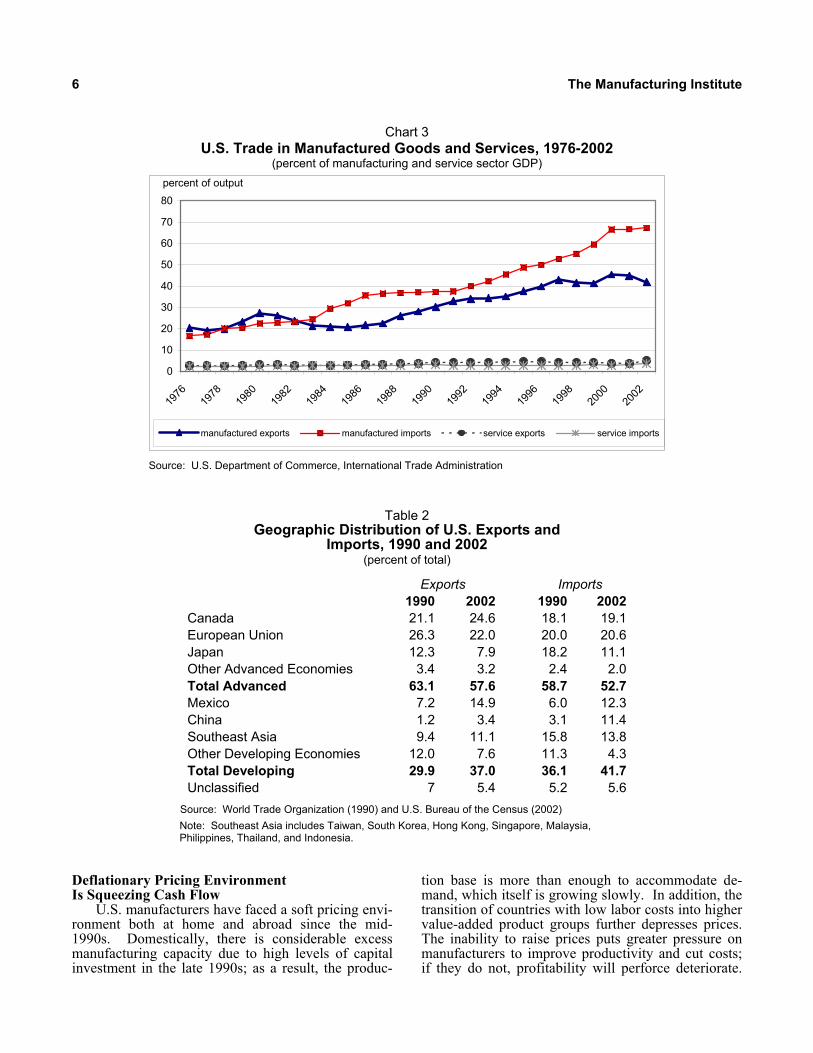
The overall numbers mask startling developments in the manufacturing sector, which accounts for nearly 75 percent of total trade. An important point that cannot be emphasized too strongly is that the manu-facturing sector is responsible for the entire 1990s increase in import penetration. Chart 3 breaks down total trade into its manufactured goods and service components, each expressed as a percentage of the relevant sectoral GDP. It reveals that import pene-tration soared to a record 67.3 percent of manufac-turing GDP in 2002. This growth far outstripped growth in manufacturing exports, opening a manufac-turing trade deficit on the order of 25 percent of man-ufacturing GDP. Service sector exposure to world markets remains marginal by comparison. By 2002, exports accounted for 3.9 percent of service sector GDP and imports for 3.3 percent, resulting in a small trade surplus in services. Much of service sector trade is connected with tourism to the United States (ex-ports) and U.S. tourism elsewhere in the world (imports). The geographic distribution of U.S. exports and imports also has changed considerably since 1990, as Table 2 shows. Developing nations now account for 37 percent of U.S. exports and 41.7 percent of U.S. imports, each a significantly higher share than in 1990. A vivid illustration of the growing competitive pressures on U.S. manufacturers in the developing world is the explosive growth in imports originating
from Mexico (from 6.0 percent to 12.3 percent of imports) and China (from 3.1 percent to 11.4 percent of imports). In addition, while the import share of Southeast Asian nations declined somewhat, it is now larger than that of Japan. This report will focus on the nine largest U.S. trading partners, which are shown in Table 3. Canada and Mexico together account for nearly one-third of U.S. trade, due both to geographic proximity and the adoption of the North American Free Trade Agree-ment in 1994. Other major players include Japan and China (9.4 percent and 8.0 percent of trade, respec-tively), and the three largest European economies, which account for 11.4 percent. A common misperception is that most of the trade from developing nations is accounted for by textiles, clothing, footwear, and other traditionally labor-intensive products that often do not directly compete with products manufactured by U.S.-based companies (either because their quality is inferior to similar U.S. products or because U.S. producers have exited the relevant markets). While this may have been the case 10 or 20 years ago, nothing could be further from the truth today. As Table 4 demonstrates, all four of the top U.S. developing country traders are orienting themselves toward high-end manufactured goods such as industrial machinery, telecom equipment and office machines, and transportation equipment.
Chart 2 U.S. Exports and Imports, 1960-2002
(percent of GDP)
0
2
4
6
8
10
12
14
16
1960
1962
1964
1966
1968
1970
1972
1974
1976
1978
1980
1982
1984
1986
1988
1990
1992
1994
1996
1998
2000
2002
percent
imports
exports
Source: U.S. Department of Commerce
6 The Manufacturing Institute
Chart 3 U.S. Trade in Manufactured Goods and Services, 1976-2002
(percent of manufacturing and service sector GDP)
0
10
20
30
40
50
60
70
80
1976
1978
1980
1982
1984
1986
1988
1990
1992
1994
1996
1998
2000
2002
manufactured exports manufactured imports service exports service imports
percent of output
Source: U.S. Department of Commerce, International Trade Administration
Table 2 Geographic Distribution of U.S. Exports and
Imports, 1990 and 2002 (percent of total)
Exports Imports 1990 2002 1990 2002 Canada 21.1 24.6 18.1 19.1 European Union 26.3 22.0 20.0 20.6 Japan 12.3 7.9 18.2 11.1 Other Advanced Economies 3.4 3.2 2.4 2.0 Total Advanced 63.1 57.6 58.7 52.7 Mexico 7.2 14.9 6.0 12.3 China 1.2 3.4 3.1 11.4 Southeast Asia 9.4 11.1 15.8 13.8 Other Developing Economies 12.0 7.6 11.3 4.3 Total Developing 29.9 37.0 36.1 41.7 Unclassified 7 5.4 5.2 5.6
Source: World Trade Organization (1990) and U.S. Bureau of the Census (2002) Note: Southeast Asia includes Taiwan, South Korea, Hong Kong, Singapore, Malaysia, Philippines, Thailand, and Indonesia.
Deflationary Pricing Environment Is Squeezing Cash Flow U.S. manufacturers have faced a soft pricing envi-ronment both at home and abroad since the mid-1990s. Domestically, there is considerable excess manufacturing capacity due to high levels of capital investment in the late 1990s; as a result, the produc-
tion base is more than enough to accommodate de-mand, which itself is growing slowly. In addition, the transition of countries with low labor costs into higher value-added product groups further depresses prices. The inability to raise prices puts greater pressure on manufacturers to improve productivity and cut costs; if they do not, profitability will perforce deteriorate.

Structural Costs Imposed on U.S. Manufacturers Harm Workers 7
Chart 4 shows trends in the producer price index for manufacturing production as well as the export price index for industrial supplies. Prices for exported industrial supplies have firmed up somewhat in 2003, but are essentially unchanged relative to 1995. Pro-
ducer prices for manufacturers have fared somewhat better, but have risen by only 7 percent since 1996. The overall price level, as measured by the consumer price index, has risen more than 40 percent since 1990.
Table 3 Top Trading Partners of the United States, 2002
(imports plus exports in billions of dollars and as a percent of total)
$Billion Percent of
Total Canada 371.39 20.1 Mexico 232.26 12.6 Japan 172.93 9.4 China 147.22 8.0 Germany 89.11 4.8 United Kingdom 74.12 4.0 South Korea 58.17 3.2 Taiwan 50.59 2.7 France 47.43 2.6 Total 1,243.22 67.3
Source: U.S. Department of Commerce
Table 4 U.S. Imports From Major Developing Country
Partners by Product Type, 2002 (percent of total merchandise exports)
Product group
Mexico
China
South Korea
Taiwan
Office machines and telecom equipment 17.4 23.6 30.9 33.6 Electrical machinery 12.6 8.2 14.6 16.6 Transportation equipment 19.8 1.5 20.9 4.4 Textiles, apparel, footwear and handbags 7.2 20.0 9.3 7.9 Miscellaneous manufacturing 2.5 18.8 3.0 7.8 Industrial machinery 7.6 3.6 6.0 7.4 Fabricated metal products 3.8 4.7 4.4 8.7 Furniture 2.8 5.6 0.2 2.5 Total 73.6 86.0 89.4 88.9
Source: U.S. Department of Commerce
Note: “Miscellaneous manufacturing” includes toys, sporting goods, and other small articles primarily destined for consumers.

8 The Manufacturing Institute
Chart 4 Producer Price Index for Manufacturing Industries and Export
Price Index for Industrial Supplies, 1990-2003
60
70
80
90
100
110
120
130
140
150
1990 1991 1992 1993 1994 1995 1996 1997 1998 1999 2000 2001 2002 2003
producer price index export price index consumer price index
index (1990 = 100)
Source: U.S. Bureau of Labor Statistics
Note: 2003 reflects data through September. The soft pricing environment since the mid-1990s has taken its toll on manufacturing cash flow. As noted in a study by Popkin,4 one measure of cash flow is the sum of undistributed profits and depreciation charges. By this measure, manufacturers accounted for more than 35 percent of all corporate cash flow in the United States in 1995. One might have expected that the strong manufacturing boom from 1995 to 2000 would have boosted this share further, but in fact it eased to 30 percent by 2000 and then dipped sharply to 25 percent in the wake of the 2000-2001 manu-facturing recession (Table 5). Reduced cash flow constrains resources available to invest in research and development, capital equipment, and other activities that are critical for future gains in productivity. The inability to raise prices is only part of the reason behind the cash flow paradox. Mathematically speaking, in an environment of strong demand, cash flow will increase even in the context of stagnant producer and export prices, provided that the costs of production do not increase more rapidly than demand. It is thus startling that manufacturing cash
4 Joel Popkin and Company, “Securing America’s Future: The Case for a Strong Manufacturing Base,” report pre-pared for the National Association of Manufacturers Council of Manufacturing Associations, June 2003, p. 36.
flow declined by 10 percent in dollar terms from 1997 to 2000, even though manufacturing production rose by nearly 20 percent—showing clearly that the cash flow crisis is a structural, rather than cyclical, prob-lem.5 The implication is that the costs of production for U.S. manufacturers have risen dramatically and, as the next sections demonstrate, the culprits are factors that are outside the direct control of manufacturers themselves.
Raw Cost Competitiveness of U.S. Manufacturers
As a starting point to the quantitative analysis of the impact of exchange rates, taxes, regulations, employee benefits, and energy prices on U.S. manu-facturing competitiveness, it is useful to ask the question: What would the raw cost position of U.S. manufacturing relative to major U.S. trading partners be in the absence of obstacles outside their direct control? The answer to this question can be found in unit labor costs, which are defined as the ratio of
5 In periods of rapid growth, companies typically allot more resources to working capital in order to ramp up production. While this can cause cash flow growth to decelerate, it generally does not cause absolute declines.

Structural Costs Imposed on U.S. Manufacturers Harm Workers 9
employee wage compensation to value added. As a cost measure, they are superior to wage compensation per hour of work, for the reasons described in the text box.
Table 5
U.S. Manufacturing Cash Flow, 1990-2001 In
millions of dollars
As percent of total
corporate cash flow
As percent of manufacturing
output
1990 169,469 37.2 16.31991 152,544 32.2 14.61992 156,937 30.7 14.51993 166,462 30.9 14.71994 205,249 33.8 16.81995 234,362 34.7 18.21996 241,834 33.9 18.41997 257,725 33.3 18.71998 225,528 30.9 15.81999 245,950 30.4 16.62000 231,573 30.0 15.22001 198,239 25.3 13.9Source: U.S. Bureau of Economic Analysis, U.S. Department of Commerce
Note: Cash flow is defined as the sum of undistributed profits and depreciation allowances. Chart 5 reports hypothetical manufacturing unit wage costs (excluding employee benefits) in 2002 for the United States and its nine largest trading partners based on exchange rates of 1990, a concept which this report will term “raw cost index.” (A detailed description of its derivation can be found in the Appendix.) Using 1990 exchange rates for the international comparisons removes the effect of swings in the dollar’s value, which have worked to the considerable disadvantage of U.S. manufacturers. The competitive position of U.S. manufacturers exceeded that of their counterparts in Canada, Germany, and the United Kingdom, and France was only slightly inferior to that of South Korea, Japan, and Taiwan. The chart also hints at the analysis to follow by showing the burden of external overhead costs and currency fluctuations on the U.S. competitive position. A second important point is that growth in unit labor costs for U.S. manufacturing actually declined by 0.1 percent over the 1990-2002 period, driven by strong productivity growth. This compares very favorably to Canada, Germany, South Korea, and the United Kingdom, where unit labor costs increased by 10.6 percent, 18.2 percent, 29.3 percent, and 37.1 percent, respectively. Only in France, Japan, and Taiwan did unit labor costs decline. The decline in France deserves special mention, since it is due fundamentally to rigidities in the French labor market.
Employment laws make it very costly to lay off manufacturing employees, so French companies have compensated by increasing capital investment rather than hiring new employees. While this improves labor productivity and reduces unit labor costs, it does not alter the fact that the cost of labor remains high relative to the United States. Japan’s unit labor costs are only about two-thirds of the U.S. level, due in large part to the decade-long economic slump that began in 1990, during which unemployment increased from 2.1 percent to 5.4 percent. With a soft labor market, Japanese manufac-turers have been able to hold hourly compensation costs in check. Productivity grew at about the same rate as in the United States, thus allowing unit labor costs to decline relative to the United States during the 1990s. When (or if) the Japanese economy emerges from the doldrums, this advantage is likely to narrow. Mexico and China stand out as the two most formidable competitive challenges to U.S. manufac-turers in the next 10 years. Each currently has a
Unit Labor Costs as a Measureof Competitiveness
Unit labor costs are a fundamental summarymeasure of a company’s cost structure. Byscaling wage costs to value added (as opposedto hours worked) they take into account inter-national differences in labor productivity. Forexample, wage compensation per hour workedin manufacturing is higher in the United Statesthan it is in the United Kingdom. However, thatdifference is not due to a higher labor cost struc-ture in the United States. Rather, it is explainedby the fact that U.S. manufacturing workers aresignificantly more productive than their Britishcounterparts. By scaling wage compensation tovalue added, that productivity difference is in-corporated into the comparison and the truecompetitive position of U.S. manufacturing isrevealed. By a similar line of reasoning, differences incapital intensity are also accounted for in unitlabor costs. Heavy capital intensity implies thatworkers can produce more in one hour of work,improving labor productivity and reducing unitlabor costs. Thus, factors that affect capitalintensity (such as real interest rates, tax policies,and debt and equities markets) are indirectlycaptured in unit labor costs. Finally, differences in the cost of raw materialsare incorporated into unit labor costs. The costsof raw materials and intermediate goods aresubtracted from sales when calculating net valueadded (it has no effect on total sales). It followsthat an increase in raw materials cost reducesvalue added, thus increasing implied unit laborcosts.
10 The Manufacturing Institute
considerable advantage over the United States with regard to unit labor costs and is beginning to move into high value-added exports. A silver lining is that anecdotal evidence reveals rapid growth in labor compensation costs. In China, for instance, manufac-turing wages have grown on the order of 16 percent per year since 1991, suggesting a cumulative growth rate of well above 100 percent.6 Furthermore, there is persuasive evidence that wages for skilled Chinese workers are likely to increase dramatically over the next 10 years, narrowing the wide wage gap that currently exists.7 Mexican manufacturing wages also are likely to have risen substantially, although com-plete historical data are not available. Trends in South Korea vividly illustrate the effect of industrialization on the cost structure of manufac-turing that may foretell developments in Mexico and China. Only 25 years ago, South Korea counted itself among the low wage, low value-added developing economies, with a level of per capita GDP of less than one-sixth that of the United States. However, it is clear from the chart that, if recent trends in unit labor costs continue, the raw competitive position of U.S. manufacturing soon will exceed that of South Korea. This trend is the rule rather than the exception: rapid industrialization invariably brings strong growth in wages and concomitant demands for benefits such as health care and pensions. If unit labor costs were the only factor influencing a firm’s overall cost structure, then U.S. manufac-turers would be much more dominant players in global markets than the current trade situation suggests. In reality, numerous elements outside of their control increase production costs and reduce their international competitiveness.
The Cost Squeeze: Obstacles to the Competitive Posture of
U.S. Manufacturers High Corporate Tax Rates Although it has a reputation as a low tax nation relative to its peers in Europe and Japan, the United States actually taxes corporate income at a higher rate (and usually more than once) than its major trading partners. This acts as a drag on competitiveness for three primary reasons: it constrains after-tax cash flow, discourages establishment of foreign manufac-turing facilities in the United States, and encourages the migration of U.S. manufacturing facilities to lower-tax jurisdictions.
6 Yiping Huang, “How Cheap is Chinese Labour?” Citi-group Current Economics, June 2003. 7 Cliff Waldman, “The Labor Market Dynamic in Post-Re-form China: History, Evidence, and Implications,” Manu-facturers Alliance/MAPI, ER-561e, September 2003.
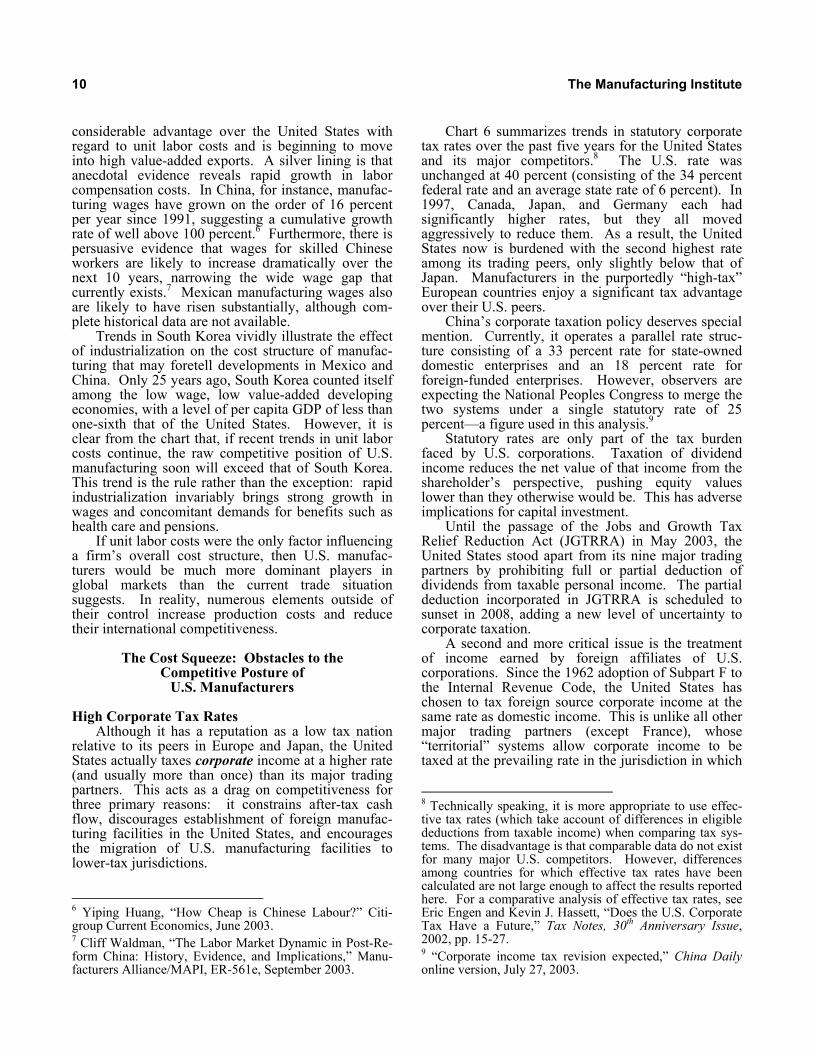
Chart 6 summarizes trends in statutory corporate tax rates over the past five years for the United States and its major competitors.8 The U.S. rate was unchanged at 40 percent (consisting of the 34 percent federal rate and an average state rate of 6 percent). In 1997, Canada, Japan, and Germany each had significantly higher rates, but they all moved aggressively to reduce them. As a result, the United States now is burdened with the second highest rate among its trading peers, only slightly below that of Japan. Manufacturers in the purportedly “high-tax” European countries enjoy a significant tax advantage over their U.S. peers. China’s corporate taxation policy deserves special mention. Currently, it operates a parallel rate struc-ture consisting of a 33 percent rate for state-owned domestic enterprises and an 18 percent rate for foreign-funded enterprises. However, observers are expecting the National Peoples Congress to merge the two systems under a single statutory rate of 25 percent—a figure used in this analysis.9 Statutory rates are only part of the tax burden faced by U.S. corporations. Taxation of dividend income reduces the net value of that income from the shareholder’s perspective, pushing equity values lower than they otherwise would be. This has adverse implications for capital investment. Until the passage of the Jobs and Growth Tax Relief Reduction Act (JGTRRA) in May 2003, the United States stood apart from its nine major trading partners by prohibiting full or partial deduction of dividends from taxable personal income. The partial deduction incorporated in JGTRRA is scheduled to sunset in 2008, adding a new level of uncertainty to corporate taxation. A second and more critical issue is the treatment of income earned by foreign affiliates of U.S. corporations. Since the 1962 adoption of Subpart F to the Internal Revenue Code, the United States has chosen to tax foreign source corporate income at the same rate as domestic income. This is unlike all other major trading partners (except France), whose “territorial” systems allow corporate income to be taxed at the prevailing rate in the jurisdiction in which
8 Technically speaking, it is more appropriate to use effec-tive tax rates (which take account of differences in eligible deductions from taxable income) when comparing tax sys-tems. The disadvantage is that comparable data do not exist for many major U.S. competitors. However, differences among countries for which effective tax rates have been calculated are not large enough to affect the results reported here. For a comparative analysis of effective tax rates, see Eric Engen and Kevin J. Hassett, “Does the U.S. Corporate Tax Have a Future,” Tax Notes, 30th Anniversary Issue, 2002, pp. 15-27. 9 “Corporate income tax revision expected,” China Daily online version, July 27, 2003.

Structural Costs Imposed on U.S. Manufacturers Harm Workers 11
Chart 5
Raw Cost Position of the United States and Its Nine Largest Trading Partners, 2002
0
5
10
15
20
25
30
35
Germany UnitedKingdom
Canada France UnitedStates
SouthKorea
Japan Taiwan Mexico China
U.S. dollars per hour worked
impact of external overhead costs
Source: Organization for Economic Cooperation and Development, U.S. Bureau of Labor Statistics, National Statistics of Taiwan, UN Industrial Development Organization, and author’s calculations (see Appendix for details).
Chart 6 Statutory Corporate Tax Rates for the United States and Its Nine
Largest Trading Partners, 1997 and 2003
0
10
20
30
40
50
60
70
UnitedStates
Canada Mexico Japan China Germany UnitedKingdom
SouthKorea
Taiwan France
1997 2003
percent
Source: KPMG Corporate Tax Rate Survey

12 The Manufacturing Institute
the income is earned. The philosophy behind Subpart F originated in the notion that foreign investment is a substitute for domestic investment and, therefore, companies should not gain a tax advantage for moving production offshore. This principle served U.S. com-panies fairly well in the 1960s when they enjoyed a huge competitive advantage over their major trading partners and dominated world foreign direct invest-ment; the fact that foreign-source taxation raised their overall cost structure only marginally diminished their competitive dominance. The world has changed substantially since then. European and Japanese manufacturers became much more cost competitive, the U.S. share of world trade declined substantially, and foreign producers made deep inroads into U.S. industrial product markets. As a result, the marginal U.S. tax burden of the 1960s now has become one of the largest drags on U.S. international competitiveness. U.S. policymakers have attempted to counteract the tax disadvantage imposed by Subpart F by allow-ing U.S. multinationals to exclude a certain portion of foreign-source income from U.S. corporate taxes. Beginning in 1971, companies were allowed to create a domestic international sales corporation (DISC), replaced in 1984 by the foreign sales corporation (FSC). Each allowed partial tax deferral of income of a corporate foreign subsidiary derived from handling U.S. export sales. These mechanisms have been challenged successfully by the European Commission before the General Agreement on Tariffs and Trade (GATT) and the World Trade Organization (WTO) as illegal export subsidies.10 Further complicating the situation is the widespread adoption of value-added taxes (VATs) by major U.S. competitors. VATs are classified for trade purposes as “indirect” taxes (meaning that, while they are statutorily imposed on manufacturers, they can be passed on partially to consumers in the form of higher prices), and as such they can be rebated for exports and imposed on imports. Thus, U.S. exports are subject to both U.S. corporate tax and the VAT of the destination country, while imports to the United States are VAT-free and are subject to the usually lower corporate tax rate of the exporting country. Estimates of the tax burden related to VAT adjustments are in
10 For a history of the dispute concerning DISCs and FSCs, see Gary Clyde Hufbauer, “The Foreign Sales Corporation Drama: Reaching the Last Act?” Institute for International Economics Policy Brief PB02-10, November 2002.
the neighborhood of $60 billion per year, or about 4 percent of manufacturing value added.11
State and local business taxes are a final component of manu-facturers’ tax burden. Although international comparisons are be-yond the scope of this paper, it bears noting that in 2002, U.S. businesses paid nearly $378 billion in taxes of all kinds to
states and localities, or 41 percent of total state and local tax revenues.12 Table 6 summarizes the tax advantage due to differences in statutory corporate tax rates for the nine largest U.S. trading partners. Expressed as a trade-weighted average, the U.S. corporate tax burden reduces U.S. cost competitiveness by 5.6 percentage points. Canada and Mexico, which carry a large trade weight, have a small advantage, while China, the United Kingdom, South Korea, and Taiwan each have much larger advantages.
Table 6
Burden of the Corporate Tax Rates on U.S. Manufacturing’s Raw Cost
Competitiveness Relative to the Nine Largest U.S.
Trading Partners, 2003
Statutory corporate tax rate (percent)
Difference from U.S.
(percentage points)
United States 40.0 — Canada 36.6 -3.4 Mexico 34.0 -6.0 Japan 42.0 2.0 China 25.0 -15.0 Germany 39.6 -0.4 United Kingdom 30.0 -10.0 South Korea 29.7 -10.3 Taiwan 25.0 -15.0 France 34.3 -5.7 Trade-weighted average of above countries -5.6
Source: Chart 6 and author’s calculations It is important to note that the data in Table 6 do not account for the competitive disadvantage caused by either double taxation of dividend income or the 11 Ernest S. Christian, “Manufacturing Repairs,” The Wash-ington Times, October 2, 2003. 12 Robert Cline, William Fox et al., “A Closer Examination of the Total State and Local Business Tax Burden,” report prepared for the Council on State Taxation, January 2003.
The U.S. corporate tax burdenreduces cost competitiveness by5.6 percentage points.

Structural Costs Imposed on U.S. Manufacturers Harm Workers 13
tax treatment of foreign-source income. Comparable international data do not exist to make meaningful quantitative comparisons. Nevertheless, each does impose additional costs on U.S. manufacturers that are not borne by their peers in other countries, implying that their aggregate tax disadvantage is in fact larger than Table 6 suggests. This report errs heavily on the side of conservatism by using the results in Table 6 as a complete measure of the U.S. relative corporate tax burden. Costs of Employee Benefits A major area of concern for manufacturing is the escalating cost of providing employee benefits—most notably health care and pensions—to current and re-tired employees. The United States differs markedly from many of its major trading partners in that busi-nesses play a much bigger role in the financing of health and retirement benefits. In other countries, health care and retirement benefits are funded in large part by governments via general income taxes. The U.S. emphasis on private sector provision of these benefits provides many advantages over publicly funded models, including better quality, more choice, and greater flexibility. However, it also means that the burden of the escalating costs in recent years falls heavily on business. Table 7 shows the proportion of compensation for manufacturing production workers accounted for by benefits for the nine largest U.S. trading partners, as well as the percentage point difference from the United States. It is a comprehensive measure that in-cludes legally required contributions for government programs such as public pensions, public health plans (Medicare only in the United States), and unemploy-ment insurance, as well as employer contributions for privately funded benefits, the most important of which are retirement plans and, in the United States, health insurance.
Benefits are 20.6 percent of total U.S. compensation, which is substantially higher than for others, except Germany, South Korea, and France. This may seem somewhat surprising, because its com-petitors (particularly the mature industrial democra-cies) generally have more generous employer-funded public social programs. On a trade-weighted basis, U.S. benefit costs amount to 5.5 more percentage points of compensation than its major trade competitors. This seemingly paradoxical result stems from the large role that U.S. manufacturers play in funding health insurance and retirement pensions for their
employees. As the next two subsections point out, re-cent escalations in health care and pension costs are pri-mary factors behind the U.S. competitive disadvantage. Health care.—As is well-known, the United States spends more on health care (as a percent of GDP) than any other country, and expenditures have outpaced general inflation for years. While a full treatment of the structural problems facing U.S. health care delivery is beyond the scope of this paper,13 it is important to focus on the disproportionate financing burden faced by U.S. manufacturers relative to their foreign counterparts.
Table 7 Benefits as a Percentage of Total Compensation for Manufacturing
Production Workers, United States and Its Nine Largest
Trading Partners, 2001
Benefits as percent of total compensation
Percentage point
difference from U.S.
United States 20.6 Canada 15.8 -4.8 Mexico 11.2 -9.4 Japan 11.2 -9.4 China 8.0 -12.6 Germany 24.2 3.6 United Kingdom 15.5 -5.1 South Korea 29.6 9.0 Taiwan 9.1 -11.5 France 31.3 10.7 Trade-weighted average of above countries -5.5 Sources: U.S. Bureau of Labor Statistics and “The Labor Market Dynamic in Post-Reform China: History, Evidence, and Implications,” Manufacturers Alliance/MAPI, ER-561e, September 2003
Note: China data include health benefits only. Chart 7 illustrates the breakdown of health expen-ditures among the eight major U.S. trading partners for which data are available (only public-sector funding data are available for China). It demonstrates that the United States not only spends more on health care than its major trading partners, but the private-sector share, at 7.7 percent of GDP, also is far larger than in other countries.
13 For a more complete discussion of the changing face of U.S. health care, see National Association of Manufactur-ers, “Health Care at the Crossroads: Manufacturers Agenda for Lower Costs and Higher Quality,” September 2002; for more information on the NAM health care agenda, see http://www.nam.org/healthplan and recommendations on page 23 of this report.
U.S. employee benefit costs are higherthan most of its major competitors.

14 The Manufacturing Institute
Health care spending has been rising rapidly in the United States and its major trading partners, as they all cope to varying degrees with the increasing health care requirements of an aging population and rising costs for new diagnostic technologies and treatments. As Table 8 shows, average annual growth in per capita health expenditures from 1989 to 1999 ranged between 3.8 percent and 8.5 percent, with the United States essentially in the middle of the pack. Total expenditures nevertheless remain significantly higher than in other countries. The decade-long increase in health care expen-ditures shown in Table 8 is unremarkable in an inter-national context. However, it is of critical importance to U.S. businesses, because they bear such a large part of the financing burden. Over 90 percent of Amer-icans under the age of 65 currently obtain their health insurance through their employer, a proportion that has remained fairly steady over the past 10 years. Ninety-seven percent of the members of the National Association of Manufacturers provide health care coverage for their employees.14 Furthermore, businesses typically pay 84 percent of single coverage policies and 73 percent of family coverage policies—percentages that actually have increased since 1993.15 In other countries where the public sector finances the majority of spending, the burden is shared more broadly across the economy, because governments often use general tax revenues to supplement payroll taxes. Thus, the cost increases outlined in Table 8 have hit U.S. manufacturers harder than their international counterparts. Of more concern is that overall cost increases have accelerated since 1999 and now exceed health sector inflation by a wide margin.16 As a result, data published by the U.S. Bureau of Labor Statistics show that costs to U.S. manufacturers for private employee health insurance premiums (not including Medicare payroll taxes) reached 8.0 percent of total compensation in 2003, up considerably from the 11-year low of 6.9 percent recorded in 1999. Private pensions.—In addition to health insur-ance, most U.S. manufacturers provide funding for private pension benefits on behalf of their employees. Sixty percent of employees in goods-producing indus- 14 Manufacturing Institute, “The Facts About Modern Manufacturing, 6th edition (Washington, DC: National Association of Manufacturers, 2003), p. 51. 15 Kaiser Family Foundation, 2002 Survey of Employer Health Benefits, September 2002. In a recent survey, the National Association of Manufacturers found that nearly one in four of its members paid 100 percent of premiums. 16 Ibid. The gap between growth in premiums and health inflation implies growing claims, which is likely due to the aging of the work force as well as increasing use of “defensive” diagnostic testing to reduce the risk of malpractice suits, among other factors.
tries are covered by a company-sponsored pension plan. The majority of these plans are defined contri-bution plans, meaning that companies and employees contribute funds during the employee’s career, and the employee gains access to the account funds. The only guaranteed benefit is the value of the account at the time of the employee’s retirement. Of concern to manufacturers is the future of “defined benefit” pension plans, which are prevalent in large companies in mature industries.17 Unlike defined contribution plans, they guarantee a specific benefit for retirees, the level of which is typically based on salary levels and years of service. In order to meet future obligations, companies with defined benefit pension plans must make sure that contribution rates and expected returns on contributions are sufficient to finance promised benefits. In recent years, the financial health of defined contribution plans has come under a two-pronged attack. First, the baby boom generation has begun retiring during a period of dramatic decline in manufacturing employment. As with Social Security, this changing balance between workers and retirees has put tremendous financial pressure on private pen-sion funds. Second, the sharp decline in stock market values has dramatically reduced the net present value of corporate pension funds. As a result, many that were healthy just a few years ago now appear severely underfunded. Due to technical regulations about how net present value is calculated with respect to pensions, many manufacturers face the prospect of infusing substantial amounts of cash to return their funds to actuarial balance.18 Doing so in the current economic circumstances would deal a double blow to U.S. manufacturing competitiveness. It would dras-tically reduce cash flow (which is already at historical lows), stifling new capital investment that is so critical to a sustained economic recovery. Also, it could add on the order of one to two percentage points to em-ployee benefits costs, further eroding the U.S. compe-titive posture relative to its major trading partners.
17 According to Wilshire Associates, about 320 companies in the Standard & Poor’s 500 index have defined benefit plans. 18 Current rules link measurement of defined benefit fund-ing levels to the 30-year Treasury bill, a debt instrument that no longer is issued. With interest rates at historical lows, this requirement has undermined the “official” health of many manufacturers’ pension plans, increasing calls for a more economically relevant discount rate.

Structural Costs Imposed on U.S. Manufacturers Harm Workers 15
Chart 7 Publicly and Privately Funded Health Care Expenditures in the
United States and Its Nine Largest Trading Partners, 2001
0
2
4
6
8
10
12
14
16
UnitedStates
Canada Mexico Japan China Germany UnitedKingdom
SouthKorea
Taiwan France
publicly-funded privately-funded
percent of GDP
Source: Organization for Economic Cooperation and Development and World Bank
Notes: Data for China reflects total health expenditure; no public-private disaggregation is available. Data for Taiwan date from 1996 and are taken from Eva Liu and Joseph Lee, “Health Care Expenditure and Financing in Taiwan,” Hong Kong Provisional Legislative Council Secretariat report, June 1998.
Table 8 Average Annual Growth in Per Capita Health Expenditures in the United
States and Its Nine Largest Trading Partners, 1989-1999
1989 level (U.S. dollars)
1999 level (U.S. dollars)
Average annual percentage change
United States 2,475 4,373 5.7% Canada 1,541 2,428 4.5% Mexico 2601 462 6.4% Japan 1,013 1,844 6.0% China N/A N/A N/A Germany 1,494 2,4512 5.5% United Kingdom 903 1,666 6.1% South Korea 316 739 8.5% Taiwan N/A N/A N/A France 1,517 2,226 3.8%
Source: Organization for Economic Cooperation and Development 1 1990. 2 1998.
16 The Manufacturing Institute
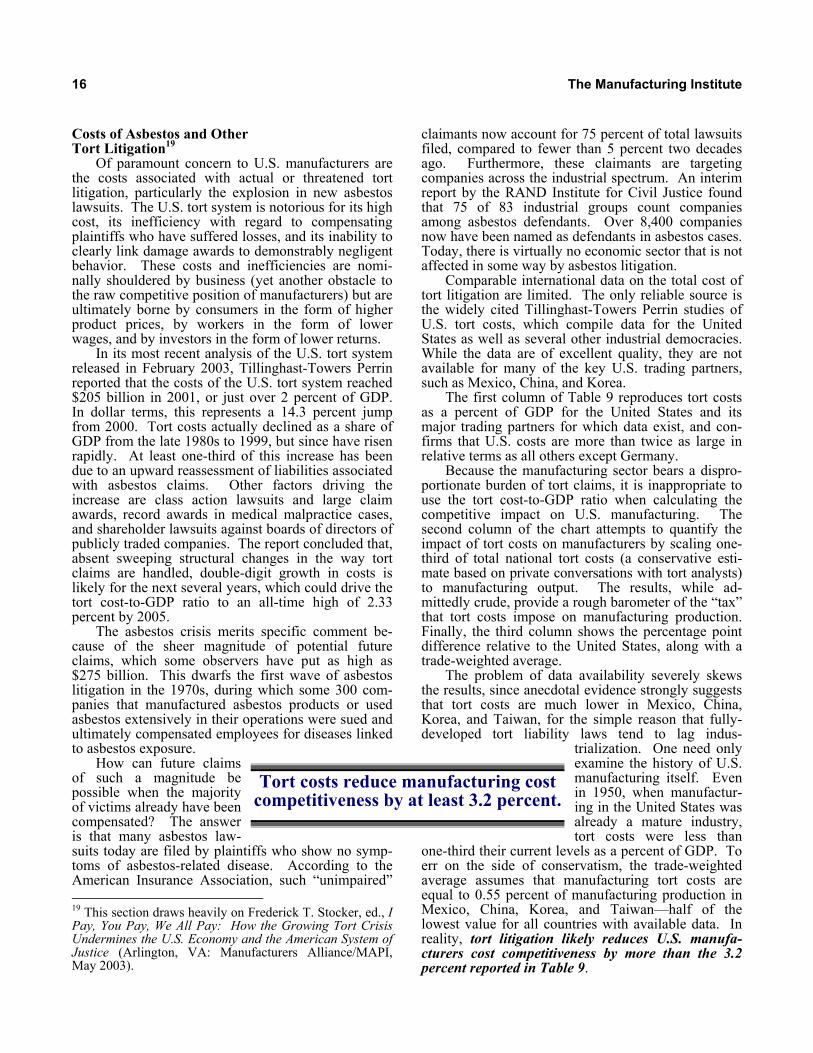
Costs of Asbestos and Other Tort Litigation19 Of paramount concern to U.S. manufacturers are the costs associated with actual or threatened tort litigation, particularly the explosion in new asbestos lawsuits. The U.S. tort system is notorious for its high cost, its inefficiency with regard to compensating plaintiffs who have suffered losses, and its inability to clearly link damage awards to demonstrably negligent behavior. These costs and inefficiencies are nomi-nally shouldered by business (yet another obstacle to the raw competitive position of manufacturers) but are ultimately borne by consumers in the form of higher product prices, by workers in the form of lower wages, and by investors in the form of lower returns. In its most recent analysis of the U.S. tort system released in February 2003, Tillinghast-Towers Perrin reported that the costs of the U.S. tort system reached $205 billion in 2001, or just over 2 percent of GDP. In dollar terms, this represents a 14.3 percent jump from 2000. Tort costs actually declined as a share of GDP from the late 1980s to 1999, but since have risen rapidly. At least one-third of this increase has been due to an upward reassessment of liabilities associated with asbestos claims. Other factors driving the increase are class action lawsuits and large claim awards, record awards in medical malpractice cases, and shareholder lawsuits against boards of directors of publicly traded companies. The report concluded that, absent sweeping structural changes in the way tort claims are handled, double-digit growth in costs is likely for the next several years, which could drive the tort cost-to-GDP ratio to an all-time high of 2.33 percent by 2005. The asbestos crisis merits specific comment be-cause of the sheer magnitude of potential future claims, which some observers have put as high as $275 billion. This dwarfs the first wave of asbestos litigation in the 1970s, during which some 300 com-panies that manufactured asbestos products or used asbestos extensively in their operations were sued and ultimately compensated employees for diseases linked to asbestos exposure. How can future claims of such a magnitude be possible when the majority of victims already have been compensated? The answer is that many asbestos law-suits today are filed by plaintiffs who show no symp-toms of asbestos-related disease. According to the American Insurance Association, such “unimpaired” 19 This section draws heavily on Frederick T. Stocker, ed., I Pay, You Pay, We All Pay: How the Growing Tort Crisis Undermines the U.S. Economy and the American System of Justice (Arlington, VA: Manufacturers Alliance/MAPI, May 2003).
claimants now account for 75 percent of total lawsuits filed, compared to fewer than 5 percent two decades ago. Furthermore, these claimants are targeting companies across the industrial spectrum. An interim report by the RAND Institute for Civil Justice found that 75 of 83 industrial groups count companies among asbestos defendants. Over 8,400 companies now have been named as defendants in asbestos cases. Today, there is virtually no economic sector that is not affected in some way by asbestos litigation. Comparable international data on the total cost of tort litigation are limited. The only reliable source is the widely cited Tillinghast-Towers Perrin studies of U.S. tort costs, which compile data for the United States as well as several other industrial democracies. While the data are of excellent quality, they are not available for many of the key U.S. trading partners, such as Mexico, China, and Korea. The first column of Table 9 reproduces tort costs as a percent of GDP for the United States and its major trading partners for which data exist, and con-firms that U.S. costs are more than twice as large in relative terms as all others except Germany. Because the manufacturing sector bears a dispro-portionate burden of tort claims, it is inappropriate to use the tort cost-to-GDP ratio when calculating the competitive impact on U.S. manufacturing. The second column of the chart attempts to quantify the impact of tort costs on manufacturers by scaling one-third of total national tort costs (a conservative esti-mate based on private conversations with tort analysts) to manufacturing output. The results, while ad-mittedly crude, provide a rough barometer of the “tax” that tort costs impose on manufacturing production. Finally, the third column shows the percentage point difference relative to the United States, along with a trade-weighted average. The problem of data availability severely skews the results, since anecdotal evidence strongly suggests that tort costs are much lower in Mexico, China, Korea, and Taiwan, for the simple reason that fully-developed tort liability laws tend to lag indus-
trialization. One need only examine the history of U.S. manufacturing itself. Even in 1950, when manufactur-ing in the United States was already a mature industry, tort costs were less than
one-third their current levels as a percent of GDP. To err on the side of conservatism, the trade-weighted average assumes that manufacturing tort costs are equal to 0.55 percent of manufacturing production in Mexico, China, Korea, and Taiwan—half of the lowest value for all countries with available data. In reality, tort litigation likely reduces U.S. manufa-cturers cost competitiveness by more than the 3.2 percent reported in Table 9.
Tort costs reduce manufacturing costcompetitiveness by at least 3.2 percent.

Structural Costs Imposed on U.S. Manufacturers Harm Workers 17
Table 9
Cost of Tort Litigation, United States and Its Nine Largest Trading Partners, 2000
Tort costs as
percent of GDP
Manufacturing tort costs as percent of
manufacturing output
Percentage point
difference from U.S. United States 2.0 4.5* — Canada 0.8 1.4* -3.1* Mexico N/A 0.6* -3.9* Japan 0.8 1.2* -3.3* China N/A 0.6* -3.9* Germany 1.3 3.8* -0.7* United Kingdom 0.6 1.1* -3.4* South Korea N/A 0.6* -3.9* Taiwan N/A 0.6* -3.9* France 0.8 3.2* -1.3* Trade-weighted average of above countries -3.2
Source: Tillinghast-Towers Perrin and author’s calculations * For countries lacking data (Mexico, China, South Korea, and Taiwan), this analysis conservatively assumes that their relative manufacturing tort costs are equal to half that of the United Kingdom, the lowest of all countries with available data.
Costs of Regulatory Compliance Compliance costs for regulations can be regarded as the “silent killer” of manufacturing competitive-ness. Often developed without an objective cost-benefit analysis, regulations have steadily increased in quantity and complexity, regardless of which political party controls the executive branch. Because of the sheer volume and breadth of regu-lations affecting manufacturers, it is virtually impos-sible to estimate total regulatory compliance costs for U.S. manufacturers. Nevertheless, by examining some of the most burdensome regulations, this analysis aims to sketch the outline of trends since 1990. A useful starting point is the annual report on the federal budget expenditures devoted to writing and enforcing regulations jointly published by the Mercatus Center at George Mason University and the Weidenbaum Center at Washington University.20 It presents historical data on regulatory agency budget outlays for a wide variety of social and economic regulations. Key results are shown in Table 10. Overall, total federal budget outlays for admin-istering and enforcing regulations nearly doubled from $13.7 billion to $26.9 billion from 1990 to 2003 (in 20 Susan Dudley and Melinda Warren, “Regulatory Spend-ing Soars: An Analysis of the U.S. Budget for Fiscal Years 2003 and 2004,” Mercatus Center and Wiedenbaum Center, July 2003, available at http://www.mercatus.org/pdf/mater-ials/359.pdf.
real terms). Some of the increase was caused by the creation of the Transportation Security Administration (TSA) subsequent to the September 11, 2001 terrorist attacks; absent the TSA, regulatory expenditures increased by still over 60 percent. Regulatory budget outlays are highest in the environmental, consumer safety, transportation, and general business (where the largest components are patent approval and corporate financial oversight) regulation sectors. Of course what matters more to manufacturers is their own compliance costs. The persistent upward trend in enforcement expenditures in Table 10 suggests that compliance costs also have risen. In terms of compliance, three areas of regulation are hit particularly hard: consumer safety, workplace safety, and environmental protection. The most complete analysis of the compliance costs of regulations presented in two studies for the U.S. Small Business Administration conducted by W. Mark Crain and Thomas Hopkins.21 These studies estimate total costs of complying with three classes of regulations—environmental (including air and water
21 Thomas D. Hopkins, “The Changing Burden of Regu-lation, Paperwork and Tax Compliance on Small Business: A Report to Congress,” Office of Advocacy, Small Business Administration, November 1995, and W. Mark Crain and Thomas D. Hopkins, “The Impact of Regulatory Costs on Small Firms,” Office of Advocacy, Small Business Administration, October 2001.

18 The Manufacturing Institute
Table 10 U.S. Federal Budget Outlays for Regulatory
Activities, 1990-2003
Millions of Dollars 1990 2003
Percent Change
Social regulation Consumer safety 2,205 4,324 96.1 Transportation 1,996 9,034 352.6 TSA 0 4,756 N/A Transportation excluding TSA 1,996 4,278 114.3 Workplace safety 1,158 1,471 27.0 Environment 4,812 6,493 34.9 Energy 560 677 20.9
Economic regulation Finance and banking 1,574 1,792 13.9 Industry-specific regulation 574 813 41.6 General business 859 2,260 163.1
TOTAL 13,739 26,864 95.5 TOTAL excluding TSA 13,739 22,108 60.9
Source: Mercatus Center and Weidenbaum Center pollution abatement and Superfund cleanup costs); economic (including, for specific industries, barriers to entry, price regulation, tariffs, and other trade bar-riers); and workplace (including safety and employ-ment regulations)—plus tax compliance. Table 11 summarizes the key results of and Crain and Hopkins’ 2001 study, showing the estimated cost of regulatory compliance among U.S. manufacturers. The largest costs are imposed by environmental regu-lations, which account for almost 50 percent of the costs reported in Table 11. The slightly different methodology of the 1995 Hopkins study precludes an accurate comparison of each component over time. Nevertheless, it is instructive to note that direct pollution abatement investments by manufacturers more than doubled from 1990 to reach $15 billion in 1998 (the latest year for which data are available). A second costly class of regulations relates to price supports, entry barriers, tariffs, and other rules affecting specific industries. The costs are twofold. First, economic regulations imply that production of certain goods will be reduced, and other goods may not be developed at all. Second, many of these regulations (particularly those that affect prices) have the effect of transferring income away from affected industries. For instance, restrictions on sugar imports raise the domestic price of sugar, thus transferring wealth away from those industries that use it as a raw material. Taken together, these effects cost U.S. manufacturers $48 billion annually.
Table 11 Manufacturing Compliance Costs Associated With U.S. Regulations
Compliance Activities, 1992 and 1997
(expressed in constant 2000 dollars)
Total cost, 1997
($billions) Per-employee
cost, 1997 Environmental 69 3,691 Economic 48 2,553 Workplace 16 838 Tax compliance 15 822 Total 147 7,904
Source: W. Mark Crain and Thomas D. Hopkins, “The Impact of Regulatory Costs on Small Firms,” Office of Advocacy, Small Business Administration, October 2001, Table 9A. Current workplace regulations are significantly higher than Table 11 indicates. A recent working paper by the Mercatus Center at George Mason University surveyed, with the support of the National Association of Manufacturers, 100 manufacturing companies and estimated that the total cost of com-plying with the 25 statutes and executive orders that encompass workplace regulation was about $32 billion in 2000, double the 1997 estimate by Mark Crain and Thomas Hopkins and equivalent to a 1.6
Structural Costs Imposed on U.S. Manufacturers Harm Workers 19
percent excise tax on manufactured products.22 This burden falls disproportionately on manufacturers employing fewer than 100 workers, which reported average compliance costs of $2,500 per employee, compared to less that $1,600 per employee in larger firms. The most onerous regulations relate to safety and employee benefits. A new concern the regulatory radar screen for U.S. companies is the sweeping changes in corporate financial reporting requirements in the wake of accounting irregularities at large corporations such as Enron and WorldCom. These requirements have been spelled out in the Sarbanes-Oxley Act, signed into law in July 2002.23 Because the law has been in force for only a short period, compliance costs are not yet known; but executives are worried. A July 2003 survey carried out for PriceWaterhouseCoopers showed that 44 percent of senior executives expressed at least some concern about Sarbanes-Oxley compli-ance costs. As was the case with workplace regu-lations, the proportion of small business executives concerned about compliance cost was much higher at 58 percent. Most compliance costs imposed by Sarbanes-Oxley are internal (in the form of additional labor and capital resources directed toward accounting proced-ures) and thus are “hidden” from view. The Johnson Group, a Chicago-based corporate accounting consul-tancy, suggests that a $3 billion public company will invest between $2.8 million and $8 million per year to comply.
Based on the foregoing discussion, a reasonable estimate of the total compliance burden of environ-mental, economic, workplace, and tax compliance on the economy is in the order of $850 billion—with $160 billion on manufacturers alone, equivalent to a 12 percent excise tax on manufacturing production. This reflects an increase of about 15 percent over the
22 W. Mark Crain and Joseph M. Johnson, “Compliance Costs of Federal Workplace Regulations: Survey Results for U.S. Manufacturers,” a Mercatus Working Paper, December 2001. 23 For a general summary of the provisions of the Sarbanes-Oxley Act, see Francis W. Holman, Jr., “House of Repre-sentatives Passes H.R. 3763, the Corporate Auditing Accountability, Responsibility, and Transparency Act,” Manufacturers Alliance/MAPI, E-179, April 30, 2002.
last five years. Easing this burden on manufacturers is imperative and also will reduce excessive regulatory costs on other sectors of the economy as well. Cross-country data on regulatory compliance costs are extremely rare. The only comparable international data of reasonable quality are produced by the Organization for Economic Cooperation and Development (OECD) and pertain only to pollution abatement expenditures. Pollution abatement comparisons severely under-state the threat of U.S. regulatory burdens on inter-national competitiveness. Nevertheless, Table 12 shows pollution abatement expenditures in the United States and its nine major trade competitors. Expressed as a percentage of GDP, the U.S. burden is higher than all countries except (surprisingly) South Korea. Canada, Mexico, and the United Kingdom enjoy a considerably lighter cost burden, and even the so-called “green” European economies spend a smaller share of GDP on pollution abatement.
As was the case with tort litigation, pollution abatement falls disproportionately on the shoulders of manufacturers. As a benchmark, U.S. manufacturers accounted for 83 percent of total pollution abatement expenditures in 1999. The second column of Table 12 estimates the burden of pollution abatement expen-ditures on manufacturers by scaling 83 percent of total expenditures to manufacturing output. Due to dif-ferences in the relative sizes of manufacturing sectors (as a percent of total GDP, the U.S. manufacturing sector is the smallest of the countries listed), the competitive advantage of other countries is even more pronounced. On a trade-weighted basis, the burden of pollution abatement expenditures alone reduces U.S. cost competitiveness by at least 3.5 percentage points. It bears repeating that pollution abatement is the only regulatory area where reliable comparative data exist; by excluding other costly areas of regu-lation, it substantially understates the total burden to U.S. manufacturers. A qualitative international survey of regulatory reform reveals that most of the United States major trading partners have embarked on aggressive reform efforts, concentrated in electricity, telecommunica-tions, and general regulatory streamlining. In the con-text of Table 11 above, these actions will act to alle-viate the “economic regulation” component in these countries. The OECD cites Canada, Japan, Korea,
The regulatory compliance burden on U.S. manufacturers is the equivalent of a 12 percent excise tax.
Pollution abatement alone reduces U.S. cost competitiveness by at least 3.5 percentage points.

20 The Manufacturing Institute
Table 12 Cost of Pollution Abatement, United States and Its
Nine Largest Trading Partners, Late 1990s
Pollution abatement costs as percent of
GDP
Manufacturing pollution abatement costs as percent of
manufacturing output
Percentage point difference from U.S.
United States 1.6 7.6* — Canada 1.1 4.8* -2.8* Mexico 0.8 3.1* -4.5* Japan 1.4 5.3* -2.3* China N/A 1.6*
6.1*
Germany 1.5 5.2* -2.4* United Kingdom 1.0 4.7* -3.0* South Korea 1.7 4.3* -3.3* Taiwan N/A 1.6*
6.1*
France 1.4 6.1* -1.5* Trade-weighted average of above countries -3.5*
Source: Organization for Economic Cooperation and Development Note: As in Table 9, the analysis conservatively assumes that countries with missing data (China and Taiwan) bear a pollution abatement burden equal to half the lowest value of other trading partners (in this case, Mexico).
Table 13 Natural Gas Prices in the United States and Its Nine
Largest Trading Partners, 1994–2001 (dollars per million British thermal units)
1994 2001 Percent change United States $2.87 $4.83 68.3 Canada 1.98 2.74 38.4 Mexico 2.01 4.12 105.0 Japan 11.75 10.24 -12.8 China N/A N/A N/A Germany 4.65 4.74 1.9 United Kingdom 3.57 3.37 -5.6 South Korea N/A N/A N/A Taiwan 7.11 7.27 2.3 France 3.57 4.71 31.9
Source: U.S. Energy Information Administration and the United Kingdom as specific countries of exten-sive activity. Importantly, the impetus for reform stems heavily from international competitiveness concerns. Energy Costs Given the U.S. position as a leading energy producer, it may seem surprising that energy costs are an obstacle to U.S. manufacturing competitiveness. It is even more puzzling that current energy headaches
are due primarily to surging prices for natural gas—a fossil fuel found in abundance in North America. The United States meets 85 percent of its consumption via domestic production and has virtually no dependence on Persian Gulf nations.24 24 The United States imports a negligible amount of liquefied natural gas from Qatar and the United Arab Emirates.

Structural Costs Imposed on U.S. Manufacturers Harm Workers 21
Due to the relatively low capital cost of installing new gas-fired electricity generation and the ease of environmental permissions, U.S. electric utilities and manufacturers have boosted investment in natural gas-based energy generation. Currently, natural gas accounts for 40 percent of U.S. industrial energy consumption, and natural gas use in electricity generation has increased 59 percent in the last 10 years. In this context, the sharp rise in natural gas prices has come as a rude awakening. From 1994 to 2001, prices rose by nearly 70 percent in the United States, as shown in Table 13. As a result, natural gas prices are now higher in the United States than in all its major competitors for which data are available, except Japan and Taiwan. The causes of high U.S. natural gas prices are purely political in nature. Current areas of exploration and drilling are just barely sufficient to meet current demand. The result is tight inventories that leave little room to maneuver in the case of unexpected spikes in demand brought about by cold winters and other unpredictable, yet foreseeable, factors. The American Gas Association notes that producers will be able to boost production from existing drilling areas, as they have in the past, for only perhaps 10 to 15 years.25 The Energy Information Administration projects that natural gas demand will increase by over 36 percent by 2020 despite higher gas prices, and existing North American sources may be insufficient for demand as early as 2010. Total reserves, on the other hand, are more than sufficient to provide cheap natural gas for at least the next generation. Proven North American reserves increased by 30 percent from 1980 to 2000 (1,708 trillion cubic feet to 2,208 trillion cubic feet). Unfortunately, they are located in regions that are currently off limit to development (or so heavily regulated that drilling is not cost-effective): the Atlantic, Pacific, and Gulf of Mexico coastal waters; the Rocky Mountain region; Alaska; and Canada. In the interest of energy independence, environmental protection, and the need to preserve our manufac-turing base, action should be taken to allow gas producers access to key deposits.26 The natural gas crisis has offset cost advantages that the United States enjoys for other industrial fossil fuels. Table 14 shows the burden of natural gas prices 25 “From the Ground Up: America’s Natural Gas Supply Challenge,” American Gas Association report, December 2002. 26 As the American Gas Association notes, new extraction technologies allow producers to tap reserves with less impact on the surrounding environment than in the past. However, implementation of these techniques requires long lead times, so policy changes must be made sooner rather than later.
on U.S. manufacturing competitiveness. While relatively low prices for refined petroleum and coal more than offset the natural gas burden, a more fundamental question is why the United States, as the holder of one of the world’s largest reserve of natural gas, cannot successfully exploit it to the competitive advantage of manufacturers. Total Effect of Five Cost Pressures Table 15 sums up the total cost squeeze by aggre-gating the trade-weighted burden of the five external cost drivers discussed in the preceding sections. Taken together, the aggregate advantage of our nine largest trading partners shaves an average of 18.3 percent from their unit labor costs relative to U.S. manufacturers. This implies that the actual hourly U.S. unit labor costs ($24.30 in 2002) would need to fall to $19.85 to offset this burden. Because $24.30 is 22.4 percent greater than $19.85, this is equivalent to stating that domestic cost pressures add 22.4 percent to U.S. unit labor costs in manufacturing relative to its major trading partners.
Table 14 Burden of High Fossil Fuel Prices on
U.S. Manufacturing’s Raw Cost Competitiveness Relative to
Its Nine Largest Trading Partners, 2003
(percent difference relative to U.S. manufacturers)
Natural gas All fossil fuelsCanada -2.0 -6.0 Mexico -0.7 -2.3 Japan 3.0 12.5 China -1.3 -2.3 Germany -0.1 0.6 United Kingdom -2.1 2.1 South Korea N/A 4.1 Taiwan 0.6 15.3 France 0.0 -4.2 Trade-weighted average of above countries -0.5 0.7 Source: U.S. Energy Information Administration and author’s calculations
The Talent Squeeze: Attracting Job Seekers to Manufacturing
As noted earlier in this report, U.S. manufacturers have done their part to remain competitive in international markets by keeping unit labor costs in check. They have been able to do so by improving productivity at rapid rates.

22 The Manufacturing Institute
A key ingredient to the resurgence of productivity growth has been the quality of the labor force. The cumulative education and work experience contained in the large baby boom generation (whose members began reaching senior management positions starting in the mid-1980s) have contributed incalculable bene-fits with regard to technology, improved management, and many other innovations; it is a truism to state that all innovations have their origins in human creativity.
Table 15
Total Burden of Cost Pressures on U.S. Manufacturing’s Raw Cost
Competitiveness (percent difference relative to U.S. manufacturers)
Cost pressure Foreign
AdvantageCorporate tax rates -5.6 Employee benefits -5.5 Litigation costs -3.2 Pollution abatement -3.5 Natural gas prices -0.5 Total cost advantage of 9 largest trading partners -18.3 U.S. net cost burden 22.4 Source: Author’s calculations based on data in previous tables. However, baby boomers are beginning to retire and will be almost entirely out of the labor force within 15 to 20 years. As a result, there is likely to be a need for 10 million additional skilled workers by 2020.27 Currently, the only net new source of skilled workers for manufacturers stems from immigration. This is an ominous trend, because manufacturers already are reporting difficulty in finding qualified job candidates. Even in the midst of the 2000-2001 recession, 80 percent of U.S. manufacturers reported moderate to serious shortages of qualified job candidates.28 The situation is not likely to improve as the recovery strengthens because: (a) many young people have a negative, outdated perception of manufacturing jobs; and (b) there is a misalignment of the education system with the skills needed for the 21st Century. If action is not taken to draw more potential
27 Anthony P. Carnevale and Richard A. Fry, “The Economic and Demographic Roots of Education and Train-ing,” report commissioned by the National Association of Manufacturers, November 2001. 28 National Association of Manufacturers and Deloitte and Touche, “Keeping America Competitive: How a Talent Shortage Threatens U.S. Manufacturing,” White Paper, 2003.
employees to manufacturing careers, the strong productivity growth of the past decade could be put at risk in the future. Some of the steps needed to address the skills shortage are: first, governors should connect workforce and economic development as a single stra-tegy; second, federal and local governments should provide adequate training funds to enhance technical skills of the current workforce, particularly for em-ployees at smaller companies; and third, the public workforce investment system should be incented to work more closely with the private sector.
Easing the Burden: Policy Measures To Reduce Manufacturing
“Overhead” Costs To prevent further deterioration of U.S. manufac-turing’s competitive position in the global economy, policymakers must take immediate and decisive action on a number of fronts to reduce the external overhead costs that have been imposed in the last decade: Tax Policy The current tax system is the single largest obstacle to increased economic growth. The long-term solution calls for a new tax system that is simpler and encourages—rather than penalizes—work, invest-ment, and entrepreneurial activity. In the short-term, tax law changes targeted to businesses will spur capital investment, reduce the tax burden faced by companies in a downturn, and make U.S. corporations more competitive in the global marketplace. These tax law changes include—
• Reduce statutory corporate tax rates, as most trading partners have done over the 1990s. The corporate tax burden shouldered by U.S. compa-nies makes it more difficult for them to compete in the global marketplace.
• Repeal the corporate alternative minimum tax, which hits particularly hard when manufacturing profitability is weak.
• Completely eliminate the taxation of after-tax profits distributed as dividends: a practice that nearly all other nations have allowed for years.
• Lower the cost of innovating and investing by making the R&D tax credit permanent and accel-erating capital depreciation schedules.
• In the interest of promoting U.S. global compe-titiveness, it is important for policymakers to simplify and reform the international tax code including changes that minimize the “double tax burden” on corporations by allowing companies to better utilize foreign tax credits and improve rules on taxing global earnings by allowing companies to defer U.S. tax on foreign income until it is paid to the U.S. parent.

Structural Costs Imposed on U.S. Manufacturers Harm Workers 23
Health Reform • As a general principle, provide a closer connec-
tion between level of service received and patient expenditure.
• Encourage greater individual responsibility for coverage costs and health status to reduce the incidence of expensive, but preventable, chronic health conditions such as hypertension, diabetes, and asthma.
• Improve affordability of health coverage for individuals and companies through individual tax credits, group purchasing, and tax-favored savings accounts for consumers.
• Reform medical liability laws to discourage “defensive” diagnostic testing and treatment and reduce costs shifting from medical litigation.
Pension Reform • Policymakers should work to shore up the current
private retirement system and ensure retirement security for America’s workers by supporting changes to current rules to make it easier for busi-nesses to provide pension benefits for employees and easier for employees to plan for their retire-ment. Specific changes that should be made include modifying funding requirements to reduce the volatility of cash calls on a business, increas-ing contribution limits and simplifying complex pension rules and requirements.
Legal Reform • Legislation to discourage and curtail frivolous
lawsuits which would include: (1) proportionate liability (eliminating joint and several liability); (2) a statute of repose beyond which the manufac-turer cannot be held responsible for product performance; (3) nationwide standards for award-ing punitive damages; and (4) limiting the amount of punitive damages.
• Federal class action legislation to place large, nationwide lawsuits in federal courts that would
curtail the current system that allows their filing in plaintiff-friendly venues.
• National asbestos litigation that would limit awards to nonsick claimants, assure that truly sick claimants are compensated, provide for future payments if an exposed individual becomes ill, and provide certainty to the defendant community.
Regulatory Reform • Establish a more objective cost-benefit review
process for all proposed regulations, updated on a periodic basis, which takes full account of adverse impact on business and jobs.
• Carry out third-party cost-benefit reviews for existing regulations pertaining to environmental and workplace safety regulation (the two that are most costly for U.S. manufacturers) and repeal those that are not justified on this basis.
• Express regulatory goals in terms of results rather than ways of achieving them, leaving flexibility for manufacturers to develop cost-effective solutions.
Energy Costs • Adopt changes in land-use regulations and permit-
ting procedures that allow access to the large undeveloped natural gas reserves in the Outer Continental Shelf and Rocky Mountain regions. Tapping only developed reserves is already straining to meet current demand and cannot meet expected growth.
• Remove obstacles to moving north-coast Alaska gas to market in the continental United States.
• Increase regulatory flexibility of tax policies to encourage more electricity generation from coal, nuclear, and renewable energy.
• Promote a variety of energy sources other than natural gas for electricity production and avoid policies that would cause generators to switch to natural gas as a fuel.

24 The Manufacturing Institute
APPENDIX
Derivation of Raw Manufacturing Cost Index for the United States and Its Nine Largest Trading Partners
Conceptually, the raw cost index for manufacturing is the ratio of wage compensation (which excludes benefit costs) to value-added in manufacturing. The basic approach is to estimate benchmark levels using data published by the Organization for Economic Cooperation and Development (OECD) for 1990, and project them to 2002 using a measure of hourly wage compensation growth corrected by increases in manufacturing productivity. These underlying data for the projections are published by the U.S. Bureau of Labor Statistics (BLS). A simpler way to do the projections would be to use BLS international data on unit labor cost growth in manufacturing, but these data include employee benefits and other nonwage compensation and hence do not strictly measure trends in wage compensation that are of relevance to the raw cost index. Thus, the raw cost index in 2002 can be expressed as the ratio of the 1990 benchmark for wage compensation to the 1990 benchmark for output, each grown by the respective increase in home-currency hourly wages and productivity from 1990 to 2002 (which removes the effect of currency fluctuations):
(Wage compensation90) x (home-currency hourly wage compensation growth90-02) ____________________________________________________________________________________________________
(Output90) x (output per hour growth90-02) Data for the above methodology are available for all countries in the report except Mexico, China, and Taiwan. For these three countries, an alternative methodology was used intended to approximate the technique described above. Taiwan For Taiwan, OECD and BLS data exist for the growth rates of wage compensation and output per hour growth, but not for the 1990 benchmark. However, the National Statistics of Taiwan publishes historical data on output, monthly earnings, and total employment in industry (which includes manufacturing, construction, and public utilities). From these data it is possible to calculate total earnings as a share of output in industry for 1990, which is the benchmark used in this report. Mexico For Mexico, BLS data on manufacturing productivity growth do not exist. However, the United Nations Industrial Development Organization publishes data on the share of wages in manufacturing value added, based on primary unpublished OECD data. China China poses the greatest difficulty, since OECD and BLS do not produce any data at all. In addition, the Chinese Statistical Bureau publishes virtually no information on manufacturing output, wages, and productivity. This paper takes a comparative approach, taking the ratio of manufacturing wages in China to those in the United States and correcting that ratio for differences in productivity levels. According to several sources, hourly wages for manufacturing workers in China’s industrial northeast are about 60 cents per hour, or 2.8 percent of U.S. levels. However, China’s productivity in key export industries is estimated to have been about 7 percent that of the United States in 1995 and has likely increased to 13 percent today. This implies that the raw cost index in China is just over 20 percent of the U.S. level.