How Strategic Shifts within the Pharmaceutical Sector · PDF fileHow Strategic Shifts within...
35
How Strategic Shifts within the Pharmaceutical Sector will Transform Supply Chain and Distribution Models LogiPharma Oct 23 rd , 2013 Eelco Dijkstra Senior Strategy Consultant +31 6 246 61 688 [email protected] Singapore
Transcript of How Strategic Shifts within the Pharmaceutical Sector · PDF fileHow Strategic Shifts within...

How Strategic Shifts within thePharmaceutical Sector will TransformSupply Chain and Distribution Models
LogiPharma Oct 23rd, 2013
Eelco DijkstraSenior Strategy Consultant
+31 6 246 61 [email protected]
Singapore

1
BCI IntroductionBoutique consulting and implementation firm with areas of activity for:
Corporate clients
Supply chain strategy development Supply chain network optimization/modeling Inventory analysis and optimization Transport & carrier optimization Logistic outsourcing Location and Site selection Real estate investment strategies
Profile
Headquartered in the Netherlands Founded in 1985 Employs 70 full-time professionals Global network partnership with St.Onge (US based)
and OLE (China based) Partnership with 175 professionals Global presence based upon local know how and
expertise Focus industries: Pharma, Medtech, FMCG, Industrial,
Lifestyle/Fashion, FoodUnderstanding…
ChangePeopleNetworkPartnersStrategy Organization
Aligning supplychain strategywith businessobjectives &goals
Aligning supplychain strategywith tradingpartnerstrategies
Translatingsupply chainstrategy inoptimizednetworks
Designorganizationand processeslinked with thestrategy
Using the humanintellect todetail the futurestate and act asagents forchange
Impactassessment anddeveloping thetransitioningstrategy
Managing thetransition andsustaining thesuccess
Implementation
Buck Consultants International

Linking strategy to execution
ConsultingStrategy, Network
Inventory Optimization& TransportationS&OP planning
EngineeringHigh Performance
Manufacturing,Packaging, Distribution
FacilitiesOperations
Planning,Management
& Training
Supply Chain Information Systems
Project Management
Implementation Planning Execution Change mngt
2 Buck Consultants International

A unique base of experience of healthcarelogistics projects around the globe
3
EMEA North-America
Latin-America China/Asia-Pacific
Buck Consultants International

Agenda
1. Changing Operating Landscape2. Results APAC Survey3. Distribution Optimisation – Business Case4. Step changes ahead
Buck Consultants International, 2013 4

Business StrategyThe commercial model is changing and willcontinue to change, having an impact onthe supply chain set-up of the future
Source: arvato services, adjusted by BCI
Wholesaler
Pharmacy,Hospital,Care Institution
Patient
PhysicianDirect to ...
Direct to patient
Sales Management
e-fulfilment
Order-to-cash
Phar
mac
eutic
al co
mpa
ny
Direct to
Patient
Changing business elements within the current businessmodel of Pharmaceutical companies.
Buck Consultants International, 2013 5

A. Changing Landscape
Buck Consultants International, 2013 6
Trends in the healthcare market and impact on supplychainsMarket/businessenvironment
Business strategy Supply chain
• Ending patents
• Generic entries
• Cost-cutting in healthcaresystems
• QA / RA (e.g. new GDP)
• More direct sales
• eCommerce?
• Mergers/acquisitions
• New product launches
• Customer segmentation
• Centralization management
• Emerging markets
• Overall focus on costreduction
• Central management
• Consolidated distribution
• Supply chain integration &differentiation
• Visibility
• Collaboration
• Direct models

Main Pharma SC Trends and DevelopmentsThe Brand Owner’s Perspective
Buck Consultants International, 2013 7
Centralization ofSupply Chain Control
Network Redesign
Outsourcing & PartnerPortfolio Reduction
Strengthening of Corporate SC Organizations Investments in SC Talent Corporate SC taking ownership of the downstream
supply chain
Consolidation of Distribution Networks Mix of full centralization, regionalization and hub-
spoke models Scope: downstream, still lack of full chain scope
3PL landscape in pharma has improved highly Towards LLP/4PL models Strong reduction of number of partners used Towards harmonized (global) contracts
Visibility Control Tower / Transport Management concepts Linking inbound, intercompany and secondary
distribution Information is Key

Main Pharma SC Trends and DevelopmentsThe Brand Owner’s Perspective
Buck Consultants International, 2013 8
Customer Service /Order to Cashprocessharmonization
Supply ChainDifferentiation
Supply ChainCollaboration
CS and O2C activities closely linked to physicalsupply chains
Harmonization & centralization of CS and O2Corganizations
From one size fits all to differentiated supply chainsper product/market combination
SC becoming a stronger counterpart for thecommercial team, challenging service requirements
Logistics not a key differentiator, therefore theindustry is recognizing the opportunities ofcollaboration
How to break through from pilots to full realization?

B. Results APAC Survey
Buck Consultants International, 2013 9
We asked Pharma Executives how they view their keychallenges in APAC

Company Characteristics
Buck Consultants International, 2013 10
64%
20%
16%
Corporation Type
Pharmaceutical/bio-pharma company
Medical Devicecompany
Other
24%
7%
7%62%
0%
Sales Model Type
Distributor model percountry all channels
Distributor model percountry, hospitals direct
Direct sales all channels
Hybrid, mix of all beforementioned models
Other

Key Business Challenges in APAC
Buck Consultants International, 2013 11
1
1
2
2
6
10
18
18
21
24
40
SEA as a set of markets
Japan as a market
Bribery and corruption
Patent expiries
India as a market
Integration as result of a company Merger/acquisition
China as a market
Maintaining current levels of sales
Regulatory, Import licenses, customs
Increasing Operating Costs and reduced margins
Revenue growth across the region
Types of Business ChallengesType of Challenges weighted by importance

Key Supply Chain Challenges in APAC
Buck Consultants International, 2013 12
5
6
6
10
10
12
15
15
16
21
22
No APAC Supply chain strategy in place
Complexity in # languages, # regulations and # packaging
Not scalable for future growth
Integrating supply chain's due to merger/acquisition
Managing LSP contracts and performancer metrics across region
Fragmented local for local country set up in place
Increasing warehousing and transportation costs
Regulatory environment (import licences and duties)
Shift from distributor to go direct business model in certaingeographies
Supporting sales growth new markets
Mitigating supply chain risks across region
Supply Chain ChallengesTypes of Challenges weighted by importance

Supply Chain Configuration
Buck Consultants International, 2013 13
52%
12%
15%
9%
9%
3%
Supply Chain Network Design
Country for Countrydistribution centresreplenished from globalplants
Regional distributioncentre - combined withdirect distribution to APACcustomers
Regional distributioncentre - replenishingcountry distributioncentres
Global distribution centre
Central distribution withpostponement / re-labelling capabilities
Other
1 2 to 5 5- to 10 >10# of DC's 0 4 3 16
02468
1012141618
Number of Finished Goods DCs operatingacross APAC
Outsourcing Mixed Model Own AccountDistribution Type 13 11 0
0
2
4
6
8
10
12
14
Distribution Network Approach

Supply Chain Configuration (2)
Buck Consultants International, 2013 14
1 2 to 5 5 to 10 >10# Logistics Providers 0 8 8 16
02468
1012141618
# Logistics Providers
13%
17%
70%
Approach towards order to cash
Outsourcing
Own Account
Mixed Model

Regionalization (1)
Buck Consultants International, 2013 15
32%
17%
51%
# of companies having explored theoption to regionalize their distribution
network in APAC
Yes
No
N/A 20%
23%
9%
19%
27%
2%
Benefits of regionalization
Reduced time to market
Increased availability ofmaterials
Lower corporate tax rate
Reduced supply chaincosts
Scalable platform forgrowth
Other

Network (Re)Design
Buck Consultants International, 2013 16
80%
15%
5%
Last review of SC network configuration
Currently being reviewed
approx 1 year ago
more than 2 years ago
80%of pharma companies are currently reviewing their supply chain in the APAC region

Supply ChainStrategy is more thanmeets the eye
It’s about securing optimalvalue from your supplychain network and from yourservice providers
… at lowest possible totalcost
Transport and Warehouse costs
Network optimisationInventory managementIT & TechnologiesVisibility and Control TowersCollaborationRelationship ManagementEnd-to-end lead time optimisationCost to Serve diversification

C. Network Redesign
Buck Consultants International, 2013 18
The majority of a supply chain’slifecycle costs are locked-in at thestart Manufacturing/supplier network Distribution network Inventory Locations Inventory Levels Service policies
Also the supply chain putsboundaries on/createsopportunities for flexibility anddifferentiation in terms of servicelevels, speed to market, etc.Decisions Solutions Value
APS
ERP / MRP
Execution
Strategic andTactical
Supply ChainOptimization
80%
20%Ope
ratio
nal
Tac
tical
S
trate
gic
Why (re)design your network?
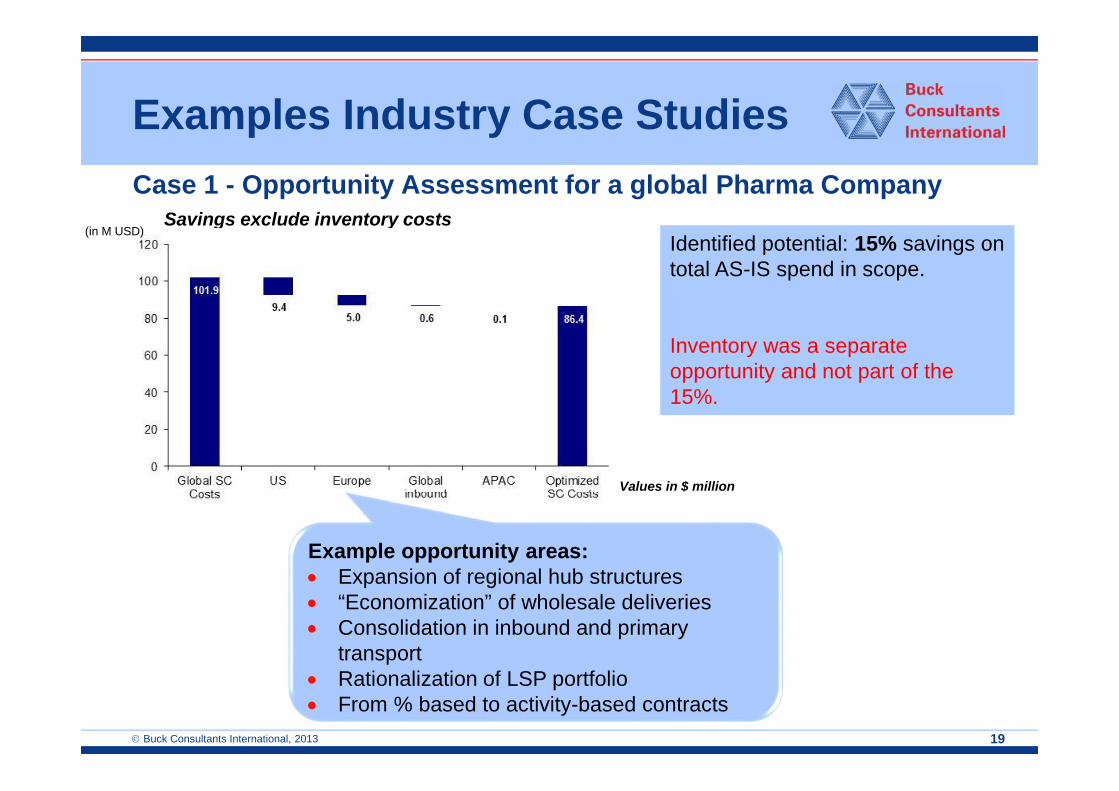
Case 1 - Opportunity Assessment for a global Pharma Company
19
Savings exclude inventory costsIdentified potential: 15% savings ontotal AS-IS spend in scope.
Inventory was a separateopportunity and not part of the15%.
Values in $ million
(in M USD)
Example opportunity areas: Expansion of regional hub structures “Economization” of wholesale deliveries Consolidation in inbound and primary
transport Rationalization of LSP portfolio From % based to activity-based contracts
Examples Industry Case Studies
Buck Consultants International, 2013

Case 2 – Cost To Serve Analyses GlobalPharma Company
Company profile Global Pharma company Top management driving towards step-
changes BCI challenged to go beyond the basic
network optimization
Solutions identified and proposed to management
“economic wholesale model” changing order behavior of wholesalersthroughout Europe, moving to a general policy of: max 1 order/delivery frequency perweek, shipped with a lead-time of 48-72 hours savings: 25+%
“Differentiated supply chain” creating basically three supply chains,managed centrally: Centralized: high value bio products Regionalized: 6 hubs throughout Europe shipping to wholesalers and
hospitals/pharmacies Localized: narcotics products and products that are time critical
savings: ~12.5%20 Buck Consultants International, 2013

Case 3 – Network Optimization ofDiversified Pharma Company
Company profile Global Pharma company Need to rationalize the supply chain from a cost, compliance and “fit for future”
perspective
2012-2015 2015-2018
To 1, 2, 3 RDCs?From Local for Local network To regional DC networks
No harmonization Relatively high costs Limited visibility Compliance?
Harmonization / Differentiation Lower costs 15% Improved visibility Compliance!
Harmonization! Lower costs! 25+% Full Visibility! Compliance!
21 Buck Consultants International, 2013

Case Study APACNetwork Optimization Study

(1) Country Level Distribution Networkreplenished from global production sources.
(2) RDC in APAC in combination with directship program to country level market channels.
(3) RDC in APAC with Country Level Satellitesfor Distribution.
Buck Consultants International, 2013 23
Supply Chain Configurations -Scenarios

(4) Combination of scenarios 2 and 3. Scenario 3 replenishment is applied to NEA, Scenario 2 direct ship from RDC is applied to
SEA.
(5) Combination of scenarios 1 and 2. Scenario 1 country for country distribution is
applied to NEA, Scenario 2 direct ship from RDC is applied to
SEA
Buck Consultants International, 2013 24
Supply Chain Configurations -Scenarios (cont.)
NEA
SEA
SEA
NEA

1. Country level 2. RDC 3. RDC withsatellites
4. Combi of 2(SEA) and 3 (NEA)
5. Combi of 1(NEA) and 2 (SEA)
total costs 39,7 43,1 47,5 46,4 41,2cost index incl inventory 100 109 120 117 104inventory 20,0 20,0 20,0 20,0 20,0outbound transportation 6,0 9,9 6,0 7,2 7,2replenishment 6,3 4,4labour 1,4 1,2 1,7 1,5 1,7space 6,0 6,5 8,1 7,8 6,3inbound transportation 6,3 5,6 5,6 5,6 6,1
-
10,0
20,0
30,0
40,0
50,0
Buck Consultants International, 2013 25
Results with InventoryScenarios (in Million USD)

Introducing the Postponement Concept
By applying postponement, the moment of product labelling can be delayed,which effectively enables companies to reduce their inventory levels, due to theadvantages of inventory pooling.
Buck Consultants International, 2013 26
Postponement Centre

Applying the Postponement Strategy
Let’s apply the postponement strategy to scenarios 2,3 and 4 which have a RDC to enablepostponement.
Buck Consultants International, 2013 27
RegionalPostponement
Centre SIN
AFTER
ID
TH
MY
BEFORE
Instead of shipping products directly to consumer markets, one can delay the labelling phase untilproducts reach the postponement centre. By doing so, one can benefit from inventory pooling.
In the example above, we have assumed that the inventory costs for the NEA markets were diminishedby 40%. However, we have also experienced higher possible inventory savings. Therefore, in the
“before” scenario 15 products we needed, whereas in the “after” scenario 9 products were required tofulfil consumer markets in NEA.

Buck Consultants International, 2013 28
Results with Inventory and withPostponement (in Million USD)
1. Country level (nopostponement) 2. RDC + postponement 3. RDC with satellites +
postponement4. Combi of 2 (SEA) and3 (NEA) + postponement
total costs 39,7 35,1 39,6 38,4cost index incl inventory 113 100 113 109inventory index 100 60 60 60inventory 20,0 12,0 12,0 12,0outbound transportation 6,0 9,9 6,0 7,2replenishment 6,3 4,4labour 1,4 1,2 1,7 1,5space 6,0 6,5 8,1 7,8inbound transportation 6,3 5,6 5,6 5,6
-
10,0
20,0
30,0
40,0
50,0

Buck Consultants International, 2013 29
Total costIncl. inventory
Cost with inventorywith postponement
Inventory Index
Lead Times
1. Country Level
$ 39.7M
$ 39.7M
100
1-2 Days
2. RDC
$ 43.1M
$ 35.1M
60
2-4 Days
3. RDC & Satellites
$ 47.5M
$ 39.6M
60
1-2 Days
4. Combi of scenario’s2 (SEA) and 3 (NEA)
$ 46.4M
$ 38.4M
60
1-4 Days
Overview Customer Flows & SummaryScenarios: Costs (in millions)
5. Combi of scenario’s 1(NEA) and 2 (SEA)
$ 41.2M
-
-
1-4 Days

More Responsive Supply Chain Model
One size for sure doesn’tfit all!
Many variables: Marketvolumes, product value,product sources,regulatory environment
Cost to serve modelprovides ability todifferentiate per product,market and customer type
Supplychain
complexity
Productsand
services
Processesand
systems
Configurationand
structure
Buck Consultants International, 2013 30

Buck Consultants International, 2013 31
Opportunity Potential Depends Heavily onSupply Chain Scope Under Review
Widening the scope of a supply chain review increases the number ofalternative solutions and therefore the potential savings. But there is more.Complexity and risks are factors that increase as well when wideningthe scope
• # Alternativesolutions
• Complexity
• Risks
• Savingspotential
Project scopeLimited scope Broader scope
No structuralchange =>
2-3% savings
Structural change=> 10-20% savings
+Repositioning thevalue proposition

Value focus
Strategic
Cost focus
Tactical
Analytics andReporting
Carrier and partnerselection
Rate discussions
Supply chainCosts
On timeperformancePlanning
Business model
Delivery and Networkmodel
Customerexperience
Transactionalrelationships
Transport costs
Value addedLogistics services
Inventory Management
Concluding:The Industry is going through a Period of Change… AnExcellent Opportunity for Supply Chain to Move up theValue Chain
Buck Consultants International, 2013 32

How Does this Translate to you?
Drive real change within your company Take the current momentum to position supply chain as a
strategic asset towards Executive Management Everything starts with data & information
Although cost is not always the driver: on average ourclients saved 10 – 18% through “basic” network re-design projects
Clear upside potential when broadening the scope toinventory management and business model changessupported by supply chain
Buck Consultants International, 2013 33