How small modelling errors may lead to big errors in … · s was measured at shopping mall, NHL...
26
How small modelling errors may lead to big errors in heat maps Vladan Jevremovic, PhD, Research Director WLPC Conference, Lisbon, October 2017 @v_jevremovic
Transcript of How small modelling errors may lead to big errors in … · s was measured at shopping mall, NHL...

How small modelling errors may lead to big errors in heat mapsVladan Jevremovic, PhD, Research Director WLPC Conference, Lisbon, October 2017
@v_jevremovic

Agenda
2 /
Modeling Floor scalingMissing Wall / Improper wall material Inclined surfacesAntenna patterns: interpolated vs. measuredFading margin
RF survey Choice of survey routes
How small modelling errors may lead to big errors in heat maps

MODELING
3

Floor scaling
When scaling a floorplan, do NOT use doors to scale:In this example (hotel) 10% error in door width causes 23% error in the whole area (1,283 vs. 1,580 sq. meters)
How small modelling errors may lead to big errors in heat maps4 /

Floor scaling
This translates to 6% coverage drop:Signal at -70 dBm went from ~ 76% to 70%In a hotel, this drop in coverage is on every floor
How small modelling errors may lead to big errors in heat maps5 /

Floor scaling
Solution?Laser distance measure Measuring wheel GPS reader
How small modelling errors may lead to big errors in heat maps6 /

Missing wall
Always check blueprints for missing walls before the surveyAfterwards, examine the survey data for large, unexpected signal drops
How small modelling errors may lead to big errors in heat maps7 /
Missing wall
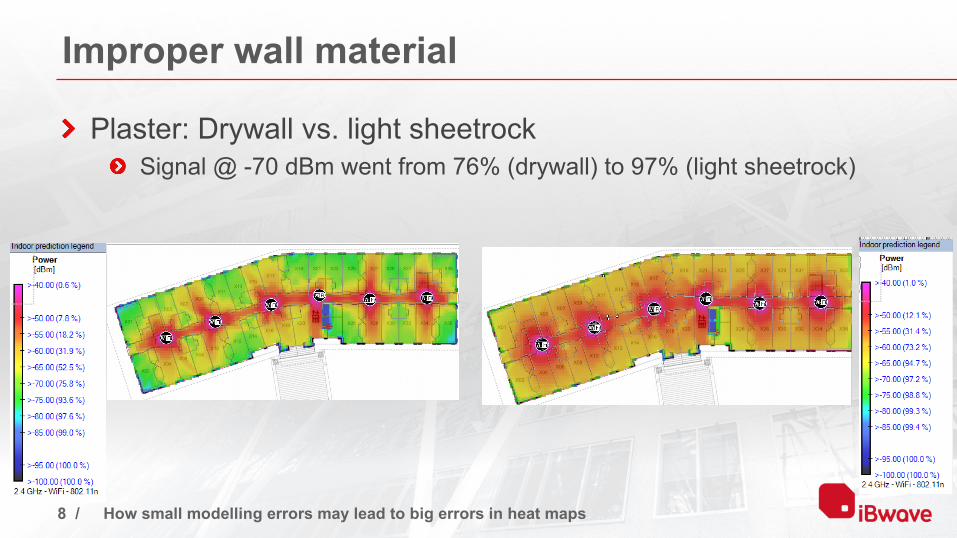
Improper wall material
Plaster: Drywall vs. light sheetrockSignal @ -70 dBm went from 76% (drywall) to 97% (light sheetrock)
How small modelling errors may lead to big errors in heat maps8 /
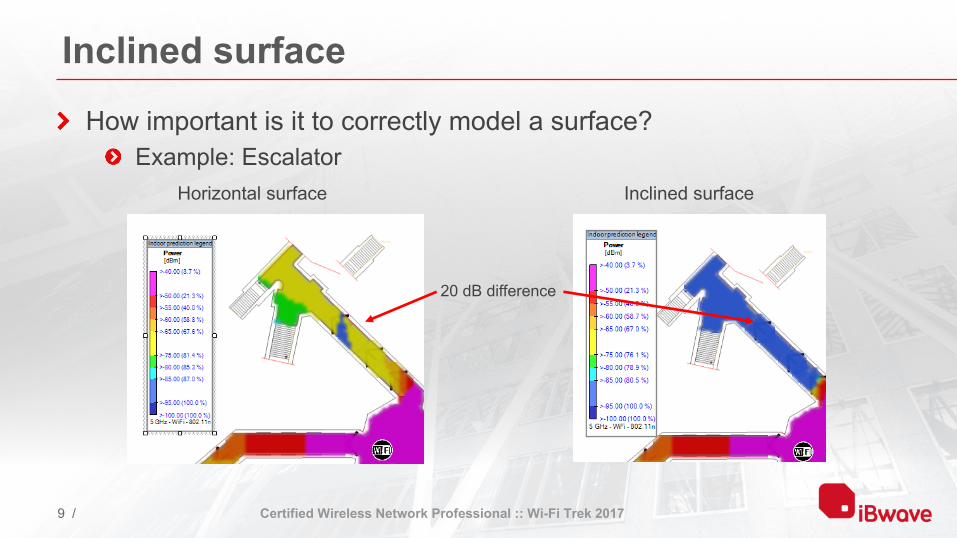
Inclined surface
How important is it to correctly model a surface?Example: Escalator
Horizontal surface Inclined surface
20 dB difference
Certified Wireless Network Professional :: Wi-Fi Trek 20179 /

Antenna pattern: interpolated vs. measured
Interpolated (from 2D cuts) vs. measured 3D pattern10º downtilt over horizontal surface
Interpolated from 2D cuts Measured 3D
How small modelling errors may lead to big errors in heat maps10 /
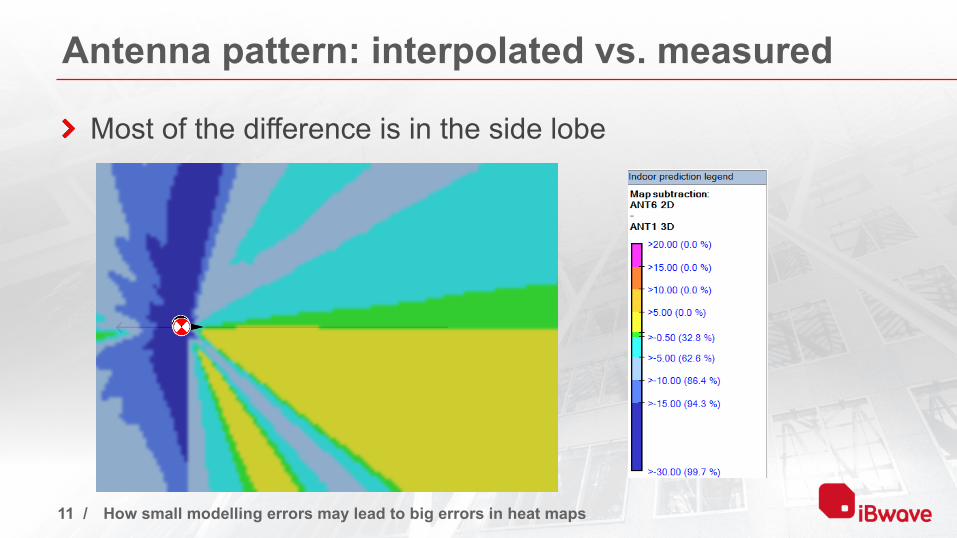
Antenna pattern: interpolated vs. measured
Most of the difference is in the side lobe
How small modelling errors may lead to big errors in heat maps11 /
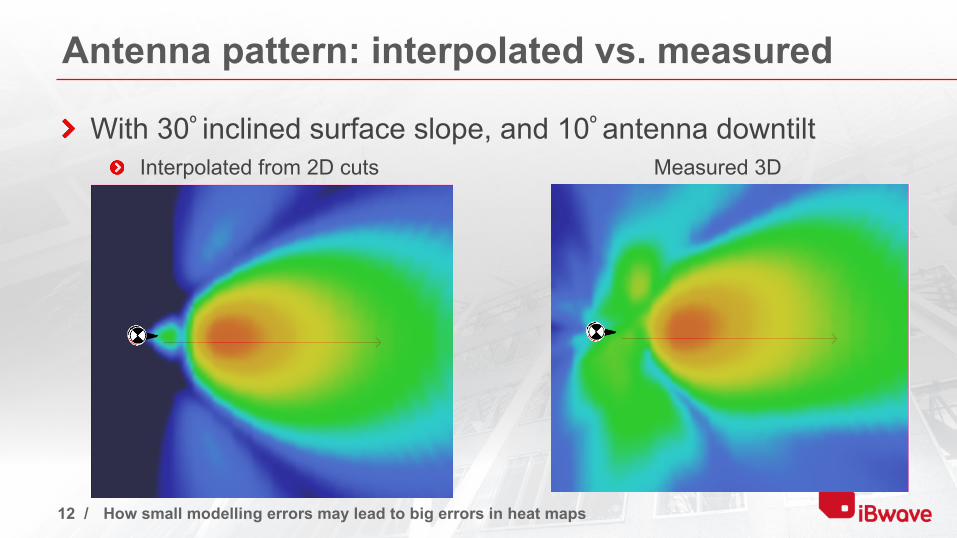
Antenna pattern: interpolated vs. measured
With 30º inclined surface slope, and 10º antenna downtiltInterpolated from 2D cuts Measured 3D
How small modelling errors may lead to big errors in heat maps12 /

Antenna pattern: interpolated vs. measured
Signal delta is much greater with the inclined surface:
How small modelling errors may lead to big errors in heat maps13 /
Fading margin
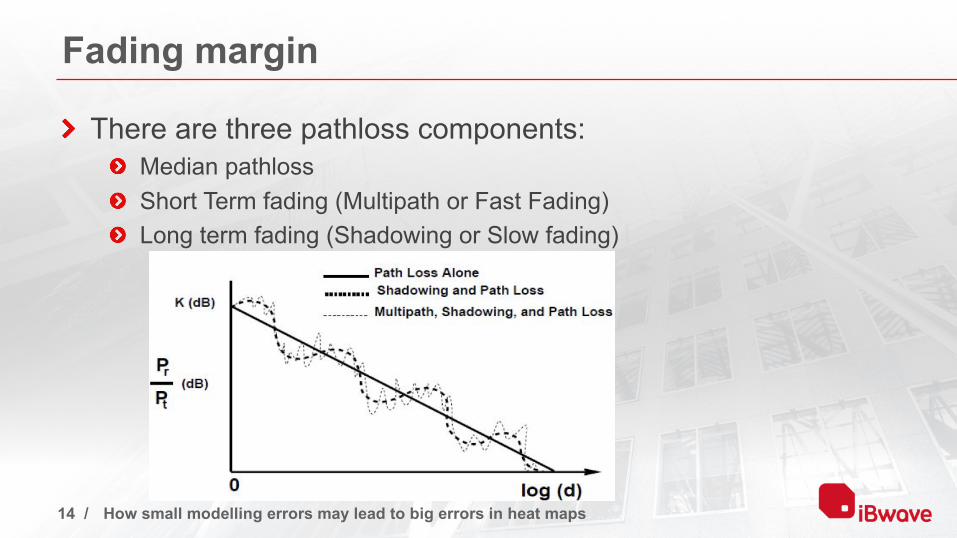
There are three pathloss components:Median pathlossShort Term fading (Multipath or Fast Fading)Long term fading (Shadowing or Slow fading)
How small modelling errors may lead to big errors in heat maps14 /

Fading margin
Short Term (Fast Fading) This fading is caused by RF signal reflection from nearby objects
Only reflected path signals contribute Also known as multipath fading
Small client movement can cause rapid signal amplitude change
How small modelling errors may lead to big errors in heat maps15 /
Fading margin
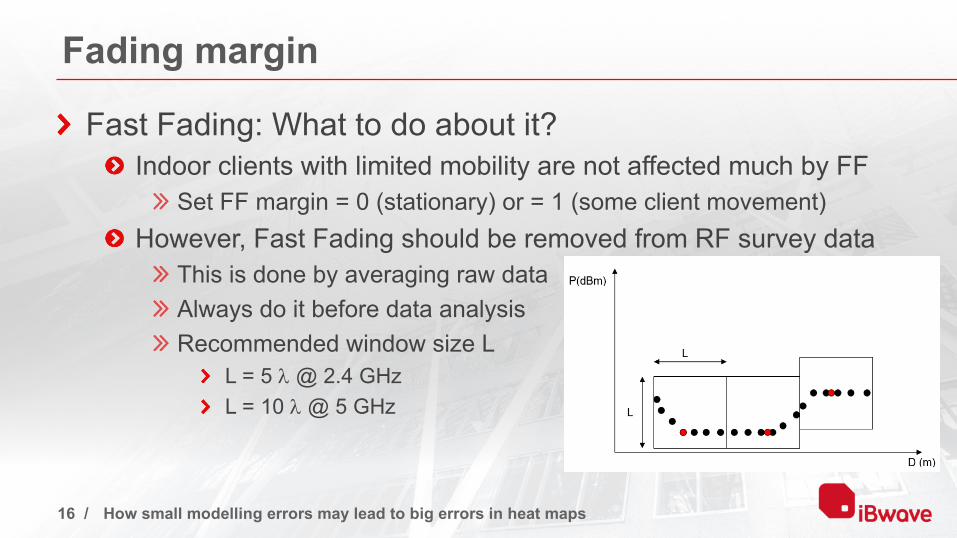
Fast Fading: What to do about it? Indoor clients with limited mobility are not affected much by FF
Set FF margin = 0 (stationary) or = 1 (some client movement)However, Fast Fading should be removed from RF survey data
This is done by averaging raw data Always do it before data analysisRecommended window size L
L = 5 l @ 2.4 GHzL = 10 l @ 5 GHz
How small modelling errors may lead to big errors in heat maps16 /

Fading margin
Long Term (Slow Fading) This is variation of the signal against the median pathloss
This fading is due to obstacles between AP and the client (“shadowing”)
How small modelling errors may lead to big errors in heat maps17 /
Fading margin
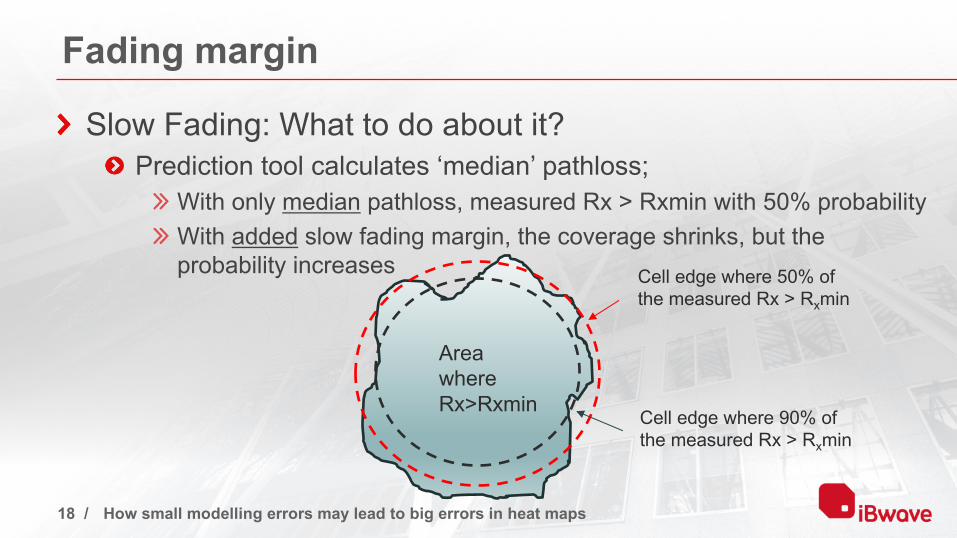
Slow Fading: What to do about it? Prediction tool calculates ‘median’ pathloss;
With only median pathloss, measured Rx > Rxmin with 50% probability With added slow fading margin, the coverage shrinks, but the probability increases
How small modelling errors may lead to big errors in heat maps18 /
Area where Rx>Rxmin
Cell edge where 50% of the measured Rx > Rxmin
Cell edge where 90% of the measured Rx > Rxmin
Fading margin
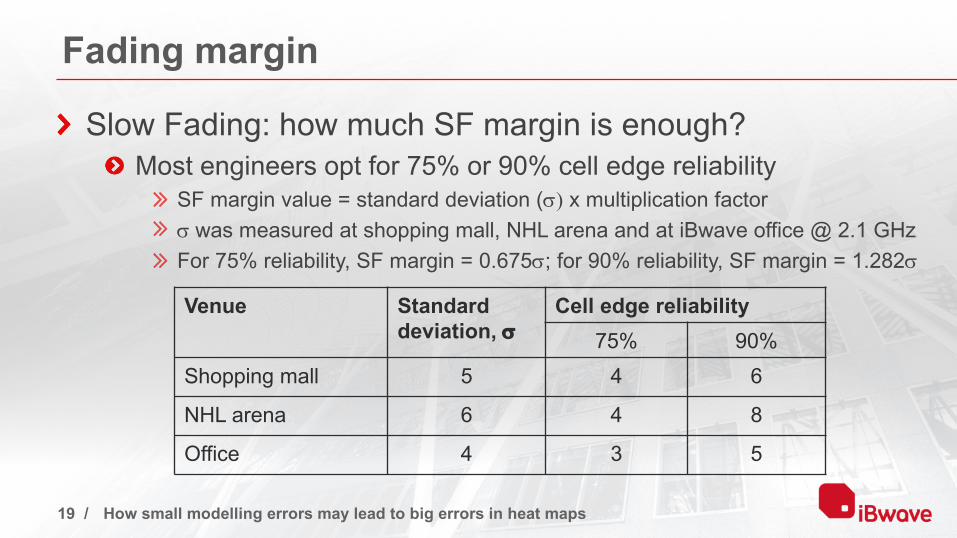
Slow Fading: how much SF margin is enough? Most engineers opt for 75% or 90% cell edge reliability
SF margin value = standard deviation (s) x multiplication factor s was measured at shopping mall, NHL arena and at iBwave office @ 2.1 GHzFor 75% reliability, SF margin = 0.675s; for 90% reliability, SF margin = 1.282s
How small modelling errors may lead to big errors in heat maps19 /
Venue Standard deviation, s
Cell edge reliability75% 90%
Shopping mall 5 4 6
NHL arena 6 4 8
Office 4 3 5
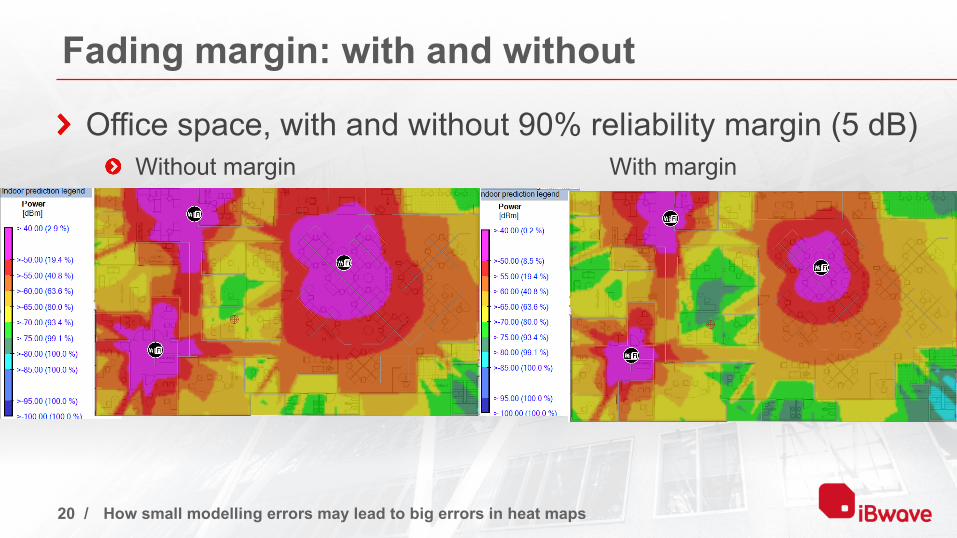
Fading margin: with and without
Office space, with and without 90% reliability margin (5 dB)Without margin With margin
How small modelling errors may lead to big errors in heat maps20 /

RF SURVEY
21
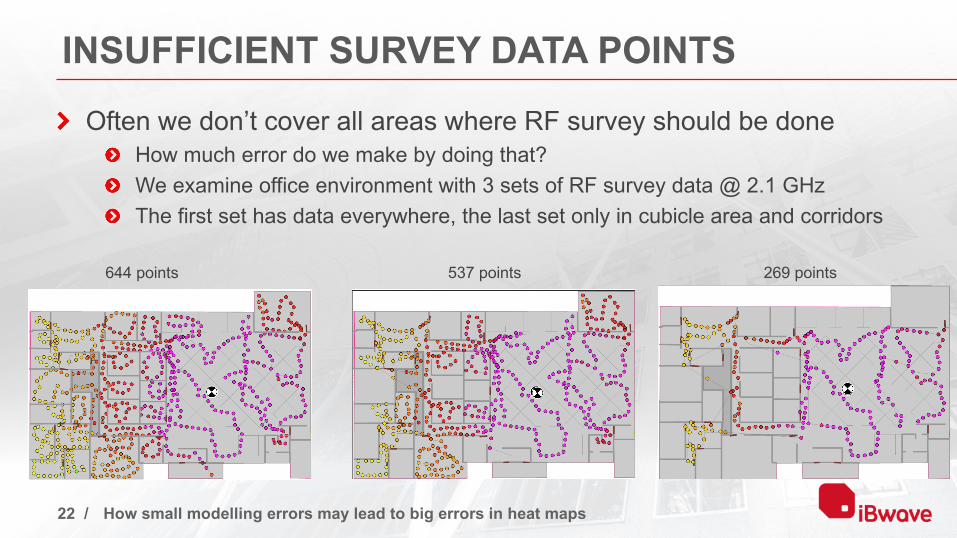
INSUFFICIENT SURVEY DATA POINTS
Often we don’t cover all areas where RF survey should be doneHow much error do we make by doing that?We examine office environment with 3 sets of RF survey data @ 2.1 GHzThe first set has data everywhere, the last set only in cubicle area and corridors
644 points 537 points 269 points
How small modelling errors may lead to big errors in heat maps22 /
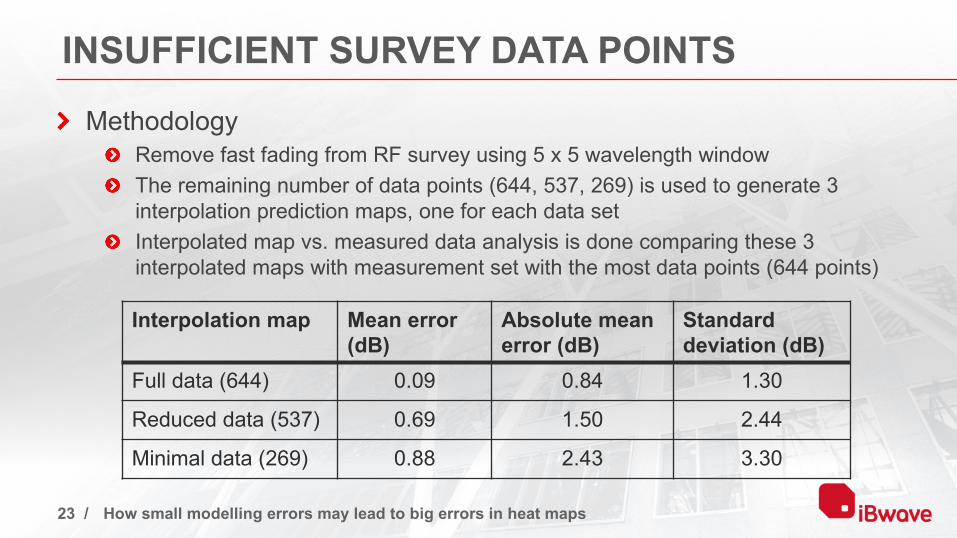
INSUFFICIENT SURVEY DATA POINTS
MethodologyRemove fast fading from RF survey using 5 x 5 wavelength windowThe remaining number of data points (644, 537, 269) is used to generate 3 interpolation prediction maps, one for each data setInterpolated map vs. measured data analysis is done comparing these 3 interpolated maps with measurement set with the most data points (644 points)
How small modelling errors may lead to big errors in heat maps23 /
Interpolation map Mean error (dB)
Absolute mean error (dB)
Standard deviation (dB)
Full data (644) 0.09 0.84 1.30
Reduced data (537) 0.69 1.50 2.44
Minimal data (269) 0.88 2.43 3.30

INSUFFICIENT SURVEY DATA POINTS
ConclusionTaking data only in general access area (cubicles and corridors) and ignoring individual offices and meeting rooms set us back by 1.6 and 2 dBs for absolute mean error and standard deviation, respectively Taking data in every other individual office and conference room is beneficial –the error was about half of the above (0.66 and 1.14 dB)
How small modelling errors may lead to big errors in heat maps24 /
Interpolation map Mean error D (dB)
Absolute mean error D (dB)
Standard deviation D (dB)
Full data (644) - - -
Reduced data (537) 0.60 0.66 1.14
Minimal data (269) 0.79 1.59 2.00

DEMO
25

@IBWAVEWWW.IBWAVE.COM