How Segregated is Toronto? · in the Toronto CMA are increasingly not living side-by-side within...
79
How Segregated is Toronto? Inequality, Polarization, and Segregation Trends and Processes David Hulchanski Neighbourhood Change Research Network, Factor-Inwentash Faculty of Social Work University of Toronto Ryerson University, Centre for Immigration and Settlement 14 February 2019 Neighbourhood Change Research Partnership www.NeighbourhoodChange.ca J David Hulchanski, University of Toronto Page 1 of 79 Ryerson University, February 2019
Transcript of How Segregated is Toronto? · in the Toronto CMA are increasingly not living side-by-side within...
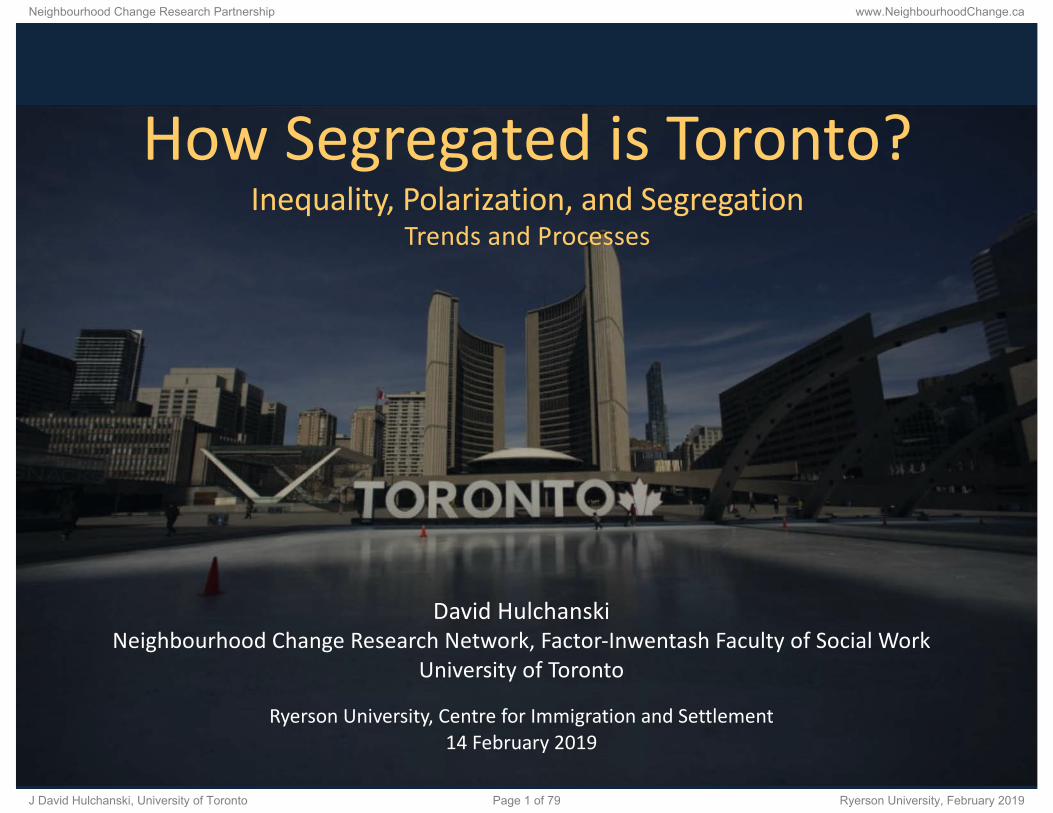
How Segregated is Toronto?Inequality, Polarization, and Segregation
Trends and Processes
David HulchanskiNeighbourhood Change Research Network, Factor-Inwentash Faculty of Social Work
University of Toronto
Ryerson University, Centre for Immigration and Settlement 14 February 2019
Neighbourhood Change Research Partnership www.NeighbourhoodChange.ca
J David Hulchanski, University of Toronto Page 1 of 79 Ryerson University, February 2019

Neighbourhood Change Research Partnership www.NeighbourhoodChange.ca
J David Hulchanski, University of Toronto Page 2 of 79 Ryerson University, February 2019

Inequality, Polarization, PovertyThey are not the same: Definitions
A primer on definition and measurement
http://neighbourhoodchange.ca/documents/2015/12/inequality-polarization-poverty-definitions.pdf
Neighbourhood Change Research Partnership www.NeighbourhoodChange.ca
J David Hulchanski, University of Toronto Page 3 of 79 Ryerson University, February 2019

INCOME INEQUALITY + 56%
INCOME POLARIZATION + 47%
SEGREGATION + 14% VISIBLE MINORITY
+ 21% BLACK
Socio-Spatial Trends, 1991 – 2016
TorontoCensus Metropolitan Area
Summary of 25 year
neighbourbood change
trends
Neighbourhood Change Research Partnership www.NeighbourhoodChange.ca
J David Hulchanski, University of Toronto Page 4 of 79 Ryerson University, February 2019

Spatial Polarization and Segregation
Peter Marcuse & Ronald van Kempen, 2000
1990’s ‘Divided Cities’ literature
A new socio-spatial order with stronger (more rigid)
divisions, and
greater inequality
Neighbourhood Change Research Partnership www.NeighbourhoodChange.ca
J David Hulchanski, University of Toronto Page 5 of 79 Ryerson University, February 2019

INCOME INEQUALITY & INCOME POLARIZATION
Canadian Socio-spatial Trends, 1970-2015
Neighbourhood Change Research Partnership www.NeighbourhoodChange.ca
J David Hulchanski, University of Toronto Page 6 of 79 Ryerson University, February 2019

More spatial InequalityThe gap between high and low income neigh-bourhoods is growing
Inequality
Neighbourhood Change Research Partnership www.NeighbourhoodChange.ca
J David Hulchanski, University of Toronto Page 7 of 79 Ryerson University, February 2019

More spatial PolarizationFewer middle income
neighbourhoods
Polarization
Neighbourhood Change Research Partnership www.NeighbourhoodChange.ca
J David Hulchanski, University of Toronto Page 8 of 79 Ryerson University, February 2019

Increasing Income inequalityresults in increased spatial polarization of the population
Neighbourhood Change Research Partnership www.NeighbourhoodChange.ca
J David Hulchanski, University of Toronto Page 9 of 79 Ryerson University, February 2019

Cause: Specific ProcessesGovernment / Governance
Activities / Outcomes in4 Key Policy
Areas
Income Support
(Tax, Transfers)Discrimination
Housing Market
Labour Market
10
Neighbourhood Change Research Partnership www.NeighbourhoodChange.ca
J David Hulchanski, University of Toronto Page 10 of 79 Ryerson University, February 2019

LABOUR MARKET DISCRIMINATION
Two Examples: Working Poor & Unemployment Rate
Neighbourhood Change Research Partnership www.NeighbourhoodChange.ca
J David Hulchanski, University of Toronto Page 11 of 79 Ryerson University, February 2019

https://metcalffoundation.com/stories/publications/the-working-poor-in-the-toronto-region-mapping-working-poverty-in-canadas-richest-city/
Who are the “working Poor”?With the assistance of Statistics Canada and other researchers the Metcalf Foundation developed a definition of the working poor as someone who:• has an after-tax income below
the Low-income measure (LIM),• has earnings of at least $3,000 a
year,• is between the ages of 18 and 64,• is not a student, and• lives independently.
With data from the 2016 Census, the Toronto region analysis is currently being updated by John Stapleton with the assistance of the Metcalf Foundation and the Neighbourhood Change Research Partnership.
12
Neighbourhood Change Research Partnership www.NeighbourhoodChange.ca
J David Hulchanski, University of Toronto Page 12 of 79 Ryerson University, February 2019

Source: Statistics Canada, Census Custom Tabulation 2006 and 2016
Neighbourhood Change Research Partnership www.NeighbourhoodChange.ca
J David Hulchanski, University of Toronto Page 13 of 79 Ryerson University, February 2019

Non-Immigrant(Canadian born) Working Poor
ImmigrantWorking Poor
Source: Statistics Canada, Census Custom Tabulation 2006 and 2016
Neighbourhood Change Research Partnership www.NeighbourhoodChange.ca
J David Hulchanski, University of Toronto Page 14 of 79 Ryerson University, February 2019

Neighbourhood Change Research Partnership www.NeighbourhoodChange.ca
J David Hulchanski, University of Toronto Page 15 of 79 Ryerson University, February 2019

Black Unemployment Rate, 12.2%Non-racialized Canadians, 7.3%
7.3% unemployment rate non-racialized Canadians
http://behindthenumbers.ca/2017/11/29/racialized-canadians-barriers-to-work/
Neighbourhood Change Research Partnership www.NeighbourhoodChange.ca
J David Hulchanski, University of Toronto Page 16 of 79 Ryerson University, February 2019

Black, Visible Minority, Recent Immigrants, and White Education Level, Toronto CMA, 2016
Education level achieved: Black, visible minority, recent immigrants (2006-2016), and White population, age 15 and over, Toronto Census Metropolitan Area, 2016 Census
University degree CMA = 33%
18% Black; 35% VisMin; 43% R-Immg; 32% White
College/technical CMA = 25%
35% Black; 22% VisMin; 19% R-Immg; 27% White
High School CMA = 26%
30% Black; 26% VisMin; 22% R-Immg; 26% White
No High School CMA = 16%
18% Black; 17% VisMin; 16% R-Immg; 16% White
Neighbourhood Change Research Partnership www.NeighbourhoodChange.ca
J David Hulchanski, University of Toronto Page 17 of 79 Ryerson University, February 2019

SEGREGATIONDefinition
Neighbourhood Change Research Partnership www.NeighbourhoodChange.ca
J David Hulchanski, University of Toronto Page 18 of 79 Ryerson University, February 2019

Segregation1. to differentiate, distinguish, or isolate
2. the spatial separation of specific social groups from the wider population within urban space
“a social group is considered ‘segregated’ if the spatial distribution of its members …
differs significantly from that of the larger population; the greater the difference in
spatial distributions the higher the degree or level of segregation.”
Bourne & Walks 2011:534.
Neighbourhood Change Research Partnership www.NeighbourhoodChange.ca
J David Hulchanski, University of Toronto Page 19 of 79 Ryerson University, February 2019
Voluntary Segregation?Talk about segregation often implies motivation, the intent by some, a dominant societal group, to isolate and control an “other” within society.
Many quickly raise the retort that we mainly have “voluntary” ethnic enclaves and “ethnoburbs.”
Yes, we do have ethnic enclaves.But, we also have involuntary segregation.
20
Neighbourhood Change Research Partnership www.NeighbourhoodChange.ca
J David Hulchanski, University of Toronto Page 20 of 79 Ryerson University, February 2019

Ethnic Enclaves: ‘Voluntary’ Concentration
“immigrant enclaves, in which newcomers to cities use local neighborhood
community resources as stepping stones toward assimilation and potentially
geographic dispersal.”
(e.g., ethnic communities, ethnoburbs) Bourne & Walks 2011:535.
21
Neighbourhood Change Research Partnership www.NeighbourhoodChange.ca
J David Hulchanski, University of Toronto Page 21 of 79 Ryerson University, February 2019

SEGREGATIONToronto City & Metropolitan Area (CMA)
Neighbourhood Change Research Partnership www.NeighbourhoodChange.ca
J David Hulchanski, University of Toronto Page 22 of 79 Ryerson University, February 2019
Neighbourhood Change Research Partnership www.NeighbourhoodChange.ca
J David Hulchanski, University of Toronto Page 23 of 79 Ryerson University, February 2019

Neighbourhood Change Research Partnership www.NeighbourhoodChange.ca
J David Hulchanski, University of Toronto Page 24 of 79 Ryerson University, February 2019

Neighbourhood Change Research Partnership www.NeighbourhoodChange.ca
J David Hulchanski, University of Toronto Page 25 of 79 Ryerson University, February 2019

Neighbourhood Change Research Partnership www.NeighbourhoodChange.ca
J David Hulchanski, University of Toronto Page 26 of 79 Ryerson University, February 2019

Future Cities Canada Conference Toronto
7 November 2018
Desmond Cole, Keynote
Neighbourhood Change Research Partnership www.NeighbourhoodChange.ca
J David Hulchanski, University of Toronto Page 27 of 79 Ryerson University, February 2019

Neighbourhood Change Research Partnership www.NeighbourhoodChange.ca
J David Hulchanski, University of Toronto Page 28 of 79 Ryerson University, February 2019

City of Toronto
• Ethnic, racial, immigrant population characteristics in three groups based on income, 2015
• Low, middle, and high income neighbourhoods (census tracts)
Neighbourhood Change Research Partnership www.NeighbourhoodChange.ca
J David Hulchanski, University of Toronto Page 29 of 79 Ryerson University, February 2019

Population1981 2,137,0002001 2,482,0002016 2,732,000
Middle IncomeCensus Tracts
1980 60%1990 50%2000 32%2015 29%
Neighbourhood Change Research Partnership www.NeighbourhoodChange.ca
J David Hulchanski, University of Toronto Page 30 of 79 Ryerson University, February 2019

The changing distribution of Toronto’s population by income over 45 years = social and spatial polarization (more high and low income people and census tracts).
Neighbourhood Change Research Partnership www.NeighbourhoodChange.ca
J David Hulchanski, University of Toronto Page 31 of 79 Ryerson University, February 2019

A city that was 85% White in the early 1980’s is now one-half White. In 2016: high-income neighbourhoods are 73% White; low-income neighbourhoods (50% of the city) are 31% White.
Neighbourhood Change Research Partnership www.NeighbourhoodChange.ca
J David Hulchanski, University of Toronto Page 32 of 79 Ryerson University, February 2019

Neighbourhood Change Research Partnership www.NeighbourhoodChange.ca
J David Hulchanski, University of Toronto Page 33 of 79 Ryerson University, February 2019

Neighbourhood Change Research Partnership www.NeighbourhoodChange.ca
J David Hulchanski, University of Toronto Page 34 of 79 Ryerson University, February 2019

Neighbourhood Change Research Partnership www.NeighbourhoodChange.ca
J David Hulchanski, University of Toronto Page 35 of 79 Ryerson University, February 2019

Neighbourhood Change Research Partnership www.NeighbourhoodChange.ca
J David Hulchanski, University of Toronto Page 36 of 79 Ryerson University, February 2019

Neighbourhood Change Research Partnership www.NeighbourhoodChange.ca
J David Hulchanski, University of Toronto Page 37 of 79 Ryerson University, February 2019

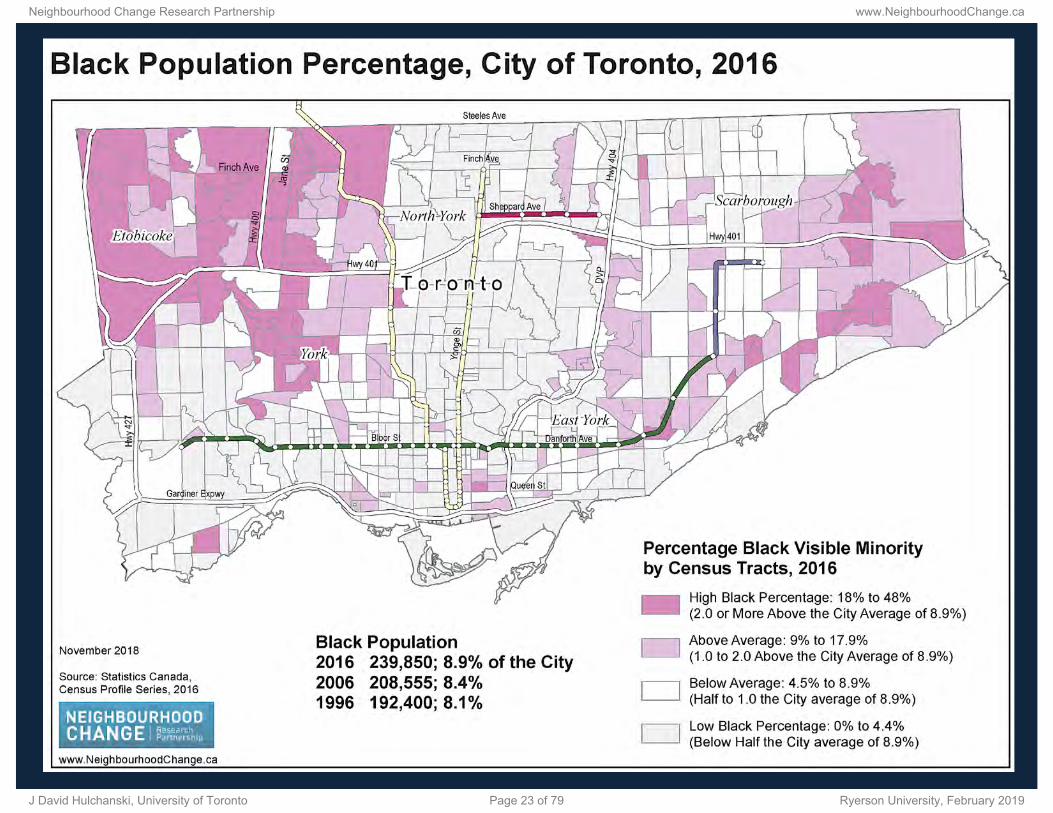
Toronto CMA’s Black population: 440,000 (7.5%)
48% Canadian born; 13% recent Immigrants (2006-2016)
38
Neighbourhood Change Research Partnership www.NeighbourhoodChange.ca
J David Hulchanski, University of Toronto Page 38 of 79 Ryerson University, February 2019

39
Neighbourhood Change Research Partnership www.NeighbourhoodChange.ca
J David Hulchanski, University of Toronto Page 39 of 79 Ryerson University, February 2019

40
Neighbourhood Change Research Partnership www.NeighbourhoodChange.ca
J David Hulchanski, University of Toronto Page 40 of 79 Ryerson University, February 2019

‘Racial’ (skin colour) Segregation Toronto CMA 1991 to 2016
‘Racial’ segregation(non-Whites / Whites, index of dissimilarity)
+14% (from 39.5 in 1991 to 45.2 in 2016)
The visible minority and White populations
in the Toronto CMA are increasingly not
living side-by-side within and between census tracts.
Note: The Index of Dissimilarity considers number of visible minority vs White people within and between census tracts in relation to the distribution for the whole CMA. The Gini and COP only considers incomes between CTs (but not within CTs), comparing CT averages against each
other in the CMA as a whole. 41
Neighbourhood Change Research Partnership www.NeighbourhoodChange.ca
J David Hulchanski, University of Toronto Page 41 of 79 Ryerson University, February 2019

Black Segregation: Toronto / Chicago
Index of dissimilarity
• 51.2 Toronto CMA in 2016, 42.3 in 1991
• 75.9 Chicago Metro in 2010, 84.6 in 1990
Walks, R.A., & Bourne, L.S. (2006). Ghettos in Canada's cities? Racial segregation, ethnic enclaves and poverty concentration in Canadian urban areas. The Canadian Geographer/Le Géographe canadien, 50(3), 273-297. For USA see: https://s4.ad.brown.edu/Projects/Diversity/Data/Report/report2.pdf 42
Neighbourhood Change Research Partnership www.NeighbourhoodChange.ca
J David Hulchanski, University of Toronto Page 42 of 79 Ryerson University, February 2019

Logan, J. R., & Stults, B. (2011). The persistence of segregation in the metropolis: New findings from the 2010 census. Census brief prepared for Project US2010, 24. https://s4.ad.brown.edu/Projects/Diversity/Data/Report/report2.pdf
Neighbourhood Change Research Partnership www.NeighbourhoodChange.ca
J David Hulchanski, University of Toronto Page 43 of 79 Ryerson University, February 2019

Logan, J. R., & Stults, B. (2011). The persistence of segregation in the metropolis: New findings from the 2010 census. Census brief prepared for Project US2010, 24. https://s4.ad.brown.edu/Projects/Diversity/Data/Report/report2.pdf
Neighbourhood Change Research Partnership www.NeighbourhoodChange.ca
J David Hulchanski, University of Toronto Page 44 of 79 Ryerson University, February 2019

Greater Toronto Region:Socially Unequal and Segregated
• “On several metrics, including those related to income, greater Toronto is among Canada’s richest, but also most socially unequal and segregated, metropolitan areas.
• “The region has grown more unequal over the last 45 years.
• “Trends toward socio-spatial concentration and polarization are worrisome, with an increasing overlap between processes of racialization, wage and occupational polarization, and neighbourhood-based income segregation.”
~ Alan Walks, “Inequality and Neighbourhood Change in the Greater Toronto Region,” forthcoming, UBC Press.
45
Neighbourhood Change Research Partnership www.NeighbourhoodChange.ca
J David Hulchanski, University of Toronto Page 45 of 79 Ryerson University, February 2019

Neighbourhood Income Change Trajectories: Class, Race, Immigration Status
• “…trajectories of neighbourhood income change depend more on the class, race, and immigration status of inhabitants.
• “Residents of neighbourhoods gaining ground are more likely to have a university degree, be employed in managerial or administrative jobs, and less likely to be foreign-born or a visible minority.
• “Neighbourhoods marked by long-term income decline, meanwhile, are significantly more likely to house visible minorities, particularly South Asians and African-Canadians, and more than twice the proportion of immigrants as neighbourhoods that are gaining ground.” ~ Alan Walks, “Inequality and Neighbourhood Change in the Greater Toronto Region,” forthcoming, UBC Press. 46
Neighbourhood Change Research Partnership www.NeighbourhoodChange.ca
J David Hulchanski, University of Toronto Page 46 of 79 Ryerson University, February 2019

PROCESSES & THE FUTURE
Explaining the Trends; Policy Options
Neighbourhood Change Research Partnership www.NeighbourhoodChange.ca
J David Hulchanski, University of Toronto Page 47 of 79 Ryerson University, February 2019
Toronto: Summary1. Income inequality, income polarization, and
SES/ethno-cultural/racial segregation are increasing
2. Increased dramatically since the late-1980s, especially during the 1990s, at a slower pace since
3. There is no sign of a reversal
4. We have the strongest possible evidence; evidence that is being ignored by governments
5. We know the cause: public policy; labour market and housing market dynamics; discrimination
48
Neighbourhood Change Research Partnership www.NeighbourhoodChange.ca
J David Hulchanski, University of Toronto Page 48 of 79 Ryerson University, February 2019

Macro Level Processes
Global / National Forces§Globalization§Neoliberalism§ Financialization§ Economic Inequality & Polarization
What about specific regional and local processes / forces / factors?
49
Neighbourhood Change Research Partnership www.NeighbourhoodChange.ca
J David Hulchanski, University of Toronto Page 49 of 79 Ryerson University, February 2019

Solution? Year-by-yearreverse the negative trends
LABOUR MARKET: Wages, Regulations
HOUSING SYSTEM: Cost of Housing
TAXES & TRANSFERS: Fair Distribution
DISCRIMINATION: Effective Protections
GOVERNMENT: Fair, inclusive policies
Neighbourhood Change Research Partnership www.NeighbourhoodChange.ca
J David Hulchanski, University of Toronto Page 50 of 79 Ryerson University, February 2019

51
Neighbourhood Change Research Partnership www.NeighbourhoodChange.ca
J David Hulchanski, University of Toronto Page 51 of 79 Ryerson University, February 2019

1. policymakers can invest in efforts to enforce existing anti-discrimination laws to root out the discrimination that persists in the housing market.
2. Inclusionary zoning policies and incentives to encourage density around transit hubs can be effective tools.
3. localities might prioritize creating and preserving affordable housing in gentrifying areas.
https://www.livingcities.org/blog/1279-4-ways-to-tackle-segregated-cities-and-why-it-matters
Neighbourhood Change Research Partnership www.NeighbourhoodChange.ca
J David Hulchanski, University of Toronto Page 52 of 79 Ryerson University, February 2019
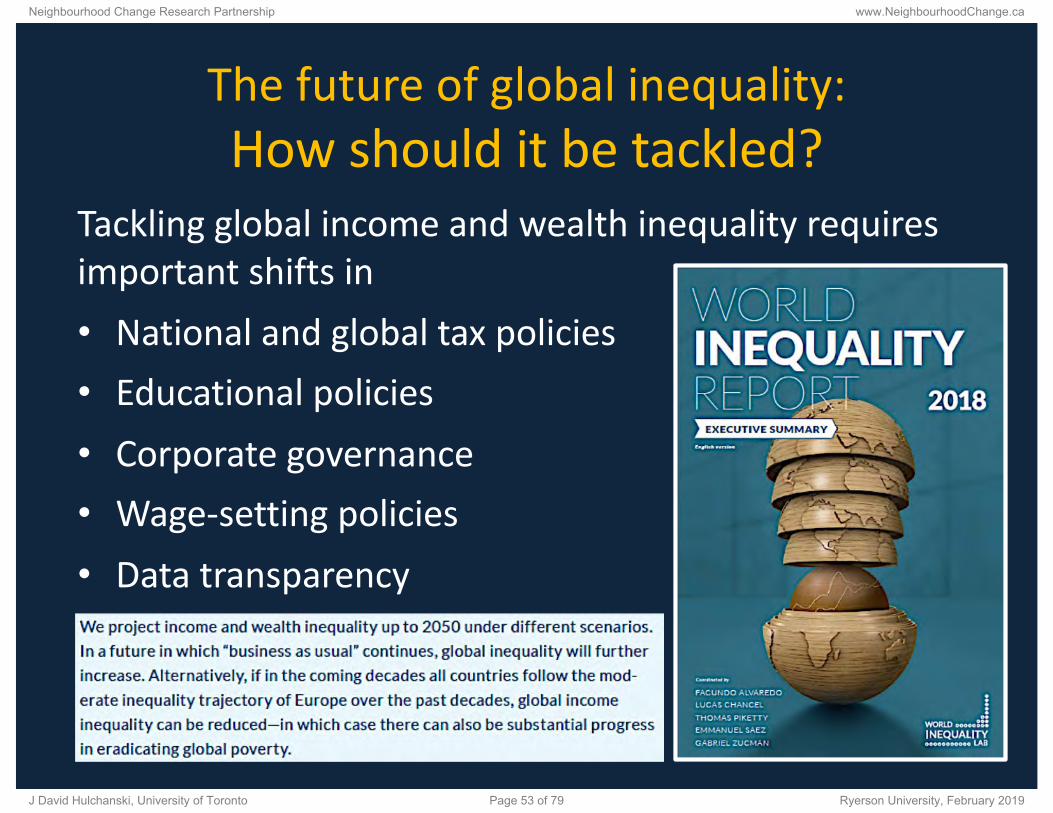
Tackling global income and wealth inequality requires important shifts in• National and global tax policies• Educational policies• Corporate governance• Wage-setting policies• Data transparency
The future of global inequality:How should it be tackled?
Neighbourhood Change Research Partnership www.NeighbourhoodChange.ca
J David Hulchanski, University of Toronto Page 53 of 79 Ryerson University, February 2019

How can inequality be tackled?
1. Progressive Taxation. “Tax progressivity is a proventool to combat rising income and wealth inequality.“
2. Ownership Transparency. “A global financial register recording the ownership of financial assets would deal severe blows to tax evasion, money laundering, and rising inequality.”
3. Address Education and Employment Exclusion. “More equal access to education and well-paying jobs is key to addressing the stagnating or sluggish income growth rates of the poorest half of the population.”
4. Public Investment (education, health, environment). “Governments need to invest in the future to address current income and wealth inequality levels, and to prevent further increases in them.” 54
Neighbourhood Change Research Partnership www.NeighbourhoodChange.ca
J David Hulchanski, University of Toronto Page 54 of 79 Ryerson University, February 2019

Why worry about more rigid socio-spatial divisions and greater inequality?
Inequality promotes strategies that are more self-interested, less affiliative, often highly antisocial, more stressful, and likely to give rise to higher levels of violence, poorer community relations, and worse health. – Richard Wilkinson, The Impact of Inequality, 2005:22
55
Neighbourhood Change Research Partnership www.NeighbourhoodChange.ca
J David Hulchanski, University of Toronto Page 55 of 79 Ryerson University, February 2019

Research Required: Power
• The analysis of power in and over cities
• How power is exercised by the drivers that possess power
• How the impacts of the exercise of power over cities can be better guided, and
• What the goals should be
Peter Marcuse (2016) "For the Repoliticization of Global City Research.” City & Community, 15(2), 116.
56
Neighbourhood Change Research Partnership www.NeighbourhoodChange.ca
J David Hulchanski, University of Toronto Page 56 of 79 Ryerson University, February 2019

For fu r ther in fo rmat ion
www.NeighbourhoodChange.caLarry Bourne, David Ley, Richard Maaranen, Robert Murdie, Damaris Rose, Alan Walks
Neighbourhood Change Research Partnership www.NeighbourhoodChange.ca
J David Hulchanski, University of Toronto Page 57 of 79 Ryerson University, February 2019
Appendix
How Segregated is Toronto?Inequality, Polarization, and Segregation
Trends and ProcessesFebruary 2018
Neighbourhood Change Research Partnership www.NeighbourhoodChange.ca
J David Hulchanski, University of Toronto Page 58 of 79 Ryerson University, February 2019

Neighbourhood Change Research Partnership www.NeighbourhoodChange.ca
J David Hulchanski, University of Toronto Page 59 of 79 Ryerson University, February 2019

Neighbourhood Change Research Partnership www.NeighbourhoodChange.ca
J David Hulchanski, University of Toronto Page 60 of 79 Ryerson University, February 2019

Neighbourhood Change Research Partnership www.NeighbourhoodChange.ca
J David Hulchanski, University of Toronto Page 61 of 79 Ryerson University, February 2019

Neighbourhood Change Research Partnership www.NeighbourhoodChange.ca
J David Hulchanski, University of Toronto Page 62 of 79 Ryerson University, February 2019

Index of Dissimilarity
Logan, J. R., & Stults, B. (2011). The persistence of segregation in the metropolis: New findings from the 2010 census. Census brief prepared for Project US2010, 24.https://s4.ad.brown.edu/Projects/Diversity/Data/Report/report2.pdf 63
Neighbourhood Change Research Partnership www.NeighbourhoodChange.ca
J David Hulchanski, University of Toronto Page 63 of 79 Ryerson University, February 2019

PolarizationIs not the same as inequality; it is• the disappearing middle,• fewer middle-income jobs,• the growth (absolute or relative) at both the top
& bottom ends of the income distribution.
Polarization is both a fact and a process.Process: Redistributive forces/factors causing a movement towards the poles of the distribution.
64
Neighbourhood Change Research Partnership www.NeighbourhoodChange.ca
J David Hulchanski, University of Toronto Page 64 of 79 Ryerson University, February 2019

http://neighbourhoodchange.ca/documents/2015/02/income-inequality-and-polarization-in-canadas-cities-an-examination-and-new-form-of-measurement.pdf 65
Neighbourhood Change Research Partnership www.NeighbourhoodChange.ca
J David Hulchanski, University of Toronto Page 65 of 79 Ryerson University, February 2019

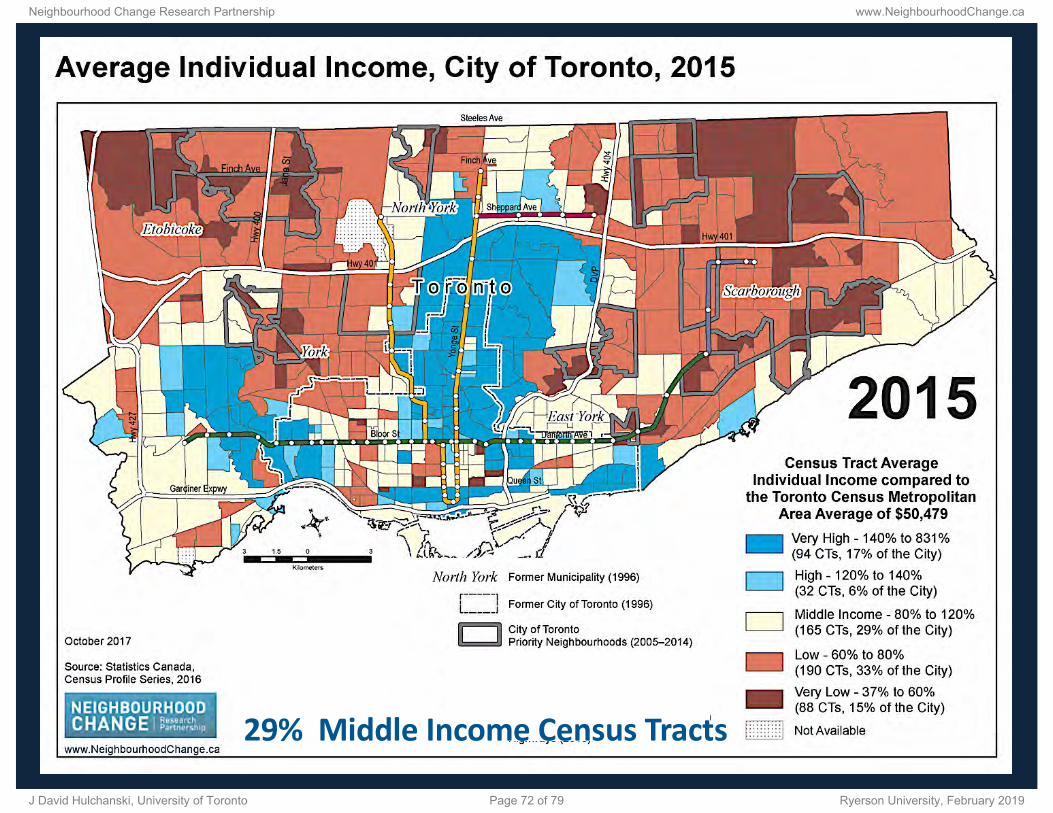
CENSUS TRACTS: SERIES OF MAPS
HIGH INCOME FROM 16% → 23%MIDDLE INCOME FROM 58% → 29%LOW INCOME FROM 26% → 48%
City of Toronto, 1970 - 2015Neighbourhood Income PolarizationDecline of Middle Income Neighbourhoods (census tracts)
66
Neighbourhood Change Research Partnership www.NeighbourhoodChange.ca
J David Hulchanski, University of Toronto Page 66 of 79 Ryerson University, February 2019
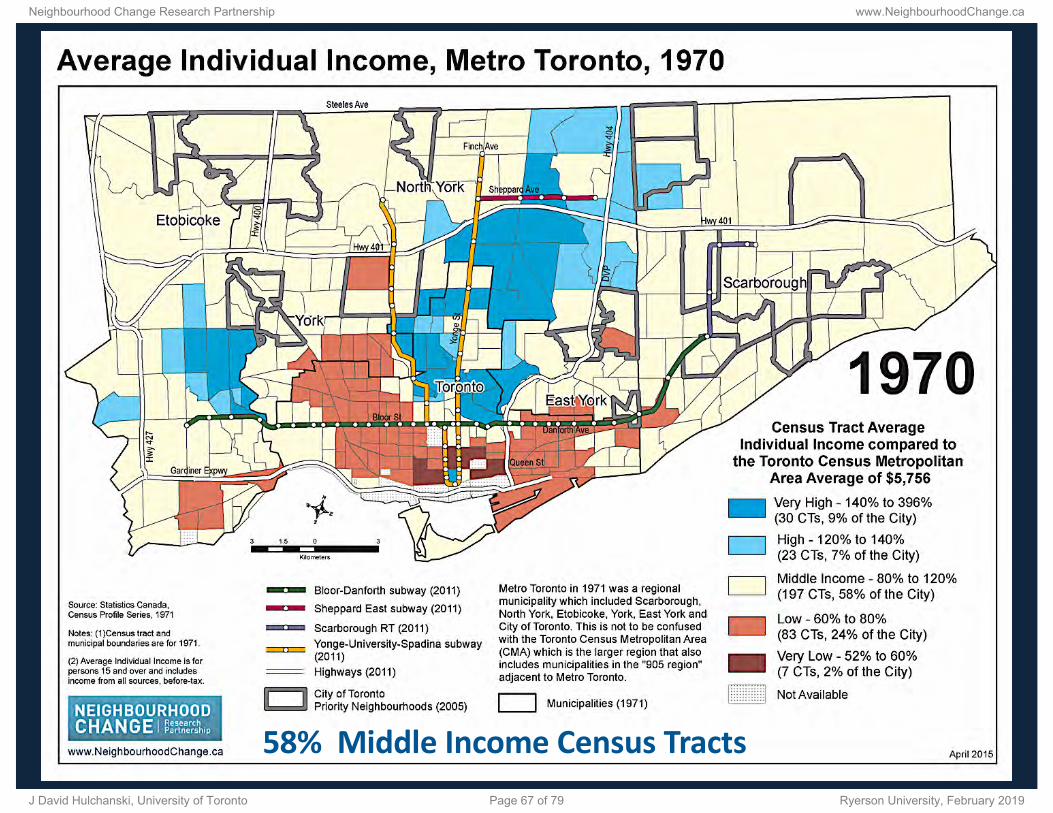
58% Middle Income Census Tracts
Neighbourhood Change Research Partnership www.NeighbourhoodChange.ca
J David Hulchanski, University of Toronto Page 67 of 79 Ryerson University, February 2019

56% Middle Income Census Tracts
Neighbourhood Change Research Partnership www.NeighbourhoodChange.ca
J David Hulchanski, University of Toronto Page 68 of 79 Ryerson University, February 2019

50% Middle Income Census Tracts
Neighbourhood Change Research Partnership www.NeighbourhoodChange.ca
J David Hulchanski, University of Toronto Page 69 of 79 Ryerson University, February 2019

………………………………………..………..
32% Middle Income Census Tracts
Neighbourhood Change Research Partnership www.NeighbourhoodChange.ca
J David Hulchanski, University of Toronto Page 70 of 79 Ryerson University, February 2019

………………………………………..………..
29% Middle Income Census Tracts
Neighbourhood Change Research Partnership www.NeighbourhoodChange.ca
J David Hulchanski, University of Toronto Page 71 of 79 Ryerson University, February 2019
………………………………………..………..
29% Middle Income Census Tracts
Neighbourhood Change Research Partnership www.NeighbourhoodChange.ca
J David Hulchanski, University of Toronto Page 72 of 79 Ryerson University, February 2019

Neighbourhood Change Research Partnership www.NeighbourhoodChange.ca
J David Hulchanski, University of Toronto Page 73 of 79 Ryerson University, February 2019

City of Toronto
Neighbourhood Change Research Partnership www.NeighbourhoodChange.ca
J David Hulchanski, University of Toronto Page 74 of 79 Ryerson University, February 2019

Neighbourhood Change Research Partnership www.NeighbourhoodChange.ca
J David Hulchanski, University of Toronto Page 75 of 79 Ryerson University, February 2019

Neighbourhood Change Research Partnership www.NeighbourhoodChange.ca
J David Hulchanski, University of Toronto Page 76 of 79 Ryerson University, February 2019

14
9
2
1
2
46
45
48
33
17
36
41
30
27
24
19
25
26
28
31
29
32
50
56
58
16
18
17
33
45
6
4
7
7
7
4
3
2
2
3
16
14
11
9
9
15
9
6
3
3
0% 10% 20% 30% 40% 50% 60% 70% 80% 90% 100%
2010
2000
1990
1980
1970
Toronto
2010
2000
1990
1980
1970
Chicago
Census Tract Income Distribution, 1970-2010 City of Chicago and City of Toronto
Very Low (< 60%) Low (60% to 80%) Middle (80% to 120%) High (120% to 140%) Very High (> 140%)
Data Sources: United States Census 1970-2000, American Community Survey 2010, Canada Census 1971-2001, Canada Revenue Agency Taxfiler data 2010.
Income Definition: Census Tract average individual income from all sources, before-tax for persons 15 and over. Income is measured relative to the metropolitan area average each year using CT boundaries as they existed each census year.
Neighbourhood Change Research Partnership www.NeighbourhoodChange.ca
J David Hulchanski, University of Toronto Page 77 of 79 Ryerson University, February 2019

References
How Segregated is Toronto?Inequality, Polarization, and Segregation
Trends and ProcessesFebruary 2019
Neighbourhood Change Research Partnership www.NeighbourhoodChange.ca
J David Hulchanski, University of Toronto Page 78 of 79 Ryerson University, February 2019

ReferencesBourne, L. S., & Walks, R. A. (2011). “Segregation.” Chapter 39, The Wiley-Blackwell companion to human geography (Vol. 15). Agnew, J. A., & Duncan, J. S. (Eds.). John Wiley & Sons, 534-546. Dinca-Panaitescu, M., & Walks, A. (2015). Income inequality, income polarization, and poverty: How are They Different? how are They Measured? Toronto: United Way Toronto and York Region, and NCRP, University of Toronto.Hulchanski, J. D. (2010). The three cities within Toronto: Income polarization among Toronto's neighbourhoods, 1970-2005. Cities Centre, University of Toronto.Marcuse, P. (2016). For the repoliticization of global city research. City & Community, 15(2), 113-117.Marcuse, P., & Van Kempen, R. (Eds.). (2011). Globalizing cities: A new spatial order? John Wiley.Massey, D. S. (2012). Reflections on the dimensions of segregation. Social Forces, 91(1), 39-43.Massey, D. S., & Denton, N. A. (1989). Hypersegregation in US metropolitan areas: Black and Hispanic segregation along five dimensions. Demography, 26(3), 373-391.Massey, D. S., & Denton, N. A. (1993). American apartheid: Segregation and the making of the underclass. Harvard U Press.
Nightingale, C. (2012). Segregation: A global history of divided cities. U of Chicago Press.Tammaru, T., Marcińczak, S., Van Ham, M., & Musterd, S. (2015). A multi-factor approach to understanding socio-economic segregation in European capital cities. In Socio-Economic Segregation in European Capital Cities. Routledge.Van Kempen, R. (2007). Divided cities in the 21st century: Challenging the importance of globalisation. Journal of Housing and the Built Environment, 22(1), 13.Walks, A. (2013). Income inequality and polarization in Canada's cities: An examination and new form of measurement. Research Paper 227, Cities Centre, University of Toronto.Walks, A. (forthcoming, 2019) “Inequality and Neighbourhood Change in the Greater Toronto Region.” Chapter 4, Changing Neighbourhoods: Social and spatial polarization in Canadian cities, Eds. Grant, J.L, Walks, A., Ramos, H. Vancouver: UBC Press.
Walks, A., & Bourne, L. S. (2006). Ghettos in Canada's cities? Racial segregation, ethnic enclaves and poverty concentration in Canadian urban areas. The Canadian Geographer/Le Géographe canadien, 50(3), 273-297.Wilkinson, R., & Pickett, K. (2010). The spirit level: Why equality is better for everyone. Penguin UK.
Neighbourhood Change Research Partnership www.NeighbourhoodChange.ca
J David Hulchanski, University of Toronto Page 79 of 79 Ryerson University, February 2019