HOW RACE/ETHNICITY, IMMIGRATION STATUS AND LANGUAGE AFFECT HEALTH
35
medicaid kaiser commission on uninsured H OW R ACE /E THNICITY , I MMIGRATION S TATUS AND L ANGUAGE A FFECT H EALTH I NSURANCE C OVERAGE , A CCESS TO C ARE AND Q UALITY OF C ARE A MONG THE L OW -I NCOME P OPULATION Prepared by Leighton Ku Center on Budget and Policy Priorities Timothy Waidmann The Urban Institute August 2003 andthe
Transcript of HOW RACE/ETHNICITY, IMMIGRATION STATUS AND LANGUAGE AFFECT HEALTH

medicaid
kaiser commiss ion o n
uninsured
H O W R A C E /E T H N I C I T Y , I M M I G R A T I O N
S T A T U S A N D L A N G U A G E A F F E C T
H E A L T H I N S U R A N C E C O V E R A G E ,
A C C E S S T O C A R E A N D Q U A L I T Y O F
C A R E A M O N G T H E L O W -I N C O M E
P O P U L A T I O N
Prepared by
Le ighton KuCente r on Budget and Po l icy Pr io r i t i es
Timothy WaidmannThe Urban Ins t i tu te
August 2003
a n d t h e

medicaiduninsureda n d t h e
kaiser commission
o n
The Kaiser Commiss ion on Medicaid and
the Uninsured serves as a pol icy ins t i tu te
and f o r um f o r a na l y z i ng hea l t h c a r e
coverage and access for the low- income
popu la t i on and assess ing op t i ons f o r
re form. The Commiss ion, begun in 1991,
s t r ives to br ing increased publ ic aware-
ness and expanded analy t ic e f fo r t to the
pol icy debate over heal th coverage and
access , wi th a specia l focus on Medicaid
and the uninsured. The Commiss ion is a
major in i t ia t ive o f The Henry J . Ka iser
F a m i l y F o u n d a t i o n a n d i s b a s e d a t t h e
Foundat ion ’s Washington, D .C . o f f ice .
J a m e s R . T a l l o n
C h a i r m a n
D i a n e R o w l a n d , S c . D .
E x e c u t i v e D i r e c t o r

H O W R A C E /E T H N I C I T Y , I M M I G R A T I O N
S T A T U S A N D L A N G U A G E A F F E C T
H E A L T H I N S U R A N C E C O V E R A G E ,
A C C E S S T O C A R E A N D Q U A L I T Y O F
C A R E A M O N G T H E L O W -I N C O M E
P O P U L A T I O N
Prepared by
Le ighton KuCente r on Budget and Po l icy Pr io r i t i es
Timothy WaidmannThe Urban Ins t i tu te
August 2003
medicaid
kaiser commiss ion o n
uninsureda n d t h e

TABLE OF CONTENTS EXECUTIVE SUMMARY .................................................................................................... 1 I. INTRODUCTION..................................................................................................... 4 II. BACKGROUND....................................................................................................... 4 III. FINDINGS ............................................................................................................... 10
HEALTH INSURANCE COVERAGE................................................................................ 11 ACCESS TO CARE ..................................................................................................... 13 QUALITY OF CARE..................................................................................................... 17
IV. CONCLUSIONS AND POLICY IMPLICATIONS..................................................... 19 V. APPENDIX A: TABLES........................................................................................... 21 VI. APPENDIX B........................................................................................................... 25 VII. REFERENCES........................................................................................................ 27 The authors gratefully acknowledge the skilled research assistance of Seema Thomas of the Urban Institute and Matthew Broaddus of the Center on Budget and Policy Priorities.
EXECUTIVE SUMMARY
Nearly 33 percent of the United States population identifies themselves as a member of a racial or ethnic group other than white, non-Hispanic (referred to as white throughout the remainder of this paper). Members of racial or ethnic minority groups are more likely to be uninsured and less likely to see a doctor or receive other health care services than whites. The racial/ethnic group least likely to have health insurance and most likely to experience access problems is the Latino population, but race and ethnicity are not the only factors contributing to their limited access to insurance or to care. A large number of Latinos are non-citizens and many have limited English proficiency; these characteristics also explain some of the coverage and access problems encountered by the Latino community. This report seeks to disentangle the roles that race, language and citizenship status play in insurance coverage, access to health care and quality of health care, particularly for the low-income Latino population. (Low-income is less than 200 percent of the poverty line or $30,520 for a family of three in 2003.) Understanding the roles played by citizenship status and language is important for developing policies to help reduce disparities in health care coverage and access. A person’s citizenship status (e.g., citizen, legal immigrant, or undocumented alien) affects eligibility for benefits like Medicaid or the State Children’s Health Insurance Program (SCHIP) and the likelihood of having a job that offers benefits like insurance coverage. English proficiency affects a person's ability to discuss medical problems with a physician or nurse and to complete an insurance application or decipher a medical bill. Restoration of legal immigrants’ eligibility for public benefits and increasing the availability of language assistance, such as translations and interpreters, could improve immigrants’ access to health services and bring them closer to parity with citizens and those with better English skills. This analysis is based on the 1999 National Survey of America’s Families, a national survey conducted by the Urban Institute. It demonstrates that citizenship status and language proficiency have a significant impact on insurance coverage, access to care and the quality of care received among the low-income population. Latinos who are not citizens or who have limited English proficiency are much more likely to be uninsured, less likely to use health care services, and more likely to experience problems communicating with their health care providers than their citizen and English-speaking counterparts. HEALTH INSURANCE COVERAGE Non-citizen minorities who do not speak English are more likely to be uninsured than other minorities or white English-speaking citizens. Among low-income adult citizens who speak English, Latinos are more likely to uninsured than whites (33 percent vs. 28 percent). The likelihood of lacking coverage is far higher, however, among non-citizen Latino adults and those who primarily speak Spanish. Compared to white English-speaking citizens, non-citizen Latino adults who speak English are two times as likely to lack coverage (55 percent vs. 28 percent), and non-citizen Spanish-speaking Latino adults are almost three times as likely to be uninsured (72 percent vs. 28 percent).
Latino children in English-speaking citizen families have about the same risk of being uninsured as white children in citizen families. However, coverage for Latino children drops considerably when they are members of non-citizen families. Latino citizen children whose parents are English-speaking non-citizens are more likely to be uninsured than white children in citizen families (28 percent vs. 17 percent), and Latino children who are themselves non-citizens and who are in Spanish-speaking families are over four times as likely as children in white citizen families to lack coverage (72 percent vs. 17 percent).
1

ACCESS TO HEALTH CARE
Minorities face increased barriers to accessing necessary health care, and non-citizen, Spanish-speaking Latinos experience the most significant access problems. Disparities in access to health care are similar to those for obtaining health coverage. Among low-income English-speaking citizens, about 56 percent of Latino adults saw a physician in the last 12 months compared to 67 percent of whites. Non-citizen Latinos are even less likely to have seen a physician; about half (49 percent) of those who speak English saw a physician and a little more than a third (36 percent) of Spanish-speakers had a physician visit in the past year. Latino children also experience disparities in access, particularly when they are in non-citizen, Spanish-speaking families. Latino children in citizen families are just about as likely to see a physician as similar white children. But, non-citizen children in Spanish-speaking families are less than half as likely as white children to visit the doctor (29 percent vs. 71 percent). QUALITY OF CARE Spanish-speaking, non-citizen minorities experience greater problems communicating with their health care providers, which can contribute to poorer quality care. Fewer English-speaking Latino adults—regardless of citizenship status—reported good communication with their physicians (about 65 percent) compared to white citizens (73 percent). Non-citizen Latinos who primarily speak Spanish, however, experienced far more problems. Less than half (46 percent) reported satisfactory communications. Similarly, children in English-speaking Latino families—both citizen and non-citizen—were slightly less likely to have physicians who were perceived as listening and explaining things well than white children in citizen families (about 72 percent vs. 79 percent). But, only a little more than half (55 percent) of caregivers of Latino children in non-citizen Spanish-speaking families reported good communications with their health care providers.
CONCLUSIONS AND POLICY IMPLICATIONS This analysis demonstrates that citizenship status and English language proficiency strongly affect insurance coverage, access to care and quality of care. Low-income Latinos who are non-citizens and who have limited English proficiency are much more likely to be uninsured, less likely to use health care services, and more likely to experience problems communicating with their health care providres than their citizen and English-speaking counterparts. While this research primarily focuses on race, citizenship status and English proficiency, the number of years that a person or family has lived in the United States is also relevant. A legal immigrant must reside here for at least five years before becoming eligible for naturalization. Moreover, immigrants who are here for less than five years are not eligible for Medicaid or SCHIP, based on federal welfare legislation. Those who stay in the United States for long periods can develop their English skills, get better jobs and improve their incomes. Although immigrants have a high rate of labor force participation, they are often in low-wage jobs with limited benefits, so they are disproportionately low-income and uninsured. Public insurance like Medicaid or SCHIP could, in principle, help compensate for the limited availability of private insurance for immigrant families, but coverage is impeded by eligibility restrictions imposed by the 1996 federal welfare reform law and continuing confusion about eligibility and how benefits might affect their immigration status. These obstacles make it harder for immigrants to get cost-effective primary and preventive health services. For example, pregnant
2

immigrants cannot obtain prenatal care under Medicaid, even though Medicaid would pay for high medical costs that their United States-born baby might incur as a result of the mother not receiving appropriate prenatal care. Congress has demonstrated interest in improving health coverage of low-income immigrants. In June 2003, the Senate approved, on a bipartisan basis, an amendment to grant states the option to restore Medicaid or SCHIP eligibility for legal immigrant children and pregnant women. This amendment was contained in the Senate version of the Medicare prescription drug bill (S. 1). The version from the House of Representatives (H.R. 1) did not include such a provision. As of early August 2003, these differences had not been resolved. Federal civil rights law requires that federal and state agencies and health care providers provide language assistance to those with limited English proficiency. Nonetheless, many patients encounter difficulties because their health care providers do not have enough bilingual or multilingual health staff and they cannot secure interpretation services. Health care providers, however, point to the lack of payments for language assistance as a key reason they cannot afford to provide these services. A large measure of the disparities in access to insurance and health care experienced by Latinos are related to citizenship status and English proficiency. Public policies that address these problems could reduce the racial and ethnic disparities that now exist and could contribute meaningfully to an overall reduction in the number of uninsured people in the United States.
3

I. INTRODUCTION A large body of research shows that racial or ethnic minorities have—on average—poorer access to health insurance and health care than those who are white and non-Hispanic (referred to as white throughout this paper).1,2,3 Among minorities, Latinos are the racial/ethnic group most likely to be uninsured.4 More recent research has shown that health disparities are also affected by factors like immigration status and English language skills.5 These factors are especially relevant for Latinos and Asians since about one-third of Latinos and two-thirds of Asians in the United States are foreign-born.a Understanding the roles of citizenship status and language is important for developing policies to help reduce disparities in health coverage and access. A person’s citizenship status (e.g., citizen, legal immigrant, or undocumented alien) affects eligibility for benefits like Medicaid or the State Children’s Health Insurance Program (SCHIP) and the ability to obtain a job that offers health insurance benefits. English proficiency affects a person’s ability to communicate in our English-dominant society and, more specifically, to discuss medical problems with a physician or nurse or to complete an insurance application. There is substantial overlap in the issues of race, citizenship status and language, and great diversity in the populations affected by these issues. For example, many Latinos are Spanish-speaking immigrants, but most are native-born and fluent in English. Some are native citizens but have limited English proficiency (e.g., those in Puerto Rico are United States citizens but grow up in a Spanish-dominant environment). Differences in the health care coverage, access, and quality for citizen Latinos who speak English and non-citizen Latinos who primarily rely on Spanish can help us identify the specific contributions of citizenship status and language, as opposed to Hispanic ethnicity. This report uses data from the 1999 National Survey of America’s Families (NSAF), a national survey conducted by the Urban Institute, to help disentangle the roles of race/ethnicity, citizenship status and language on insurance coverage, access to care, and quality of care, particularly focusing on the low-income Latino population. II. BACKGROUND RACE/ETHNICITY Census Bureau data demonstrate that Latinos have the highest uninsured rate of all racial/ethnic groups; over one-third are uninsured (Figure 1). African-Americans and Asians also have relatively high uninsured rates and are significantly more likely to be uninsured than whites.6 Uninsured rates vary among Asian subpopulations—Koreans and Southeast Asians are more likely to be uninsured than a Immigration status or language skills might also contribute to health access for African American and white populations, but a much smaller proportion of these racial groups are immigrants.
Figure 1
Percentage of Racial and Ethnic Minorities that are Uninsured, 2001
12%
20% 19%
35%
White, Non-Hispanic
AfricanAmerican
Asian Latino
Source: March 2002 Current Population Survey
4

Chinese, Japanese, Filipinos and South Asians. There is variation among Latinos as well; uninsured rates are higher among Mexicans and Central Americans and lower among Cubans and Puerto Ricans.7 The primary reason that minorities are less likely to have insurance is that they are less likely to have access to job-based coverage. Public insurance coverage, particularly Medicaid, helps offset some of the gap in private coverage, but minorities still have far higher uninsured rates. Latinos and Asians have more difficulty accessing medical care than whites; they are less likely to have a usual place to get health care, less likely to have seen a physician in the past year and less likely to get preventive health care.8, 9,10 Access is particularly limited for those who lack insurance. One result of limited access to primary and preventive health care is an increase in the extent to which patients are hospitalized for conditions, like asthma, that could be avoided with appropriate primary care. Gaskin and Hoffman found that Latino children and African American adults were more likely to be hospitalized for such preventable disorders than similar white patients.11 Disparities in access to care are not a new or recently discovered phenomenon; studies done in the mid-1980s found that Latino adults and children had substantially less access to a variety of health care services than their white peers.12,13 In addition to problems accessing medical care, minority patients often find their experiences with the health care system unsatisfactory. They frequently identify problems in communicating with their physicians, in being treated with trust and respect and in receiving good care overall.14 IMMIGRATION The number of immigrants has been rising steadily. In 2000, there were over 32 million immigrants living in the United States, constituting about 10 percent of the total population.15 Roughly half of the immigrants were from Latin countries, a quarter were from Asian countries, 15 percent were from Europe and the balance were from other parts of the globe. The net increase in the number of immigrants entering each year—both lawful and undocumented entries—has been approximately one million per year. The number of new legal immigrants approved for entry into the United States has declined recently, partly because of entry restrictions imposed since the events of September 11th. But, the level of legal immigration will rise again; the number of applications pending has continued to mount, indicating that a large number of people are still seeking to immigrate into the United States.
Jeffrey Passel of the Urban Institute has estimated that 31 percent of the immigrant population are naturalized citizens, while 69 percent are non-citizens (Figure 2).16 He finds that about 30 percent of immigrants are legal permanent residents, 27 percent are undocumented, and about 7 percent are refugees (including those who naturalize). The balance—about 5 percent—are legal non-residents and include those in the United States with temporary visas, like students, tourists and those with temporary work permits.
Figure 2
The Legal Status of Immigrants, 2000
5%
31%
7%
27%
30%
Refugees
Legal Permanent Residents
Legal Non-immigrants
UndocumentedAliens
NaturalizedCitizens
Citizen Non-Citizen
32.2 Million Immigrants
Note: Percentages may not total 100% due to rounding.Source: Passel, J., U.S. Immigration Trends and Issues, 2003.
5

A more complete accounting of immigrants, however, would also include members of their families who are native citizens, particularly children born in the United States. Most immigrant families include United States-born citizens, so that most immigrant families include a mixture of citizenship statuses.17 The health access of citizen children is influenced by their families’ citizenship status; Brown and his associates found that citizen children living in non-citizen families were more likely to be uninsured than children living in citizen families.18 While, in the past, immigrants have been highly concentrated in states like California, New York, New Jersey, Florida and Texas, during the 1990s, immigrants dispersed to other states like North Carolina, Virginia and Nevada to pursue employment opportunities.19 States that previously had few immigrants have experienced an influx in immigrants and people with limited English proficiency. In 2001, slightly more than half of all low-income non-citizen parents and non-citizen children lacked health insurance coverage, rates that are two to three times those for low-income native citizen parents or for children of citizens (Tables 1 and 2).b (Low-income is defined as having income below 200 percent of the federal poverty line, which is $30,520 for a family of three in 2003.) The insurance gaps occur because non-citizens are less likely to have both public and private insurance coverage. Coverage patterns of naturalized citizen parents are closer to those of native citizens, although they are slightly more likely to be uninsured and slightly less likely to have Medicaid. More than one-quarter of citizen children with non-citizen parents—also referred to as “mixed status” children in this report—are uninsured, a lower rate than for non-citizen children, but appreciably higher than for children with citizen parents. In an earlier study, we found that non-citizens and their children were more likely to be uninsured, even after statistically controlling for the influence of other factors like income, employment, education and health status.20 They are also less likely to have Medicaid or employer-sponsored insurance. In fact, citizenship status appears to play a very large role in coverage, sometimes even larger than race. For example, after controlling for citizenship status and the other factors, Latinos were no longer more likely to be uninsured. That is, citizen Latinos and their children had levels of insurance comparable to those of white citizens and their children who had similar incomes, employment levels, health status, and so on. However, we also found—in that study and another21—that both citizenship status and Hispanic ethnicity were associated with less access to medical care, even after statistically controlling for the influence of factors like insurance status, income and education. That is, even citizen Latinos and their children were less likely to have visited a doctor in the preceding year than whites with similar socioeconomic and health characteristics. A major explanation for the high uninsured rates among non-citizens is the difficulty they have obtaining private insurance. An analysis by Project Hope researchers found that Latino workers who are not citizens were half to two-thirds as likely to be offered insurance in the workplace as Latino citizen workers or white workers and fared worse than citizen workers with similar wages, hours or occupations. However, when offered insurance, non-citizen Latinos were about as likely to participate in job-based insurance plans as citizen workers.22
b These data are based on the Census Bureau’s Current Population Survey (CPS). In these analyses and others that follow, non-citizens include both immigrants who were lawfully present in the United States and undocumented immigrants. Most surveys do not ask the necessary questions to determine legal status.
6
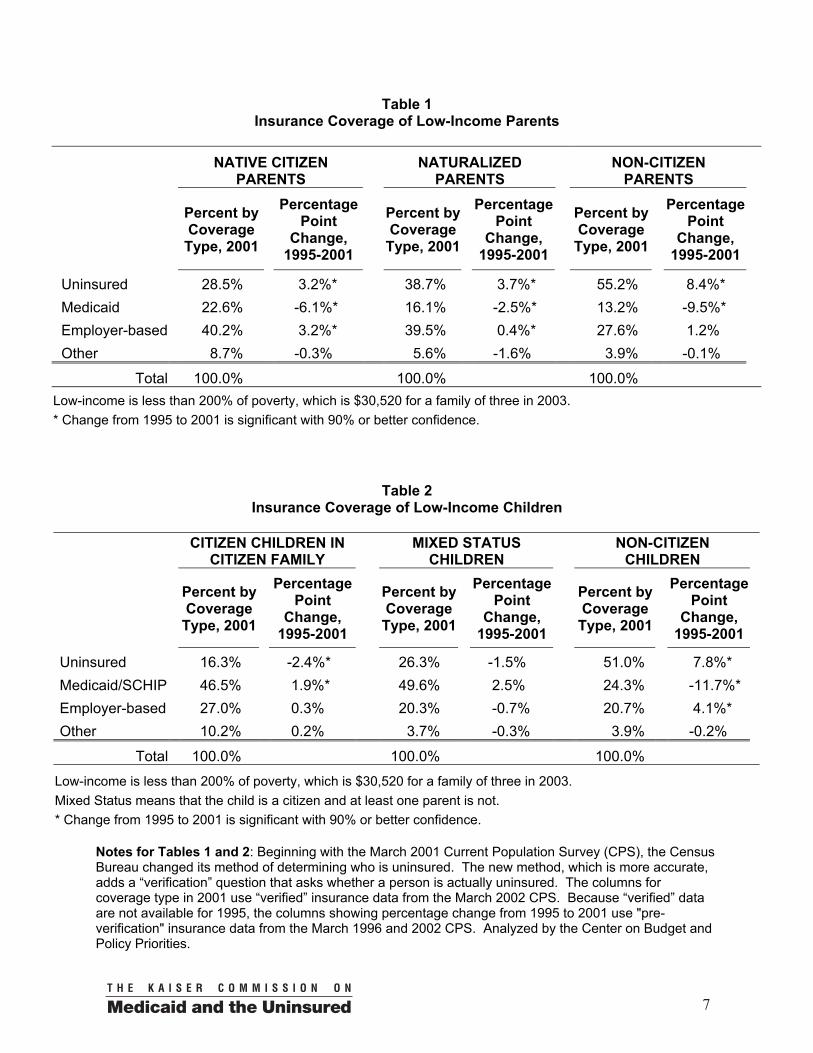
Table 1 Insurance Coverage of Low-Income Parents
NATIVE CITIZEN
PARENTS NATURALIZED
PARENTS NON-CITIZEN
PARENTS
Percent by Coverage Type, 2001
Percentage
Point Change,
1995-2001
Percent by Coverage
Type, 2001
Percentage Point
Change, 1995-2001
Percent by Coverage Type, 2001
Percentage Point
Change, 1995-2001
Uninsured 28.5% 3.2%* 38.7% 3.7%* 55.2% 8.4%* Medicaid 22.6% -6.1%* 16.1% -2.5%* 13.2% -9.5%* Employer-based 40.2% 3.2%* 39.5% 0.4%* 27.6% 1.2% Other 8.7% -0.3% 5.6% -1.6% 3.9% -0.1%
Total 100.0% 100.0% 100.0% Low-income is less than 200% of poverty, which is $30,520 for a family of three in 2003. * Change from 1995 to 2001 is significant with 90% or better confidence.
Table 2 Insurance Coverage of Low-Income Children
CITIZEN CHILDREN IN
CITIZEN FAMILY MIXED STATUS
CHILDREN NON-CITIZEN
CHILDREN
Percent by Coverage
Type, 2001
Percentage Point
Change, 1995-2001
Percent by Coverage Type, 2001
Percentage Point
Change, 1995-2001
Percent by Coverage Type, 2001
Percentage Point
Change, 1995-2001
Uninsured 16.3% -2.4%* 26.3% -1.5% 51.0% 7.8%* Medicaid/SCHIP 46.5% 1.9%* 49.6% 2.5% 24.3% -11.7%* Employer-based 27.0% 0.3% 20.3% -0.7% 20.7% 4.1%* Other 10.2% 0.2% 3.7% -0.3% 3.9% -0.2%
Total 100.0% 100.0% 100.0% Low-income is less than 200% of poverty, which is $30,520 for a family of three in 2003. Mixed Status means that the child is a citizen and at least one parent is not. * Change from 1995 to 2001 is significant with 90% or better confidence.
Notes for Tables 1 and 2: Beginning with the March 2001 Current Population Survey (CPS), the Census Bureau changed its method of determining who is uninsured. The new method, which is more accurate, adds a “verification” question that asks whether a person is actually uninsured. The columns for coverage type in 2001 use “verified” insurance data from the March 2002 CPS. Because “verified” data are not available for 1995, the columns showing percentage change from 1995 to 2001 use "pre-verification" insurance data from the March 1996 and 2002 CPS. Analyzed by the Center on Budget and Policy Priorities.
7

The other key problem for non-citizens is the loss of public insurance coverage that was caused by restrictions on Medicaid and SCHIP eligibility for recent immigrants under the 1996 federal welfare reform law. Federal benefits for non-emergency care may not be offered to most legally-admitted immigrants for the first five years they are in the United States. Thus, immigrants are not eligible for cost-effective primary or preventive care services like prenatal care or treatment for chronic conditions like diabetes, although they are eligible for emergency services, like treatment for a diabetic coma, or for costs incurred by United States-born children, including high medical costs that could have been prevented with appropriate prenatal care. In the past several years, the uninsured rates for non-citizen parents and children increased appreciably, as shown in Tables 1 and 2 (previous page). There were two reasons for the loss of health insurance coverage. First, Medicaid participation fell after the welfare law was enacted in 1996. Second, while more citizen adults gained job-based insurance in the late 1990s, non-citizens did not benefit appreciably. Earlier analyses have indicated that the mixed status children—citizen children in non-citizen families—lost Medicaid coverage after welfare reform. Studies by other researchers, using other data, have reached similar findings. For example, two teams of UCLA researchers found less insurance coverage among children of immigrants and problems in their access to care, using national and local survey data. 23, 24 Urban Institute researchers found that Medicaid enrollment of legal immigrants and their children fell sharply after the 1996 welfare law was enacted, based on analyses of administrative data from Los Angeles.25 The data in Table 2 indicate that Medicaid/SCHIP coverage for these children has returned to levels that existed before welfare reform. One possible explanation is that the ethnic and immigrant-oriented outreach initiatives developed in the late 1990s to encourage children to enroll in SCHIP and Medicaid were eventually successful in reaching children of immigrants. Other factors also limit eligibility or discourage immigrants from applying for public coverage for themselves or their children even after they have been in the United States for five or more years. For example, the law now requires that the income of recent immigrants’ sponsors should be “deemed” available to them in computing income eligibility for Medicaid or SCHIP, even if the sponsor lives separately from the immigrant and does not contribute materially to the immigrant household. This could render a majority of immigrants ineligible even after their five-year exclusion period expires. Finally, immigrant families often fear that enrolling in Medicaid or SCHIP might place their residency or citizenship in jeopardy. In the mid-1990s, some immigration and consular officials began to require immigrants to repay the value of Medicaid benefits received if they wanted to stay in or return to the United States because the receipt of Medicaid could be interpreted as making the immigrant a “public charge.”c The Immigration and Naturalization Serviced later clarified that getting Medicaid or SCHIP benefits (except long-term care) would not jeopardize immigrants’ residency status. Even so, many immigrants continue to have misunderstandings about these policies and worry that getting benefits might place their immigration status at risk. c “Public charge” is an immigration term, which means the person may become dependent on government aid. A person who is likely to become a public charge may be denied permission to reside in the United States or denied reentry if he or she has traveled abroad. In the early 1990s, a large number of immigrants trying to reenter the country were prohibited entry unless they paid back the value of Medicaid benefits they had received. d The Immigration and Naturalization Service is now named the Bureau of Citizenship and Immigration Services in the Department of Homeland Security.
8

In a recent survey in New York City and Los Angeles, less than one-fourth of low-income immigrants could correctly answer three questions about possible repercussions that might occur if they participated in benefit programs like Medicaid.26 Confusion and fear of possible adverse consequences persist in the immigrant community. ENGLISH PROFICIENCY Census data indicate that 18.4 percent of adults in the United States speak another language at home and 4.7 percent do not speak English well or do not speak English at all (Appendix Table A-1). Moreover, about one-third of those who speak Spanish at home and almost one-quarter of those speaking Asian languages have little or no ability to speak English. Language problems affect insurance coverage in at least two ways. First, those with limited English proficiency may have limited employment opportunities and may work in jobs less likely to offer job-based insurance. Second, language barriers may make it harder to complete insurance applications, whether for public or private insurance. For example, parents who speak Spanish, Chinese, Korean and Vietnamese have reported difficulties finding translated applications for Medicaid or SCHIP or obtaining language assistance, making it more difficult to enroll their children.27, 28
A number of studies indicate that those who are not proficient in English have limited access to care and may receive poorer quality care because of communication problems, particularly if health care providers do not have bilingual staff or do not provide other interpretation assistance. One recent study found that there were considerable differences in access to health care by insured adults based on race and ethnicity and that most of the ethnic differences in care were explained by differences in English fluency.29 About one-fifth of Spanish-speaking Latinos reported they did not seek medical care when it was needed either because the doctor did not speak Spanish or because there was no language interpreter available.30 Latino parents have reported that language barriers are the leading problem in obtaining care for their children. Spanish-speaking parents have reported that their children received misdiagnoses, poor medical care and inappropriate medications because of language problems.31 Both health care providers and patients believe language barriers are a serious problem and can compromise the quality of care.32 The inability to communicate means doctors and patients cannot discuss their symptoms or alternative treatment regimens, leading to misdiagnoses or inappropriate treatment choices. Moreover, patients may not understand the treatments prescribed and may not be able to comply with the therapy. In a recent survey, more than a quarter of patients who needed but did not get an interpreter reported that they did not understand the instructions on how to take their medications.33 In the same study, patients who needed but did not get an interpreter were less likely to have been told about financial assistance that could help them pay their medical bills than those who had interpreters.
Title VI of the Civil Rights Act of 1964 and, more recently, Executive Order 13166, have reinforced the responsibility that health agencies and providers have in offering language assistance to people with limited English proficiency as a means of ensuring equal access to benefits.e However, it is clear that language barriers persist.34
e Please see Jane Perkins, Ensuring Linguistic Access in Health Care Settings: An Overview of Current Legal Rights and Responsibilities, Kaiser Commission on Medicaid and the Uninsured, August 2003.
9
III. FINDINGS This report analyzes data from the 1999 National Survey of America’s Families (NSAF), a large nationally representative survey of the non-elderly population.35 Other analyses concerning race, citizenship and health have also used NSAF data.36 It is a uniquely useful database because it has data about health insurance and health care access, race/ethnicity, immigration and citizenship status and language The survey was administered in both English and Spanish and information about the language of administration is used as a measure of English proficiency. For families with children, the preferred survey respondent was the person who cares for the children, typically the mother. Thus, the respondent was generally the parent who has responsibilities like taking children to the doctor’s office. The language of the survey represents the language of the parents rather than of the children. (In many immigrant households, older children are more fluent in English than their parents.) Because the survey was not translated into other languages, NSAF probably under-represents those who speak neither English nor Spanish. As a result, our report provides some information on all racial and immigrant groups, but focuses on Latinos, who are better represented in the survey and who constitute the largest immigrant group and the racial/ethnic group with the most severe access problems. Throughout the analysis of parents, attempts were made to separate racial/ethnic groups as native citizens, naturalized citizens, and non-citizens. In many cases, sample sizes for naturalized citizens were too small for analysis. Thus, the findings presented here focus on comparisons between native citizens and non-citizens. Through the remainder of this paper, native citizen parents are referred to as citizens. Some data on naturalized citizen parents are available in the Appendix A Tables. In the analysis of children, references to citizen children include native and naturalized citizen children. (Overall, the number of naturalized citizen children is quite small.) An important factor that also leads to disparities in health care coverage and access is income. Minority and immigrant families tend to have lower average incomes than white citizen families. To reduce the effect of income differences and focus on differences attributable to race, citizenship status and language, the rest of the analyses are based on low-income people in families with incomes below 200 percent of the poverty level, which is $30,520 for a family of three in 2003.
10

HEALTH INSURANCE COVERAGE Low-income non-citizens generally are much more likely to be uninsured than their white citizen counterparts, as shown in Figure 3 (with more detail in Appendix Table A-2).f For example, Latino citizen adults are only slightly more likely to be uninsured (34 percent) than white citizens (28 percent). In addition, the uninsured rates for Latino children in citizen families (17 percent) are essentially the same as for white children in citizen families (19 percent). However, non-citizen Latino adults are two and half times more likely to lack coverage than white citizen adults (70 percent vs. 28 percent), and children in non-citizen Latino families are nearly four times as likely to lack coverage than white children in citizen families (74 percent vs. 19 percent). Non-citizens are also generally much more likely to be uninsured than citizens of their same racial/ethnic group. Latino, African American and Asian non-citizen adults and children all are much more likely to lack coverage than people of the same racial/ethnic group who are citizens or children in citizen families. Among low-income Latinos, the percent of non-citizen adults who are uninsured (70 percent) is twice as high as for citizens (34 percent). The uninsured rate for non-citizen Latino children (74 percent) is over four times the rate for Latino children in citizen families (17 percent). (White non-citizens are not particularly more likely to lack coverage than citizens, however. One possible reason is a large proportion of low-income white immigrants are Russian or Eastern European and are often classified as refugees who are eligible for Medicaid in the first seven years after arrival.) English proficiency also affects insurance status. Since NSAF is only administered in English and Spanish, we focus on insurance coverage for Latinos. On the next page, Figure 4 shows the insurance status for Latinos, by citizenship status and language, and compares them to levels for white citizens, who all speak English (also see Appendix Table A-3).g The data clearly show the cumulative effects of race, citizenship status and language. Latino citizen adults who speak English have uninsured rates (33 percent) that are slightly higher than white citizens (28 f All the following estimates in this report are from NSAF. They differ from measures based on the Current Population Survey (CPS) because NSAF assesses current insurance status (status at the time of the interview), while the CPS measures insurance coverage over the preceding calendar year. Both NSAF and the CPS ask a “verification” question in which those who do not report a source of insurance coverage are asked to confirm that they are uninsured. g Data for non-citizen Latino children in English-speaking families were suppressed because the sample was too small for analysis (fewer than 30). Almost all non-citizen Latino children were in Spanish-speaking families. Appendix Table A-3 has more detail.
Figure 3
Percentage of Uninsured Low-Income Adults and Children, by Racial/Ethnic Group and Citizenship Status, 1999
28% 30%
19%
11%17%
31%
54%
23%
36%34%
70%
30%
74%
18%17%22%
17%12%
22%
2%
White Black Latino Asian
Adults ChildrenNative Citizen Non-Citizen Citizen Family Mixed Status Non-Citizen
Note: Mixed Status means that the child is a citizen and at least one parent is not.Low-income is less than 200% of poverty, which is $30,520 for a family of three in 2003.Data: 1999 National Survey of America’s Families, Urban Institute.
11

percent). Uninsured rates among Latino citizen adults who primarily speak Spanish (41 percent) are somewhat higher than for English-speaking Latino citizens (33 percent). The gaps in coverage grow far wider for non-citizen Latinos. Among non-citizen Latinos who speak English, more than half (55 percent) are uninsured, roughly double the rate for white citizens (28 percent). Among non-citizen Latinos who speak Spanish, about three-quarters (72 percent) lack coverage, a rate almost triple that of white citizens (28 percent).
Figure 4
Percentage of Uninsured Low-Income Adults, by Citizenship Status and Language, 1999
72%
55%
41%33%
28%
Note: Low-income is less than 200% of poverty, which is $30,520 for a family of three in 2003.Data: 1999 National Survey of America’s Families, Urban Institute.
Primary LanguageEnglish Spanish
White, Citizen
Citizen Non-CitizenLatino
Insurance status for children follows a similar trend (Figure 5). Among English-speaking citizen families, Latino children are about as likely to be insured as white children. But the uninsured rate grows appreciably for those in non-citizen families and for those who speak Spanish. A Latino child who is him- or herself a non-citizen and lives in a Spanish-speaking family is over four times more likely to lack insurance coverage than a white child in a citizen family (72 percent vs. 17 percent).
Figure 5
Percentage of Uninsured Low-Income Children, by Family Citizenship Status and
Language, 1999
17% 16%26% 28% 31%
72%
Latino
Citizen FamilyCitizen Family, White
Mixed Status Non-Citizen
English SpanishParents’ Primary Language
Note: Mixed Status means that the child is a citizen and at least one parent is not.The sample size for Non-Citizen children in English-speaking families was too small for analysis.Low-income is less than 200% of poverty, which is $30,520 for a family of three in 2003.Data: 1999 National Survey of America’s Families, Urban Institute.
12

ACCESS TO CARE In many respects, a more vital question is how race, citizenship status and language influence a person’s access to medical care. One of the most common measures of access is whether a person had any visits to a physician in the previous twelve months. This measures the extent to which people can access basic primary and preventive medical care, whether at a physician’s office, clinic, hospital outpatient department or other setting. Low-income non-citizen adults generally have lower levels of access to physician services than citizens who are of the same race or ethnicity, but the disparity between non-citizens and citizens is the widest for Latinos (Table 3). Similarly, there were substantial disparities in access to physician services for non-citizen Latino children, compared to Latino children in citizen families.
Table 3 Probability of Visiting a Physician in the Preceding 12 Months,
Low-Income Adults and Children by Race/Ethnicity and Citizenship Status, 1999
Percent with Doctor Visit:
White African
American Latino Asian
Adults* Total, All citizenship statuses 67.2% 66.0% 45.1% 54.5% Native citizen 67.2% 65.8% 54.3% 62.0% Non-citizen 55.3% 62.7% 37.9% 51.7% Children Total, All citizenship statuses 71.0% 70.8% 61.6% 72.9% Children in citizen family 71.0% 70.5% 73.9% 82.9% Mixed status children 72.8% 76.0% 62.0% 70.8% Non-citizen children 68.5% 72.5% 32.0% 66.2% Mixed status means that the child is a citizen and at least one parent is not. * Data about naturalized citizens not shown due to limited sample size Source: 1999 NSAF
13

Language also plays a role in access to physician services. Among citizens, Latinos are less likely to have seen a physician than whites. Latinos are even less likely to have seen a physician when they are not citizens and when they primarily speak Spanish (Figure 6). About half (49 percent) of English-speaking non-citizen Latinos saw a physician, compared to 67 percent of white citizens. Only about a third (36 percent) of Spanish-speaking non-citizen Latinos saw a physician—about half the rate of white citizens.
Figure 6
Percentage of Low-Income Adults Who Saw a Doctor in the Last Year, by Citizenship Status
and Language, 1999
67%
56%48% 49%
36%
Latino
SpanishEnglishPrimary Language
Citizen,White
Citizen Non-Citizen
Note: Low-income is less than 200% of poverty, which is $30,520 for a family of three in 2003.Data: 1999 National Survey of America’s Families, Urban Institute.
For children, reduced access to physician services occurs primarily among Spanish-speaking children in non-citizen families (Figure 7). Children in citizen families (both English- and Spanish-speaking) are as likely as white citizen children to have seen a physician (over 70 percent saw a physician). The share of Spanish-speaking children in mixed families who saw a doctor (59 percent) is somewhat less, but access is reduced by more than half for non-citizen children in Spanish-speaking families with only 29 percent seeing a physician.
Figure 7
Percentage of Low-Income Children Who Saw a Doctor in the Last Year, by Family Citizenship
Status and Language, 1999
71% 74% 73% 71%59%
29%
English SpanishParents’ Primary Language
LatinoCitizen FamilyCitizen Family,
WhiteMixed Status Non-Citizen
Note: Mixed Status means that the child is a citizen and at least one parent is not.The sample size for Non-Citizen children in English-speaking families was too small for analysis.Low-income is less than 200% of poverty, which is $30,520 for a family of three in 2003.Data: 1999 National Survey of America’s Families, Urban Institute.
14

These data suggest that race/ethnicity, citizenship status and language skills each contribute to reductions in access to primary health care for Latino adults. However, for Latino children, access to primary care is primarily related to language and citizenship status. Another measure of access to care is the probability of having an inpatient hospitalization in the preceding 12 months. As shown in Figure 8, among adults, citizen Latinos had a similar likelihood of being hospitalized as white citizens, but non-citizens were less likely to have been hospitalized, particularly non-citizen Spanish-speakers (7 percent vs. 13 percent).
Figure 8
Percentage of Low-Income Adults with Inpatient Hospitalization in the Last Year, by Citizenship
Status and Language, 1999
13% 14% 13% 12%
7%
Citizen,White
Citizen Non-CitizenLatino
Note: Low-income is less than 200% of poverty, which is $30,520 for a family of three in 2003.Data: 1999 National Survey of America’s Families, Urban Institute.
SpanishEnglishPrimary Language
Among children, Spanish-speaking non-citizens were much less likely to have been hospitalized than white children in citizen families (1 percent vs. 8 percent). However, Latino children in citizen families were more likely to have been hospitalized than white children in citizen families (Figure 9). (See Appendix Table A-4 for more details on inpatient hospitalization.)
Figure 9
Percentage of Low-Income Children with Inpatient Hospitalization in the Last Year, by
Family Citizenship and Language, 1999
8%
12%13%
8%
6%
1%
Citizen Family,White
Citizen Family Mixed Status Non-CitizenLatino
English SpanishParents’ Primary Language
Note: Mixed Status means that the child is a citizen and at least one parent is not.The sample size for Non-Citizen children in English-speaking families was too small for analysis.Low-income is less than 200% of poverty, which is $30,520 for a family of three in 2003.Data: 1999 National Survey of America’s Families, Urban Institute.
15

It should be noted, however, that inpatient hospitalization is an imperfect measure of access to care. For example, poor access to primary care could lead to more hospitalization for preventable disorders; in these cases, poor access leads to greater hospitalization.37 Yet, many of the same barriers—financial, insurance, language, discrimination, etc.—that may lead non-citizens to receive less primary care also could lead to reduced use of inpatient hospital care. Access for other types of care including dental care and emergency room care, yielded results (not shown) that were relatively similar to those for primary medical care and hospitalizations: non-citizens, particularly those who are Spanish-speaking, received less health care. In some cases there are race-related effects as well, but the effects of citizenship status and language usually appeared stronger. An earlier study also showed that non-citizens and their children had less access to dental and emergency care than citizens and their children, after controlling for many other socioeconomic factors.38 On the other hand, the reduction in utilization of medical care does not necessarily mean that non-citizens or those with limited English proficiency were unable to get “necessary” medical care. The survey asked whether a person has postponed receiving medical care or surgery when it was “needed,” as defined by the respondent. If so, it asked whether the care was postponed for cost-related reasons, including insurance-related problems. In contrast to the findings reported above, Latino non-citizen adults were somewhat less likely to report delaying care than white citizen adults (Table 4, next page). Delaying care was relatively uncommon among children and there were no consistent patterns related to citizenship status. In other analyses (not shown), we more closely examined the relationship of language with postponement of care for Latino adults and children. The extent of postponement was relatively similar for both English- and Spanish-speaking families. At first glance, these results seem contrary to the findings about access to physician or hospital services, since they suggest white citizens delay needed medical care as much as or more than Latinos or Asians, that immigrants are as likely or less likely to postpone care and that language makes little difference. There are at least two possible explanations for these findings. One possible explanation is that Latino and Asian non-citizens—particularly adults—get less medical care because they perceive they “need” less care due to cultural differences in the perception of what constitutes necessary care. That is, some non-citizens might ignore a symptom and not feel that it “needs” medical treatment, while a citizen would seek care for the same symptom.
An alternative explanation is that Latino and Asian non-citizens might perceive they need less care because they have less initial contact with health care providers or because of lowered expectations. In many cases, people believe medical care is needed (even if it is postponed) because, based on an initial visit and medical evaluation, a medical professional has recommended treatment or further testing. But, if non-citizens have less initial contact with or have greater problems communicating with health care providers, they might be less aware of these medical “needs” than people with better access to care. For example, many people are unaware of the need for treatment for high blood pressure or diabetes (both of which are usually “silent” diseases, particularly during their earlier stages) because they have never been tested or lack information about these diseases. Further, if non-citizens know they cannot readily afford to get care, they might rationalize their plight by believing that care is not really necessary. These data suggest that the disparities in access to care experienced by Latinos, particularly non-citizens and those who do not speak English well, have complex causes and might be influenced by external barriers (like insurance and financial problems and/or discrimination) as well as by differences in cultural perceptions about medical care.
16

Table 4 Postponement of Necessary Medical Care, Low-Income Adults and Children by
Race/Ethnicity and Citizenship Status, 1999
Percent Postponing Care:
ADULTS*
White African American Latino Asian
Postpone Care for Any Reason Total, All citizenship statuses 18.3% 17.6% 8.4% 6.0% Native citizen 18.6% 17.1% 9.3% 12.9% Non-citizen 10.2% 18.1% 7.4% 2.1% Postpone Care Due to Cost Total, All citizenship statuses 13.9% 12.7% 6.6% 1.2% Native citizen 14.2% 12.2% 6.8% 2.0% Non-citizen 4.3% 12.5% 6.4% 0.5%
CHILDREN
Postpone Care for Any Reason Total, All citizenship statuses 5.2% 6.1% 5.4% 6.0% Mixed status children 3.3% 10.2% 5.3% 5.2% Non-citizen children 9.7% 3.1% 5.4% 8.5% Postpone Care Due to Cost Total, All citizenship statuses 3.6% 4.5% 3.9% 0.8% Children in citizen family 3.5% 4.5% 3.7% 0.0% Mixed status children 2.5% 5.3% 3.7% 0.7% Non-citizen children 9.7% 2.4% 4.9% 2.4% Mixed status means that the child is a citizen and at least one parent is not.
* Data about naturalized citizens not shown due to limited sample size Source: 1999 NSAF
QUALITY OF CARE A particularly relevant measure of the quality of health care received and the patient’s satisfaction is how well the patient communicates with his or her health care providers. As described earlier, language barriers can reduce the quality of medical care because the physician may have greater difficulty diagnosing the problems if he or she cannot understand the patient and the patient may be unable to comply with medical treatments if he or she cannot understand the instructions. Moreover, the flaws in communication are likely to be discouraging to patients, making them less likely to want further medical treatment.
17

White adult citizens and children in citizen families were the most likely to report good communication with their providers (Appendix Table A-5). The levels for African American, Latino or Asian citizens were only slightly lower. However, non-citizens of all racial/ethnic groups (except Asians) were less likely to report good communications with health care providers. More detailed data for Latinos demonstrate that language is the primary contributing factor to communication problems; problems are the most severe for non-citizen patients who speak Spanish. A Latino non-citizen adult who speaks Spanish was significantly less likely to report satisfactory communications (46 percent) than a white citizen adult (73 percent) (Figure 10). Similarly, Spanish-speaking caregivers of non-citizen Latino children were much less likely to report good communications (55 percent) as white citizen parents (79 percent) (Figure 11).
Figure 10
Percentage of Low-Income Adults Whose Provider Listened and Explained, by Citizenship
Status and Language, 1999
73%64% 65% 66%
46%
Note: Low-income is less than 200% of poverty, which is $30,520 for a family of three in 2003.Data: 1999 National Survey of America’s Families, Urban Institute.
SpanishEnglishPrimary Language
Citizen,White
Citizen Non-Citizen
Latino
Figure 11
Percentage of Low-Income Children Whose Provider Listened and Explained, by Family
Citizenship Status and Language, 1999
79%72% 68% 71%
57% 55%
Citizen Family,White
Citizen Family Mixed Status Non-CitizenLatino
SpanishEnglishPrimary Language
Note: Mixed Status means that the child is a citizen and at least one parent is not.The sample size for Non-Citizen children in English-speaking families was too small for analysis.Low-income is less than 200% of poverty, which is $30,520 for a family of three in 2003.Data: 1999 National Survey of America’s Families, Urban Institute.
18

IV. CONCLUSIONS AND POLICY IMPLICATIONS
This analysis shows that non-citizens, particularly Latinos, and those who do not speak English well experience serious disadvantages in gaining access to quality health care services: they are less likely to have health insurance coverage, less likely to get physician or hospital care and more likely to have poor communications with their providers. In some cases, these problems exacerbate disparities that also affect citizen Latinos who speak English well, while in other cases the English-speaking, citizen Latinos are already at parity with white citizens. Earlier research has demonstrated that non-citizen Latinos encounter immigrant-specific barriers in obtaining both public and private health insurance. They are often ineligible for or have serious misperceptions about Medicaid and SCHIP and they are much less likely to be offered job-based insurance in the workplace. Language barriers may compound the difficulties by making it less likely that eligible people would apply for public or private coverage. While this analysis has focused on the roles of race, citizenship status and language, there is at least one other related factor affecting coverage, access, and quality: the length of time a person has been in the United States. A recent immigrant will be less acculturated, less established in the community or workplace and have a poorer understanding of the American health system. Recent immigrants are also much more likely to be ineligible for public coverage since the Medicaid and SCHIP eligibility restrictions fall most heavily on those in the United States for five years or less. While duration of time in the United States is intertwined with the other factors, this paper did not focus on that issue since groups were already segmented by citizenship status and language capability; further subdividing groups by the length of time in the United States would result in very small sample sizes. The evidence in this report, including prior research reviewed in this report, points toward policies that could reduce the disparities in access to health care. One important step is restoring legal immigrants’ eligibility for public insurance. In June 2003, the Senate included in its version of the Medicare prescription drug legislation (S.1) an amendment to give states the option to restore Medicaid and SCHIP eligibility for legal immigrant children and pregnant women, beginning in Fiscal Year 2005 and ending in 2007. The amendment had bipartisan approval.h Such a policy has been supported by a broad coalition, including the National Governors Association, the National Conference of State Legislatures and a large number of health care provider, consumer and civil rights organizations. The Congressional Budget Office estimated that such a policy would restore coverage for about 155,000 children and 60,000 pregnant women. The version of the Medicare prescription drug bill approved by the House of Representatives (H.R. 1) did not include such a provision. As of early August 2003, it is not clear how the House-Senate conference committee for this bill will resolve these differences. Regardless of federal legislative changes, states may cover legal immigrants using state-funded “replacement” programs to cover legal immigrants during the five-year federal bar. As of early 2003, about 20 states covered some legal immigrants in Medicaid or SCHIP, using state funds without federal matching contributions. However, because of states’ current budget pressures, some states restricted immigrants’ eligibility in legislation for 2004. New Jersey and Massachusetts took steps to reduce eligibility for a large number of immigrants in Medicaid by eliminating state-funded coverage. Colorado restricted eligibility for legal immigrants in Medicaid to those required for coverage under federal law, ending coverage for about 3,500 legal immigrants eligible for federal matching as optional beneficiaries. h A proposal to delete this amendment was rejected on the Senate floor by a bipartisan vote of 65 to 33.
19

Initiatives to increase offers of job-related health insurance to immigrant workers could also reduce disparities. However, the lack of job-based health insurance for immigrant workers is linked to two broader problems—the types of jobs typically held by immigrants (often low-wage and in small firms) and the limited extent to which many firms, particularly small businesses and those employing low-wage workers, offer coverage to any workers. Policies that improve the quality of jobs held by immigrants or that lead more businesses to offer insurance to low-income workers could also aid immigrants.
Improving access to insurance coverage would help immigrants’ access to care, but would not guarantee equal access to care for immigrants or those with limited English proficiency. The other critical area is ensuring that there is adequate access for those with poor English skills. Applications for insurance—whether public or private—should be accessible to those who require language assistance. More importantly, hospitals, clinics, managed care firms, and doctors’ offices—particularly those located in areas with a sizable immigrant population—should have bilingual staff, interpreters or alternative systems (e.g., telephone language line assistance) for language access.i A recent report by staff of the National Health Law Program has highlighted a number of promising state and local initiatives to improve language access, including providing Medicaid or SCHIP reimbursement for interpreters, using community-based organizations to help with interpretation, and innovative hospital and managed care practices.39 Federal law, particularly Title VI of the Civil Rights Act of 1964, already requires organizations that receive federal funds, including health care providers and social service agencies, to make language services available. However, studies like this one and others referenced earlier demonstrate that language barriers are an everyday occurrence. One critical roadblock is the lack of funds to pay for interpreter services or other language assistance or to provide incentives for health care providers to hire bilingual staff. The Institute of Medicine’s report on racial and ethnic disparities in health care identified this as a serious problem and recommended better financing of language and related services to help reduce the current gaps in access to care.40 This study has demonstrated that there are substantial reductions in health care utilization by those who do not speak English well. As discussed in Appendix B, this corresponds with other research that shows Latinos and Asians incur substantially lower health care expenditures than white or African Americans.
Demographic trends indicate that the number of immigrants in the United States is rising and will continue to rise. Immigrants today face a more complex social environment than the immigrants who arrived on these shores one or two generations ago. Nowhere are these changes more evident than in the realm of health care. The high cost of medical care and the complexities of the American health care system make it more important today for immigrants to have health insurance to access affordable health care. This report demonstrates that it is much harder to get insurance coverage or to get care if you are not a citizen or if you do not speak English well. Public policies can help reduce these barriers and, thereby, help eliminate racial and ethnic disparities in health care that afflict so many Latino and Asian, as well as white and African American, immigrants.
i In addition to the need for more interpreter services, there is also a need for greater availability of English as a Second Language (ESL) training. While it is in immigrants’ long-term economic and social interests to become fluent in English, they may still have need for language assistance to help meet short-term needs, including the need to access health care services.
20

APPENDIX A: TABLES
21

Table A-1 Language Spoken at Home and Ability to Speak English, Adults 18-64, 2000
% of Adults Who Speak
Another Language at
Home
% of Adults Who Do Not
Speak English Well or at All
Share of Those Who Speak
Another Language at Home Who Do
Not Speak English Well or at All
Language Spoken at Home Any Language Other Than English 18.4% 4.7% 25.7% Spanish 11.0% 3.5% 32.2% Other Indo-European 3.7% 0.5% 12.6% Asian language 3.0% 0.7% 22.4% Other language 0.8% 0.1% 9.4%
Source: Census Supplementary Survey, 2000
Table A-2 Percentage of Low-Income Adults and Children Who Are Uninsured,
by Racial/Ethnic Group and Citizenship Status, 1999
White African American Latino Asian
Adults* Total, All citizenship statuses 28.1% 32.0% 54.3% 20.4% Native citizen 28.2% 31.3% 34.4% 17.0% Non-citizen 29.5% 54.1% 69.6% 22.0% Children Total, All citizenship statuses 19.1% 18.3% 32.1% 11.1% Children in citizen family 19.4% 17.8% 16.5% 1.5% Mixed status children 10.8% 23.2% 30.2% 12.1% Non-citizen children 17.3% 36.2% 73.6% 21.6% Low-income is below 200% of poverty, which is $30,520 for a family of three in 2003. * Data about naturalized citizens not shown due to limited sample size Mixed Status means that the child is a citizen and at least one parent is not. Source: 1999 NSAF
22

Table A-3 Percentage of Low-Income Latino Adults and Children Who Are Uninsured,
by Language and Citizenship Status, 1999
Language Spoken
English Spanish
Ratio of Uninsured Spanish-
Speakers to English-Speakers
Latino Adults Total, All citizenship statuses 37.7% 65.7% 174.3% Native citizen 33.2% 40.9% 123.2% Naturalized citizen 41.1% 40.8% 99.3% Non-citizen 54.8% 71.8% 131.0% Latino Children Total, All citizenship statuses 20.6% 42.5% 206.3% Children in citizen families 15.5% 25.7% 165.8% Mixed status children 27.7% 31.1% 112.3% Non-citizen children* n/a 72.1% n/a
Low-income is below 200% of poverty, which is $30,520 for a family of three in 2003.Mixed Status means that the child is a citizen and at least one parent is not. * The sample size of low-income non-citizen children whose interview was conducted in English is too small for analysis. Source: 1999 NSAF
23

Table A-4. Percentage of Low-Income Adults and Children with Any Inpatient Hospitalization in the
Preceding 12 Months, by Race/Ethnicity and Citizenship Status, 1999
Percent Hospitalized:
White African
American Latino Asian
Adults* Total, All citizenship statuses 13.2% 17.0% 10.3% 6.3% Native citizen 13.2% 17.7% 13.8% 4.6% Non-citizen 9.8% 9.5% 7.9% 7.6% Children Total, All citizenship statuses 7.6% 7.8% 7.6% 2.6% Children in citizen family 7.7% 7.8% 11.9% 1.0% Mixed status children 8.3% 6.2% 6.5% 3.0% Non-citizen children 0.0% 9.2% 0.6% 3.2%
Low-income is below 200% of poverty, which is $30,520 for a family of three in 2003. * Data about naturalized citizens not shown due to limited sample size Mixed Status means that the child is a citizen and at least one parent is not. Source: 1999 NSAF
Table A-5.
Percentage of Low-Income Adults and Children Who Report Their Health Care Providers Listen and Explain, by Race/Ethnicity and Citizenship Status, 1999
White African American Hispanic Asian
Adults* Total, All citizenship statuses 72.9% 68.5% 54.3% 62.0% Native citizen 73.0% 69.6% 64.4% 64.2% Non-citizen 68.1% 57.0% 48.3% 67.2% Children Total, All citizenship statuses 78.8% 74.5% 64.0% 61.8% Children in citizen family 79.2% 75.7% 71.1% 66.2% Mixed status children 73.5% 65.0% 60.7% 57.8% Non-citizen children 57.8% 38.5% 57.2% 69.5% Low-income is below 200% of poverty, which is $30,520 for a family of three in 2003. * Data about naturalized citizens not shown due to limited sample size Mixed Status means that the child is a citizen and at least one parent is not. Source: 1999 NSAF
24

APPENDIX B
Are Insurance Premiums for Immigrants or Those with Limited English Proficiency Higher Than Their Medical Expenses?
This report, as well as earlier studies,41 show that immigrants and those with limited English proficiency are less likely to use medical care than native citizens and those who are fluent in English. This appears to be true even when people have insurance. It is likely that medical expenditures for immigrants and those who do not speak English are lower than their native counterparts, even when they are insured. For example, data from the 1996 Medical Expenditure Panel Survey found that the average annual per capita medical expenditures for Latinos ($1,221) or Asians ($1,038) were about half of those of whites ($2,281).42 (The survey does not have a variable about immigrant status, so it cannot be used to directly estimate medical expenditures for immigrants vs. non-immigrants.) However, factors like race, immigration status or English proficiency are not used in establishing the insurance premiums paid by consumers, employers and government programs. If there are disparities in medical expenditures among those who are insured, it is possible that insurance premiums for immigrants or those with limited English proficiency are substantially higher than the value of medical care they are actually receiving. If this is the case, insurance premiums for immigrants and people with poor English skills could be cross-subsidizing medical care expenditures for native citizens. The lack of interpretation and translation services may effectively keep immigrants and other people with limited English skills from using medical services for which they have paid. Health care providers often ask who should pay the costs of additional interpretation or translation services. The potential gap in medical expenditures suggests that insurance premiums paid on behalf of immigrants may already include enough money to pay for both medical and language services. If this is true, insurers have an obligation to reimburse providers for interpretation and translation services to help equalize the service gaps. The large gap that exists between average medical expenditures for Latinos and Asians and the overall average could be tapped to help pay for language services and to help increase access to care for those who are not English proficient.
25


V. REFERENCES 1. U.S. Commission on Civil Rights. The Health Care Challenge: Acknowledging Disparity, Confronting Discrimination and Ensuring Equality: Vol. I. The Role of Governmental and Private Health Care Programs and Initiatives (Washington, DC: US Commission on Civil Rights, 1999).
2. Brown, E.R., Ojeda, V., Wyn, R. and Levan, R. Racial and Ethnic Disparities in Access to Health Insurance and Health Care, UCLA Center for Health Policy Research and Henry J. Kaiser Foundation, April 2000.
3. Smedley, B., Stith, A., and Nelson, A., editors. Unequal Treatment: Confronting Racial and Ethnic Disparities in Health Care, Washington, DC: National Academy Press, 2002.
4. Quinn, K. Working without Benefits: The Health Insurance Crisis Facing Hispanic Americans (Cambridge, MA: Abt Associates, Inc., 2000).
5. Lillie-Blanton, M. and Hudman, J. Untangling the Web: Race/Ethnicity, Immigration and the Nation’s Health, American Journal of Public Health, 91(11): 1736-38, Nov. 2001.
6. Mills, R. Health Insurance Coverage: 2000, Report P60-215, Washington, DC: Bureau of the Census, Sept. 2001.
7. Brown, Ojeda, et al. op cit.
8. Ibid.
9. Collins, K., Hall, A., and Newhaus, C., U.S. Minority Health: A Chartbook, New York: Commonwealth Fund, 1999.
10. Kass, B., Weinick, R., and Monheit, A., Racial and Ethnic Differences in Health, 1996. MEPS Chartbook No. 2, Rockville, MD: Agency for Health Care Policy and Research, 1999.
11. Gaskin, D. and Hoffman, C., Racial and Ethnic Differences in Preventable Hospitalizations Across 10 States, Medical Care Research and Review, 57 Suppl 1: 85-107, 2000.
12. Hayward, R.A., Shapiro, M., Freeman, H. and Corey, C., Inequities in Health Services among Insured Americans. Do Working-age Adults Have less Access to Care than the Elderly? New England Journal of Medicine, 318(23):1507-12, June 9, 1988.
13. Guendelman, S. and Schwalbe, J., Medical Care Utilization by Hispanic Children. How Does it Differ from Black and White Peers? Medical Care, 24(10):925-40, Oct. 1986.
14. Louis Harris and Associates, National Comparative Survey of Minority Health Care, Commonwealth Fund, 1994.
15. Passel, J., personal communication, July 2003.
16. Ibid.
27

17. Fix, M. and Zimmermann, W. All Under One Roof: Mixed-Status Families in an Era of Reform, Washington, DC: Urban Institute, June 1999.
18. Brown, E.R., Wyn, R. and Ojeda, V., Access to Health Insurance and Health Care for Children in Immigrant Families, UCLA Center for Health Policy Research, Univ. of California, 1999.
19. Passel, J. and Zimmermann, W., Are Immigrants Leaving California? Settlement Patterns of Immigrants in the Late 1990s, Washington, DC: Urban Institute, April 2001.
20. Ku, L. and Matani, S., Left Out: Immigrants’ Access to Health Care and Insurance, Health Affairs, (Jan./Feb. 2001) 20(1):247-56.
21. Waidmann, T. and Rajan, S., Race and Ethnic Disparities in Health Care Access and Utilization: an Examination of State Variation. Med Care Res Rev. 2000;57 Suppl 1:55-84.
22. Schur, C. and Feldman, J. Running in Place: How Job Characteristics, Immigrant Status, and Family Structure Keep Hispanics Uninsured, New York City: Commonwealth Fund, May 2001.
23. Brown, Wyn and Ojeda, op cit.
24. Granados, G., et al., Health Care for Latino Children: Impact of Child and Parental Birthplace on Insurance Status and Access to Health Services, American Journal of Public Health, 91(11):1806-07, Nov. 2001.
25. Zimmermann, W. and Fix, M., Declining Immigrant Applications for Medi-Cal and Welfare Benefits in Los Angeles County. Urban Institute, July 1998
26. Capps, R., Ku, L., Fix, M, et al. How Are Immigrants Faring After Welfare Reform? Preliminary Evidence from Los Angeles and New York City. Washington, DC: Urban Institute, March 2002.
27. Perry, M., Kannel, S., Valdez, R., and Chang, C. Medicaid and Children: Overcoming Barriers to Enrollment: Findings from a National Survey, Washington, DC: Kaiser Commission on Medicaid and the Uninsured, January 2000.
28. Institute for Health Policy Studies, Barriers to Enrollment in Healthy Families and Medi-Cal: Findings from Focus Groups of Chinese, Korean and Vietnamese Parents, Dec. 2000.
29. Fiscella, K., Franks, P., Doescher, M.P., and Saver, B., Disparities in Health Care by Race, Ethnicity and Language Among the Insured: Findings from a National Sample, Medical Care, 40(1):52-9, Jan. 2002.
30. Wirthlin Worldwide, Hablamos Juntos - We Speak Together, Survey conducted for the Robert Wood Johnson Foundation, Dec. 12, 2001.
31. Flores, G, et al. Access Barriers to Health Care for Latino Children. Archive of Pediatric Adolescent Medicine. November 1998; 152 (11): 1119-1125.
28

32. Wirthlin, op cit.
33. Andrulis, D, Goodman, N. and Pryor, C. What a Difference an Interpreter Can Make: Health Care Experiences of Uninsured with Limited English Proficiency, Boston, MA: The Access Project, April 2002.
34. Ku, L. and Freilich, A., Caring for Immigrants: Health Care Safety Nets in Los Angeles, New York, Miami and Houston, Kaiser Commission on Medicaid and the Uninsured, Feb. 2001.
35. Safir, A., Scheuren, F., and Wang, K., National Survey of America’s Families: Survey Methods and Data Reliability, 1997 and 1999, Urban Institute, 1999. Available at http://newfederalism.urban.org/nsaf/survey-methods.html.
36. Ku and Matani, op cit., Waidmann and Rajan, op cit., Capps, R. Hardship among Children of Immigrants: Findings from the 1999 National Survey of America's Families, New Federalism Brief B-29, Urban Institute, Feb. 2001.
37. Gaskin and Hoffman, op cit.
38. Ku and Matani, op cit.
39. Youdelman, M. and Perkins, J. Providing Language Interpretation in Health Care Settings: Examples from the Field, Commonwealth Fund, May 2002.
40. Smedley, Stith and Nelson, op cit.
41. Ku and Matani, op cit., Waidmann and Rajan, op cit., Fisella, et al., op cit. 42. Machlin, S., Cohen, J., Zuvekas, S., et al., Health Care Expenses in a Community Population, 1996, MEPS Chartbook No. 5, Rockville, MD: Agency for Healthcare Research and Quality 2001.
29

T h e K a i s e r F a m i l y F o u n d a t i o n i s a n i n d e p e n d e n t n a t i o n a l h e a l t h c a r e p h i l a n t h r o p y d e d i c a t e d t op r o v i d i n g i n f o r m a t i o n a n d a n a l y s i s o n h e a l t h i s s u e s t o p o l i c y m a k e r s , t h e m e d i a , a n d t h e g e n e r a lp u b l i c . T h e F o u n d a t i o n i s n o t a s s o c i a t e d w i t h K a i s e r P e r m a n e n t e o r K a i s e r I n d u s t r i e s .

1 3 3 0 G S T R E E T N W , W A S H I N G T O N , D C 2 0 0 0 5
P H O N E : ( 2 0 2 ) 3 4 7 - 5 2 7 0 , F A X : ( 2 0 2 ) 3 4 7 - 5 2 7 4
W E B S I T E : W W W . K F F . O R G / K C M U
A d d i t i o n a l f r e e c o p i e s o f t h i s p u b l i c a t i o n ( # 4 1 3 2 ) a r e a v a i l a b l e o n t h e
K a i s e r F a m i l y F o u n d a t i o n ’ s w e b s i t e a t w w w . k f f . o r g , o r b y c a l l i n g t h e
F o u n d a t i o n ’ s P u b l i c a t i o n R e q u e s t L i n e a t ( 8 0 0 ) 6 5 6 - 4 5 3 3 .