How many cones? How many pills? How many lines of...
16
How many cones? How many pills? How many lines of coke? Estimating the size and value of Australia’s market for illegal drugs and its potential for taxation under a regulated market Dr John Jiggens
Transcript of How many cones? How many pills? How many lines of...
How many cones?
How many pills?
How many lines of coke?
Estimating the size and value of Australia’s
market for illegal drugs and its potential
for taxation under a regulated market
Dr John Jiggens
Foreword
A s a researcher into the illicit drug trade, I am intrigued by the
question of the size of Australia’s market in illicit drugs. Canna-
bis, it is said, is the biggest cash crop in Australia, but how can we
know how many tonnes of cannabis Australians inhale each year?
What is the size of Australia’s market for illicit drugs?
How much is our illicit drug trade worth?
What is the potential for taxing and regulating this industry?
We can gain some idea of how big Australia’s illicit drug trade is from the many re-
ports of drug seizures that regularly feature in our news broadcasts. In the seven
month period between October 2012 and April 2013, the ABC alone ran about 500
stories related to drugs and drug seizures. Reading these stories gives an indication of
the market’s size. For the sake of analysis, I categorised the biggest seizures as mon-
ster (value greater than $250 million street value); massive (seizures in the $50 mil-
lion to $250 million street value range); enormous ($10million to $50 million); and
big ($1 million to $10 million).
In the past nine months there were two monster seizure above the $250 million range.
On 30 July 2012, Customs and police found 558kg of illicit drugs valued at around
$500 million street value in a shipment of terracotta pots bound for Sydney: 306 kilo-
grams of crystal methamphetamine (ice) and 252 kilograms of heroin. This was our
third largest seizure of heroin and the largest seizure of ice in Australian history at
that time. This Australian record for ice did not last long. On 28 February, 2013, the
Australian black market achieved a new personal best, 585 kilos of ice, worth an esti-
mated $440 million dollars.
Commenting on this first monster seizure, Australian Federal Police (AFP) Deputy
Commissioner Andrew Colvin talked up the success of the AFP, “This operation fol-
lows the AFP’s most successful year in terms of drug seizures. In the 2011/12 finan-
cial year, the AFP and its partner agencies seized almost 14 tonnes of illicit substances
bound for drug distribution networks across Australia.” With drug seizures approach-
ing the two billion dollar mark, 2012/13 is shaping up to be another bumper year for
the AFP. But is the big picture really one of continuing police success, as Deputy
Commissioner Colvin spun the story, or one of a country swimming in illicit drugs?
Below these two monster busts were reports of five massive seizures valued in the
$50 million to $250 million range:$77m cocaine ring smashed: AFP, Foreign nation-
als arrested over $237m drug seizure, Trio charged over 50kg heroin drug bust, Joint
policing operation nets 200kg cocaine in shipwreck, along with the related story ,
Body on Tonga drugs yacht identified. As well as these, there was another massive
cocaine haul, 300 kilograms seized in Bundaberg in November 2012.
Dr John Jiggens, June 2013
Dr John Jiggens is a writer who has published several books including Marijuana
Australiana, The killer cop and the murder of Donald Mackay and Sir Joseph Banks and
the Question of Hemp. His academic works on Australian drug markets include The
Economic Costs of Drug Prohibition in Australia, Estimating the Size of the Australian
Heroin Market: A New Method, and Australian Heroin Seizures and the causes of the
2001 Australian Heroin Shortage, available from drjiggens.com.
How many cones? How many pills?
page 3
Australia’s biggest anti-cannabis operation was the
annual police helicopter raids on the NSW North
Coast, a lengthy eradication program that began in
the New England district in November and
wrapped up in the Coffs Harbour district in April,
having swept over the entire NSW north coast.
According to Drug Squad Commander, Superinten-
dent Nick Bingham, it yielded almost 14,000 can-
nabis plants, valued at $25 million. With more than
a hint of wishful thinking Bingham declared: "Our
aim is to disrupt the supply chain, to go and find
and pull as many plants as we can and get that can-
nabis off the street and hopefully either drive prices
up or keep prices stable and that will discourage
people, we hope, (from using) cannabis.”
As Bingham conceded, massive police operations
are needed simply to keep the price of drugs at
their present price. As cannabis activists have often
joked, the Drug Squad are the Price Maintenance
Squad for organised crime! But this is more than a
joke: this is the essence of Prohibition. Prohibition
acts as a multiplier for the black market. Every
dollar we spend on drug law enforcement is worth
$10 to the black market. Currently, Australia
spends about $1.5 billion on drug law enforcement:
this generates a black market worth approximately
$15 billion dollars for organised and disorganised
crime. It is the weight of police, courts and prisons
pushing down that drives up the price of illicit
drugs and makes them more valuable than gold.
Following the current record ice seizure in March
2013 about 350 heavily-armed police officers
raided 30 properties across Sydney, the Illawarra
and Port Stephens and 18 people were arrested.
New South Wales Police Commissioner Andrew
Scipione declared. "Today you have seen evidence
of the police at their very best. The one thing you
can take away clearly is, in terms of organised
crime, New South Wales police and the Crime
Commission have you people firmly in our sights.
We're not going away."
But neither are the drugs. Despite seizing close to
two billion dollars worth of illicit drugs so far this
year, all these massive police operations have had
no significant impact on the availability of illicit
drugs.
Four decades ago, when President Richard Nixon
launched the War on Drugs, free market econo-
mist, Milton Friedman, declared that the failure of
prohibition was inevitable because of corruption as
officials succumbed to the lure of easy money:
Said Friedman: “So long as large sums of money
are involved—and they are bound to be if drugs are
illegal—it is literally hopeless to expect to end the
traffic or even to reduce seriously its scope.” Sto-
ries like, Customs officers suspected in airport
smuggling ring, Customs corruption extends to
waterfront, SAS officer not fit to plead, Police
Commissioner's son breaches parole, Police officer
facing drug charges, demonstrated the accuracy of
his prediction.
For those who enjoy irony there was, Police take
heart in more reported drug offences, where Senior
Sergeant Marty Haime from Geraldton police ex-
plained a 30.6 per cent increase in drug offences in
the Gascoyne area as positive because it was show-
ing results that would yield a ‘generational change’
in ‘five to 10 years’. Said Sergeant Haime, “We'd
like to think we're changing behaviours as time
goes by."
However, the big drug story of the past year was
not about Australia. It was the success of the vote
for legalising cannabis in the US states of Colorado
and Washington. In 1976 The Australian inter-
viewed a group of Sydney 16-year-olds about how
they saw the future. To these 16-year olds, the le-
galisation of drugs was inevitable. A schoolboy
predicted, “The use of drugs will be so common it
will be legalised. This will be a great advantage
because it will no longer be a big business issue
with dealers becoming millionaires overnight.”
Another said, “I also think it should be legalised
because the more you say ‘don’t do this it’s bad’
the more the person’s going to do it.” Watching the
results of the legalisation vote in Washington and
Colorado in November 2012, were these former
teenagers (now in their fifties) about to see their
prediction vindicated?

How many cones? How many pills?
page 4
Estimated market size is 6.8 tonnes.
Estimated street value is $5 billion.
The cannabis market
Cannabis is Australia’s most popular illicit drug
with an estimated 2 million users.
About 250,000 Australians use cannabis daily.
70% of all illicit drug users are cannabis users.
70% of all illicit drug offences are for cannabis.
75% of drug seizures are for cannabis.
Market size is estimated to be between 150
tonnes and 300 tonnes of cannabis.
The value of the cannabis market is estimated
at $6 billion.
Depending on how you pack your cone , the
estimated market size equates to 2400 million
hits from the bong.
The heroin market
A revival of opium production in Southeast
Asia seems to be contributing to a revival of
Australia’s heroin market. Heroin seizures are
at decade-high levels.
Estimated size of the Australian heroin market
is two tonnes.
This equates to forty million hits.
The estimated street value is $2 billion.
Australia’s illicit drug trade
The Australian illicit drug trade consists of a
market of about three million Australians,
composed of a cannabis market of between
150-300 tonnes, worth about $6 billion, 2
tonnes of heroin ($2 billion), 4.7 tonnes of
cocaine ($2.5 billion), 40 million ecstasy
tablets ($1.4 billion), and 6.8 tonnes of
methamphetamine ($5 billion), giving an
estimated value of the Australian illicit drug
market of about $17 billion.
About 90,000 drug offences are prosecuted
each year in Australia while an estimated 2680
million drug offences are committed each year
(2400 million cones, 40 million pills, 40 million
hits, etc.) or about 1 prosecution per 30,000
offences; the cocaine rate is about one
prosecution for every 110,000 lines of coke.
The ecstasy market
Ecstasy is the second most commonly used
illicit drug in Australia after cannabis, used by
3% of the population over 14, or about
600,000 Australians.
In 2008, the United Nations Office on Drugs
and Crimes (UNODC) declared that Australia
had the highest annual prevalence of ecstasy
use in the world. However, the global MDMA
crisis intervened in 2009. Between 2007 and
2010, use of ecstasy declined from 3.5% to 3%
of the Australian population over 14.
Estimated market size 40 million pills in 2011.
Estimated market value $1,400 million.
The cocaine market
Of Australia’s big five illicit drug markets, the
cocaine market is expanding most rapidly.
Cocaine has grown in popularity at the
expense of ecstasy.
Seizures are on the increase. Cocaine
featured in four of the five massive seizures in
the final months of 2012, and 750 kilograms of
cocaine were seized.
There were an estimated 390 000 recent
cocaine users in Australia in 2010, but only
839 cocaine arrests, an arrest rate of 2.1
arrests per thousand users. The cannabis
arrests rate of 30.9 arrests per thousand users
was fifteen times higher.
Australia’s annual cocaine market is
approximately 4.7 tonnes.
Estimated market value $2.5 billion.
Market size equates to about 94 million lines
of coke.
The methamphetamine market
Methamphetamine use declined from 3.4% to
2.1% of the population over 14 between 2001
and 2010. However, methamphetamine
arrests recorded the most substantial increase
of all drug types, increasing by 62 per cent
over the same decade.
The past two years witnessed an extraordinary
succession of record-breaking meth seizures.
Estimated number of users is 390,000.
Australia's Illicit Drug Markets

How many cones? How many pills?
page 5
R egime of Prohibition (RoP) is a measure of how hard governments and police crack
down on drug users measured by the ratio of the number of drug offences per thousand drug users. Not all illicit drugs are prosecuted equally in Australia. If the illicit drugs were being policed in terms of their harmfulness (the potential for fatal overdoses and addiction) then cannabis, which is the least addictive, and which is never associated with fatal overdoses, should have the lowest relative Regime of Prohibition, followed by the amphetamine type stimulants, then cocaine and heroin. Instead, the war on drugs in Australia is a war on cannabis, the softest drug, while cocaine, a far more addictive drug, is almost decriminalised. The reason seems to be class: cocaine is the drug of choice of the highest socioeconomic groups and is rarely policed. Relative Regime of Prohibition compares the offences/1000 users of the various illicit drugs to cocaine’s Regime of Prohibition,
which was 2.1 offences per 1000 users in 2010. The main target of the War on Drugs in Australia is cannabis: 70% of all illicit drug offences are for cannabis. Among cannabis seizures, by far the biggest operation is the annual helicopter raids on the alternative communities on the NSW north coast. In the US, drug prohibition falls disproportionally on black Americans. Not so, it seems, in Australia. Aboriginal and Torres Strait Islander account for 26% of the total Australian prisoner population, an imprisonment rate 14 times more than the non-Indigenous rate. However, they constitute only 4% of the population imprisoned for illicit drugs. As well, they use cannabis and meth/amphetamines, the drugs most Australians get arrested for, at twice the national rate. In this regard, Australia’s drug laws are not racially discriminatory. Drug prosecutions in Australia seem to be about lifestyle and class, rather than colour.
What drugs do we prosecute most?
Drug offences (2010-2011)
users offences/1000 users
relative RoP
Cocaine 839 390,000 2.1 1.
Amphetamines 12,897 780,000 16.5 7.87
Cannabis 58,760 1,900,000 30.9 14.7
Heroin 2,551 50,000 51.0 24.2
All illicit 85,000 3,000,000 28.3 13.4
Drug law enforcement as a multiplier for the black market
W hen I was writing my paper “The economic costs of drug prohibition in Australia” I no-
ticed a curious relationship between the money we spend on drug law enforcement and the value of the cannabis black market: if you multiplied the cost of drug law enforcement by four you came very close to my estimate of the value of the can-nabis black market. This relationship was main-tained over a twenty-year period. I found this puz-zling. How could the money spent on drug law enforcement act as a multiplier for the cannabis market? Ultimately, I began to understand why. For traders in the illicit drugs market, the major cost is not production but the cost of drug law en-forcement. It is the combined weight of police, courts and prisons pressing down that creates the value of the market. A kilo of heroin can be bought in Burma for $2500; once you get it into Australia, it can wholesale for $250 000. The massive in-
crease in value is entirely due to the cost of drug law enforcement. It is through the mechanism of price that the money spent on drug prohibition acts as a multi-plier for the drug market. Pressing down hard on drugs does not make drugs less attractive, but it does make them more expensive. Cracking down on the trade causes a proportionate rise in price i.e. price varies with the Regime of Prohibition. As price goes up, so do profits, which mean larger sums are available for corrupting officials. Fried-man argued that, so long as large sums of money are involved, it is literally hopeless to expect to end the traffic or even to reduce seriously its scope. However, by pressing down, you increase price (price varies with the Regime of Prohibtion) and ensure that the value of the market increases, so the large sums of money gifted to criminals by governments become even larger.

How many cones? How many pills?
page 6
Costing drug law enforcement
W hat percentage of the money Australia
spends on the justice sector – prisons,
police, courts – is spent on drug law enforcement?
Considering prisons first: in 2010 of the 29,700
prisoners in Australian adult prisons, 3,233 were
there for illicit drug offences, which was 11% of
the prison population, so the cost of drug law
enforcement is assumed to include 11% of
corrective services costs, whose 2009-10 budget
was $2,807 million, giving a drug law enforcement
prison costs of $309 million.
Considering the courts: illicit drug offences
accounted for 2,785 (21%) of the 13,193
defendants proven guilty in Higher Courts in
Australia in 2009¬10. Of defendants adjudicated in
the Magistrates' Courts in 2009–10, traffic and
vehicle offences accounted for the greatest
proportion (44%); of the remaining 56% of
offences, 10.5% were for illicit drugs (6% overall).
The drug law enforcement cost would be 6% of the
cost of the Magistrates court and 21% of the cost of
the Higher Courts or 12.3% of the total spending of
$673 million on courts (criminal), which is $83 million.
We don’t know the percentage of police time and
resources devoted to illicit drugs, and you will not
find the percentage of the police time devoted to
drug law enforcement estimated in any police
report or by the ACC. Although the amount of
police time and resources spent on illicit drugs is
unknown, given that 11% of prison time and
resources, and 12% of court time and resources are
spent on illicit drugs, a 10% estimate for police is
in line with the time and resources allocated by the
other criminal justice sectors. Australia spent
$8235 million on police services in 2009-10, so the
drug law enforcement component of this would be
$824 million, making the Justice sector component
of drug law enforcement about $1.2 billion.
Australia spends another $1 billion on Customs.
Since services provided by the Australian Customs
Service (ACS) have a variety of simultaneous
services, the drug law enforcement component is
unknown, but considerable. A rounded figure of
$1.5 billion would be a reasonable estimate of the
cost of drug law enforcement in Australia. This
estimate does not include the capital costs involved
in building more prisons. Since the size of the
illicit drug market is estimated at about $17 billion,
the multiplier effect for drug law enforcement is
about ten to one. Every dollar spent on drug law
enforcement is worth ten dollars to the black market.
Regulating drugs
D rug prohibition is an inefficient form of taxa-
tion that gifts organised crime and disorgan-
ised crime with an illicit black market worth about
$17 billion. It costs $1.5 billion dollars to achieve
this, while drug regulation could potentially generat-
ing billions for the budget. Drug prohibition has
been a monumental social policy failure. We spend
one-and-a-half billion dollars, policing and prosecut-
ing eighty-five thousand drug offences, locking up
three thousand Australians under the delusionary
belief that we are keeping drugs off the street. In the
real world, Australia is swimming in a sea of drugs.
Instead of reducing drug use, prohibition has glam-
orised and promoted drug use.
Politicians were warned of the dangers of corruption
that would flow from drug prohibition, yet an ‘Ocker
Nostra,’ a corrupt milieu of police, customs officers
and criminals has been allowed to flourish, feeding
off a series of multi-billion dollar illicit industries,
which include cannabis, cocaine, amphetamines,
ecstasy and heroin. Together these five illicit drugs
were worth an estimated seventeen billion dollars in
2010, about 1% of GDP.
It is time to reconsider the financial benefits that
would flow from abandoning prohibition and regu-
lating and taxing the illicit drugs industry. The pur-
pose of this paper has been to cost drug law enforce-
ment in Australia and to estimate the size and value
How many cones? How many pills?
page 7
of the illicit drug markets that prohibition has cre-
ated in order to estimate the savings and the taxation
revenue that would be generated by a more sensible
and fair drugs policy.
By any sensible measure of drug harms, cannabis is
a soft drug, with little harm attached to its use, yet
cannabis bears most of the weight of the war on
drugs in Australia. However, polls show substantial
majority support for changing how it is regulated.
Were we to follow the Colorado example and regu-
late cannabis, it would shave one billion dollars from
drug law enforcement in Australia and give Austra-
lia a $6 billion industry to tax, potentially earning
$2.4 billion dollars.
It would also allow a new model for regulating illicit
drugs to be tested. In size, the illicit drug market is
comparable to the alcohol industry and could gener-
ate an equivalent amount in revenue. The Distilled
Spirits Industries Council of Australia in their pre-
budget submission (2013¬14) estimate that non-
GST Commonwealth revenue from alcohol taxation
in 2013¬14 as $1,900 million (customs duty),
$3,000 million (excise duty) and $774 million (wine
equalisation tax (WET)), yielding a total of $5,650
million. An additional $1, 900 million would be col-
lected from GST revenue from states and territories.
The Commonwealth would receive $7,600 million in
total from the regulation and taxation of alcohol in
2013-14. Since the markets are similar in size, regu-
lating all illicit drugs has the potential to generate a
similar amount for the Commonwealth.
Prohibition is a special kind of tax that falls unfairly
on Australia’s twenty-somethings and thirty-
somethings. It is a tax that discriminates against
people based on their choice of drugs: while alco-
hol, tobacco and cocaine are privileged, cannabis,
ecstasy and heroin users are targeted. It is a tax that
pointlessly kills, imprisons, and destroys careers.
A journey of a thousand miles begins with a small
step. Reregulating drugs will be a long journey, but
the most obvious drug to begin with is cannabis, the
least harmful drug, and the one that the War on
Drugs targets most. The obvious place to begin is
the township of Nimbin where, for over a decade,
the local community has petitioned the NSW gov-
ernment for permission to host a trial of cannabis
cafes in the town as a cure for the problems that
drug prohibition overwhelms its main street with.
With support from the local community, a cannabis
cafe trial in Nimbin is the ideal place to begin a
change in drugs policy in Australia.
How many cones? How many pills?
page 8
2013 looks certain to surpass this, and set a new
record. In 2010–11, a record 703 clandestine
laboratories (overwhelmingly for the production
of methamphetamines) were detected in Austra-
lia, but again the record lasted for only one year
and 809 clandestine laboratories were detected in
2012-2013, a year which also saw massive sei-
zures of precursor chemicals. Meanwhile, over
the past two years, record importations of
methamphetamine have followed at a bewildering
pace.
In his forward to the current Illicit Drug Data
Report, John Lawler CEO of the Australian
Crime Commission (ACC), put a positive spin on
the figures: “The IDDR is a statistical report that
provides a national picture of the illicit drug mar-
ket. Now in its tenth edition, the 2011–12 report
highlights the continued vigilance and success of
law enforcement in combating the illicit drug
trade with over 76,000 seizures and more than
93,000 illicit drug related arrests this reporting
period—both of which are the highest reported in
the last decade.” Drug seizures have never been
higher, more people are being arrested for illicit
drugs, so the ACC is still winning the war, Mr
Lawler concludes. Meanwhile, the streets have
never been more awash with drugs.
Like all commodities, the supply of illicit drugs
vary with market conditions, falling spectacularly
in droughts, rising steadily in floods, changing
with fashion. Under our ‘Tough on Drugs’ policy,
successive waves of drug floods have swept
across Australia. A marijuana drought in 1977
was accompanied by a heroin flood. When the
heroin bubble burst in 2001, ecstasy and metham-
phetamine filled the drug market vacuum. Austra-
lia’s ecstasy flood ended in 2009 amidst the
global MDMA crisis, caused by a shortage of its
precursor chemical, safrole oil; Australia now
finds itself in a rising flood of cocaine.
O ver the four decades of the War on Drugs a
number of government bureaucracies have
evolved to chart the extent of illicit drug use and to
record the casualties, in arrests and overdoses. Their
reports allow us to gain a clearer picture of the size
of Australia’s illicit drug market.
The Illicit Drug Data Report (IDDR), published by
the Australian Crime Commission (ACC), provides
a yearly snapshot of the Australian illicit drug mar-
ket, with information on price, purity, number of
arrests, and quantities seized. The Illicit Drug Data
Report 2010–11, reported that there were 84,738
illicit drug related arrests that financial year, the
second highest reported in the last decade. Over 9.3
tonnes of illicit drugs were seized nationally in 2010
–11, representing a 19 per cent increase from the 7.8
tonnes in 2009–10. The Illicit Drug Data Report
2011–12 reports that the quantity of drugs seized
increased again by 154% to 23.8 tonnes in the last
financial year. A single 11 tonne seizure of hypo-
phosphorous acid (used as a precursor in the manu-
facture of methamphetamine) contributed about half
this total. If we exclude this massive haul, seizures
would have still risen by about 50% to around 13
tonnes in 2011–12.
Cannabis remained the dominant illicit drug in Aus-
tralia in 2010–11 and 2011-12 in terms of arrests,
seizures and use, and the reported cannabis arrests in
these two years were the highest in the last decade.
The weight of heroin seized at the Australian border
increased by 241 per cent in 2010–11 and was the
highest recorded since 2001–02, though the current
financial year (2012-2013) is set to eclipse it. In-
deed, the current financial year plus the two previous
years will together constitute the three largest annual
seizures of heroin in the past decade. The weight of
national cocaine seizures increased by 67.7 per cent
in 2010–11 and was the third highest recorded in the
last decade; annual cocaine seizures increased again
in 2011-2012, becoming the highest in the past dec-
ade, though the amount of cocaine seized in 2012-
Part Two:
Estimating the size of illicit drug markets
How many cones? How many pills?
page 9
as the NDS Household Survey, to estimate the size
of the market from the estimated number of drugs
users. The formula used was yearly market size
equals number of users multiplied by average
amount used by a consumer in a year. However,
working out a figure for average yearly use is fraught
with controversy and can result in large errors.
My paper, Estimating the Size of the Australian Her-
oin Market: A New Method, (2006) proposed a
method of triangulating between consumption esti-
mates and seizure information to produce more ac-
curate measures than consumption models or seizure
methods alone. Using estimates of the number of
drugs users in Australia derived from the National
Drug Strategy Household Survey polls, I constructed
a model of the heroin market on consumption esti-
mates, which was then compared against the seizure
figures by dividing the amount seized in that year by
the estimated market size to estimate the percentage
of the market seized. If the model fell in the right
ballpark, the percentage-seized figure should vary
around the 10 percent figure estimated by police,
generally falling in the range between 2 and 18 per-
cent, which is the Goldilocks’ zone of my model.
Drought-causing seizures are indicated by seizure
levels well above the 2-18 per cent range: I expect a
25% per cent seizure result or greater should cause a
significant shortage, because over three months sup-
ply has been taken from the market. This should be
confirmed by rises in price and by user reports. If a
25% or greater seizure figure were calculated, yet
there was no evidence for a shortage, this would cast
doubt on the accuracy of the consumption model. So
a close reading of the table of percentage-seized
allows the modeller to analyse the market and to fine
-tune the estimations.
Seizure percentages approaching 100 per cent or
over only occur when an international drug smug-
gling ring is transhipping drugs to the US market via
Australia and one of their shipments is seized. Trans
-shipping drugs via Australia, rather than sending
them directly from Hong Kong or Thailand, which is
where the US Drug Enforcement Agency (DEA)
expect them to come from, is more prevalent than
Australian authorities admit. Gangs who have used
this technique include the associates of the Nugan
Hand Bank in the 1970s, and John Wesley Egan and
the Corset gang in the 1960s.
The National Drug Survey (NDS) Household Sur-
vey, a triennial survey of illicit drug use in Australia
conducted by the Australian Institute for Health and
Welfare (AIHW), reported in their most recent sur-
vey (2010) that recent ecstasy use declined from
3.5% to 3.0% of the Australian population over 14
between 2007 and 2010. Other findings were that
recent illicit drug use (use in the previous 12
months) rose from 13.4% of the population aged 14
and over in 2007 to 14.7% in 2010, despite the fall
in ecstasy use. The rise was mainly due to an in-
crease in the proportion of people who had used
cannabis (up from 9.1% to 10.3%), cocaine (1.6% to
2.1%), and hallucinogens (0.6% to 1.4%). These
drugs were perceived as being more easily available
or accessible in 2010 than in 2007.
The 2010 survey showed no significant change in
the use of meth/amphetamines (used by 2.1% of the
population over 14in the last 12 months) or heroin
(used by 0.2%in the last 12 months). Recent illicit
drug use was highest in the 20–29 year age group for
both males and females (30.5% and 24.3%, respec-
tively). Historically, all the surveys show that illicit
drug use is concentrated in the 20–29 year age
group. Since the 1970s, sex, drugs and rock’n’roll
have become institutionalised as part of the twenty-
something lifestyle in Australia.
Modelling drug markets
T he amount of drugs seized by customs and po-
lice is an important indicator of the size of
drugs market and various ways of estimating the size
of the drugs market using the figures from police
seizures developed. Of these, the earliest (and least
accurate) was the seizure method. Because the po-
lice often estimated they seized about 10 percent of
the market, the seizure method took the amount
seized by police in a year and multiplied it by ten to
estimate the market size. However, the 10 percent
figure is only an average. In reality, the seizure fig-
ures vary widely, causing estimates of market size
by the seizure method to vary widely also. This wide
variation in the seizure figures makes their analytical
use difficult because seizures go up and down, de-
pending on how lucky police and customs were in
intercepting large shipments in a particular year.
More consistent methods of estimating the size of
illicit drugs market (called consumption models)
were developed which used nation-wide polls, such
How many cones? How many pills?
page 10
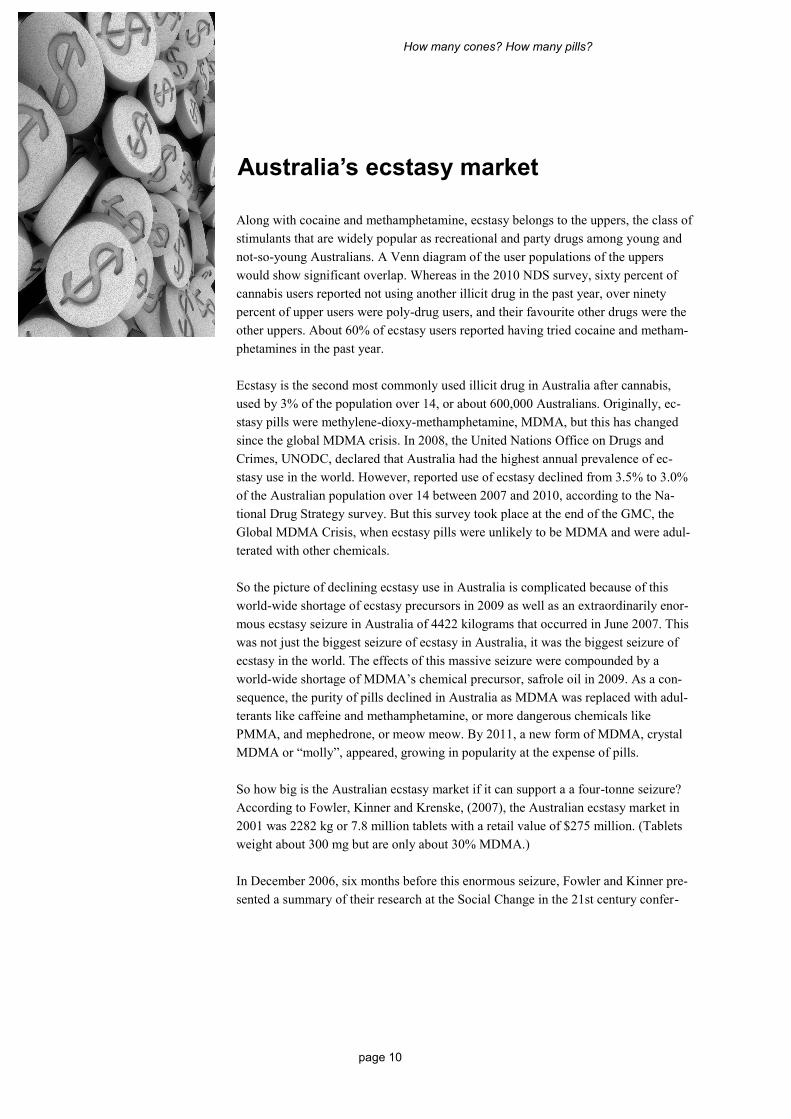
Along with cocaine and methamphetamine, ecstasy belongs to the uppers, the class of
stimulants that are widely popular as recreational and party drugs among young and
not-so-young Australians. A Venn diagram of the user populations of the uppers
would show significant overlap. Whereas in the 2010 NDS survey, sixty percent of
cannabis users reported not using another illicit drug in the past year, over ninety
percent of upper users were poly-drug users, and their favourite other drugs were the
other uppers. About 60% of ecstasy users reported having tried cocaine and metham-
phetamines in the past year.
Ecstasy is the second most commonly used illicit drug in Australia after cannabis,
used by 3% of the population over 14, or about 600,000 Australians. Originally, ec-
stasy pills were methylene-dioxy-methamphetamine, MDMA, but this has changed
since the global MDMA crisis. In 2008, the United Nations Office on Drugs and
Crimes, UNODC, declared that Australia had the highest annual prevalence of ec-
stasy use in the world. However, reported use of ecstasy declined from 3.5% to 3.0%
of the Australian population over 14 between 2007 and 2010, according to the Na-
tional Drug Strategy survey. But this survey took place at the end of the GMC, the
Global MDMA Crisis, when ecstasy pills were unlikely to be MDMA and were adul-
terated with other chemicals.
So the picture of declining ecstasy use in Australia is complicated because of this
world-wide shortage of ecstasy precursors in 2009 as well as an extraordinarily enor-
mous ecstasy seizure in Australia of 4422 kilograms that occurred in June 2007. This
was not just the biggest seizure of ecstasy in Australia, it was the biggest seizure of
ecstasy in the world. The effects of this massive seizure were compounded by a
world-wide shortage of MDMA’s chemical precursor, safrole oil in 2009. As a con-
sequence, the purity of pills declined in Australia as MDMA was replaced with adul-
terants like caffeine and methamphetamine, or more dangerous chemicals like
PMMA, and mephedrone, or meow meow. By 2011, a new form of MDMA, crystal
MDMA or “molly”, appeared, growing in popularity at the expense of pills.
So how big is the Australian ecstasy market if it can support a a four-tonne seizure?
According to Fowler, Kinner and Krenske, (2007), the Australian ecstasy market in
2001 was 2282 kg or 7.8 million tablets with a retail value of $275 million. (Tablets
weight about 300 mg but are only about 30% MDMA.)
In December 2006, six months before this enormous seizure, Fowler and Kinner pre-
sented a summary of their research at the Social Change in the 21st century confer-
Australia’s ecstasy market
How many cones? How many pills?
page 11
Forty per cent of the market represents five months
supply, so with seizure percentages at this level,
Australia should have experienced the mother of all
ecstasy droughts from 2002 onwards. Yet in this
period the ecstasy market was in flood, not drought,
rising to reach its high-water mark in 2007, accord-
ing to the NDS surveys. The years, 2002¬2007,
were the ecstasy boom when Australians were the
ecstasy champions of the world. After testing their
estimate against the seizure figures, my conclusion
is that Fowler et al. have underestimated the market
size by a factor of four. Based on this, the 2007 sei-
zure would still be about 40% of the market, big
enough to cause a considerable drought.
But did it? A year after the massive bust, in August
2008, Keith Moor commented in an article in the
Herald Sun, ‘Dying in ecstasy as drug use soars’,
that neither this seizure nor the previous world's
biggest ecstasy bust of 5 million pills in 2005, which
also occurred in Melbourne, had caused a drought.
He wrote: “the sad fact is that so many pills are get-
ting in undetected, or being made here, that neither
of the massive Melbourne busts caused an ecstasy
drought on the streets.” But maybe he just couldn’t
see what was happening: the pills were still there,
but the MDMA was gone.
By 2009, there was an MDMA drought in Australia.
While pills were still around, MDMA was now a
less common constituent, having been replaced with
adulterants like piperazine, caffeine and metham-
phetamine, and more dangerous chemicals like
PMMA and mephedrone, or meow meow. It was an
era of ersatz ecstasy, when experienced users bought
pill-testing kits and learned to consult pill-
testing.com; another pyrrhic victory in the War on
Drugs, which saw a contested drug (which users
were familiar with) replaced with potentially more
dangerous chemicals. This drought happened world-
wide, and is sometimes referred to as the GMC, or
the Global MDMA Crisis, so it can’t be attributed to
the 2007 bust, though the bust no doubt contributed
to making the MDMA drought worse in Australia
than elsewhere. A common explanation is that there
was a world-wide shortage of MDMA’s chemical
precursor, safrole oil, which came from a tree that
grew in the mountainous rainforests of Cambodia.
The Australian Federal Police added to the shortage
in 2010 by sending a team to Cambodia to buy up
ence at Carseldine in Brisbane. At the same session I
delivered a paper on estimating the size of the heroin
market. At the end of our session, I generously of-
fered to check their figures for them because I sus-
pected they might have underestimated the size of the
market. They declined. They explained that their
work had been commissioned by the Drug Law En-
forcement Research Fund and could not be released
until it was signed-off on by the board, which in-
cluded all the police commissioners in Australia.
This version of peer-review in the social sciences had
been instigated by the Howard government.
Eventually, around the time of the enormous seizure,
Fowler, Kinner and Krenske’s estimate of the size of
the Australian ecstasy market was signed-off on by
all the police commissioners in Australia, none of
whom were numerate enough to discern any problem
with a four-tonne seizure occurring in a market with
an estimated annual size of two tonnes. They were no
doubt too elated by the thought that they had just
seized 200% of the ecstasy market!
The method for testing consumption estimates I pre-
sented in my paper was this. You take a consumption
estimate, such as Fowler, Kinner and Krenske’s esti-
mate of an ecstasy market size of 2282 kg in 2001
and, using population estimates from the NDS sur-
veys of 2001, 2004 and 2007, you construct a model
of the market, which is then compared to the seizure
figures for these years by estimating the percentage
of the market seized. Under normal market condi-
tions the expectation is the percentage seized will fall
in the Goldilocks’ zone of 2-18%, averaging about 10%.
Using Fowler, Kinner and Krenske’s estimate of a
market size of 2282 kg in 2001, NDS estimates of
ecstasy use in 2001, 2004 and 2007, along with Aus-
tralian ecstasy seizure figures from the United Na-
tions Office on Drugs and Crime (UNODC), we get
this model:
Fowler’s estimate compared to seizures 2002-2007
Year market size amount seized % seized
2002 2500kg 722kg 29%;
2003 2700kg 1083kg 40%;
2004 2922kg 1334kg 45%;
2005 2962kg 1435kg 48%;
2006 3010kg 536kg 18%;
2007 3142kg 5234kg 166%.

How many cones? How many pills?
page 12
and burn 15 tonnes of safrole oil. Experienced Austra-
lian users lamented the decline in the quality of pills,
which began around 2009. Given this, the 14% de-
cline recorded in ecstasy use between 2007 and 2010
by the NDS poll was surprisingly small. The actual
decline in MDMA use was considerably greater.
An unknown factor in the estimation of the size of the
Australian ecstasy market is the question of whether
the 2007 seizure was a trans-shipment, and if it was,
what percentage of it was destined for the Australian
market? Even by the standards of monster Australian
seizures, the 2007 seizure was anomalously huge. It
was 36% of the estimated yearly supply of ecstasy for
Australia. In contrast, the largest heroin seizure, the
390 kilograms seized in Operation Linnet in 1998,
was 6% of the estimated yearly supply of heroin, and
the recent record ice seizure, Task Force Alistair’s
585 kilograms, was 8.6% of the estimated yearly
Australian consumption of methamphetamines of
6.8 tonnes. These were Australian records, but the
2007 seizure was a world record.
Given the transhipment questioned is not settled, I
am less certain of market size, but I will estimate
market size at about 40 million pills (of unknown
composition) in 2011. The 2011-2012 IDDR gave a
range for the price of a tablet of ecstasy in Australia
of between $20 and $60, but the $60 tablet was
bought in the Northern Territory, and $20 to $50 is
most of the range, giving an average of $35. Sold at
$35 each, our forty million pills give an estimated
market value for ecstasy and pseudo-ecstasy of
$1,400 million.
Australia’s cocaine market
8 per cent in 2009 to 13 per cent in 2010. Since co-
caine use rose by the same amount that ecstasy use
fell in the 2010 NDS survey, cocaine’s growth in
popularity came at the expense of ecstasy, which
was experiencing its global crisis.
Another reason for the increasing popularity of co-
caine may be that cocaine use seems almost decrimi-
nalised in Australia. In 2010 there were an estimated
390,000 recent cocaine users but only 839 cocaine
arrests, a rate of 2.1 arrests per thousand users; that
year there were an estimated 1, 900,000 cannabis
users and 58,760 cannabis arrests, a rate of 30.9 ar-
O f Australia’s big five illicit drug markets, the
cocaine market is the one expanding the most
rapidly. The percentage of Australians over 14 re-
porting recent use of cocaine on the NDS House-
hold survey increased 33% from 1.6% in 2007 to
2.1% in 2010. Seizures are increasing too: the aver-
age annual weight of cocaine seized between 2003
and 2006 was 207 kilos; the average annual weight
seized between 2007 and 2010 was 560 kilos. The
weight of cocaine detected in 2010-11 was 701.8kg;
while quantity seized in 2010-11 was 12% higher,
785.7kg. While the tally for 2012-13 is incomplete,
the expectation is that it will top the tonne. During
the last two financial years, Customs and their part-
ners achieved the third, fifth and sixth largest co-
caine seizures in Australian history. At the end of
this financial year, the Australian Crime Commis-
sion will have further tales of triumph.
Cocaine use in Australia expanded during the
MDMA drought. In a 2008 study of regular ecstasy
users, 48 per cent of respondents reported cocaine
as easy or very easy to obtain, while 47 per cent
reported it to be ‘difficult’ or ‘very difficult’ to ob-
tain. By 2010, 60 per cent of ecstasy users reported
cocaine as being easy to very easy to obtain. In the
2010 study of regular ecstasy users, 48 per cent of
respondents reported recent cocaine use, an increase
from 39 per cent in 2009. Respondents indicating
cocaine as their drug of choice also increased from
How many cones? How many pills?
page 13
rests per thousand, fifteen times higher than for co-
caine. The explanation for such extraordinary pref-
erential treatment has nothing to do with the relative
danger or addictiveness of the two drugs, since co-
caine is far more addictive and far more lethal than
cannabis, which never kills anybody. A large part of
the explanation seems to be class. Cocaine use in-
creases as you climb the socio-economic ladder:
people of the highest socioeconomic status are four
times more likely to use cocaine than people of the
lowest socioeconomic status, and those of the sec-
ond highest socioeconomic status are more than
twice as likely to use cocaine as those of the lowest
socioeconomic status; whereas cannabis is used
equally by all socioeconomic groups.
Four of the five massive seizures in the final months
of 2012 involved cocaine, and 750 kilograms of co-
caine were seized. In December, five men connected
with a seizure of 135 kilograms of cocaine were
arrested in Sydney. The drugs, thought to be worth
$77 million, were discovered in a shipment from
Chile. In November a Canadian and a US citizen
were arrested in connection with 350kg of illegal
drugs hidden inside a road roller which was shipped
from China to Port Botany. The haul was made up of
235kg of methamphetamines and 115kg of cocaine
with a combined street value of $237 million. The
week before, 200 kilos of cocaine valued at
$116 million was found aboard a yacht that washed
up on a deserted Pacific island, along with the body
of a man identified as a Slovak national.
There were an estimated 390,000 recent cocaine
users in Australia in 2010. My model of the Aus-
tralian cocaine market assumes an average annual
consumption of 12 grams of cocaine per user, mak-
ing the size of Australia’s annual cocaine market
approximately 4.7 tonnes. I have tested the 12
gram cocaine consumption model against the sei-
zure figures between 2002 and 2010, and it pro-
duced percentage-seized figures that all fell in the
Goldilocks’ zone, which is the test for accuracy for
consumption models. As we know, there are 50 mg
of cocaine in a line of coke, so this equates to about
94 million lines of cocaine.
Nationally, the price of a gram of cocaine in 2011-
2012 ranged between $250 and $500, while purity
ranged between 18% and 52%. Assuming an aver-
age price of $250 per gram of 50% purity, this
equates to an estimated market value of about $2.5
billion.
Australia’s methamphetamine market
T he amphetamines are a family of chemicals,
which includes amphetamine, methampheta-
mine and dexamphetamine, among others, known
colloquially as 'speed', 'whip', 'louie', 'ice', 'crystal', or
'shard'. Methamphetamine is the current fashionable
form of speed and most of the amphetamine-type
drugs consumed in Australia is methamphetamine.
Ecstasy’s chemical name is methylene-dioxy-
methamphetamine (MDMA) so the drugs are chemi-
cally similar, but whereas ‘speed’, ‘goey’, or ‘Lou
Reed’ (rhyming slang) is associated with outlaw mo-
tor cycle gangs, ‘eccies’ are an empathogen, the ‘love
drug’ of raves, and are perceived by the market to be
very different.
According to the NDS polls, use of amphetamine-
type stimulants , (ATS) declined between 2001 and
2010 from 3.4% to 2.1% of the population over 14.
However, over the same period, arrests for ampheta-
mine-type drugs increased by 62%. The police have
been paying increased attention to the ampheta-
mine-type stimulants over the past decade, culmi-
nating in the large ‘guns and drugs’ police opera-
tion, Strike Force Alistair, which saw hundreds of
police involved in raids on bikie gangs in March
2013. This was described by the NSW Police Com-
missioner as the climax of an operation that has
been ongoing for twenty-one months.
Because ecstasy and methamphetamine arrests are
still combined in one figure as ATS arrests, we can
measure the differing arrest-rates per thousand us-
ers of these two stimulants, and compare it to co-
caine, which is a very similar drug. About 4.2 % of
the population over 14 were estimated to use either
ecstasy or methamphetamines in 2010 and cocaine
users were estimated at about 2.1%. Yet there were
12,897 ATS arrests and only 839 cocaine arrests in
2010–11, an ATS arrest-rate 7.5 times higher than
cocaine. The uppers are similar drugs that have
How many cones? How many pills?
page 14
similar potential for addiction and abuse, yet cocaine is
treated with extraordinary leniency in comparison to
the others. Like cocaine, amphetamine-type stimulants
are uppers, but unlike cocaine, use declines as you
climb the socioeconomic ladder. They are the poor per-
son’s cocaine, the downmarket upper, and their use is
associated with outlaw motorcycle gangs rather than
lawyers.
There were a raft of stories, which associated outlaw
motorcycle gangs and ice (methamphetamines). Social
scientists use the concepts of ‘folk devils’ and ‘moral
panics’, and outlaw motor cycle gangs (OMCG) make
ideal folk devils and ice is perfect for the role of agent
of moral panic, as stories like 'Ice' implicated in crime
spike, and Figures show alarming increase in ampheta-
mine use showed. The police respond to the moral pan-
ics and exploit the public relations opportunities they
provide, as NSW Police Commissioner Scipione dem-
onstrated after the Strike Force Alistair raids.
Contradicting the perceived decline in methampheta-
mine use, the past two years have seen a continuing
series of record-breaking seizures of methampheta-
mines. On 4 May 2011, the AFP conducted the largest
meth bust in Australian history ever (till then). Report-
ing for TEN news, Matt Doran exhausted his superla-
tives describing how this massive bust had delivered ‘a
monster blow to those who organise the traffic in
deadly and illegal drugs’. It was an extraordinary 240
kilograms of ice with a street value in excess of S50M,
the biggest bust in Australian history, he said, and had
‘dealt a major, major blow to organised crime in Aus-
tralia’. However, it took only fourteen months for the
methamphetamine black market to establish a new per-
sonal best. In July 2012 Australia saw a new record
haul of 306 kilograms of methamphetamine, which was
followed by another large haul of 237 kilograms in
November, 2012. A new, new record of 585 kilograms
of methamphetamine was discovered in February 2013.
In the financial year 2012/2013, over a tonne of
methamphetamine, 1128 kilos, were seized in these
three massive hauls alone. 2012-2013 has already seen
the biggest, the second biggest and the fourth biggest
methamphetamine seizures in Australian history.
The frequency and size of these seizures poses the
question: are these large seizures evidence of a signifi-
cant increase in amphetamine use in Australia over the
past two years? However, the large seizures over the
past two year may be because more methamphetamine
is being seized at the border because more is being
imported. Previously, amphetamine-type stimulants
were largely manufactured in Australia. In their
2012 annual report, the International Narcotics Con-
trol Board suggested that the recent crackdown on
precursor chemicals in Australia caused the price of
amphetamine-type stimulants to rise, which has in
turn attracted the attention of foreign traffickers,
seeking to take advantage of the potential for profits.
By increasing price, the police crackdown on home-
bake and precursors has shifted the balance of the
methamphetamine market toward importation, and
this seems to be the reason for the recent record sei-
zures, rather than a massive increase in market size
for methamphetamine in Australia. Although the
2010 NDS survey figures indicated that metham-
phetamine use was declining, our rate of use was
still among the highest in the world. Since the Aus-
tralian price for methamphetamine remains high by
world standards, any shortage caused by local law
enforcement will only drive prices higher. Investors
in the amphetamine industry, like the Mexican car-
tels, the Southeast Asian triads, and the outlaw mo-
tor cycle gangs of Canada and the US, will continue
to find the Australian meth market attractive.
There are two models of the Australian meth/
amphetamine market that I am aware of. The Austra-
lian Bureau of Statistics have a group who are at-
tempting to model the Australian illicit drug market,
who are working on this question, though they are
using consumption models and do not check their
estimates against the seizure figures, which can lead
to wildly inaccurate estimates. However, the model
contained in the Families and Friends for Drug Law
Reform submission on methamphetamine to the
ACT parliament compared its estimates of market
size to the seizure figures and obtained percentage-
seized figures that fell in the Goldilocks zone, which
is the test I employ for accuracy. This model gives
an estimated market size of 6.8 tonnes in 2010.
Purity and price of methamphetamine in Australia
ranged widely according to the IDDR 2011-2012:
price per gram ranged between $300 to $1000
(excluding the Northern Territory where it ranged
between $1000-$2000 per gram); while purity
ranged between 1% and 70%. Assuming a gram of
40% purity and a price of $300 per gram, the esti-
mated street value of the annual Australian metham-
phetamine market was $5 billion.
How many cones? How many pills?
page 15
I t is sometimes claimed that marijuana is the larg-
est agricultural cash crop in Australia. With an
estimated street value of around $6 billion, drug can-
nabis may be Australia’s most valuable vegetable.
However, in comparison with the size of the market,
most cannabis seizures are relatively small. In the
seven months between October 2012 and April 2013,
there were only two seizures in the $10-$50 million
dollar range and eleven in the $1-$10 million dollar
range. The largest seizure was the annual helicopter
raids on the NSW north coast, which seized almost
14,000 plants between November 2012 and April
2013. However, this was not one single raid but a
large number of small seizures in raids that targeted
the alternative communities of northern NSW over a
six-month period. The second largest (and the largest
single seizure) was 6000 plants seized at a vineyard
in Wangaratta in Victoria’s north-east. There are Mr
Bigs in the cannabis trade but there are far more Mr
and Ms Smalls. The absence of monster seizures and
the number of mid-range seizures shows that the can-
nabis market is more decentralised than the other
illicit drug markets. Since the motivation for canna-
bis growers is often self-sufficiency, and because
manufacture is easy (you simply grow a plant and dry
its flowers) there are a large number of small mari-
juana growers, possibly as many as 100 000.
While this estimate may seem high, such a figure is
not improbable. Of the 60,000 cannabis offences
prosecuted in Australia in 2011-2012, 10,000 were
for ‘providers’ and 50,000 were for ‘consumers’. The
cannabis market has a user population of about two
million, according to the National Drug Strategy
2010 survey, which found that 10.3% of the popula-
tion over 14 reported recent use of cannabis. About
250,000 Australians use cannabis daily. It remains
the dominant illicit drug in Australia in usage (70%
of all illicit drug users are cannabis users), arrests
(70% of all illicit drug offences are for cannabis) and
seizures (75% of drug seizures are for cannabis).
The war on drugs in Australia began as a war on can-
nabis and, four decades later, it remains largely a war
on cannabis. Were cannabis to become legal in Aus-
tralia as it has in Colorado and Washington, we
would save this, and have a legal cannabis market,
Australia’s cannabis market
to be taxed at luxury levels, via the proposed GST, or
Ganga Smokers Tax. The earnings of such a GST
would generate considerable income.
There are several consumption models of the Austra-
lian cannabis market in the academic literature: the
model I published in “The economic costs of drug
prohibition in Australia” (2005) ; Clement and
Daryal’s model published in “The economics of can-
nabis consumption” (1999); and the Australian Bu-
reau of Statistics have produced a preliminary esti-
mate. Clement and Daryal use figures for average
annual consumption of cannabis that are twice the
figure I use, so their estimations are twice the size of
mine. My model estimates a cannabis market size of
150 tonnes in 2010, so Clement and Daryal’s model
would estimate a market size double that, around 300
tonnes. In the case of cannabis, the seizure figures
cannot be used to refine these estimates.
The problem with using seizure figures to estimate the
size of the cannabis market is that the seizure figures
for cannabis are given in two differing units, in
ounces of cannabis seized and in the number of plants
seized: you would need to convert the thousands of
plants seized per year into an equivalent figure in
ounces of cannabis to do the necessary calculations to
triangulate between the seizure information and con-
sumption estimates. The guesswork involved in such
a conversion is as fraught with uncertainty as the
guesswork involved in choosing a figure for average
yearly use of cannabis.
The size of the cannabis market in Australia is esti-
mated at between 150 tonnes and 300 tonnes of can-
nabis so, depending on how you pack your cone, this
equates to 2400 million hits from the bong. If we use
a street value of $20 per gram for cannabis, then the
estimated value of the cannabis market would be be-
tween $3 billion to $6 billion. The estimates of the
Australian Bureau of Statistics give a range for the
marijuana market at between $5 billion and $7 billion.
The street value of the cannabis market is the most
difficult to determine, though the differing estimates
suggest $6 billion would be a consensus figure. If it
were taxed at the rate of alcohol, a Ganga Smokers
Tax would potentially garner annual earnings of ap-
proximately $2400 million dollars.

How many cones? How many pills?
page 16
Australia’s heroin market
Australia’s heroin plague began during the Vietnam
War years and was supplied by US soldiers who flew
into Sydney on rest and recreation leave (‘R and R’)
from Vietnam. During the Vietnam War, 70% of world
heroin came from the Golden Triangle region of South-
east Asia. When the Vietnam War ended and the vari-
ous Afghan wars started, Afghanistan replaced South-
east Asia as the centre of the heroin trade. However,
Australia’s heroin market continued to rely on South-
east Asia for its supplies because of tourism and family
connections. The 1990s were the boom decade for her-
oin in Australia. In 1999, the National Crime Authority
estimated the size of the Australian heroin market at 6.7
tonnes. This was the peak of the Australian heroin bub-
ble. However, heroin production in Southeast Asia was
declining throughout these years as Afghani production
rose to dominate the world opium trade.
The heroin bubble burst in a spectacular drought in
2001 and for most of the following decade, opium pro-
duction in Southeast Asia remained tiny, limiting her-
oin supply to Australia. However, in the last few years,
opium production in Burma and Laos has revived,
though Afghanistan is still producing 85% of world
opium. The revival of opium production in Southeast
Asia seems to be contributing to a revival of Australia’s
heroin market.
Heroin has the highest regime of prohibition of all the
illicit drugs. In 2010 there were an estimated 50,000
heroin users and 2,551 heroin offences prosecuted
(more than half of these in Victoria), a rate of 51 of-
fences per thousand users, twenty-four times greater
than cocaine’s rate of 2.1 offences per thousand users.
The weight of national heroin seizures in 2010-11 was
the highest recorded since 2002–03, increasing fivefold
from 74.7 kilograms in 2009–10 to 375.7 kilograms in
2010–11, according to the Illicit Drug Data Report of
2010–11. Significant border detections of heroin in
2010–11 included: 168.5 kilograms of heroin detected
in a consignment from Malaysia to Sydney in October
2010; 42 kilograms of heroin detected in another con-
signment from Malaysia to Sydney; 25 kilograms of
heroin detected in a consignment from Pakistan to Syd-
ney; and 14.5 kilograms of heroin detected on in parcel
post from Cambodia to Sydney. Despite Afghani domi-
nance of the world heroin trade, only one of these ship-
ments came from Pakistan (25 kilograms), while the
rest (225 kilograms) came from Southeast Asia.
The weight of heroin seized in 2011-12 fell, but
was still over 250 kilos. The biggest border detec-
tion that year was 97.7 kilograms of heroin de-
tected in sea cargo that came from Afghanistan,
concealed in food items. This was the biggest ever
Australian seizure of heroin from Afghanistan.
Heroin seizures for 2012–13 are already well over
the 300 kilogram level as a result of a large seizure
of 252 kilograms in July 2012, which was the third
largest ever. Seizures for 2012–13 may yet surpass
2010–11, more good news for the ACC to report
next year. It will mean that the past three years
will have been the three most successful years for
heroin seizures in the past decade.
Using the model described in Estimating the size
of the Australian heroin market: A new method
(2006), I estimate the size of the Australian heroin
market in 2010 at two tonnes, or about forty mil-
lion hits. Price for heroin in 2011-12 ranged be-
tween $200 to $1000 per gram, which can be at-
tributed to Western Australia, where price ranged
between $500 and $1000 per gram. Purity was
higher in Western Australia, however, around
50%, as opposed to 20% purity in the rest of the
country. Assuming a price of $200 per gram with
purity of 20%, the estimated street value of the
heroin market is $2 billion.
The Australian illicit drug trade consists of a mar-
ket of about three million Australians, composed
of a cannabis market of between 150-300 tonnes,
2 tonnes of heroin, 4.7 tonnes of cocaine, 40 mil-
lion ecstasy tablets, and 6.8 tonnes of meth/
amphetamine (speed), giving an estimated value
of the Australian illicit drug market of $17 billion.