How Large Are Global Energy Subsidies?
42
WP/15/105 How Large Are Global Energy Subsidies? by David Coady, Ian Parry, Louis Sears, and Baoping Shang
-
Upload
mauro-bassotti -
Category
Economy & Finance
-
view
140 -
download
2
Transcript of How Large Are Global Energy Subsidies?
WP/15/105
How Large Are Global Energy Subsidies?
by David Coady, Ian Parry, Louis Sears, and Baoping Shang
© 2015 International Monetary Fund WP/15/105
IMF Working Paper
Fiscal Affairs Department
How Large Are Global Energy Subsidies?
Prepared by David Coady, Ian Parry, Louis Sears, and Baoping Shang1
May 2015
Abstract
This paper provides a comprehensive, updated picture of energy subsidies at the global and regional levels. It focuses on the broad notion of post-tax energy subsidies, which arise when consumer prices are below supply costs plus a tax to reflect environmental damage and an additional tax applied to all consumption goods to raise government revenues. Post-tax energy subsidies are dramatically higher than previously estimated and are projected to remain high. These subsidies primarily reflect underpricing from a domestic (rather than global) perspective, so that unilateral price reform is in countries’ own interests. The potential fiscal, environmental, and welfare impacts of energy subsidy reform are substantial.
JEL Classification Numbers: Q31; Q35; Q38
Keywords: energy subsidies; efficient taxation; deadweight loss; revenue; environment
Authors’ E-Mail Addresses: [email protected], [email protected], [email protected], [email protected]
1 The paper has benefitted from comments from Vitor Gaspar, Michael Keen, and Sanjeev Gupta as well as from numerous colleagues.
IMF Working Papers describe research in progress by the author(s) and are published to elicit comments and to encourage debate. The views expressed in IMF Working Papers are those of the author(s) and do not necessarily represent the views of the IMF, its Executive Board, or IMF management.

3
Contents Page
Abstract ......................................................................................................................................2
I. Introduction ............................................................................................................................5
II. Conceptual Framework .........................................................................................................8 A. Efficient Energy Prices .............................................................................................8 B. Defining Energy Subsidies ......................................................................................11 C. Reform Impact.........................................................................................................12
III. Data and Estimation ...........................................................................................................14
IV. Results................................................................................................................................17 A. Energy Subsidies: The Global Picture ....................................................................18 B. The Benefits of Subsidy Reform .............................................................................23 C. Sensitivity Analysis .................................................................................................27
V. Conclusions .........................................................................................................................30 Table 1. Sensitivity Analysis .............................................................................................................29 Figures 1. Consumer Energy Subsides .................................................................................................11 2. Fiscal and Welfare Gains from Subsidy Reform .................................................................12 3. Fiscal and Welfare Gains with Adoption of Emissions Control Technologies ...................13 4. Global Energy Subsidies, 2011–2015 ..................................................................................18 5. Global Energy Subsidies by Energy Product, 2011–2015 ...................................................20 6. Global Post-Tax Subsidies by Product and Subsidy Component, 2013 ..............................22 7. Energy Subsidies by Region and Subsidy Component, 2013 ..............................................22 8. Energy Subsidies by Region and Energy Product, 2013 .....................................................23 9. Fiscal Gain from Removing Energy Subsidies, 2013 ..........................................................24 10. Energy Subsidy Reform and Energy Consumption, 2013 .................................................26 11. Environment Gain from Removing Energy Subsidies, 2013.............................................26 12. Welfare Gain from Removing Energy Subsidies, 2013.....................................................28 Boxes 1. Design of Efficient Taxes to Address Energy Externalities ................................................10 2. Reconciliation With Previous Estimates of Post-Tax Subsidies ..........................................19 Appendices 1. Existing Estimates of Energy Subsidies ..............................................................................32 2. Regional Classification of Countries ...................................................................................33 3. Data Sources ........................................................................................................................34 4. Additional Results ................................................................................................................38

4
Appendix Tables 1. Regional Classification of Countries ...................................................................................33 2. Data Sources: Year and Country Coverage .........................................................................34 3. Breakdown of Post-Tax Subsidies by Energy Type and Externalities ................................38 References ................................................................................................................................39

5
I. INTRODUCTION
The issue of energy subsidy reform remains high on the international policy agenda, reflecting the need for countries to pledge carbon reductions ahead of the Paris 2015 United Nations Climate Change Conference, the opportunities for reform created by low energy prices, and continuing fiscal pressures in many countries. The sustained interest in energy subsidy reform also reflects increasing recognition of the perverse environmental, fiscal, macroeconomic, and social consequences of energy subsidies:2
Energy subsidies damage the environment, causing more premature deaths through local air pollution, exacerbating congestion and other adverse side effects of vehicle use, and increasing atmospheric greenhouse gas concentrations.
Energy subsidies impose large fiscal costs, which need to be financed by some combination of higher public debt, higher tax burdens, and crowding out of potentially productive public spending (for example, on health, education, and infrastructure), all of which can be a drag on economic growth.
Energy subsidies discourage needed investments in energy efficiency, renewables, and energy infrastructure, and increase the vulnerability of countries to volatile international energy prices.
Energy subsidies are a highly inefficient way to provide support to low-income households since most of the benefits from energy subsidies are typically captured by rich households.
Understanding the current magnitude of energy subsidies is critical for advancing energy subsidy reform because it highlights the potential environmental, health, fiscal, and economic benefits to be realized with reform (Bárány and Grigonytė 2015; Clements and others 2013; Clements and others 2014). Existing estimates of subsidies, however, vary substantially, reflecting a range of factors (see Appendix 1 for a discussion of existing estimates).
A key factor in estimating the magnitude of current subsidies is which definition of “subsidies” is used. Pre-tax consumer subsidies arise when the price paid by consumers (that is, firms and households) is below the cost of supplying energy. Post-tax consumer subsidies arise when the price paid by consumers is below the supply cost of energy plus an
2 For further discussions on these impacts, see, for example, Kumar and Woo (2010); Escribano, Guasch, and Pena (2008); Heggie and Vickers (1998); Clements, Jung, and Gupta (2007); Fofana, Chitiga, and Mabugu (2009); Lofgren (1995); Breisinger, Engelke, and Ecker (2011); von Moltke, McKee, and Morgan (2004); UNEP (2008); Burniaux and others (2009); Ellis (2010); Gelb and others (1998); Parry and Small (2005); Arze del Granado, Coady, and Gillingham (2012); and Di Bella and others (2015).

6
appropriate “Pigouvian” (or “corrective”) tax that reflects the environmental damage associated with energy consumption and an additional consumption tax that should be applied to all consumption goods for raising revenues. Post-tax consumer subsidies are typically much higher than pre-tax consumer subsidies, primarily due to the large environmental cost of energy consumption (IEA 2014; Clements and others 2013; Clements and others 2014; Parry and others 2014). Some studies also include producer subsidies, which reflect the net subsidy given to energy producers (for example, through access to subsidized inputs, preferential tax treatment, or direct budget transfers) although these are typically much smaller than consumer subsidies (OECD 2013).
This paper provides a comprehensive, updated picture of energy subsidies at the global and regional levels. The first attempt at this was Clements and others (2013), which provided estimates of global and regional pre- and post-tax subsidies for 2011, but was based on the very limited country-level data available at the time on the environmental damage caused by energy consumption.3 A key finding of the study was that global post-tax subsidies at $2 trillion were substantially bigger than pre-tax subsidies of $492 billion and mainly reflected undercharging for the environmental damage associated with energy consumption. Another was that subsidies were spread across both advanced and developing countries. Parry and others (2014) developed more refined estimates of the environmental costs by energy product for more than 150 countries.4 This paper uses these to provide updated estimates of post-tax subsidies for 2013 and projections for 2015. The paper also estimates the fiscal, environmental, and net welfare gains5 from eliminating these energy subsidies.
The key findings of the study are the following:
Post-tax energy subsidies are dramatically higher than previously estimated—$4.9 trillion (6.5 percent of global GDP) in 2013, and projected to reach $5.3 trillion (6.5 percent of global GDP) in 2015.
Post-tax subsidies are large and pervasive in both advanced and developing economies and among oil-producing and non-oil-producing countries alike. But these subsidies are especially large (about 13–18 percent) relative to GDP in Emerging and Developing
3 In Clements and others (2013), pre-tax subsidies refer to the sum of pre-tax consumer subsidies and producer subsidies, and post-tax subsidies refer to the sum of post-tax consumer subsidies and producer subsidies.
4 Parry and others (2014) provide a framework for determining environmental costs based on key parameters (for example, carbon damages, emission rates, population exposure to pollution, the value of health risks and travel time), which accommodates different views on (sometimes contentious) parameters and allows for updating as evidence and data evolve.
5 The net welfare gain from energy subsidy reform is calculated as the benefits from lower environmental damage and higher revenues minus the losses due to consumers facing higher energy prices.

7
Asia, the Middle East, North Africa, and Pakistan (MENAP), and the Commonwealth of Independent States (CIS). 6
Among different energy products, coal accounts for the biggest subsidies, given its high environmental damage and because (unlike for road fuels) no country imposes meaningful excises on its consumption.
Most energy subsidies arise from the failure to adequately charge for the cost of domestic environmental damage—only about one-quarter of the total is from climate change—so unilateral reform of energy subsidies is mostly in countries’ own interests, although global coordination could strengthen such efforts.
The fiscal, environmental, and welfare impacts of energy subsidy reform are potentially enormous. Eliminating post-tax subsidies in 2015 could raise government revenue by $2.9 trillion (3.6 percent of global GDP), cut global CO2 emissions by more than 20 percent, and cut pre-mature air pollution deaths by more than half. After allowing for the higher energy costs faced by consumers, this action would raise global economic welfare by $1.8 trillion (2.2 percent of global GDP).
These findings must be viewed with caution. Most important, there are many uncertainties and controversies involved in measuring environmental damages in different countries—our estimates are based on plausible—but debatable—assumptions.7 The estimates of the environmental, fiscal, and welfare impacts from eliminating energy subsidies are based on a partial equilibrium analysis: demand responses are based on long-run estimates of own-price demand elasticities for energy products thus abstracting from transitional dynamics and cross-price effects among fuels, and there is an implicit assumption that supply prices do not adjust in response to demand changes. Linkages with the broader fiscal and macroeconomic system are also ignored. For example, using the fiscal dividend from energy subsidy reform to lower distortionary taxes or increase productive public spending could generate further substantial improvements in welfare and economic growth. However, while there is ample scope for refining the estimates of energy subsidies and reform impacts or for undertaking further sensitivity analysis, the key findings of the paper are clear: energy subsidies are very large; their removal would generate very substantial environmental, revenue, and welfare gains; and their reform should begin immediately, albeit gradually, given the uncertainty over the precise level of energy taxes required.
Section II of the paper provides a simple analytical framework to evaluate energy subsidies and the fiscal, environmental, and welfare impacts of their reform. Section III documents
6 See Appendix Table 1 for regional country classification.
7 See Parry and others (2014) for a more detailed discussion of these issues.
8
data sources, estimation methodologies, and other underlying assumptions. Section IV presents the main quantitative findings, compares them with the existing literature, and undertakes sensitivity analysis to evaluate their robustness. Section V elaborates on policy implications.
II. CONCEPTUAL FRAMEWORK
A. Efficient Energy Prices
Efficient energy prices are central to the definition of energy subsidies. The efficient consumer price for an energy product (for example, gasoline or coal) consists of three components: the cost of supplying the product to the consumer (or opportunity cost), a “Pigouvian” (or “corrective”) tax reflecting the environmental costs (or externalities) associated with energy consumption, and (less important) a consumption tax reflecting the need to tax all consumption to raise revenue. The efficient producer price for an energy supplier is simply the supply cost since efficient taxation requires that only final consumption by households is taxed.
Supply cost
The supply cost is the opportunity cost to a country of supplying the energy product to consumers (that is, firms and households). For internationally tradable products, such as petroleum products, the supply cost is the international price of the product adjusted for transport and distribution costs. For goods that are not internationally traded (“non-traded”), the supply cost is the domestic cost of production (“cost-recovery price”), with costs evaluated at efficient prices. For example, if electricity is produced using natural gas purchased at a price below its export price, then the efficient cost-recovery price should be based on the export price of natural gas.
Pigouvian taxation
When the consumption of a good by a firm or household generates an external cost to society, then efficient pricing requires that consumers face a price that reflects this cost. In the absence of a well-functioning market for internalizing this cost in the consumer price, efficiency requires the imposition of a Pigouvian tax equal to the external cost generated by additional consumption. This issue is especially pertinent for energy consumption since the consumption of fossil fuels generates a range of external costs including:
Outdoor air pollution from fine particulates that result from fossil fuel combustion (either produced directly or indirectly from atmospheric reactions of other emissions), the main
9
environmental damage of which is elevated risks of mortality for populations exposed to the pollution.8
Broader externalities associated with the use of road fuels in vehicles, such as traffic congestion and accidents (most important) and road damage (less important). Although motorists may take into account (“internalize”) some of these costs in their driving decisions (for example, the average amount of congestion on the road, the risk of injuring themselves in single-vehicle collisions), they do not take into account other costs such as their own contribution to congestion and slower travel speeds, injury risks to pedestrians and cyclists and occupants of other vehicles, and the burden on third parties of property damage and medical costs (van Bentham 2015).
CO2 emissions resulting from fuel combustion, which, along with other greenhouse gases
accumulating in the atmosphere, can pose very serious risks for the future stability of the global climate system.
Tax policies to address these issues must be carefully designed, even though they are generally more efficient at internalizing environmental externalities than regulatory approaches (Box 1). For example, taxes to address air pollution from coal should reflect the environmental damage and appropriately credit the use of control technologies that reduce net emissions into the environment (for example, sulfur dioxide scrubbers). Although taxing road fuel is a relatively inefficient way to reduce traffic congestion and other externalities from vehicles, it is appropriate to reflect externalities in energy taxes until more efficient policies are comprehensively implemented—particularly given political inertia and the fact that few countries presently have anything approaching fully corrective charges (Parry and others 2014). Failure to do so would result in a potentially sizable loss of economic efficiency. The Pigouvian tax should reflect the existence of other policy instruments (for example, emission rate standards) directed at reducing environmental damage so that energy taxes simply act as an instrument to correct any remaining externalities. For the most part, this is the case for the environmental costs used here. However, in a few cases the impact of other environmental instruments, such as congestion charges and carbon pricing programs, are not incorporated in the estimates presented here based on Parry and others (2014).9
8 Outdoor air pollution from fossil fuels and other sources was responsible for an estimated 3.2 million premature deaths a year worldwide in 2012 (WHO 2014). Indoor air pollution, mostly in developing economies (for example, fumes from fuel burning in cooking stoves) causes even more deaths (3.8 million) although these factors are not included in the environmental damage estimates used here, since the nature of the externality is not clear in that those causing the pollution are the ones who are harmed by it.
9 A notable example is existing carbon pricing programs. However, given that only about 12 percent of global emissions are currently covered, and often with prices below $10 per ton (World Bank 2014), our calculations suggest that this adjustment would lower post-tax subsidies by only about 1 percent.
10
Consumption taxes
Energy products should also be subject to the same standard rate of value-added tax (VAT) or general sales tax (GST) that applies to consumer goods for the purposes of raising revenue. These taxes should only apply at the household level (for example, for gasoline and residential electricity consumption) and not at an intermediate level (for example, for non-car diesel fuel and industrial electricity) to avoid distorting firms’ input choices (Diamond and Mirrlees 1971). Another issue is whether energy should be subject to additional taxation on fiscal grounds (relative to other consumer products), given that fuels and electricity have relatively inelastic tax bases (that is, in general they are relatively difficult to avoid and evade). In principle, a case might be made for doing this (Parry and Bento 2000; Bento, Jacobsen, and Liu 2012) when broader fiscal instruments have relatively mobile bases (for example, due to international capital flight, the ease of shifting activity to the informal sector or of exploiting tax preferences for fringe benefits, housing and the like). However, the markup over the Pigouvian tax is not calculated here due to the lack of country-specific data on its underlying parameters and because, unless the extra markup is large, extra welfare gains from fine-tuning the tax would be relatively modest. Similarly, linkages with the broader tax system are ignored in calculating the welfare impacts of energy price reform; as a result, welfare impacts might be significantly larger than the partial equilibrium welfare effects computed here if additional revenues were used to reduce an especially distorting tax.
Box 1. Design of Efficient Taxes to Address Energy Externalities
Directly taxing an externality (for example, emissions) is, in principle, the most simple and effective policy to exploit all potential opportunities across the economy for mitigating the externality (Parry and others (2014), Chapter 3). For example, taxing sulfur dioxide emissions from coal plants would promote adoption of control technologies at both new and existing plants, a shift to low-sulfur coal and from coal to cleaner fuel like natural gas, and reductions in electricity demand as taxes are passed forward in higher prices. Regulatory approaches are less effective; for example, mandating that new coal plants install control technologies promotes only the first mitigation opportunity and, by raising the cost of new plants relative to old plants, may perversely retard the retirement of older, more polluting plants. Importantly, regulatory policies also forgo a potentially valuable source of revenue, placing a greater burden on other taxes.
However, environmental taxes need to be carefully designed. To reduce carbon emissions, the most efficient instrument is an upfront charge on fuels equal to CO2 emissions per unit of fuel use times environmental damages per ton of CO2. To reduce local air pollution, direct charges on air emissions reflecting environmental damages per ton are needed to promote the efficient reduction in fuel use and adoption of emissions control technologies. An alternative that is likely to be more feasible in many countries, is an upfront charge on fuel use to reflect potential environmental damages, with rebates for emissions sources demonstrating valid emissions reductions (for example, coal plants with sulfur dioxide scrubbers). To address traffic congestion, the instrument should be a charge per kilometer driven on busy roads, progressively rising and falling during the course of the rush hour to flatten the distribution of trip departure times and promote other behavioral responses for shifting drivers away from peak congestion periods.
11
B. Defining Energy Subsidies
Consumer subsidies
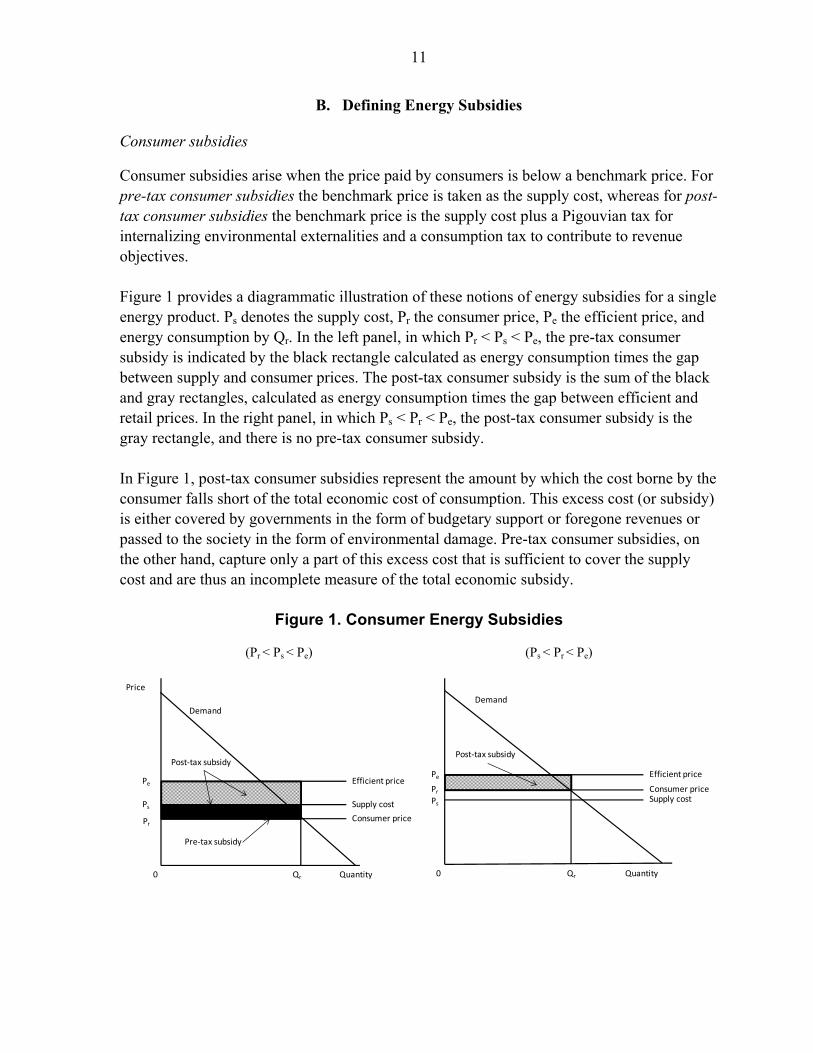
Consumer subsidies arise when the price paid by consumers is below a benchmark price. For pre-tax consumer subsidies the benchmark price is taken as the supply cost, whereas for post-tax consumer subsidies the benchmark price is the supply cost plus a Pigouvian tax for internalizing environmental externalities and a consumption tax to contribute to revenue objectives. Figure 1 provides a diagrammatic illustration of these notions of energy subsidies for a single energy product. Ps denotes the supply cost, Pr the consumer price, Pe the efficient price, and energy consumption by Qr. In the left panel, in which Pr < Ps < Pe, the pre-tax consumer subsidy is indicated by the black rectangle calculated as energy consumption times the gap between supply and consumer prices. The post-tax consumer subsidy is the sum of the black and gray rectangles, calculated as energy consumption times the gap between efficient and retail prices. In the right panel, in which Ps < Pr < Pe, the post-tax consumer subsidy is the gray rectangle, and there is no pre-tax consumer subsidy. In Figure 1, post-tax consumer subsidies represent the amount by which the cost borne by the consumer falls short of the total economic cost of consumption. This excess cost (or subsidy) is either covered by governments in the form of budgetary support or foregone revenues or passed to the society in the form of environmental damage. Pre-tax consumer subsidies, on the other hand, capture only a part of this excess cost that is sufficient to cover the supply cost and are thus an incomplete measure of the total economic subsidy.
Figure 1. Consumer Energy Subsidies
(Pr < Ps
< Pe) (Ps < Pr < Pe)
Demand
Supply cost
Quantity
Price
0 Qr
Pre-tax subsidy
Pr
Ps
Pe
Consumer price
Efficient price
Post-tax subsidy
Quantity0 Qr
Demand
Supply costPr
Ps
Pe
Consumer price
Efficient price
Post-tax subsidy
12
Producer subsidies
Producer subsidies exist when producers receive either direct or indirect support that increases profitability above what it otherwise would be (that is, the support is not passed forward in the form of lower consumer prices). This support can take many forms, including receiving a price for the output above the supply cost, paying a price for inputs below supply costs, receiving preferential tax treatment, or receiving a direct transfer from the budget. Producer subsidies have been measured for advanced countries by the Organisation for Economic Co-operation and Development (OECD 2013); these estimates are used here. While removing producer subsidies provides a (relatively small) fiscal benefit, which is included in our estimates, the environmental and welfare benefits are difficult to assess but are presumably also small.
C. Reform Impact
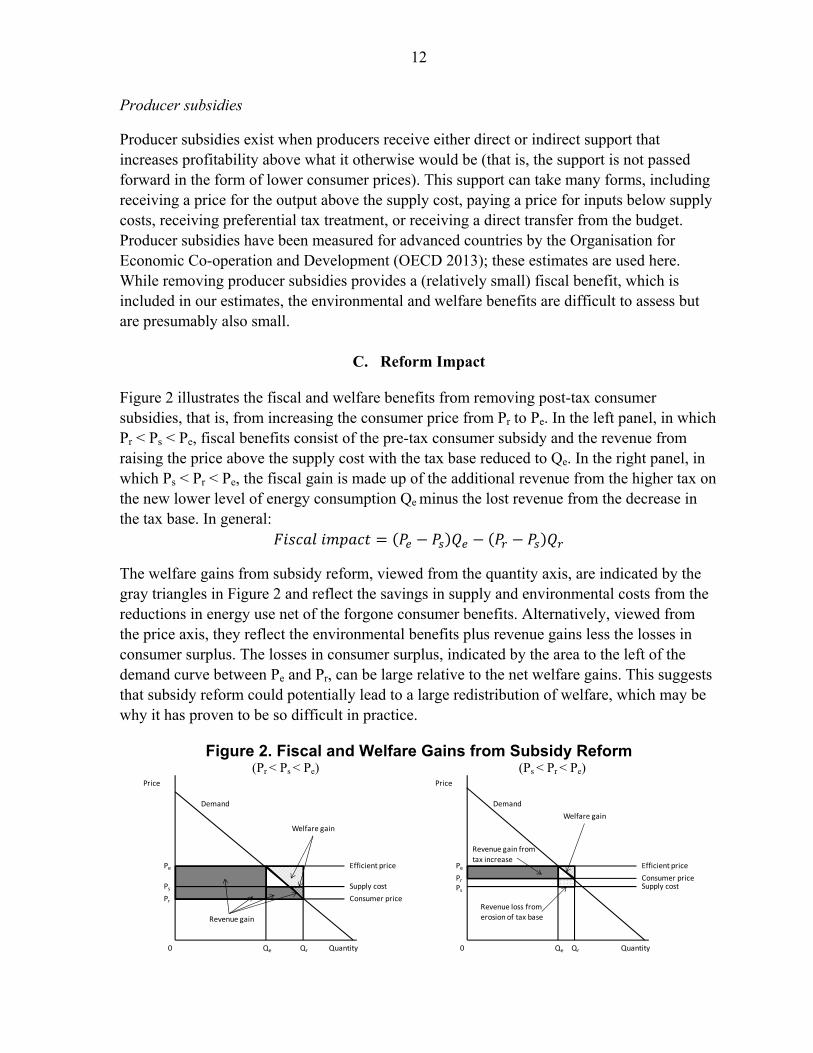
Figure 2 illustrates the fiscal and welfare benefits from removing post-tax consumer subsidies, that is, from increasing the consumer price from Pr to Pe. In the left panel, in which Pr < Ps < Pe, fiscal benefits consist of the pre-tax consumer subsidy and the revenue from raising the price above the supply cost with the tax base reduced to Qe. In the right panel, in which Ps < Pr < Pe, the fiscal gain is made up of the additional revenue from the higher tax on the new lower level of energy consumption Qe minus the lost revenue from the decrease in the tax base. In general:
The welfare gains from subsidy reform, viewed from the quantity axis, are indicated by the gray triangles in Figure 2 and reflect the savings in supply and environmental costs from the reductions in energy use net of the forgone consumer benefits. Alternatively, viewed from the price axis, they reflect the environmental benefits plus revenue gains less the losses in consumer surplus. The losses in consumer surplus, indicated by the area to the left of the demand curve between Pe and Pr, can be large relative to the net welfare gains. This suggests that subsidy reform could potentially lead to a large redistribution of welfare, which may be why it has proven to be so difficult in practice.
Figure 2. Fiscal and Welfare Gains from Subsidy Reform (Pr
< Ps < Pe) (Ps
< Pr < Pe)
Demand
Supply cost
Quantity
Price
0 Qr
Welfare gain
Pr
Ps
Pe
Consumer price
Efficient price
Revenue gain
Qe
Demand
Supply cost
Quantity
Price
0 Qr
Pr
Ps
Pe
Consumer price
Efficient price
Revenue gain from
tax increase
Qe
Welfare gain
Revenue loss fromerosion of tax base

13
Measuring reform impacts requires the functional specification of a demand curve. The calculations presented in the next section assume a standard constant price elasticity demand curve given by Q ɛ, where ɛ is the constant price elasticity. With this demand function, the net welfare gain can be expressed as:
1
where can be estimated as / . The first term captures the gross benefit from removing subsidies while the latter two terms capture the lost consumer surplus from energy price increases.
Environmental benefits are not explicitly shown in Figure 2—in monetary terms they are the gap between the efficient and supply prices times the reduction in energy use, net of the small component that reflects general consumer taxes. CO2 reductions are easily measured by the change in energy use times the CO2 emissions factor for each energy product, which varies significantly across products, but not across countries. Reductions in air pollution deaths from reforming petroleum and natural gas subsidies are computed, using country-specific estimates of deaths per unit of energy consumption.
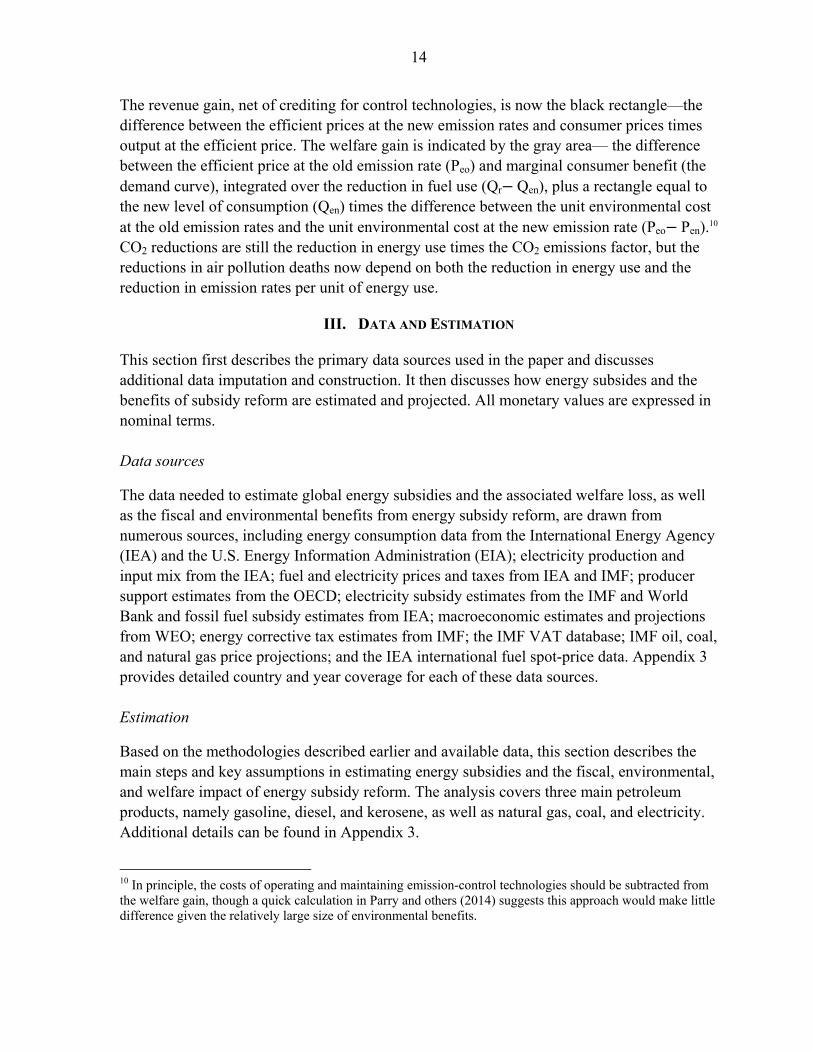
For coal, there is substantial potential to reduce air pollution emission rates through greater deployment of filtering technologies in the smokestack; we assume tax credits would be provided to promote these technologies. The implications for revenue and welfare—there are no implications for the calculation of pre-tax and post-tax subsidies—are shown in Figure 3 for the case in which the initial consumer price equals the supply price, which is most realistic for coal. Peo denotes the efficient price at the old emission rate and Pen the price at the new emission rate, averaged across plants, but with greater deployment of control technologies assumed.
Figure 3. Fiscal and Welfare Gains with Adoption of Emissions-Control Technologies
(Pr < Pen
< Peo)
Demand
Quantity
Price
0 Qr
Welfare gain
Pr
Pen
Peo
Supply cost,
Consumer price
Efficient price—
old emission rate
Revenue gain
Qen
Efficient price—
new emission rate
14
The revenue gain, net of crediting for control technologies, is now the black rectangle—the difference between the efficient prices at the new emission rates and consumer prices times output at the efficient price. The welfare gain is indicated by the gray area— the difference between the efficient price at the old emission rate (Peo) and marginal consumer benefit (the demand curve), integrated over the reduction in fuel use (Qr Qen), plus a rectangle equal to the new level of consumption (Qen) times the difference between the unit environmental cost at the old emission rates and the unit environmental cost at the new emission rate (Peo Pen).10 CO2 reductions are still the reduction in energy use times the CO2 emissions factor, but the reductions in air pollution deaths now depend on both the reduction in energy use and the reduction in emission rates per unit of energy use.
III. DATA AND ESTIMATION
This section first describes the primary data sources used in the paper and discusses additional data imputation and construction. It then discusses how energy subsides and the benefits of subsidy reform are estimated and projected. All monetary values are expressed in nominal terms. Data sources
The data needed to estimate global energy subsidies and the associated welfare loss, as well as the fiscal and environmental benefits from energy subsidy reform, are drawn from numerous sources, including energy consumption data from the International Energy Agency (IEA) and the U.S. Energy Information Administration (EIA); electricity production and input mix from the IEA; fuel and electricity prices and taxes from IEA and IMF; producer support estimates from the OECD; electricity subsidy estimates from the IMF and World Bank and fossil fuel subsidy estimates from IEA; macroeconomic estimates and projections from WEO; energy corrective tax estimates from IMF; the IMF VAT database; IMF oil, coal, and natural gas price projections; and the IEA international fuel spot-price data. Appendix 3 provides detailed country and year coverage for each of these data sources. Estimation
Based on the methodologies described earlier and available data, this section describes the main steps and key assumptions in estimating energy subsidies and the fiscal, environmental, and welfare impact of energy subsidy reform. The analysis covers three main petroleum products, namely gasoline, diesel, and kerosene, as well as natural gas, coal, and electricity. Additional details can be found in Appendix 3.
10 In principle, the costs of operating and maintaining emission-control technologies should be subtracted from the welfare gain, though a quick calculation in Parry and others (2014) suggests this approach would make little difference given the relatively large size of environmental benefits.
15
Estimation of pre-tax consumer subsidies uses the price-gap approach (Kaplow 2009; Clements and others 2014), multiplying fuel consumption by the difference between supply costs and consumer prices (when the latter are below the former). For petroleum products, this requires the annual averages of supply costs, consumer prices, and consumption.11 For natural gas, coal, and electricity, the subsidy estimates from the IEA are adjusted to exclude the subsidies due to the inclusion of a VAT component in their reference prices. Additional estimates for electricity subsidies are drawn from Di Bella and others (2015), IMF and World Bank studies. Post-tax consumer subsidies additionally require estimates of undercharging for global warming, local air pollution, and (if applicable) vehicle externalities for each energy products and estimates for general consumption taxes. For electricity, only subsidies due to the failure to fully charge for general consumption taxes apply as the environmental costs associated with electricity generation are attributed to energy inputs (for example, coal and natural gas). For global warming we took the central values from the widely cited USIAWG (2013) study, which are available for past and future years. The same value is used for all countries and is expressed per unit of energy use using CO2 emissions coefficients from Parry and others (2014). Other externality estimates, which vary by country, are only available for 2010 from Parry and others (2014). To update to later years, these are adjusted by inflation and the growth of real per capita GDP with an income elasticity of 0.8. Charges for road-related externalities are only assessed on fuel consumption that is related to transportation. The consumption tax is calculated using the prevailing VAT or GST rate in the country, applied to the supply cost plus externality cost. For intermediate consumption, the consumption tax component is set to zero. Producer subsidies are drawn from the OECD, which provides estimates of producer support. These estimates are only available for 2011 and are kept constant as a share of GDP for later years. Different items of producer subsidies from the OECD could potentially overlap with each other. In the event that some of the producer subsidies are passed to consumers as lower consumer prices, these producer subsidies could also overlap with consumer subsidies. Since producer subsidy estimates appear to be very small, these issues should have little effect on our estimates. Environmental, fiscal, and welfare impacts are generated through both raising consumer prices to efficient levels and removing producer subsidies. For consumer subsidy reform, the impacts of subsidy reform assume a common long-run own-price elasticity of –0.5 for
11 For OECD countries, supply cost is based on country specific data, while for other countries, the closest hub prices are adjusted to include the costs of shipping and margins.

16
petroleum products and electricity,12 and an elasticity of –0.25 for coal and natural gas.13 Eliminating electricity subsidies reduces electricity consumption, which in turn is assumed to lead to a same percentage reduction in electricity production inputs (coal and natural gas). The fiscal gain from removing consumer subsidies is calculated using the price elasticities described above and the formula developed in the early section. Cost-effective technologies to capture emissions are still not available except for coal. Even these technologies, such as washing or scrubbing, have not been widely adopted because there are no incentives for private entities to act under current energy pricing in many countries, even though it is socially optimal to do so. With energy pricing incorporating externality costs, it is assumed that coal users (power plants in particular) would adopt these technologies. Reduction in coal/natural gas consumption as a result of removing electricity subsidies is assumed to result in a fiscal loss equal to the consumption reduction multiplied by the unit tax on coal/natural gas consumption. Fiscal gain from removing producer subsidies equals the size of producer subsidies. The same price elasticities are used to estimate the environmental benefits from energy subsidy reform while assuming that coal users (power plants in particular) would adopt emissions reduction technologies. The number of lives saved as a result of energy subsidy reform is estimated by multiplying the reduction in emissions (SO2, NOx, and PM2.5) by the number of deaths per ton of each of these pollutants. The environmental impact of the reduction in coal/natural gas consumption as a result of eliminating electricity subsidies is estimated in the same way as for the consumption reduction from removing coal/natural gas subsidies (described in Section II). No environmental damage is estimated for producer subsidies due to data limitations. In any case, it is likely to be small because producer subsidies are small.
12 Numerous studies have estimated motor fuel (especially gasoline) price elasticities for different countries and the value assumed here, –0.5 for both gasoline and diesel, reflects a central value from the literature. There is, however, significant variation among studies: for example, Sterner (2007) reports globally averaged (long-run) gasoline price elasticities of around –0.7 or larger while individual country estimates in Dahl (2012) are closer to about –0.25 on average.
13 According to simulations from a variant of the U.S. Department of Energy’s National Energy Modeling System (NEMS) model in Krupnick and others (2010), the price elasticity for coal use in the United States in response to a carbon tax, which takes into account the change in natural gas prices is about –0.15. For comparison, the unweighted mean among eight studies of coal price elasticities (focusing on various OECD countries, China, and India) summarized in Trüby and Moritz (2011) is –0.28.
Natural gas tends to be more responsive to changes in its own price, due to the ability of gas-fired power plants to act as intermittent suppliers although, in countries where coal and gas compete, this tendency is dampened as carbon pricing drives up the price of coal relative to gas. Liu (2004) estimates own-price elasticities for natural gas, with no change in coal prices, of –0.24 to –0.36.

17
The welfare impact of reductions in production inputs (for example, coal and natural gas) due to the elimination of electricity subsidies is not assessed because of its complexity, but it is likely to be small given the small size of electricity post-tax subsidies. Limited data on the nature of producer subsidies preclude direct estimation of the welfare implications of removing producer subsidies. However, given the small magnitude of producer subsidies, the associated welfare gain is also expected to have little effect on our estimates.
Projections
For petroleum products, the most recent year of available data is 2014. Energy subsidies in 2015 are projected by assuming that changes in international crude oil prices are fully passed on to the supply costs of petroleum projects. For domestic prices, the changes in international prices are assumed to be passed to domestic prices based on the pass-through estimates in 2014 in each country.14 The pass-through estimates are capped between zero and 100 percent plus the consumption tax rate. For coal and natural gas prices, a similar methodology is used. However, as pass-through estimates are typically only available for petroleum products, the average of pass-through estimates of petroleum products in the previous year is applied. In addition, the projections are only done in countries where subsidy estimates are available for 2013. For electricity, subsidies are assumed to be a constant share of GDP up to 2014 from whenever the most recent estimates are available. The reason we do not apply the previously described methodology is because it does not appear to produce reliable estimates for some countries during this time period: pass-through estimates are subject to large uncertainty, and the most recent electricity subsidy estimates in some countries date back as far as 2009. For 2015, to incorporate the dramatically lower international energy prices, we again adopt the above methodology and assume that the production fuel mix and costs of other inputs remain unchanged. A sensitivity analysis is performed to check how the results vary with different assumptions of the pass-through estimates.
IV. RESULTS
The discussion of results begins with a picture of global energy subsidies, followed by a look at the breakdowns by energy product, components of post-tax subsidies, and region. It then discusses the fiscal, environmental, and welfare benefits of removing energy subsidies. A brief sensitivity analysis is also provided.
14 For countries that have indicated their energy pricing policies in 2015, this information is used in place of estimates of historical pass-through.
18
A. Energy Subsidies: The Global Picture15
Global Energy Subsidies
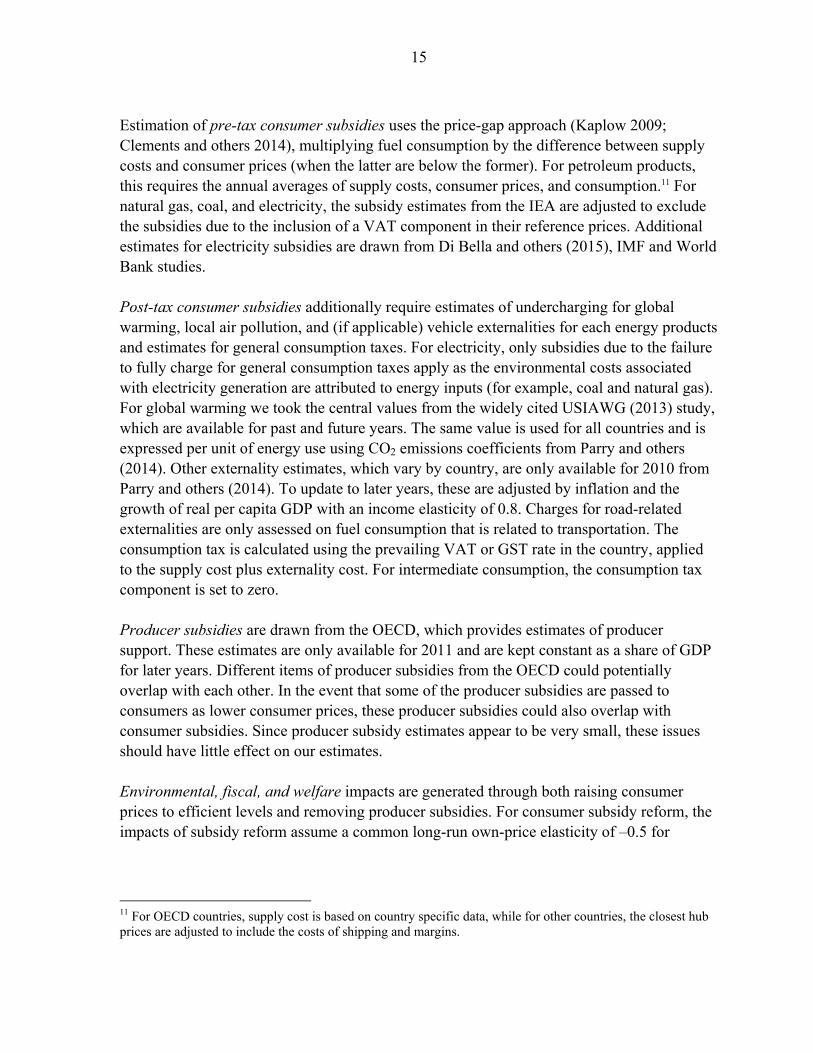
Figure 4 presents estimates of pre-tax and post-tax global energy subsidies from 2011 to 2013, expressed both in nominal U.S. dollars and as a percent of global GDP.
Pre-tax subsidies were 0.7 percent of global GDP in 2011 and 2013, and are projected to decline by about one-third to 0.4 percent of global GDP ($333 billion) in 2015. This reduction reflects both the decline in international energy prices and an assumption that many countries only partially pass-through those reductions to retail prices based on their historical pass-through experiences. Lower pre-tax subsidies for petroleum, natural gas, and electricity account, respectively, for 63 percent, 9 percent, and 28 percent of the reduction in total pre-tax subsidies between 2013 and 2015 (the level and change in coal pre-tax subsidies are negligible).16
Figure 4. Global Energy Subsidies, 2011–15
(US$ billions on left axis; percent of global GDP on right axis)
Source: Authors’ calculations, based on sources in Appendix Table 2.
15 For the purpose of simplicity in reporting, producer subsidies are lumped together with pre-tax consumer subsidies and the sum simply referred to as pre-tax subsidies in the subsequent discussion. Producer subsidies, as estimated by the OECD, are relatively small, at $16.8 billion in 2011 and $17.9 billion in 2015.
16 Pre-tax consumer subsidies are comparable to those of the IEA for years between 2011 and 2013 where IEA estimates are available.
0
1
2
3
4
5
6
7
0
1,000
2,000
3,000
4,000
5,000
6,000
2011 2012 2013 2014 2015
Perc
ent o
f Glo
bal G
DP
US$
bill
ions
(nom
inal
)
Post-tax subsidies, billions US$ (left-side axis)Pre-tax subsidies, billions US$ (left-side axis)Pre-tax subsidies, percent of global GDP (right-side axis)Post-tax subsidies, percent of global GDP (right-side axis)
19
What is most striking in Figure 4 is the dramatically larger size of post-tax subsidies, which are eight times as large as pre-tax subsidies in 2011 and 16 times the level in 2015. In fact, despite the sharp drop in international energy prices, post-tax subsidies have remained high, at 5.8 percent of global GDP ($4.2 trillion) in 2011, 6.5 percent ($4.9 trillion) in 2013, and also 6.5 percent ($5.3 trillion) in 2015. The main reason for this is the high growth in energy consumption, in particular for coal, in countries with relatively high environmental damage from coal.
The other striking finding from Figure 4 is the much higher estimate of post-tax subsidies, which are about twice as high for 2011 compared with estimates in Clements and others (2013). As discussed in Box 2, this difference reflects a variety of factors, most importantly higher estimates of industrial air pollution damages (see Appendix Table 3 for additional results).
Box 2. Reconciling Previous Estimates of Post-Tax Subsidies
The estimate of post-tax subsidies for 2011 in Figure 4 is more than double the earlier estimate in Clements and others (2013), reflecting the following factors.
The first is the expanded coverage of air pollutants. The earlier estimate of air pollution damages from coal considered only damages from sulfur dioxide emissions (the most important pollutant), whereas the estimates here also include damages from nitrogen oxides and direct fine particulate emissions. Accounting for these extra pollutants from coal increases post-tax subsidies by 24 percent. The new estimates also include estimates of local air pollution damages from natural gas, which add another 2 percent.
Second, the previous estimate of local air pollution damages—that is, increased mortality risks for exposed populations—from sulfur dioxide emissions at coal plants was obtained by extrapolating a damage estimate for the average U.S. coal plant to other countries, adjusting only for cross-country differences in the valuation of mortality risks. Current estimates of these damages are five time higher, accounting for 45 percent of the increase in the estimates post-tax subsidies, reflecting the net effect of:
recent evidence from the World Health Organization suggesting air pollution has a greater effect on mortality risk—about 67 percent higher than assumed in Clements and others (2013).
adjustments for country-specific sulfur dioxide emission rates from coal plants (for example, these emission rates are 2.6 times as high in China as in the United States).
adjustments for country-specific population exposure to coal plant emissions. adjustments for differences in baseline mortality rates (less healthy populations being more
vulnerable to pollution).
Third, as regards non-carbon externalities (congestion, accidents, air pollution, and road damage) for vehicles, Clements and others (2013) extrapolated them to other countries using case studies for the United States, the United Kingdom, and Chile, adjusting only for the valuation of travel time and injury risk. The updated estimates are based on country-level assessments of externalities, which on average are significantly higher, especially for diesel vehicles due to higher air emission rates. The net result is an increase in post-tax subsidies of 23 percent.
Finally, the use of country-specific conversion factors (for example, from gigajoules to short tons of coal consumption), instead of a common conversion factor as in Clements and others (2013), accounts for an increase of 7 percent. Consumption and price updates account for the remaining 10 percent of the increase in the post-tax subsidy estimates.

20
Breakdown by energy product and components of post-tax subsidies
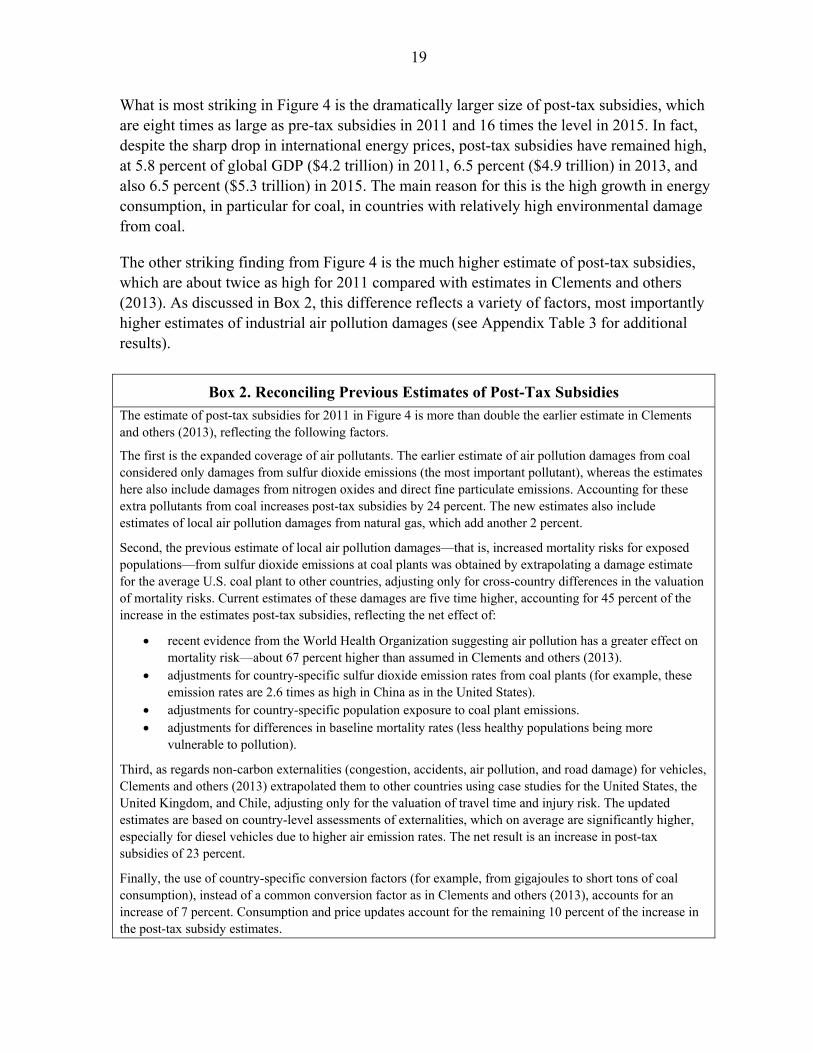
Figure 5 shows the breakdown by energy product of pre- and post-tax global energy subsidies in 2011, 2013, and 2015. Figure 6 takes a closer look, focusing on 2013 and on five components of post-tax subsidies for each product and all products combined: pre-tax subsidies, global warming, local air pollution, other domestic externalities, and forgone consumption tax revenue. The data underlying these figures is summarized in Appendix Table 2 in Appendix 3.
In 2013, for pre-tax subsidies, petroleum contributes the biggest subsidy (0.34 percent of global GDP), followed by electricity (0.23 percent) and natural gas (0.16 percent); the coal subsidy was very small (0.01 percent). All of the pre-tax subsidies for energy products (aside from coal) are projected to fall in 2015; the pre-tax subsidy for petroleum drops to 0.17 percent of global GDP.
Figure 5. Global Energy Subsidies by Energy Product, 2011–15
(Pre-tax in percent global GDP left axis; post-tax in percent global GDP right axis)
Source: Authors’ calculations, based on sources in Appendix Table 2.
Much more interesting and important is the breakdown of post-tax subsidies. The most dramatic difference, compared with the pre-tax figures, is for coal which is the biggest source of post-tax subsidies, amounting to 3.0 percent of global GDP in 2011 and rising to 3.9 percent in 2015.17 The considerable size of coal subsidies reflects the substantial undercharging for its environmental impacts—coal is the most carbon-intensive and air-
17 The rising post-tax subsidy reflects in part high growth in coal use in countries with relatively high environmental damage from coal.
0
1
2
3
4
5
6
7
0.00
0.10
0.20
0.30
0.40
0.50
0.60
0.70
0.80
2011 2013 2015 2011 2013 2015
Pre-tax(left-side axis)
Post-tax(right-side axis)
Perc
ent o
f Glo
bal G
DP
Perc
ent o
f Glo
bal G
DP
Coal Petroleum Natural gas Electricity

21
pollution intensive energy product (per unit of energy), yet no country really imposes meaningful taxes on coal use from an environmental perspective (Parry and others 2014).
Petroleum is the next most heavily subsidized product, with the projected subsidy remaining at 1.8 percent of global GDP in 2015 despite declining petroleum prices. This is followed by natural gas follows although, since natural gas is a relatively clean fuel, the subsidy is only about one-third of that for petroleum. Last is electricity, for which the projected post-tax subsidy declines to just 0.2 percent of global GDP in 2015—environmental impacts are attributed to energy inputs rather than power generation itself.
Figure 6 shows the decomposition of post-tax subsidies for all energy products. Pre-tax subsidies account for 11.1 percent of these subsidies and forgone consumption tax revenue for another 7.5 percent. The biggest component is local air pollution (46.0 percent), followed by global warming (22.3 percent), and other (non-internalized) domestic externalities (12.9 percent).
An important point, therefore, is that most (over three-fourths) of the underpricing of energy is due to domestic distortions—pre-tax subsidies and domestic externalities—rather than to global distortions (climate change). The crucial implication of this is that energy pricing reform is largely in countries’ own domestic interest and therefore is beneficial even in the absence of globally coordinated action.
Taking a closer look at the composition of post-tax subsidies for individual products (Figure 6), for coal (the fuel with the biggest subsidies) about three-fourths of the post-tax-subsidy is from the failure to charge fully for local air pollution and about a quarter from the absence of an additional charge for global warming. For petroleum, non-internalized externalities from congestion, accidents, and (less important) road damage contribute the most (39 percent) to post-tax subsidies, although all the other components also contribute significantly: pre-tax subsidies (17 percent), global warming (13 percent), air pollution (18 percent), and foregone consumption tax revenue (14 percent). For natural gas, the main component is global warming (53 percent), followed by pre-tax subsidies (26 percent), and forgone consumption tax revenue (10 percent). For electricity, pre-tax subsidies are two-thirds of post-tax subsidies, and for foregone revenue one-third.
Regional breakdown
Figure 7 shows the breakdown of energy subsidies in 2013 by region, both in absolute dollars and as a share of regional GDP. The absolute numbers reinforce a major finding of Clements and others (2013) that the regional breakdown of energy subsidies looks radically different according to how subsidies are defined. Focusing on pre-tax subsidies, the MENAP region (where petroleum prices are most often regulated) accounts for 47 percent of subsidies, Emerging and Developing Asia 18 percent, and advanced countries only 4 percent. But under the broader post-tax definition, Emerging and Developing Asia accounts for the largest share of subsidies (about half) followed by advanced countries (about one-fourth), underscoring
22
that energy price reform is a pressing issue for all countries—developed and advanced economies and oil-producing and non-oil-producing countries alike.
Figure 6. Global Post-Tax Subsidies by Product and Subsidy Component, 2013
Source: Authors’ calculations, based on sources in Appendix Table 2. Note: Other local factors apply only to petroleum products and refer to non-internalized externalities from congestion, accidents, and road fuels.
Figure 7. Energy Subsidies by Region and Subsidy Component, 2013
(US$ billions on top axis; percent regional GDP on bottom axis)
Source: Authors’ calculations, based on sources in Appendix Table 2. Note: CIS = Commonwealth of Independent States; ED Asia = Emerging and Developing Asia, LAC = Latin America and the Caribbean; MENAP = Middle East, North Africa, Afghanistan, and Pakistan.
0
1,000
2,000
3,000
4,000
5,000
6,000
All products Coal Petroleum Natural gas Electricity
US$
bill
ions
(nom
inal
)
Pre-tax subsidies Global warming Local air pollution Other local factors Foregone consumption tax revenue
0 1,000 2,000 3,000 4,000 5,000 6,000
0 5 10 15 20
MENAPSub-Saharan AfricaCom. Of Ind. States
E.D. AsiaEmerging Europe
AdvancedLAC
World
MENAPSub-Saharan AfricaCom. Of Ind. States
E.D. AsiaEmerging Europe
AdvancedLAC
World
US$ billions (nominal)
Percent of GDPPre-tax Externalities Foregone consumption tax revenue
23
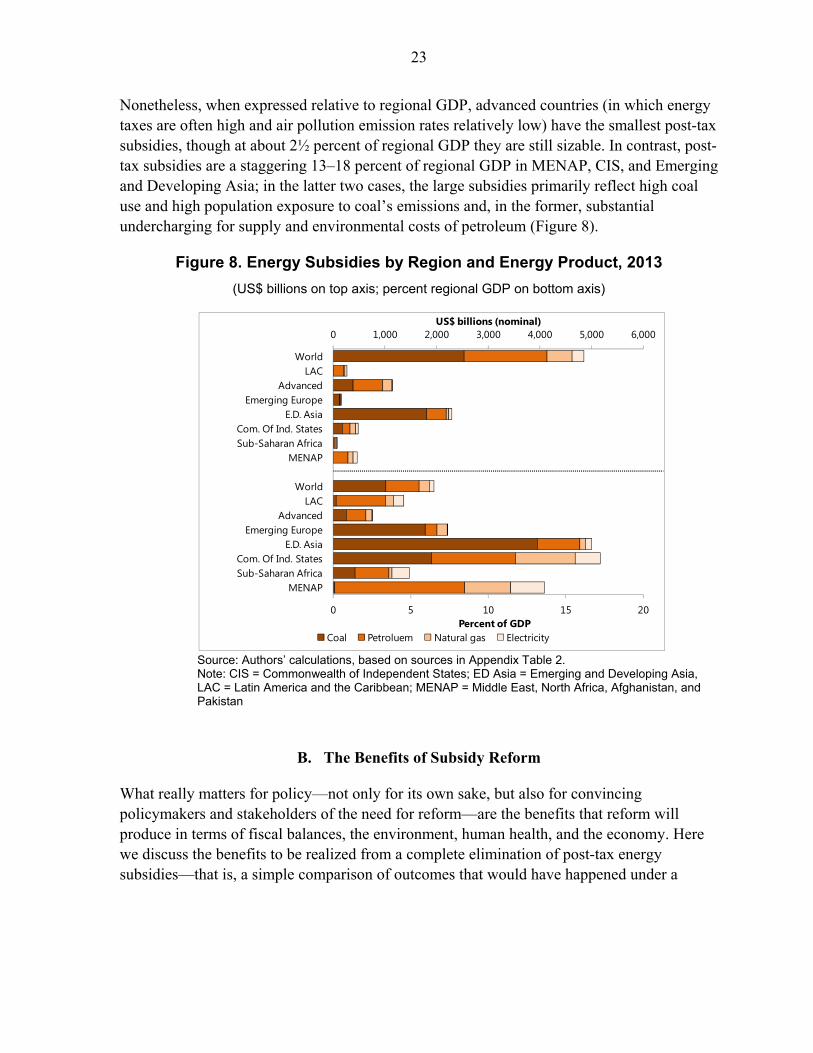
Nonetheless, when expressed relative to regional GDP, advanced countries (in which energy taxes are often high and air pollution emission rates relatively low) have the smallest post-tax subsidies, though at about 2½ percent of regional GDP they are still sizable. In contrast, post-tax subsidies are a staggering 13–18 percent of regional GDP in MENAP, CIS, and Emerging and Developing Asia; in the latter two cases, the large subsidies primarily reflect high coal use and high population exposure to coal’s emissions and, in the former, substantial undercharging for supply and environmental costs of petroleum (Figure 8).
Figure 8. Energy Subsidies by Region and Energy Product, 2013
(US$ billions on top axis; percent regional GDP on bottom axis)
Source: Authors’ calculations, based on sources in Appendix Table 2. Note: CIS = Commonwealth of Independent States; ED Asia = Emerging and Developing Asia, LAC = Latin America and the Caribbean; MENAP = Middle East, North Africa, Afghanistan, and Pakistan
B. The Benefits of Subsidy Reform
What really matters for policy—not only for its own sake, but also for convincing policymakers and stakeholders of the need for reform—are the benefits that reform will produce in terms of fiscal balances, the environment, human health, and the economy. Here we discuss the benefits to be realized from a complete elimination of post-tax energy subsidies—that is, a simple comparison of outcomes that would have happened under a
0 1,000 2,000 3,000 4,000 5,000 6,000
0 5 10 15 20
MENAPSub-Saharan AfricaCom. Of Ind. States
E.D. AsiaEmerging Europe
AdvancedLAC
World
MENAPSub-Saharan AfricaCom. Of Ind. States
E.D. AsiaEmerging Europe
AdvancedLAC
World
US$ billions (nominal)
Percent of GDPCoal Petroluem Natural gas Electricity

24
counterfactual with fully efficient energy prices, compared with outcomes under current price levels.18
Fiscal benefits
Figure 9 summarizes global and regional revenue gains for 2013. At a global level, these gains are estimated at about $3.0 trillion (4 percent of global GDP). While the projected gains for 2015 (not shown in the figure) are about $2.9 trillion (3.6 percent of global GDP). The revenue gain is quite a lot lower than the post-tax energy subsidy, as it accounts for the price-induced reduction in energy use and implicitly assumes tax rebates are used to promote adoption of emission control technologies for coal, which lowers net revenue. Nonetheless, this is still a very large number; at more than 10 percent of government revenue or more than the entire revenue governments typically collect from corporate income taxes.
Figure 9. Fiscal Gain from Removing Energy Subsidies, 2013
(US$ billions on top axis; percent revenues and percent global/regional GDP on bottom axis)
Source: Authors’ calculations, based on sources in Appendix Table 2. Note: CIS = Commonwealth of Independent States; ED Asia = Emerging and Developing Asia, LAC = Latin America and the Caribbean; MENAP = Middle East, North Africa, Afghanistan, and Pakistan.
18 The revenue estimates are somewhat higher, and the environmental benefits lower, than earlier calculations in Parry and others (2014) due here to lower own-price elasticities assumed for coal and natural gas, the inclusion of a consumption tax component in efficient prices, and the additional coverage of electricity.
0 500 1,000 1,500 2,000 2,500 3,000 3,500
0 10 20 30 40
MENAPSub-Saharan AfricaCom. Of Ind. States
E.D. AsiaEmerging Europe
AdvancedLAC
World
MENAPSub-Saharan AfricaCom. Of Ind. States
E.D. AsiaEmerging Europe
AdvancedLAC
World
MENAPSub-Saharan AfricaCom. Of Ind. States
E.D. AsiaEmerging Europe
AdvancedLAC
World
US$ billions (nominal)
PercentCoal Petroleum Natural gas Electricity
Perc
ent o
f re
venu
ePe
rcen
t of
GD
PU
S$ b
illio
ns

25
Revenue gains vary substantially across regions, with the regional distribution largely (and not surprisingly) resembling that of post-tax energy subsidies, with large potential revenue gains—about 9 percent of regional GDP or more—in Emerging and Developing Asia, CIS, and MENAP. Generally speaking, these are also regions where the revenue potential from broader tax instruments is hindered by a lot of informal activity while energy taxes tend to have a broader consumption base. As regards the distribution of fiscal benefits by energy product, for the reason just noted, the share of coal in the fiscal gain is smaller than its share in the post-tax energy subsidy (again due to the rebates assumed for emissions control technologies).
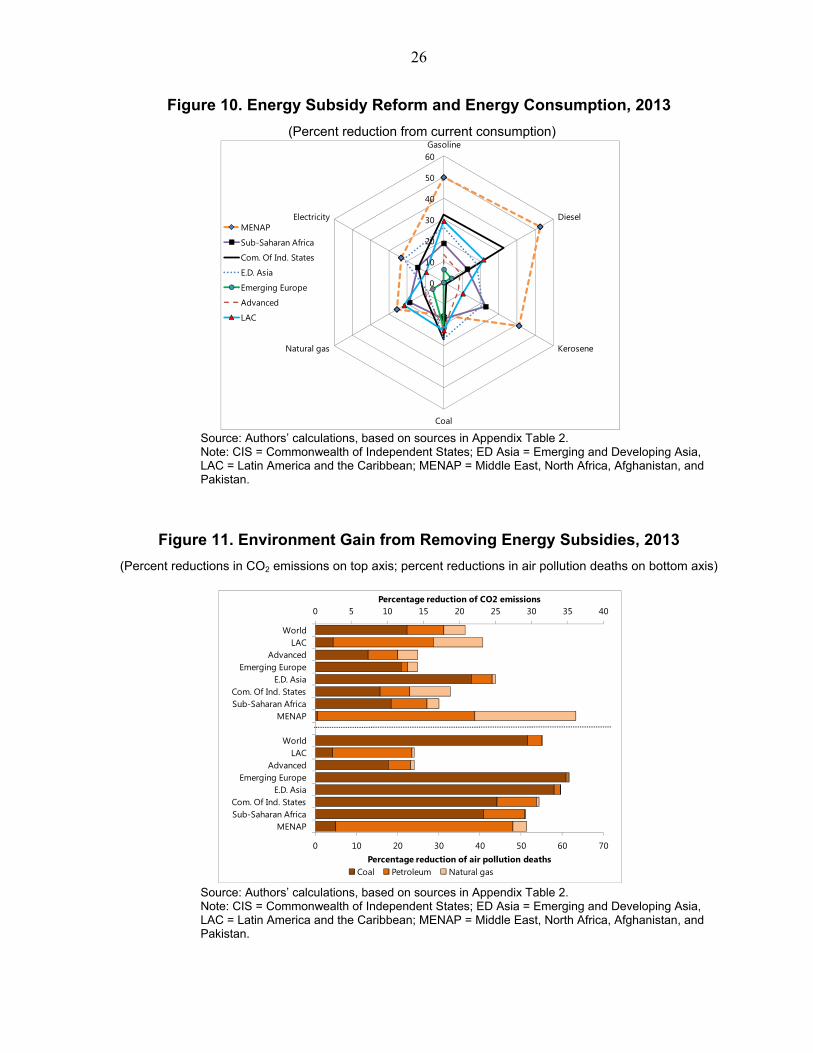
Figure 10 describes the changes in fuel use underlying these revenue impacts. The reduction in energy consumption is substantial for some regions and products. For example, reductions in gasoline and diesel consumption are about 50 percent in MENAP followed by 30 percent in CIS countries, regions where full energy price reform would lead to especially large price increases.19 In case of gasoline, the new per capita consumption in MENAP is similar to the pre-reform level of Emerging Europe and significantly higher than the pre-reform levels in Sub-Sahara Africa and Emerging and Developing Asia. As expected, the reductions in coal consumption are most pronounced in Emerging and Developing Asia and CIS countries, where environmental damages per unit of coal use (and hence proportionate price increases) are highest. At a global level, consumption reductions range from just over 10 percent for natural gas to slightly more than 25 percent for coal. A large share of these reductions could be achieved by improving energy efficiency: energy efficiency measures could potentially lower global coal demand by 22 percent, oil demand by 13 percent, and natural gas demand by 14 percent (IEA 2012).
Environmental and economic benefits
Figure 11 summarizes the environmental benefits from eliminating post-tax energy subsidies for 2013—the percent reductions in CO2 emissions and premature air pollution deaths—and also broken down by region and the contribution of different products. These benefits reflect a simple comparison of outcomes that would have happened in 2013 under a counterfactual with fully efficient energy prices, compared with actual outcomes.
19 Moving to efficient energy pricing in one step would require very large increases in consumer energy prices, in particular for coal with a global average price increase of more than 200 percent. For petroleum products, natural gas, and electricity, the global averages are 52 percent, 45 percent, and 69 percent respectively. Some regions have particularly high price increases, for example, for petroleum products about 400 percent in MENAP and 152 percent in the CIS. In countries with large pre-tax subsidies, a gradual reform strategy should focus first on raising consumer prices to cover supply costs and then on incorporating an efficient tax level.
26
Figure 10. Energy Subsidy Reform and Energy Consumption, 2013
(Percent reduction from current consumption)
Source: Authors’ calculations, based on sources in Appendix Table 2. Note: CIS = Commonwealth of Independent States; ED Asia = Emerging and Developing Asia, LAC = Latin America and the Caribbean; MENAP = Middle East, North Africa, Afghanistan, and Pakistan.
Figure 11. Environment Gain from Removing Energy Subsidies, 2013
(Percent reductions in CO2 emissions on top axis; percent reductions in air pollution deaths on bottom axis)
Source: Authors’ calculations, based on sources in Appendix Table 2. Note: CIS = Commonwealth of Independent States; ED Asia = Emerging and Developing Asia, LAC = Latin America and the Caribbean; MENAP = Middle East, North Africa, Afghanistan, and Pakistan.
0
10
20
30
40
50
60Gasoline
Diesel
Kerosene
Coal
Natural gas
ElectricityMENAP
Sub-Saharan Africa
Com. Of Ind. States
E.D. Asia
Emerging Europe
Advanced
LAC
0 5 10 15 20 25 30 35 40
0 10 20 30 40 50 60 70
MENAPSub-Saharan AfricaCom. Of Ind. States
E.D. AsiaEmerging Europe
AdvancedLAC
World
MENAPSub-Saharan AfricaCom. Of Ind. States
E.D. AsiaEmerging Europe
AdvancedLAC
World
Percentage reduction of CO2 emissions
Percentage reduction of air pollution deathsCoal Petroleum Natural gas
27
The CO2 reduction is more than 20 percent, which is very significant and would represent a major step towards the de-carbonization ultimately needed to stabilize the global climate system. Reductions for coal use account for about two-thirds of the reduction in CO2 at the global level because of its high carbon intensity and the high coal taxes needed to cover carbon and air pollution damages. It accounts for a disproportionately larger amount (87 percent) in Emerging and Developing Asia. In the MENAP region, CO2 reductions (36 percent) exceed the global average (despite its minimal use of coal, reflecting in particular substantial reductions in petroleum (Figure 10).
The reduction in premature global air pollution deaths is even more dramatic at 55 percent. Coal accounts for an even larger share of this reduction (93 percent) than in the case of CO2, as energy price reform reduces not only the use of coal but also the emission rate from coal through greater use of control technologies. Again, the global numbers mask some significant disparities. In Latin America and advanced countries, the reduction in deaths is around 25 percent reflecting the limited use of coal in the former and relatively low air emission rates in the latter due to currently high deployment of emissions control technologies. In contrast, reductions in air pollution deaths are more than 60 percent in Central and Eastern Europe (CEE) and Emerging and Developing Asia, given the high use of coal there and the high population exposure to emissions due to high population density. Even in MENAP, the reduction in air pollution deaths is about 50 percent, due to the large reduction in petroleum consumption.
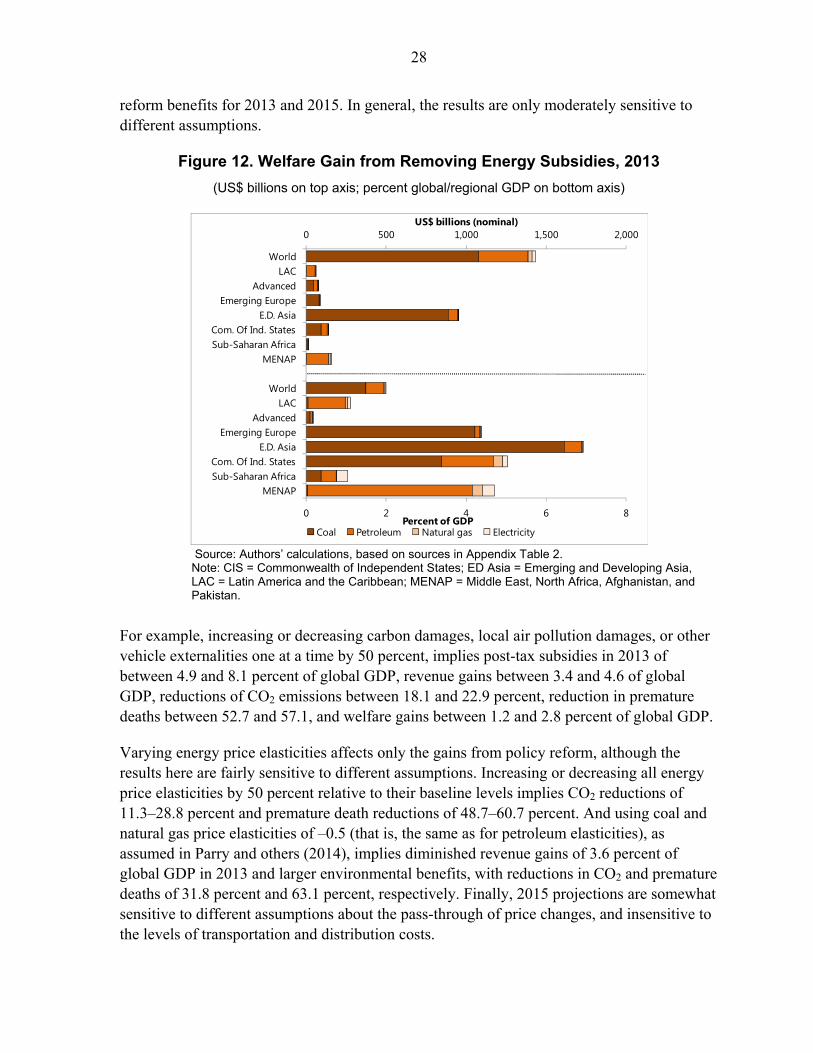
Figure 12 summarizes the net economic welfare gains from eliminating post-tax subsidies, calculated as the benefits from reduced environmental damage and higher revenue minus the losses from consumers facing higher energy prices. At the global level, there is a welfare gain of more than $1.4 trillion, or 2.0 percent of global GDP, in 2013. The breakdown of these gains by fuel product and region can largely be anticipated from the previous discussion—for example, the bulk of the gains come from coal (reductions in its use and adoption of emissions control technologies). Similarly, welfare gains as a percent of regional GDP are greatest in Emerging Europe (4.4 percent of regional GDP), Emerging and Developing Asia (6.9 percent), CIS (5.0 percent), and MENAP (4.7 percent). The small welfare gain in advanced economies, in particular relative to their share in global energy subsidies, mainly reflects their high deployment of emissions control technologies by coal users and the small gap between consumer prices and efficient prices for petroleum products (with much higher consumption levels).
C. Sensitivity Analysis
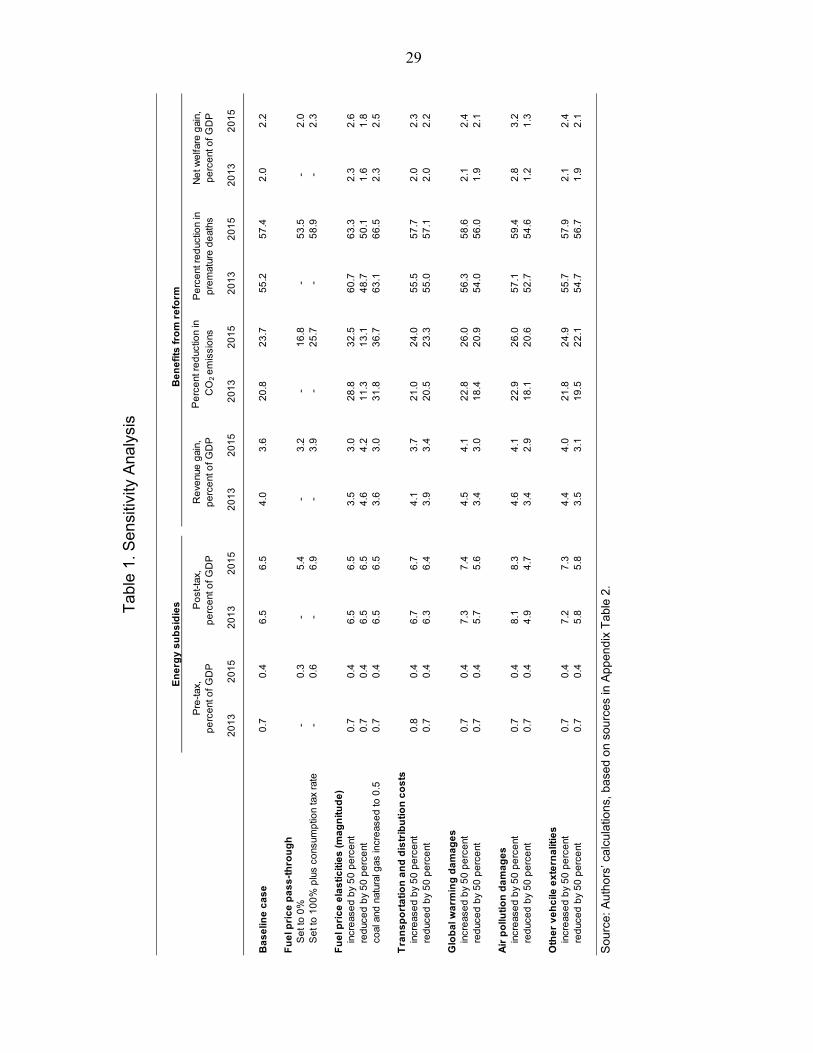
Some of the estimation methodologies and assumptions underlying the above results may be subject to large uncertainties and controversies. This includes estimates of the pass-through of international price changes to domestic prices; price elasticities; transportation and distribution margins; and global warming, air pollution, and other vehicle externalities. Table 1 summarizes various sensitivity analyses, focusing on global energy subsidies, and
28
reform benefits for 2013 and 2015. In general, the results are only moderately sensitive to different assumptions.
Figure 12. Welfare Gain from Removing Energy Subsidies, 2013
(US$ billions on top axis; percent global/regional GDP on bottom axis)
Source: Authors’ calculations, based on sources in Appendix Table 2. Note: CIS = Commonwealth of Independent States; ED Asia = Emerging and Developing Asia, LAC = Latin America and the Caribbean; MENAP = Middle East, North Africa, Afghanistan, and Pakistan.
For example, increasing or decreasing carbon damages, local air pollution damages, or other vehicle externalities one at a time by 50 percent, implies post-tax subsidies in 2013 of between 4.9 and 8.1 percent of global GDP, revenue gains between 3.4 and 4.6 of global GDP, reductions of CO2 emissions between 18.1 and 22.9 percent, reduction in premature deaths between 52.7 and 57.1, and welfare gains between 1.2 and 2.8 percent of global GDP.
Varying energy price elasticities affects only the gains from policy reform, although the results here are fairly sensitive to different assumptions. Increasing or decreasing all energy price elasticities by 50 percent relative to their baseline levels implies CO2 reductions of 11.3–28.8 percent and premature death reductions of 48.7–60.7 percent. And using coal and natural gas price elasticities of –0.5 (that is, the same as for petroleum elasticities), as assumed in Parry and others (2014), implies diminished revenue gains of 3.6 percent of global GDP in 2013 and larger environmental benefits, with reductions in CO2 and premature deaths of 31.8 percent and 63.1 percent, respectively. Finally, 2015 projections are somewhat sensitive to different assumptions about the pass-through of price changes, and insensitive to the levels of transportation and distribution costs.
0 500 1,000 1,500 2,000
0 2 4 6 8
MENAPSub-Saharan AfricaCom. Of Ind. States
E.D. AsiaEmerging Europe
AdvancedLAC
World
MENAPSub-Saharan AfricaCom. Of Ind. States
E.D. AsiaEmerging Europe
AdvancedLAC
World
US$ billions (nominal)
Percent of GDPCoal Petroleum Natural gas Electricity
29
Tab
le 1
. Sen
sitiv
ity A
naly
sis
S
ourc
e: A
utho
rs’ c
alcu
latio
ns, b
ased
on
sou
rces
in A
ppen
dix
Tab
le 2
.
20
13
20
15
20
13
20
15
20
13
20
15
20
13
20
15
20
13
20
15
20
13
20
15
Ba
se
line
ca
se
0.7
0.4
6.5
6.5
4.0
3.6
20
.82
3.7
55
.25
7.4
2.0
2.2
Fu
el p
ric
e p
as
s-t
hro
ug
hS
et t
o 0
%-
0.3
-5
.4-
3.2
-1
6.8
-5
3.5
-2
.0S
et t
o 1
00
% p
lus
cons
ump
tion
tax
rate
-0
.6-
6.9
-3
.9-
25
.7-
58
.9-
2.3
Fu
el p
ric
e e
las
tic
itie
s (
ma
gn
itu
de
)in
cre
ase
d b
y 5
0 p
erc
ent
0.7
0.4
6.5
6.5
3.5
3.0
28
.83
2.5
60
.76
3.3
2.3
2.6
red
uce
d b
y 5
0 p
erc
ent
0.7
0.4
6.5
6.5
4.6
4.2
11
.31
3.1
48
.75
0.1
1.6
1.8
coal
and
nat
ural
gas
incr
eas
ed
to 0
.50
.70
.46
.56
.53
.63
.03
1.8
36
.76
3.1
66
.52
.32
.5
Tra
ns
po
rta
tio
n a
nd
dis
trib
uti
on
co
sts
incr
eas
ed
by
50
pe
rce
nt0
.80
.46
.76
.74
.13
.72
1.0
24
.05
5.5
57
.72
.02
.3re
duc
ed
by
50
pe
rce
nt0
.70
.46
.36
.43
.93
.42
0.5
23
.35
5.0
57
.12
.02
.2
Glo
ba
l wa
rmin
g d
am
ag
es
incr
eas
ed
by
50
pe
rce
nt0
.70
.47
.37
.44
.54
.12
2.8
26
.05
6.3
58
.62
.12
.4re
duc
ed
by
50
pe
rce
nt0
.70
.45
.75
.63
.43
.01
8.4
20
.95
4.0
56
.01
.92
.1
Air
po
lluti
on
da
ma
ge
sin
cre
ase
d b
y 5
0 p
erc
ent
0.7
0.4
8.1
8.3
4.6
4.1
22
.92
6.0
57
.15
9.4
2.8
3.2
red
uce
d b
y 5
0 p
erc
ent
0.7
0.4
4.9
4.7
3.4
2.9
18
.12
0.6
52
.75
4.6
1.2
1.3
Oth
er
ve
hc
ile e
xte
rna
litie
sin
cre
ase
d b
y 5
0 p
erc
ent
0.7
0.4
7.2
7.3
4.4
4.0
21
.82
4.9
55
.75
7.9
2.1
2.4
red
uce
d b
y 5
0 p
erc
ent
0.7
0.4
5.8
5.8
3.5
3.1
19
.52
2.1
54
.75
6.7
1.9
2.1
Be
ne
fits
fro
m r
efo
rm
Pre
-tax
, p
erc
ent
of
GD
PP
ost
-tax
, p
erc
ent
of
GD
P
En
erg
y s
ub
sid
ies
Re
venu
e g
ain,
p
erc
ent
of
GD
PP
erc
ent
re
duc
tion
in C
O2
em
issi
ons
Pe
rce
nt r
ed
uctio
n in
p
rem
atur
e d
eat
hsN
et w
elfa
re g
ain,
p
erc
ent
of
GD
P
30
V. CONCLUSIONS
Global post-tax energy subsidies—after incorporating the most recent estimates of the environmental damage from energy consumption—are substantially higher than previously estimated. The estimate for 2011—at $4.2 trillion (5.8 percent of global GDP)—is more than double the amount reported by Clements and others (2013). The estimate grows to $4.9 trillion (6.5 percent of global GDP) in 2013 and is projected to remain high at $5.3 trillion (6.5 percent of global GDP) in 2015 despite the large drop in international energy prices. This trend suggests that energy subsidy reform is as urgent as ever, in particular to tackle the un-priced externalities from energy consumption. Low international energy prices provide a window of opportunity for countries to eliminate pre-tax subsidies and raise energy taxes as the public opposition to reform is likely to be somewhat more muted.
Of course, energy subsidies vary substantially by region and so does the urgency of reform. In dollar terms, Emerging and Developing Asia accounts for about half of post-tax subsidies in 2013, and advanced economies account for about one-quarter. Emerging and Developing Asia and CIS countries have the highest energy subsidies in terms of percent of regional GDP, at more than 16 percent in both regions on average. Much of this is due to the high level of coal use in these regions where subsidies for coal are estimated at about $2 trillion (2.7 percent of global GDP or more than 40 percent of global post-tax subsidies) in 2013 and are projected to reach $2.5 trillion in 2015 (3.1 percent of global GDP or nearly 50 percent of global subsidies), reflecting significantly larger negative health effects in developing countries. Therefore, reforming coal subsidies through an environmental tax should be at the top of the policy agenda of these countries to limit the environmental damage from coal consumption.
This does not mean that subsidy reform for other energy products is less important. In fact, petroleum subsidies are also high—at about $1.6 trillion (2.2 percent of global GDP) in 2013—and are projected to remain high at $1.4 trillion (1.7 percent of global GDP) in 2015. Petroleum subsidy reform is particularly important for advanced economies as they account for the largest share at about 44 percent in 2015. Natural gas subsidies accounted for about $510 billion in 2015 and are most significant in the CIS, where they cost just below 4 percent of regional GDP. Electricity subsidies cost about $148 billion in 2015 and are costly across the developing economies.
While externality cost accounts for the bulk of the post-tax energy subsidies, at more than 80 percent in both 2013 and 2015, a detailed examination reveals that about three-fourths of these subsidies are related to local environmental damages and only about a quarter are due to global warming effect of CO2 emissions. This suggests that most of the environmental benefits from energy subsidy reform would accrue to the local population. Our estimates indicate that removing post-tax energy subsidies could reduce premature deaths from local air pollution by more than 50 percent on average. In addition, energy subsidy reform could

31
generate a substantial fiscal dividend in government revenues, estimated at $3.0 trillion (4.0 percent of global GDP) in 2013 and projected to reach $2.9 trillion (3.6 percent of global GDP) in 2015. This would be particularly important for countries that are facing high debt levels or fiscal imbalances. Thus, there are compelling reasons for countries to move ahead with energy subsidy reform unilaterally for their own good. Of course, these reforms—moving energy prices to efficient levels excluding global warming damage—would also bring substantial benefits for climate change with a CO2 emission reduction of 17 percent in 2015. This compares to a reduction of 24 percent when energy prices are increased to the fully efficient levels.
Energy subsidy reform could improve social welfare significantly, estimated at $1.4 trillion (2 percent of global GDP) in 2013 and projected at $1.8 trillion (2.2 percent of global GDP). If the fiscal gain is used to reduce distortionary labor taxes or to increase productive public spending on education, health, and public investment, the total welfare gain from energy subsidy reform could be even larger. This reinforces the case for unilateral action by countries.
While energy subsidy reform is clearly beneficial from the view of the entire society, there are potentially important distributional issues as the fiscal and environmental benefits and the welfare loss from consumption reduction may accrue to different segments of the population. For example, most of environmental benefits may go to urban populations. This creates winners and losers from energy subsidy reform, which can introduce major obstacles to achieving energy subsidy reform. In addition, energy subsidy reform should protect the poor and vulnerable, making sure their well-being is not adversely affected. The proper use of the fiscal gain would be crucial in addressing this issue as well as the overall distributional impact of reform benefits. Higher energy prices will also harm energy-intensive firms. While, in the longer run, resources need to move out of activities that cannot be profitable with socially appropriate energy prices, transitory assistance may be needed, such as worker retraining programs and temporary relief for firms. The pace and sequencing of subsidy reform should therefore reflect the need to strengthen the capacity of some governments to develop effective policy instruments to protect vulnerable groups. Existing studies also highlight the importance of having a comprehensive and well communicated reform strategy addressing distributional concerns and other reform barriers (Clements and others 2014).
In summary, environmental damages from energy subsidies are large, and energy subsidy reform through efficient energy pricing is urgently needed. While there may be more efficient instruments than environmental taxes for addressing some of the externalities, energy taxes remain the most effective and practical tool until such other instruments become widely available and implemented. Similarly, although it may not be realistic to raise energy prices to efficient levels in one step, since there are uncertainties in the estimates of efficient levels of taxes, countries should take advantage of the low international energy prices and gradually move toward efficient energy pricing.

32
Appendix 1. Existing Estimates of Energy Subsidies
This appendix summarizes the existing literature on global energy subsidies.
The International Energy Agency (IEA) reports its estimate of global energy subsidies in its annual World Energy Outlook. This estimate is based on the price-gap approach, which compares the end-user prices with reference prices. The reference prices consist of supply cost inclusive of shipping cost and margins and any value-added tax. The latest estimate indicates that fossil-fuel consumption subsidies worldwide amounted to $548 billion in 2013, a slight increase from $523 in 2011 (IEA 2012; IEA 2014).
The estimate by the Organization for Economic Co-operation and Development (OECD) is based on the so called inventory approach. This method focuses on direct budgetary support and tax expenditures that provide a benefit or preference for fossil-fuel production or consumption, either in absolute terms or relative to other activities or products. The OECD estimate for energy subsidies in 34 OECD countries amounted to $50–90 billion annually between 2005 and 2011 (OECD 2013).
The IMF also adopted the price-gap approach and provides subsidy estimates based on two definitions of energy subsidies. Pre-tax subsidies compare consumer prices with supply cost, and post-tax subsidies compare consumer prices with supply cost plus the efficient level of taxation which includes an excise component for externalities and a consumption tax component for revenue considerations (Clements and others 2013). The IMF estimated that pre-tax energy subsidies were $492 billion and post-tax energy subsidies were $2.0 trillion in 2011.
The IMF pre-tax subsidies are slightly lower than the IEA estimate. One of the reasons for the difference is that the IEA estimate includes some tax subsidies. The IMF post-tax subsidies, on the other hand, are substantially higher than the IEA estimate because the IEA reference prices do not incorporate the environmental cost of energy consumption. The OECD estimate is much smaller than those of IEA and IMF, partly because it only covers advanced economies. Similar to the IEA estimates, the OECD estimates do not take into account the implicit subsidies from the environmental costs of energy consumption.

33
Ap
pen
dix
2. R
egio
nal
Cla
ssif
icat
ion
of
Cou
ntr
ies
Ap
pen
dix
Tab
le 1
. R
egio
nal
Cla
ssif
icat
ion
of
Co
un
trie
s
Adva
nced
Eco
nom
ies
Com
mon
wea
lth o
f In
depe
nden
t Sta
tes
Emer
ging
and
D
evel
opin
g As
iaEm
ergi
ng E
urop
eLa
tin A
mer
ica
and
the
Carib
bean
Mid
dle
East
, Nor
th A
fric
a, a
nd
Paki
stan
Sub-
Saha
ra A
fric
a
Aust
ralia
Arm
enia
Bang
lade
shAl
bani
aAn
tigua
and
Bar
buda
Afgh
anis
tan
Ango
laAu
stria
Azer
baija
nBr
unei
Dar
ussa
lam
Bosn
ia a
nd H
erze
govi
naAr
gent
ina
Alge
riaBe
nin
Belg
ium
Bela
rus
Cam
bodi
aBu
lgar
iaBa
ham
as, T
heBa
hrai
nBo
tsw
ana
Cana
daG
eorg
iaCh
ina
Croa
tiaBa
rbad
osD
jibou
tiBu
rkin
a Fa
soCy
prus
Kaza
khst
anIn
dia
FYR
Mac
edon
ia
Beliz
eEg
ypt
Cam
eroo
nCz
ech
Repu
blic
Kyrg
yz R
epub
licIn
done
sia
Hun
gary
Boliv
iaIra
nCa
pe V
erde
Den
mar
kM
oldo
vaM
alay
sia
Latv
iaBr
azil
Iraq
Cong
o, R
epub
lic o
fEs
toni
aRu
ssia
Mon
golia
Lith
uani
aCh
ileJo
rdan
Côte
d'Iv
oire
Finl
and
Tajik
ista
nM
yanm
arM
onte
negr
o, R
ep. o
fCo
lom
bia
Kuw
ait
Dem
ocra
tic R
epub
lic o
f the
Con
goFr
ance
Turk
men
ista
nN
epal
Pola
ndCo
sta
Rica
Leba
non
Equa
toria
l Gui
nea
Ger
man
yU
krai
nePa
pua
New
Gui
nea
Rom
ania
Dom
inic
aLi
bya
Ethi
opia
Gre
ece
Uzb
ekis
tan
Phili
ppin
esSe
rbia
Dom
inic
an R
epub
licM
aurit
ania
Gab
onH
ong
Kong
SAR
Sri L
anka
Turk
eyEc
uado
rM
oroc
coG
hana
Icel
and
Thai
land
El S
alva
dor
Om
anKe
nya
Irela
ndVi
etna
mG
rena
daPa
kist
anLe
soth
oIs
rael
Gua
tem
ala
Qat
arM
adag
asca
rIta
lyG
uyan
aSa
udi A
rabi
aM
alaw
iJa
pan
Hai
tiSu
dan
Mal
iKo
rea
Hon
dura
sTu
nisi
aM
ozam
biqu
eLu
xem
bour
gJa
mai
caU
nite
d Ar
ab E
mira
tes
Nam
ibia
Mal
taM
exic
oYe
men
Nig
eria
Net
herla
nds
Nic
arag
uaRw
anda
New
Zea
land
Pana
ma
Sene
gal
Nor
way
Para
guay
Sout
h Af
rica
Port
ugal
Peru
Tanz
ania
Sing
apor
eSt
. Kitt
s an
d N
evis
Uga
nda
Slov
ak R
epub
licSu
rinam
eZa
mbi
aSl
oven
iaTr
inid
ad a
nd T
obag
oZi
mba
bwe
Spai
nU
rugu
aySw
eden
Vene
zuel
aSw
itzer
land
Taiw
an P
rovi
nce
of C
hina
Uni
ted
King
dom
Uni
ted
Stat
es

34
Appendix 3. Data Sources
This appendix summarizes the data sources that are used in estimating energy subsidies and the welfare, fiscal, and environmental impacts of energy subsidy reform (Appendix Table 2).
Appendix Table 2. Data Sources: Year and Country Coverage
Retail prices
Retail prices are taken in various frequencies (monthly, quarterly, annual average, end-of-period). In the calculation of subsidies, these prices are converted to a single annual average price. End-of-year prices are assumed to be equal to the beginning of the following year, and are included in the calculation of average price for both years, although they are only weighted one-half the weight of all other observations during the year.
Source Countries covered Time periodInternational Energy Agency
Petroleum product consumption 134 2010-2012Coal consumption 107 2010-2012Natural gas consumption 110 2010-2012Electricity production input mix 137 2010-2012Petroleum product and electricity prices and taxes 33 2010-2014Pre-tax subsidy estimates (coal, natural gas, electricity) 40 2010-2013Fuel product spot prices (USA; NW Europe; Singapore) - 2010-2014
USA Energy Information AgencyNatural gas consumption growth (2013) 40 2013Fuel consumption growth (2013) 134 2013Electricity consumption 91 2010-2012Electricity retail price 14 2010-2012
Organization of Economic Co-operation and DevelopmentProducer support estimates 33 2010-2011
IMFFuel retail prices 100 2010-2014Corrective tax estimates 150 2010VAT database 147 2010-2013Electricity subsidy estimates (including update of World Bank estimates) 27 2009-2011Electricity subsidy estimates from Di Bella and others, 2015 32 2011-2013Electricity tarrif and cost-recovery price 27 2007-2010Oil international port price projections (US WTI; Brent; Dubai) - 2010-2015Natural gas international port price (US Henry Hub; Germany; Japan) - 2010-2015Col international port price (Australia; South Africa) - 2010-2015Other macroeconomic data - 2010-2015
British PetroleumElectricity consumption 31 2012-2013
World BankElectricity subsidy estimates 4 2009
Other press reportsElectricity retail price 12 2010-2011

35
For petroleum products, prices are taken from two sources: the International Energy Agency’s quarterly database on fuel prices and taxes, and the IMF’s existing fuel price dataset. The IEA’s dataset, which provides annual average retail prices as well as prices net of existing taxes, is used when available. The IMF dataset is primarily monthly, and only includes retail pump prices. It is compiled from data provided by national regulatory agencies, IMF staff, and monitoring of news reports.20 Other prices come from single points in time, usually mid-year and/or end-year, and are provided by IMF staff. The IMF database is used when observations are unavailable from the IEA.
For coal and natural gas, retail prices are imputed based on estimates of energy pre-tax subsidies from the IEA. A per-unit pre-tax subsidy is estimated and is subtracted from the world price. This retail price includes any existing taxes. Retail price is assumed to be equal to supply price for countries without existing estimates of pre-tax subsidies.
For electricity, prices are taken from the IEA quarterly database on household electricity prices when available. Otherwise they are taken from the EIA, IMF and World Bank staff, or from monitoring of news reports. Prices from the IEA and EIA are annual average prices. All other prices are a mix of annual average price and prices at specific points in time. Since supply cost is difficult to estimate across countries, pre-tax and post-tax subsidies are only estimated for countries with detailed estimates done by the IEA or by IMF and World Bank staff.
Supply cost
Supply cost is calculated on an annual basis. The observations used to calculate supply cost correspond to the given fuel’s retail price. So, if a country has only an end-year retail price then the only supply price used should be based on end-year data. Conversely, if a country has an annual average retail price, or monthly price data, then an average supply price is calculated.
For petroleum products, the supply price has two components: port (or hub) price and the cost of margins and shipping. Port prices are taken from the IEA and correspond to the United States, NW Europe, and Singapore. Countries are mapped to one of these three ports based on region. The cost of margins and shipping are included in the pre-tax price provided by the IEA. For all other countries these costs are assumed to be $0.20 per liter if the country is a net-importer of oil and zero otherwise.
For natural gas, the supply price is taken from the IMF and has only one component, the port price. Port prices come from Henry Hub USA, the Russian export price to Germany, and Japan. Countries are mapped to one of these three prices based on region. No adjustment is done for shipping and margins.
20 For more information on the construction of the database, see Kpodar, Abdallah, and Sears (forthcoming).

36
For coal, the supply price is taken from the IMF and has only one component, the port price. Port prices come from South Africa and Australia. An average of the two is used for all countries. No adjustment is done for shipping and margins.
Electricity supply price is difficult to measure, since cost varies greatly depending on input mix and the scale of operations, so the supply price is taken from other sources. For countries with pre-tax subsidy estimates supply cost is assumed to equal the electricity retail price plus the unit pre-tax subsidy. For all other countries, the supply cost is unknown and subsidies are not estimated.
Externality cost
Externality cost estimates are available for petroleum products, natural gas, and coal (but not for electricity to avoid double-counting). These estimates are drawn from Parry and others (2014), in which they are explained in greater detail. They pertain to the cost of damages from CO2 emissions or global warming, local air pollution (damages relating to SO2, NOx, PM2.5, and VOCs), traffic congestion and accidents, and road damage. Estimates are available for 150 countries, and in other cases are estimated based on the average of countries in the same region and income level.
For petroleum products, the externality cost is calculated separately for each fuel (gasoline, diesel, and kerosene) and for use in transportation as well as use outside of transportation. For petroleum products, air pollution includes damages from SO2, NOx, PM2.5, and VOCs. For gasoline used in transportation, damages include global warming from CO2 emissions, local air pollution, and traffic congestion and accidents. For all other energy consumption, only damages related to CO2 and local air pollution are considered. For diesel used in transportation, damages include global warming, local air pollution, traffic congestion and accidents, and road damage by trucks. For all other energy consumption, only global warming and local air pollution are considered. Kerosene is assumed not to be used in ground transportation. Therefore, only the cost of damages from CO2 emissions and local air pollution are included. The cost of these externalities is assumed to be the same as the corresponding externalities from diesel.
For natural gas, the externality cost is calculated separately for consumption used for electricity generation and by households (heating). In both cases, the damage from CO2 emissions and local air pollution are considered. Local air pollution includes damages from SO2, NOx, and PM2.5, but the damages from these particles differ between the two types of consumption.
Coal externalities consist of CO2 emissions and local air pollution from SO2, NOx, and PM2.5. These externalities are estimated based on the current use of emissions control technology in each country. However, in the estimation of the fiscal, environmental and welfare impact of subsidy pricing reform, emissions reduction estimates are calculated assuming that coal users adopt these control technologies as coal prices are raised.
37
Consumption tax
Energy consumption should be taxed at the same rate as other consumption goods for revenue purposes. The consumption tax (VAT or GST) is assessed on the sum of the supply cost and the externality cost. For all products, this is applied only to final consumption (residential use, commercial and public services), not intermediate use.
Energy consumption
Energy consumption data are taken from the IEA for fuels, coal, and natural gas, and from British Petroleum for electricity where the most recent year available is 2012. Consumption data for all petroleum products combined are available from EIA for 2013 and the same growth rate is applied to IEA 2012 data to project petroleum consumption in 2013. Otherwise, consumption is assumed to growth with real GDP. The estimation often requires information on energy use by function, which is based on IEA data and includes fuel use for transportation and non-transportation, natural gas use for electricity generation and other consumption, and the fuel mix for electricity generation. For all consumption, it is assumed that final consumption consists of the use by residential, commercial and public services, as classified by the IEA.
Data pertaining to the composition of consumption (shares of final consumption and transport consumption), the electricity production input mix, electricity price, and the prevailing VAT or GST rates are not always available in all countries. When unavailable, they are assumed to equal the average value for countries in the same region with similar income levels.
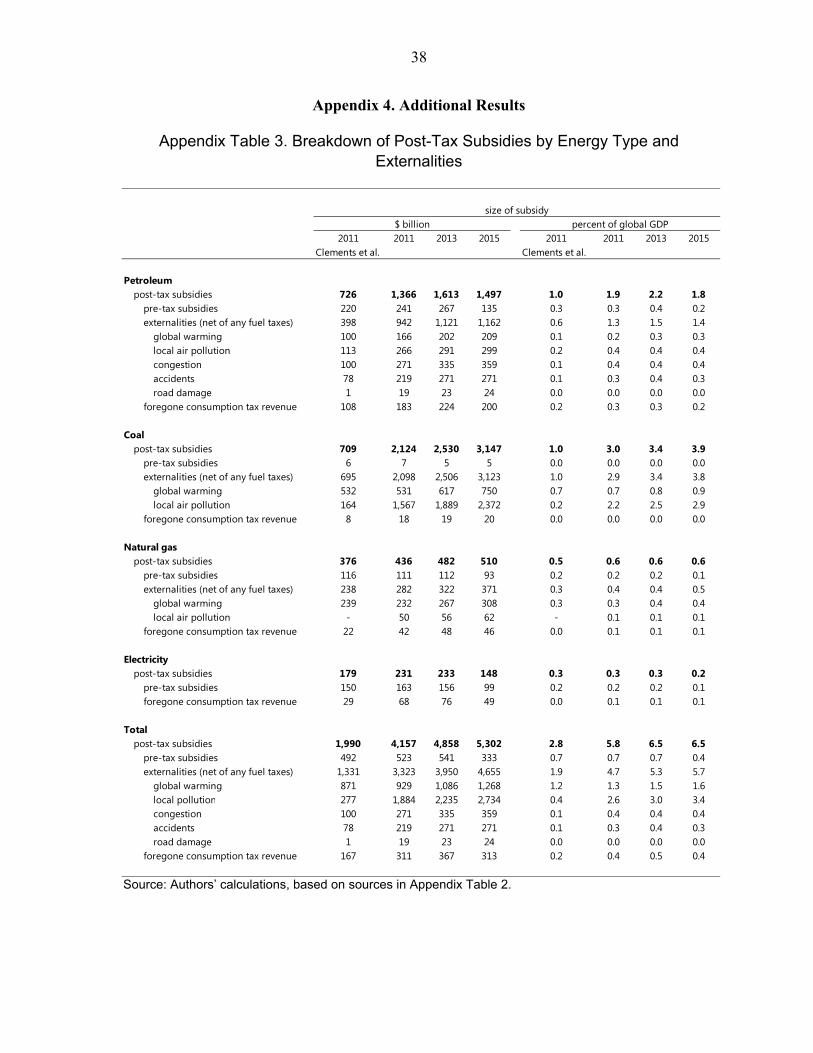
38
Appendix 4. Additional Results
Appendix Table 3. Breakdown of Post-Tax Subsidies by Energy Type and Externalities
Source: Authors’ calculations, based on sources in Appendix Table 2.
2011 2011 2013 2015 2011 2011 2013 2015Clements et al. Clements et al.
post-tax subsidies 726 1,366 1,613 1,497 1.0 1.9 2.2 1.8220 241 267 135 0.3 0.3 0.4 0.2398 942 1,121 1,162 0.6 1.3 1.5 1.4100 166 202 209 0.1 0.2 0.3 0.3113 266 291 299 0.2 0.4 0.4 0.4100 271 335 359 0.1 0.4 0.4 0.478 219 271 271 0.1 0.3 0.4 0.31 19 23 24 0.0 0.0 0.0 0.0
108 183 224 200 0.2 0.3 0.3 0.2
post-tax subsidies 709 2,124 2,530 3,147 1.0 3.0 3.4 3.96 7 5 5 0.0 0.0 0.0 0.0
695 2,098 2,506 3,123 1.0 2.9 3.4 3.8532 531 617 750 0.7 0.7 0.8 0.9164 1,567 1,889 2,372 0.2 2.2 2.5 2.98 18 19 20 0.0 0.0 0.0 0.0
post-tax subsidies 376 436 482 510 0.5 0.6 0.6 0.6116 111 112 93 0.2 0.2 0.2 0.1238 282 322 371 0.3 0.4 0.4 0.5239 232 267 308 0.3 0.3 0.4 0.4
- 50 56 62 - 0.1 0.1 0.122 42 48 46 0.0 0.1 0.1 0.1
post-tax subsidies 179 231 233 148 0.3 0.3 0.3 0.2150 163 156 99 0.2 0.2 0.2 0.129 68 76 49 0.0 0.1 0.1 0.1
post-tax subsidies 1,990 4,157 4,858 5,302 2.8 5.8 6.5 6.5492 523 541 333 0.7 0.7 0.7 0.4
1,331 3,323 3,950 4,655 1.9 4.7 5.3 5.7871 929 1,086 1,268 1.2 1.3 1.5 1.6
local pollution 277 1,884 2,235 2,734 0.4 2.6 3.0 3.4congestion 100 271 335 359 0.1 0.4 0.4 0.4accidents 78 219 271 271 0.1 0.3 0.4 0.3road damage 1 19 23 24 0.0 0.0 0.0 0.0
167 311 367 313 0.2 0.4 0.5 0.4foregone consumption tax revenue
Petroleum
Electricity
pre-tax subsidiesforegone consumption tax revenue
Total
pre-tax subsidiesexternalities (net of any fuel taxes)
Coal
pre-tax subsidiesexternalities (net of any fuel taxes)
global warming
foregone consumption tax revenue
size of subsidy$ billion percent of global GDP
global warming
road damageforegone consumption tax revenue
pre-tax subsidiesexternalities (net of any fuel taxes)
Natural gas
pre-tax subsidiesexternalities (net of any fuel taxes)
global warminglocal air pollution
local air pollutionforegone consumption tax revenue
global warminglocal air pollutioncongestionaccidents

39
REFERENCES
Anderson, Soren, and Ian Parry. 2011. “Automobile Fuel Economy Standards: Impacts. Efficiency, and Alternatives.” Review of Environmental Economics and Policy Vol. 5(1).
Arze del Granado, Javier, David Coady, and Robert Gillingham. 2012. “The Unequal Benefits of Fuel Subsidies: A Review of Evidence for Developing Countries.” World Development 40 (November): 2234–48.
Ballard, Charles, John Shoven, and John Whalley. 1982. “The Welfare Cost of Distortions in the United States Tax System: A General Equilibrium Approach.” NBER Paper 1043, National Bureau of Economic Research, Cambridge, Massachusetts.
Bárány, Ambrus, and Dalia Grigonytė. 2015. “Measuring Fossil Fuel Subsidies.” ECFIN Economic Brief, Issue 40, European Commission, Brussels.
Bento, Antonio, Mark Jacobsen, and Antung A. Liu. 2012. “Environmental Policy in the Presence of an Informal Sector.” Discussion paper, Cornell University, Ithaca, New York.
Breisinger Clemens, Wilfried Engelke, and Oliver Ecker. 2011. “Petroleum Subsidies in Yemen: Leveraging Reform for Development.” Policy Research Working Paper 5577, World Bank, Washington.
Burniaux, Jean-Marc, Jean Chateau, Romain Duval, and Stéphanie Jamet. 2009. “The Economics of Climate Change Mitigation: How to Build the Necessary Global Action in a Cost-Effective Manner.” OECD Economics Department Working Papers 701, Organisation for Economic Co-operation and Development, Paris.
Clements, Benedict, David Coady, Stefania Fabrizio, Sanjeev Gupta, and Baoping Shang. 2014. “Energy Subsidies: How Large Are They and How Can They Be Reformed?” Economics of Energy and Environmental Policy 3 (1).
Clements, Benedict, David Coady, Stefania Fabrizio, Sanjeev Gupta, Trevor Serge Coleridge Alleyne, Carlo A Sdralevich, eds. 2013. Energy Subsidy Reform: Lessons and Implications. Washington: International Monetary Fund.
Clements, Benedict, Hong-Sang Jung, and Sanjeev Gupta. 2007. “Real and Distributive Effects of Petroleum Price Liberalization: The Case of Indonesia.” The Developing Economies 45 (2): 220–37.
Dahl, Carol. 2012. “Measuring Global Gasoline and Diesel Price and Income Elasticities.” Energy Policy 4: 2–13.

40
Davis, Lucas. 2014. “The Economic Cost of Global Fuel Subsidies.” American Economic Review: Papers & Proceedings 104(5): 581–85.
Di Bella, Gabriel, Lawrence Norton, Joseph Ntamatungiro, Sumiko Ogawa, Issouf Samake, and Marika Santoro. 2015. “Energy Subsidies in Latin America and the Caribbean: Stocktaking and Policy Challenges.” IMF Working Paper, 15/30, International Monetary Fund, Washington.
Diamond, Peter A., and James A. Mirrlees. 1971. “Optimal Taxation and Public Production I: Production Efficiency” and “II: Tax Rules.” American Economic Review 61: 8–27 and 261–78.
Ellis, Jennifer. 2010. “The Effects of Fossil-Fuel Subsidy Reform: A Review of Modelling and Empirical Studies.” In Untold Billions: Fossil-Fuel Subsidies Their Impacts and the Path to Reform. Geneva: Global Subsidies Initiative.
Escribano, Alvaro, J. Luis Guasch, and Jorge Pena. 2008. “A Robust Assessment of the Impact of Infrastructure on African Firms’ Productivity.” Africa Infrastructure Country, Diagnostic Working Paper, Washington, World Bank.
Feldstein, Martin. 1999. “Tax Avoidance and the Deadweight Loss of the Income Tax.” Review of Economics and Statistics 81 (4).
Fofana, Ismaél, Margaret Chitiga, and Ramos Mabugu. 2009. “Oil Prices and the South African Economy: A Macro-Meso-Micro Analysis.” Energy Policy 37 (December): 5509–18.
Gelb, Alan and others. 1988. Oil Windfalls: Blessings or Curse? New York: Oxford University Press.
Heggie, Ian G., and Piers Vickers. 1998. “Commercial Management and Financing of Roads.” World Bank Technical Paper 409, World Bank, Washington. http://documents.worldbank.org/curated/en/1998/05/441617/commercial-managementfinancing-roads.
International Energy Agency (IEA). 2012. World Energy Outlook. Paris: International Energy Agency.
———. 2014. World Energy Outlook. Paris: International Energy Agency.
International Monetary Fund (IMF). 2014. World Economic Outlook. Washington.

41
Koplow, Doug. 2009. “Measuring Energy Subsidies Using the Price-Gap Approach: What Does It Leave Out?” International Institute for Sustainable Development, Winnipeg, Manitoba, Canada https://www.iisd.org/pdf/2009/bali_2_copenhagen_ff_subsidies_pricegap.pdf .
Kpodar, Kangni Roland, Chadi Abdallah, and Louis Sears. Forthcoming. “A New Database on Retail Fuel Prices around the World.” International Monetary Fund, Washington.
Krupnick, Alan J., Ian Parry, Margaret Walls, Tony Knowles, and Kristin Hayes. 2012. “Toward a New National Energy Policy: Assessing the Options.” Resources for the Future and National Energy Policy Institute, Washington.
Kumar, Manmohan S., and Jaejoon Woo. 2010. “Public Debt and Growth” IMF Working Paper 10/174, International Monetary Fund, Washington. http://www.imf.org/external/pubs/ft/wp/2010/wp10174.pdf.
Liu, Gang. 2004. “Estimating Energy Demand Elasticities for OECD Countries: A Dynamic Panel Data Approach.” Discussion Paper 373, Statistics Norway, Oslo.
Lofgren, Hans. 1995. “Macro and Micro Effects of Subsidy Cuts: A Short Run CGE Analysis for Egypt.” TMD Discussion Paper No. 5, International Food Policy Research Institute, Washington.
Nordhaus, William. 2011. “Estimates of the Social Cost of Carbon: Background and Results from the RICE-2011 Model.” NBER Working Paper 17540, National Bureau of Economic Research, Cambridge, Massachusetts.
Organisation for Economic Co-operation and Development (OECD). 2013. “Inventory of Estimated Budgetary Support and Tax Expenditures for Fossil Fuels.” Paris.
Parry, Ian. 2005. “Is Pay-as-You-Drive Insurance a Better Way to Reduce Gasoline than Gasoline Taxes?” American Economic Review 95 (2): 288–93.
———, and Antonio M. Bento. 2000. “Tax Deductions, Environmental Policy, and the “Double Dividend” Hypothesis.” Journal of Environmental Economics and Management, 39: 67–96.
———, and Kenneth A. Small. 2005. “Does Britain or the United States Have the Right Gasoline Tax?” American Economic Review 95 (4): 1276–89.
———, and Jon Strand. 2011. “International Fuel Tax Assessment: An Application to Chile.” IMF Working Paper 11/168, International Monetary Fund, Washington. http://www.imf.org/external/pubs/ft/wp/2011/wp11168.pdf.
42
———, Dirk Heine, Eliza Lis, and Shanjun Li. 2014. Getting Energy Prices Right: From Principle to Practice. Washington: International Monetary Fund.
Stern, Nicholas. 2006. Stern Review on the Economics of Climate Change. London: Her Majesty’s Treasury.
Sterner, Thomas. 2007. “Fuel Taxes: An Important Instrument for Climate Policy.” Energy Policy 35: 3194–202.
Trüby, Johannes, and Paulus Moritz. 2011. “Market Structure Scenarios in International Steam Coal Trade.” Working Paper 11/02, Institute for Energy Economics at the University of Cologne, Cologne.
United Nations Environment Programme (UNEP). 2008. “Reforming Energy Subsidies: Opportunities to Contribute to the Climate Change Agenda.” Division of Technology, Industry and Economics, Paris.
Interagency Working Group on Social Cost of Carbon, United States Government (US IAWG). 2013. “Technical Update of the Social Cost of Carbon for Regulatory Impact Analysis Under Executive Order 12866.” Washington.
van Benthem, Arthur. 2015. “What Is the Optimal Speed Limit on Freeways?” Journal of Public Economics 124: 44–62.
von Moltke, Anja, Colin McKee, and Trevor Morgan. 2004. Energy Subsidies: Lessons Learned in Assessing Their Impact and Designing Policy Reforms. Sheffield, United Kingdom: Greenleaf Publishing.
World Bank. 2014. State and Trends of Carbon Pricing. Washington: World Bank.
World Health Organization (WHO). 2014. “Public Health, Environmental and Social Determinants of Health.” Geneva. www.who.int/phe/health_topics/outdoorair/databases/en/.