How Kraft Foods Implemented and Uses FTI - OTM SIG · How Kraft Foods Implemented and Uses FTI Mark...
17
How Kraft Foods Implemented and Uses FTI Mark Kissell, Kraft Foods Brian Fish, Chainalytics August 13, 2012
Transcript of How Kraft Foods Implemented and Uses FTI - OTM SIG · How Kraft Foods Implemented and Uses FTI Mark...

How Kraft Foods Implemented and Uses FTI
Mark Kissell, Kraft Foods Brian Fish, Chainalytics
August 13, 2012
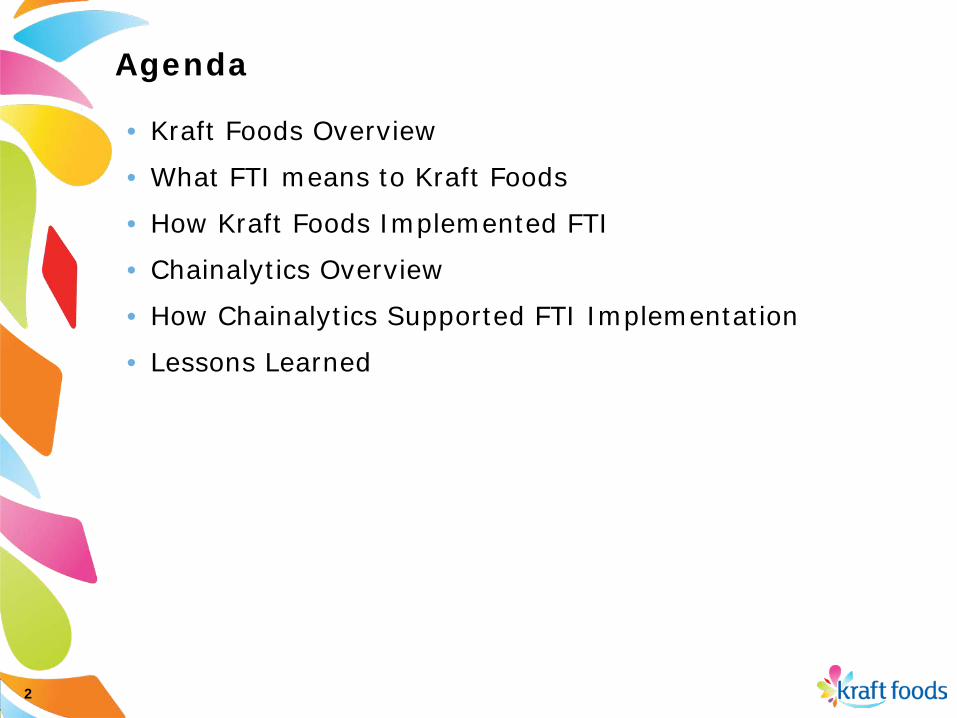
• Kraft Foods Overview
• What FTI means to Kraft Foods
• How Kraft Foods Implemented FTI
• Chainalytics Overview
• How Chainalytics Supported FTI Implementation
• Lessons Learned
2
Agenda

Kraft Foods Transportation Overview
• $1 Billion Transportation Spend
• 925,000 Annual Shipments
• 25,811 Origin/Destination Pairings
• 60,191 Lane Carrier Combinations
• 5 Protection Classes (Dry, Refer, Protected, Conditioned, Frozen)
• Top 30 Carriers Service 73% of the Business
• 8 Private terminals
• 7 Dedicated fleets positioned
3

Brief History of OTM at Kraft Foods
• Current Functionality in Use – Order Management – Shipment Planning and Execution
• Capacity Limit, Commitment and Allocation (SPA) • Spot Bid
– Cooperative Routing and XCR – Freight Pay (Shipments As Work, Invoices, and Vouchers) – FTI
• OTM manages transportation for following countries – US, Canada, and Russia finished good shipments – Brazil will be live by end of the year – Plans for remaining of Latin America to start in 2012
4

Why Did Kraft Implement FTI?
• Provide a business solution not a IT solution – Too costly to build new reports – Transportation did not control the data – Provide new reporting capabilities
• Data inaccuracies between reports and OTM
• SQL Queries, MS Access Databases
• Tool that provides historical information on planned and actual shipments as one shipment
• Lead users to the issues and exceptions – Goodbye data mining
• Need to understand Cost of Non Compliance
5

0.250 0.270 0.290 0.310 0.330 0.350 0.370 0.390 0.410 0.430 0.450 0.470 0.490 0.510 0.530 0.550 0.570 0.590 0.610
1 3 5 7 9 11 13 15 17 19 21 23 25 27 29 31 33 35 37 39 41 43 45 47 49 51
Week
Beverage Total $/Case Ex.Fuel $/Case Plan Ex.Fuel Total New Plan $/Case Ex.Fuel
PY Total $/Case Ex.Fuel Repl CY $/Case Ex.Fuel Cust CY $/Case Ex.Fuel
“Where do these numbers come from?”
“Why are we over budget? What’s driving it?”
“How did we arrive at that
planned cost?”
“How do I know if the size of the case is
impacting this metric?”
“Why do these numbers differ
depending on who is building the report?”
“Is this definition of a week the same as my
definition?” 6
Why Did Kraft Implement FTI?

FTI Implementation
• FTI Installation
• Business Requirements Gathering and Design
• FTI Report and Dashboard Development
• FTI Testing and Validation
• End User Training and Support
7

8
FTI Implementation
FTI Installation
OTM PROD Environment FTI
OBIEE Production
Environment
Web Tier
App Tier
DB Tier
ODI Client
OBIEE Components
OBIEE uses HDOWNER data to display FI reports on OTM screen.
ODI schedules data pulls from ROD and populates to FTI Master. Data is then populated from FTI Master to HDOWNER.
• OTM ROD
• FTI Master • MFI Stage • MTI Work
• FTI HDOWNER Oracle Materialized Views (Near Real Time)
DB Tier (GLOGOWNER)

Who is Chainalytics?
• Supply Chain Intelligence, Analytics, and Advisory Services – Our Specialized Knowledge allows us to achieve superior results, with fewer
people, in less time.
– We have developed and institutionalized Proprietary Content and Methods from hundreds of engagements over the last decade.
– We employ Advanced Analytical Tools and Techniques to assess impacts and predict outcomes across a wide range of strategic, tactical, and operational supply chain decisions.
• Services We Provide
• Our Locations: Atlanta, GA (HQ); Minneapolis, MN; Bangalore, India
9
Sales, Inventory, & Operations Planning
Transportation Packaging Optimization
Service Supply Chain
Supply Chain Design
Logistics Operations

FTI Implementation
Business Requirements Gathering and Design – Business FTI Implementation
10
Implement Solution
Design Reports
Develop Metrics
Establish Base Structure
2 3 4 1
• Define base cost, volume, and service calculations
• Define drilldown design components
• Assign functional owner to all move types
• Determine all potential cost and service drivers
• Define metrics, KPIs and exceptions to incorporate into reports
• Design all reports and drilldown hierarchies
• Design format of all reports and layout of the BI interface
• Document details of all reports and definitions of all BI components
• Facilitate training on how to utilize each report at each level of the organization

1. Establish Base Structure
• OD Catalogue provides definition of every functional owner in
the transportation organization (i.e. Inbound vs. Outbound, Beverage vs. Snacks)
• Most lane classifications will be straightforward, others will be surprisingly difficult
11
A database of all origin-destination pair types is developed.
Each OD-pair is categorized by channel, flowpath and flowtype, as well as assigned an owner within the transportation organization.
Each OD-pair is defined so all levels of the organization understand what the pair represents operationally.
OD-pairs are related to current accounting categories, and whether or not the statistics are include in metrics calculations.
Historical data helps determine the significance of the lane and whether it should be included in primary metrics calculations.

12
2. Develop Metrics
Routing Guide Effectiveness vs. Target
First Tender Accept vs. Target
10 Most Expensive Non-Compliance Lanes
10 Most Frequent No Resource Lanes
Top 10 Shipment Decliners By Carrier
Short Lead Time Orders % TOC Planning %
Cost and Performance Metrics • Provide insight into WHAT is happening • Best when compared to set targets
Key Performance Indicators (KPIs) • Provide insight into WHY things are
happening • Primary drivers of routing guide compliance
Exception Reports • Provide specific information on known issues • Follow drilldown hierarchy for more targeted actions
RTY vs. Target
Shipments Tendered 24 Hrs+ in Advance %
Shipments to Auction %
Weighted Avg. Cost of Non-Compliance
Actual Cost of Non-Compliance
Fiscal Year Fiscal Month Fiscal Week Report Filter • Allows filter of specific ship date range • Blank entries allow for monthly/annual views

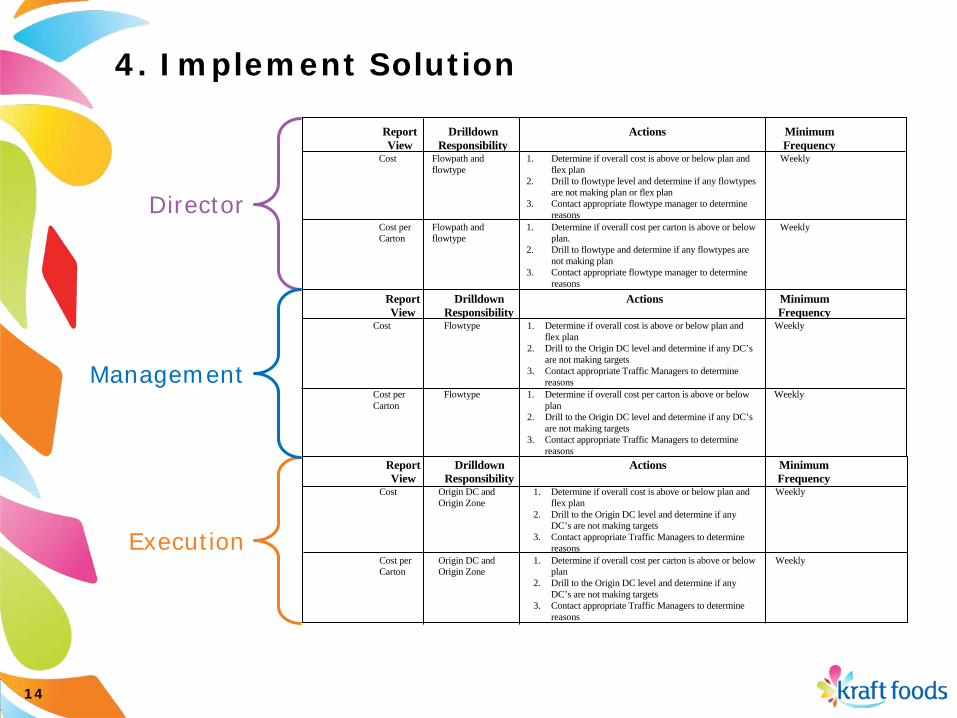
• Responsibilities overlap for “checks and balances” − Directors and Managers are expected to be responsible for higher
levels of drilldown, but can go to detail if desired
− Regular review schedules will be developed to support use of FTI for root cause analysis
3. Design Reports
13
All TOC-Planned Shipments
Business Unit (BU)
Capacity Planner
Origin Location Origin Location
Destination Location
Destination Location
Shipment Detail Shipment Detail
Director
Management
Execution
14
4. Implement Solution
Report Drilldown Actions Minimum View Responsibility Frequency
Cost Origin DC and 1. Determine if overall cost is above or below plan and Weekly Origin Zone flex plan
2. Drill to the Origin DC level and determine if any DC’s are not making targets
3. Contact appropriate Traffic Managers to determine reasons
Cost per Origin DC and 1. Determine if overall cost per carton is above or below Weekly Carton Origin Zone plan
2. Drill to the Origin DC level and determine if any DC’s are not making targets
3. Contact appropriate Traffic Managers to determine reasons
Execution
Report Drilldown Actions Minimum View Responsibility Frequency
Cost Flowtype 1. Determine if overall cost is above or below plan and Weekly flex plan
2. Drill to the Origin DC level and determine if any DC’s are not making targets
3. Contact appropriate Traffic Managers to determine reasons
Cost per Flowtype 1. Determine if overall cost per carton is above or below Weekly Carton plan
2. Drill to the Origin DC level and determine if any DC’s are not making targets
3. Contact appropriate Traffic Managers to determine reasons
Management
Director
Report Drilldown Actions Minimum View Responsibility Frequency
Cost Flowpath and 1. Determine if overall cost is above or below plan and Weekly flowtype flex plan
2. Drill to flowtype level and determine if any flowtypes are not making plan or flex plan
3. Contact appropriate flowtype manager to determine reasons
Cost per Flowpath and 1. Determine if overall cost per carton is above or below Weekly Carton flowtype plan.
2. Drill to flowtype and determine if any flowtypes are not making plan
3. Contact appropriate flowtype manager to determine reasons

FTI Implementation
• FTI Report and Dashboard Development – Two main dashboards: Routing Guide and Carrier Performance
• 7 Routing Guide pages, 12 reports per page • 19 Carrier Performance pages, 14 reports per page • Capability to report by BU, Capacity Planner, TOC Planner, Customer • Dashboards and reports provide consistent look and feel • Centrally managed reports, requirements and development
• FTI Testing and Validation – OTM to ROD testing – ROD to FTI testing – FTI Reports and Dashboard testing
• Do the drill downs work • Is the calculation pulling the correct data
15

FTI Implementation
• End User Training and Support – Group Session – One on One Sessions – Over 60 users trained on FTI
• Ongoing Report Request Process – Continue to expand use of FTI – Managed process to make sure only reports that provide value are
developed
16

Lessons Learned
• Challenge old reports – Only implement reports that provide value
• Let FTI tell you the problem, stop data mining
• Standardize your reports by using the same columns
• Learn how to customize ODI and OBIEE to improve your reporting capabilities
• Try to minimize your reports – Reuse report by adding more filters
• Watch Outs – Dates and time do not use time zones, update ODI to reflect the
time zone – Data deletes in OTM do not get reflected in FTI, setup Delete from
HD agent configuration
17