How important is ‘vehicle safety’ in the new vehicle purchase … · 2017-05-16 · vehicle...
125
Quality Criteria for the Safety Assessment of Cars Based on Real-World Crashes How important is ‘vehicle safety’ in the new vehicle purchase process? Report of Sub-Task 4.1
Transcript of How important is ‘vehicle safety’ in the new vehicle purchase … · 2017-05-16 · vehicle...

Quality Criteria for the Safety Assessment of CarsBased on Real-World Crashes
How important is ‘vehicle safety’in the new vehicle
purchase process?
Report of Sub-Task 4.1


CEA/EC SARAC II
QUALITY CRITERIA FOR THE SAFETY ASSESSME
OF CARS BASED ON REAL-WORLD CRASHES
Funded by the European Commission,
Directorate General TREN
SARAC II
Quality Criteria for the Safety Assessment of Cars
based on Real-World Crashes
Project Number: SUB/B27020B-E3-S07.17321-2002
REPORT of Sub-Task 4.1
How important is ‘vehicle safety’ in the new vehicle purchase process?
December, 2005


CEA/EC SARAC II
QUALITY CRITERIA FOR THE SAFETY ASSESSME
OF CARS BASED ON REAL-WORLD CRASHES
Funded by the European Commission,
Directorate General TREN
International Project Management Comité Européen des Assurances (CEA)
Prof. Dr. Klaus Langwieder
SARAC Members European Commission (EC)
DG TREN 28 Rue Demot
B-1040 Brussels
Comité Européen des Assurances (CEA) 26 Boulevard Haussmann
FR-75009 Paris
Monash University Accident Research Centre (MUARC)
Building 70, Clayton, 3800 Victoria, Australia
Helsinki University of Technology Laboratory of Transportation Engineering
P.O. Box 2100 FIN-02015 HUT, Finland
BMW Group Vehicle Safety D-80788 München
Bundesanstalt für Straßenwesen (BASt) Brüderstraße 53 D-51427 Bergisch Gladbach
Centro Zaragoza Instituto de Investigación Sobre Reparación de Vehiculos, S.A. Carretera Nacional 232, km 273 E-50690 Pedrola (Zaragoza)
DaimlerChrysler AG D-71059 Sindelfingen
Department for Transport Zone 1/29a Great Minister House 76 Marsham Street London, SW1P 4DR United Kingdom
FIA Foundation for the Automobile and Society 8 Place de la Concorde Paris 75008 France
Ministry of Transport and Communications of Finland P.O. Box 31 FIN 0023 Helsinki
Finnish Motor Insurers’ Centre (VALT) Bulevardi 28, FIN-00120 Helsinki
FOLKSAM Insurance Group Research/Traffic Safety S-106 60 Stockholm
Ford Motor Company Safety Data Analysis (SDA) Automotive Safety Office (ASO) Köln-Merkenich / Spessartstraße D-50725 Köln
German Insurance Association (GDV) German Insurance Institute for Traffic Engineering Friedrichstrasse 191, D-10117 Berlin
Honda Motor Europe Wijngaardveld 1 9300 Aalst Belgium
Insurance Institute for Highway Safety (IIHS) & Highway Loss Data Institute (HLDI) 1005 N. Glebe Road Arlington, VA 22201 USA
ITARDA Institute for Traffic Accident Research and Data Analysis Kojimachi Tokyu Bldg. 6-6 Kojimachi, Chiyoda-ku Tokyo 102-0083 Japan
IVT Heilbronn Institut für Verkehrs- und Tourismusforschung e. V. Kreuzäckerstr. 15 D-74081 Heilbronn
Japanese Automobile Research Institute (JARI) 2530 Karima, Tsukuba Ibaraki 305-0822, Japan
Laboratory of Accidentology, Biomechanics and Human Behaviour PSA Peugeot-Citroën/RENAULT (LAB) 132 Rue des Suisses 92000 Nanterre (France)
Loughborough University Vehicle Safety Research Centre Holywell Building Loughborough Leicestershire LE 11 3 UZ UK
National Organisation for Automotive Safety and Victims Aid (NASVA) 6-1-25, Kojimachi Chiyoda-Ku, Tokyo, 102-0083, Japan
Swedish Road Administration (SRA) Röda Vägen S-78187 Borlange
Technische Universität Braunschweig Institut für Mathematische Stochastik Pockelsstr. 14 D-38106 Braunschweig
Verband der Automobilindustie (VDA) Westendstr. 61 D-60325 Frankfurt/Main
Volkswagen AG 1777 Unfallforschung D-38436 Wolfsburg


CEA/EC SARAC II
QUALITY CRITERIA FOR THE SAFETY ASSESSME
OF CARS BASED ON REAL-WORLD CRASHES
Funded by the European Commission,
Directorate General TREN
Document Retrieval Information
Report No. Date Pages December 2005 111 Title and Subtitle How important is ‘vehicle safety’ in the new vehicle purchase process? Author(s) Koppel, S., Charlton, J.L., Fildes, B.N., Fitzharris, M., Clark, A. , Kullgren, A., Olona Solano, A., Mäkitupa, S., Ernvall, T. Performing Organisation Monash University Accident Research Centre, Building 70, Monash University, VIC 3800 AUSTRALIA
Sub-Task Participants Pilot Brian Fildes Monash University Research Centre Sub-Contractors Juan-Luis de Miguel Miranda Centro-Zaragoza
Anders Kullgren Folksam Insurance Timo Ernvall Helsinki University of Technology
Advisors Robert Zobel VW Yves Page LAB, France Joseph Harberl BMW AG Brian O’Neil IIHS Falk Zeidler DaimlerChrysler Claes-Henry Pastor BASt Paul Fay Ford
Observers Minoru Sakurai/Kazunori Mashita OSA/JARI Japan
Abstract
The main aim of this research was to determine the importance of vehicle safety in the process of purchasing a new motor
vehicle. Surveys were conducted in Sweden and Spain with private vehicle purchasers and fleet managers. The findings
indicate that vehicle safety was a high priority in the new vehicle purchase process. A number of factors were found to
influence purchasing decisions, including country of residence, age, driving distance, gender and education, infringement
history, reason for purchasing the new vehicle, and use of EuroNCAP ratings. The findings highlighted the need to educate
particular target groups of consumers about vehicle safety in the new vehicle purchase process. In addition, EuroNCAP
results need to be promoted more widely and effectively so that they play a more prominent role in their new vehicle choices.
Keywords Vehicle safety, purchasing decisions, safety ratings
The views expressed are those of the authors and do not necessarily represent those of CEA or any of the participants of the SARAC committee.


CEA/EC SARAC II
QUALITY CRITERIA FOR THE SAFETY ASSESSME
OF CARS BASED ON REAL-WORLD CRASHES
Funded by the European Commission,
Directorate General TREN
Acknowledgements The research team wishes to thank the European Federation of the Insurance Industry CEA for funding this
research project. We would also like to thank a number of organisations and individuals for their assistance with
various aspects of the research. In particular we would like to thank Juan-Luis de Miguel Miranda (Centro-
Zaragoza) and Anders Ydenius (Folksam Insurance) for their assistance with establishment of the projects and
recruitment. We also thank Klaus Langwieder and all the SARAC members for their support and feedback on
previous drafts of this report. We acknowledge the expert statistical advice of Stuart Newstead (MUARC). Lastly,
we thank the fleet managers and other consumers who generously gave their time and consideration in
responding to the questionnaire.

CEA/EC SARAC II Table of Contents
Table of Contents
EXECUTIVE SUMMARY ....................................................................................................................2 1 INTRODUCTION............................................................................................................................8
1.1 BACKGROUND........................................................................................................................8 2 LITERATURE REVIEW .................................................................................................................9
2.1 UNDERSTANDING THE ROLE AND IMPORTANCE OF VEHICLE SAFETY IN THE PURCHASE DECISION PROCESS ................................................................................................................9
2.2 VEHICLE SAFETY – AT WHAT PRICE? ....................................................................................20 2.2.1 Willingness-to-pay techniques ..................................................................................... 20 2.2.2 Consumers’ willingness-to-pay for vehicle safety features ...................................... 24 2.3 SUMMARY.................................................................... FEHLER! TEXTMARKE NICHT DEFINIERT. 2.3.1 How important is “vehicle safety” to consumers?...................................................... 30 2.3.2 How do consumers conceptualise or understand “vehicle safety”? ....................... 30 2.3.3 How do consumers incorporate safety and other attributes in making
vehicle purchase decisions?......................................................................................... 31 2.3.4 Consumer’s willingness-to-pay for vehicle safety features?.................................... 31 2.3.5 Willingness to trade safety against other features? .................................................. 32 2.3.6 How do consumers search for and use information in their purchase
decisions? What information is most important?....................................................... 32 2.3.7 Understanding of vehicle safety information (eg; star ratings) in vehicle
purchase decisions? ...................................................................................................... 32 2.4 AIMS OF THE CURRENT STUDY...............................................................................................33
3 METHOD......................................................................................................................................34 3.1 RECRUITMENT OF PARTICIPANTS 34 3.1.1 Sweden............................................................................................................................ 34 3.1.2 Spain ................................................................................................................................ 36 3.2 QUESTIONNAIRE DEVELOPMENT ...........................................................................................37 3.2.1 Private purchasers ......................................................................................................... 37 3.2.2 Fleet Manager Questionnaire....................................................................................... 38 3.3 ANALYSES ...........................................................................................................................38
4 RESULTS & DISCUSSION – PRIVATE PURCHASERS ...........................................................39 4.1 RECRUITMENT RATES...........................................................................................................39 4.1.1 Sweden............................................................................................................................ 39 4.1.2 Spain ................................................................................................................................ 40 4.2 QUESTIONNAIRE RESULTS....................................................................................................40 4.2.1 Demographic Information.............................................................................................. 40 4.2.2 Crash and Infringement History ................................................................................... 45 4.2.3 Vehicle Purchase Section............................................................................................. 49 4.2.4 Factors associated with ‘safe vehicle purchasers’ .................................................... 68 4.3 DISCUSSION OF THE PRIVATE VEHICLE PURCHASER RESULTS ................................................71 4.3.1 How important is ‘vehicle safety’ to consumers?....................................................... 71 4.3.2 Who is “vehicle safety” more important to?................................................................ 72 4.3.3 How do consumers conceptualise or understand “vehicle safety”? ....................... 74 4.3.4 How do consumers incorporate safety and other attributes in making
vehicle purchase decisions?......................................................................................... 75 4.3.5 How do consumers search for and use information in their purchase
decisions? What information is most important?....................................................... 75

CEA/EC SARAC II Table of Contents
5 RESULTS & DISCUSSION – FLEET MANAGERS....................................................................77
5.1 RECRUITMENT RATES...........................................................................................................77 5.1.1 Sweden............................................................................................................................ 77 5.1.2 Spain ................................................................................................................................ 77 5.2 QUESTIONNAIRE RESULTS....................................................................................................78 5.3 DISCUSSION OF THE FLEET MANAGERS RESULTS...................................................................89 5.3.1 How important is ‘vehicle safety’ to Fleet Managers? .............................................. 89 5.3.2 Who is “vehicle safety” more important to?................................................................ 89 5.3.3 How do consumers search for and use information in their purchase
decisions? What information is most important?....................................................... 89
6 CONCLUSIONS AND RECOMMENDATIONS...........................................................................91 6.1 FUTURE RESEARCH..............................................................................................................91
7 REFERENCES.............................................................................................................................93 8 APPENDICES..............................................................................................................................95
APPENDIX 1: SWEDISH LETTER OF INVITATION TO PRIVATE AND FLEET VEHICLE PURCHASERS ..........95 APPENDIX 2 PRIVATE VEHICLE PURCHASER QUESTIONNAIRE.......................................................96 APPENDIX 3 FLEET MANAGER VEHICLE PURCHASER QUESTIONNAIRE ........................................102 APPENDIX 4: AVAILABILITY OF SAFETY FEATURES: PILOT STUDY.................................................105


CEA/EC SARAC II Executive Summary
1
Executive Summary BACKGROUND
In the past decade, there has been a significant increase in the amount of consumer interest in the safety
performance of vehicles. Despite the increasing importance of vehicle safety, the role that it plays in consumers’
purchase decisions is poorly understood.
A comprehensive literature review was undertaken to assess the current state of knowledge regarding the role of
vehicle safety in consumers’ purchase decisions. The findings of relevant market research conducted by vehicle
manufacturers, the insurance industry and university researchers indicated that vehicle safety is important to
consumers and has become more important over the past decade. Overall, the review of literature highlighted
that vehicle safety is generally not the primary consideration in the vehicle purchase process and is consistently
outranked by factors such as price, appearance and dependability/reliability. In addition, consumers often equate
vehicle safety with the presence of specific safety features or technologies. The literature also revealed that most
consumers do not seek out crash test result information specifically. Rather, they expect safety considerations to
be incorporated into the reviews and recommendations of consumer publications that they consult.
However while the findings provide useful information on some aspects of consumers’ purchasing decisions, it is
difficult to make definitive conclusions from the literature due to the fact that there were wide variations in the
study designs, methodological limitations such as small or undefined sample sizes, and a range of biases.
AIMS
The aims of the current study were to determine:
• How consumers conceptualise vehicle safety,
• What they understand about vehicle safety,
• How important vehicle safety is in the new vehicle purchase process, and
• What importance they place on safety options/features relative to other convenience and comfort features.
In addition, given that a significant proportion of the new vehicle market is comprised of two purchasing groups:
individuals who purchase vehicles for private use (private vehicle purchasers) and individuals who purchase or
lease vehicles for business use (fleet vehicle purchasers), the current study aimed to investigate the role that
safety plays in the new vehicle purchase process for both groups.
RESULTS FOR PRIVATE PURCHASERS
The following findings are based on responses to a questionnaire that was completed by participants from
Sweden and Spain who were the main or joint decision maker in the purchase of a new vehicle within the past 18
months.
• How important is ‘vehicle safety’ to consumers?

CEA/EC SARAC II Executive Summary
2
One of the main aims of this research project was to try to determine how important ‘vehicle safety’ is in the
new vehicle purchase process. Previous research outlined earlier, concluded that while vehicle safety has
become increasingly important to new vehicle consumers over the past decade, it is generally not the
primary consideration in the vehicle purchase process. Indeed, when participants in the current study were
asked to select vehicle factors from a list that were a high priority in their purchase decision, participants
were more likely to select the vehicle’s reliability, comfort and fuel consumption as high priorities compared
to their vehicle’s safety (defined as the vehicle’s EuroNCAP rating/other safety reports). However, when
participants in the current study were asked to rank the importance of these vehicle factor priorities, most
participants ranked their vehicle’s safety as the most important factor. Similarly, when participants were
asked to identify vehicle features from a list that were a high priority in their new vehicle purchase process,
participants were most likely to list vehicle features that were safety related (e.g., advanced braking
systems). In addition, when asked to rank the importance of these vehicle feature priorities, participants
were more likely to rank a safety-related vehicle feature as their number one priority than a non safety-
related feature. Furthermore, when participants in the current study were asked to list the three most
important factors that they considered when deciding which vehicle to purchase (in an open-ended format),
participants were most likely to list safety as the most important consideration, or one of their top three
considerations, compared to the vehicle’s price, design, fuel consumption etc.
• Who is “vehicle safety” more important to?
Overall, the findings of the current study indicate that vehicle safety was a high priority in the purchase
process for new vehicle consumer. Another key aim of the current study was to identify factors, including
demographic characteristics (country of residence, age, gender) that may influence the importance of
vehicle safety in the new vehicle purchase process.
The findings from the current study showed that the importance of vehicle safety in the new vehicle
purchase process differed significantly for participants from Sweden compared to participants from Spain.
For example, participants from Sweden were significantly more likely to rate their vehicle’s safety (defined
as their vehicle’s EuroNCAP rating/other safety reports) as a high priority and as the highest ranked vehicle
factor in the new vehicle process compared to participants from Spain. On the other hand, while most
participants from Sweden ranked their vehicle’s safety as the most important factor, most Spanish
participants ranked their vehicle’s comfort as the most important factor, with their vehicle’s safety ranked
equal second with their vehicle’s reliability. Furthermore, when participants were asked to list the three most
important factors that they considered when deciding which vehicle to purchase, participants from Sweden
were significantly more likely to list safety as their most important consideration and as one of their top three
considerations than Spanish participants.
These findings are consistent with the well-documented vehicle safety culture in Sweden.
When participants were asked to indicate the vehicle feature that they considered to be the highest ranked
priority in their new vehicle purchase process, participants from Spain were significantly more likely to list a

CEA/EC SARAC II Executive Summary
3
vehicle feature that was safety related (e.g., advanced braking systems and driver airbag) compared to
participants from Sweden where the highest ranked priority features were not safety related (e.g., automatic
transmission and route navigation systems). These findings are surprising given the converse was true for
the priority ratings for overall safety factors for Sweden and Spain. It is possible that the priority placed on
broad safety factors by Swedish participants’ might be explained by the ‘long-held ‘ and deep-rooted safety
culture’ in Sweden. In addition, there may be an expectation by Swedish consumers that safe vehicle
features come as standard, whilst in Spain, there is a need for consumers to be more vigilant and selective
in choosing specific vehicle features that contribute to the overall safety of the vehicle. However, the
availability of such features in Spain is not clear.
Previous research has also suggested that demographic factors such as age and gender may also
significantly influence the importance of vehicle safety in the new vehicle purchase process. When the data
from both countries was pooled, older participants tended to be more likely to list ‘safety’ as their most
important consideration in the new vehicle purchase process compared to middle aged and younger
participants. In addition, female participants were more likely to list safety as their most important
consideration compared to males.
Decisions about vehicle purchases are likely to be influenced by multiple factors. Using regression analysis,
it was possible to explore the relative importance of a number of variables in determining consumers’ priority
rating assigned to safety. As tabled below, the analysis showed that vehicle safety priority was influenced by
use of EuroNCAP, gender and education level, age, drivers’ concern about crash involvement, first vehicle
purchase, annual driving distance, person for whom the vehicle was purchased, and traffic infringement
history.
More Likely Less Likely
Used EuroNCAP as an information source Purchased vehicle for spouse
Females with a higher education (compared with males)
Previous traffic infringements (unbelted)
Aged over 55 years Males with a higher education (compared to other males)
Concerned about crashes
Purchased 1st vehicle
Driving more kilometres per annum

CEA/EC SARAC II Executive Summary
4
• How do consumers conceptualise or understand “vehicle safety”?
In the current study, participants were asked to list up to three factors that they believe make vehicles
safe. Swedish participants were most likely to list airbags and braking systems such as ABS as the most
important factors that make a vehicle safe. Spanish participants were also most likely to list braking
systems, as well as stability control systems as the most important factors that make a vehicle safe.
These findings are consistent with earlier research.
In the current study, there was a significant difference in the level of satisfaction in the safety of their new
vehicle across the two countries. Participants from Sweden were more likely to state that their new
vehicle was ‘safe’ or ‘very safe’, whereas participants from Spain were more likely to state that their new
vehicle was ‘safe’ or ‘less safe’. This is consistent with the finding from the current study that Swedish
participants were significantly more likely to purchase a four or five star-rated new vehicle compared to
Spanish participants.
There was also a significant difference across the two countries in terms of the level of concern about the
possibility of being involved in a motor vehicle crash. Participants from Sweden were more likely to state
that they were “not really concerned” or “not at all concerned” about being involved in a motor vehicle
crash, whereas Spanish participants were more likely to report that they were “very concerned” about the
possibility of being involved in a motor vehicle crash. This finding is not surprising, given Spain’s higher
crash rate (per 100,000). In addition, Swedish participants may be less concerned about being involved in
a motor vehicle crash because of the lower crash rate in Sweden or because they are more likely to be
travelling in a four or five star rated vehicle, and therefore may perceive driving as a low-risk activity.
• How do consumers search for and use information in their purchase decisions? What information is most important?
When asked to indicate the sources of information they used when purchasing their new vehicle, there
were several significant differences across the two countries. Swedish participants were significantly
more likely to report that they used manufacturer websites, motoring websites, and EuroNCAP ratings,
whereas Spanish participants were significantly more likely to report that they used the vehicle
dealership.
There was also a significant difference across the two countries when participants were asked to indicate
which source of information that was the most valuable to them in the pre-purchase decision. Swedish
participants cited motoring magazines as the most valuable source of information, whereas Spanish
participants were more likely to list the vehicle dealership as the most valuable source of information. It
was interesting to note that even though EuroNCAP ratings/other safety reports were ranked as the
number one priority by Swedish participants and the number two priority by Spanish participants in terms
of desirable vehicle factors, only four percent of Swedish participants and no Spanish participants stated

CEA/EC SARAC II Executive Summary
5
that their vehicle’s EuroNCAP rating was the most valuable source of information in the new vehicle
process.
RESULTS FOR FLEET PURCHASERS
The following findings are based on responses to a questionnaire that was completed by Swedish and
Spanish individuals who were responsible for the fleet purchase/lease decisions of their company.
• How important is ‘vehicle safety’ to Fleet Managers?
When asked to indicate the vehicle factors that are included in their company’s criteria for
purchasing/leasing a new vehicle, fleet managers from both Sweden and Spain were more likely to list
the vehicle’s price, reliability, running costs, size and fuel consumption than the vehicle’s safety (defined
as the vehicle’s EuroNCAP rating/other safety reports). In addition, when asked to indicate the vehicle
factors that were a high priority in their purchase/lease decision, fleet managers from both Sweden and
Spain were more likely to list the vehicle’s price and reliability as higher priorities compared to their
vehicle’s safety. Furthermore, when asked to indicate the vehicle factors that are included in their
company’s policy regarding new vehicle purchases/leases, fleet managers from both Sweden and Spain
were more likely to state that the vehicle’s price, make/model and type were included in the policy
compared specifications regarding the vehicle’s safety.
Consistent with previous research conducted with private consumers, the findings of the current study
suggest that vehicle safety is generally not the primary consideration in the vehicle purchase process and
is consistently outranked by factors such as price and dependability/reliability
• Who is “vehicle safety” more important to?
Consistent with the overall findings for the private consumers, vehicle safety appears to be more
important to Swedish fleet managers compared to Spanish fleet managers. For example, Swedish fleet
managers were more likely to state that the vehicle’s EuroNCAP rating was a high priority and included in
their criteria for purchasing/leasing a new vehicle (although these differences did not meet statistical
significance). Interestingly, there was no significant difference in the proportion of fleet managers who
indicated that EuroNCAP ratings were part of their official policy across the two countries.
• How do consumers search for and use information in their purchase decisions? What information is most important?
When asked to indicate the sources of information they used when purchasing their new vehicle, there
were several significant differences across the two countries. Swedish fleet managers were significantly
more likely to report that they used manufacturer websites, motoring websites, and EuroNCAP ratings,
whereas Spanish participants were significantly more likely to report that they used information from
professional/technical/mechanical sources.

CEA/EC SARAC II Executive Summary
6
There was also a significant difference across the two countries when fleet managers were asked to
indicate which source of information that was the most valuable to them in the pre-purchase decision.
Most Swedish fleet managers cited the vehicle manufacturer’s website as the most valuable source of
information whereas most Spanish fleet managers cited the vehicle dealerships as the most valuable
source of information. Interestingly, EuroNCAP ratings were only cited by small proportion of Swedish
fleet managers and no Spanish fleet managers as the most valuable source of information. This finding is
consistent with the current findings for private new vehicle purchasers that crash test result information
such as EuroNCAP ratings are not the most valuable source of information in the pre-purchase process
because participants expect safety considerations to be incorporated into the reviews and
recommendations of consumer publications that they consult.
CONCLUSIONS AND RECOMMENDATIONS
The findings of the current study indicate that vehicle safety is the primary consideration in the purchase
process for private new vehicle consumers in both Sweden and Spain. Overall, participants from both
countries were most likely to select safety related factors (e.g., EuroNCAP rating) and a safety-related
feature (e.g., ABS) from a list of factors and features as their highest priorities in the new vehicle process.
However, vehicle safety was significantly more important to Swedish new private vehicle consumers
overall compared to Spanish new private vehicle consumers. Consistent with previous research, most
participants equated vehicle safety with the presence of specific vehicle safety features or technologies
rather than the vehicle’s crash safety/test results or crashworthiness.
Fleet managers from both Sweden and Spain indicated that vehicle safety is not the primary
consideration when purchasing/leasing a new company vehicle. Rather, factors such as price and
reliability appear to be the highest priorities in the new vehicle purchase/lease process. Consistent with
the overall findings for the private consumers, vehicle safety appears to be more important to Swedish
fleet managers in the new vehicle purchase/lease process compared to Spanish fleet managers. Most
Swedish fleet managers cited the vehicle manufacturer’s website as the most valuable source of
information whereas most Spanish fleet managers cited the vehicle dealerships as the most valuable
source of information.
Overall, the study suggests a need to increase the profile of vehicle safety amongst both fleet managers
and private vehicle purchasers. One important way of achieving this may be to educate consumers about
where to locate objective information about vehicle safety, such as EuroNCAP. In addition, EuroNCAP
needs to be promoted more widely and effectively so that it plays a more prominent role in their new
vehicle choices
For fleet managers, awareness needs to be raised about vehicle safety especially with respect to costs
and benefits for occupational health and safety in order to protect their most valuable company resources.
Fleet owners should also be encouraged to develop vehicle purchase policies that would include specific
criteria for ensuring a high level of safety in their fleet.

CEA/EC SARAC II Executive Summary
7
For private vehicle purchasers, the findings highlighted the need to target particular consumer groups
(such as younger consumers) in order to increase their knowledge regarding vehicle safety and to
encourage them to place highest priority on safety in the new vehicle purchase process.
FUTURE RESEARCH
This study identified a number of interesting differences between Sweden and Spain in terms of the
importance of safety in the new vehicle purchase process. It will be important to determine whether these
findings can be generalised to other European countries, especially where there is a poor safety record.
Whilst this study has been successful in exploring the importance of vehicle safety in the new vehicle
purchase process, the findings could be enhanced by use of other survey methods such as willingness-
to-pay.


CEA/EC SARAC II Introduction
8
1 Introduction
1.1 Background In the past decade, there has been a significant increase in the amount of consumer interest in the safety
performance of vehicles. In 2001, SARAC I reviewed incidental consumer surveys from Europe, the
United States and Australia and concluded that “safety” had become an important attribute when
purchasing a new vehicle (Zeidler, Kullgren, Fildes, Morris & O’Neill, 2001).
Despite the increasing importance of vehicle safety, the role that it plays in consumers’ purchase decisions
is poorly understood (Ferguson, 1999). The overall aim of SARAC II Subtask 4.1 was to design a
consumer survey which will determine how consumers conceptualise vehicle safety, what they understand
about specific safety features or safety ratings, and what importance they place on safety options/features
relative to other convenience and comfort features. This information will be important for policy makers,
manufacturers and other stakeholders to assist in setting priorities with regard to the promotion and
publicity of safety features. Such knowledge will also help dispel any misconceptions relating to safety, the
value of safety features and their role in reducing the risk of injury/death.
A comprehensive literature review was undertaken to assess the current state of knowledge regarding the
role of vehicle safety in consumers’ purchase decisions. The findings of relevant market research
conducted by vehicle manufacturers, the insurance industry and university researchers are outlined in the
next section.
A key outcome of this literature review was to identify a suitable study design for the consumer survey
(see Section 3).

CEA/EC SARAC II Literature review
9
2 Literature review A comprehensive literature review was undertaken to assess the current state of knowledge regarding the
role and importance of vehicle safety in consumers’ purchase decisions, as well as what consumers would
be willing to pay for vehicle safety features in order to reduce their injury risk in the event of a crash. The
findings of this literature review are outlined in detail below.
2.1 Understanding the role and importance of vehicle safety in the purchase decision process A number of market research studies have been conducted by insurance companies, vehicle
manufacturers and academic researchers which have attempted to investigate the importance of various
vehicle factors, including vehicle safety, within the vehicle purchasing process. These studies are outlined
in detail below.
In 2003, the Dohring Company, North America’s largest provider of custom market research to the retail
automotive sector, conducted a random survey of 7,995 American drivers intending to purchase a new
vehicle in the near future. Eighty three percent of participants reported that vehicle safety would be an
“important” or “very important” consideration when purchasing their next vehicle (The Dohring Company,
2003). This finding is consistent with several studies outlined in the SARAC 1 report that indicated that
safety is an important consideration in the vehicle purchase decision (see Insurance Research Council,
1990, 1999; Ferguson, 1992; Princeton Survey Research, 1994, 1995; NHTSA, 1995, 1997).
In addition, the Dohring Company report found that 74 percent of participants surveyed indicated that
safety features - such as smart airbags, vehicle stability control and anti-rollover systems – would be more
important in their new vehicle purchase decision than they were five years ago (The Dohring Company,
2003). Indeed, the authors reported that over the past six years, there has been a marked increase in the
proportion of consumers indicating that airbags, ABS brakes, traction control and crumple zones are
important considerations in new vehicle purchases (see Table 1).

CEA/EC SARAC II Literature review
10
Table 1 Percentage of participants indicating that safety features would be “very important” or
“important” considerations in their new vehicle purchase decision
Safety feature
1998 1999 2000 2001 2002 2003
Driver and passenger airbags
63% 71% 76% 86% 88% 91%
Side impact airbags
44% 52% 57% 65% 68% 74%
Antilock (ABS) brakes
78% 79% 85% 89% 90% 91%
Traction control
77% 79% 81% 83% 83% 85%
Crush/ crumple zones
77% 78% 79% 81% 79% 79%
Anti roll-over suspension control1
N/A N/A N/A N/A N/A 75%
Source: The Dohring Company report (2003).
The findings of this study are consistent with an earlier study conducted by DaimlerChrysler who reported
that that more consumers in 1999 reported that safety features were an ‘extremely’ or ‘very important’
reason for purchasing a specific vehicle, compared to the proportion of consumers who indicated that
vehicle safety was ‘important’ in 1981 (84% versus 64%) (Stoffer, 2000).
Other findings from the Dohring Company (2003) study included:
Almost 47 percent of participants reported they were only ‘somewhat’ or ‘not at all’ satisfied with the
way the dealer sales representatives educated them regarding the proper use of vehicle safety systems;
Almost 73 percent of participants reported they felt only ‘somewhat’ or ‘not at all’ informed about how
vehicle stability control systems work, yet more than 58 percent indicated that the availability of stability
control systems would be ‘important’ or ‘very important’ for their next vehicle purchase;
More than 76 percent of participants said the availability of an active seatbelt retractor- such as that
used in the Mercedes Benz PreSafe system, would be ‘important’ or ‘very important’ in their next vehicle
purchase decision, while 84 percent reported that advanced occupant sensing/smart airbag systems as
‘important’ or ‘very important’ in their next vehicle purchase decision;
1 The anti roll-over suspension has been included in the survey

CEA/EC SARAC II Literature review
11
76 percent of participants thought that future enhanced vehicle control systems that integrate
electronics, braking, steering and suspension would be very ‘important’ or ‘very important’, while almost
63 percent reported that anti-rollover/active roll stability systems would be ‘important’ or ‘very important’
in their next vehicle purchase consideration;
Almost 57 percent thought that future driver assist or lane guard systems that help prevent inadvertent
lane departure would be ‘important’ or ‘very important’ in their next vehicle purchase decision, and
Side impact/rollover canopy airbag technology was selected by more participants than any other
system as the safety option for which they would be willing-to-pay extra (42%).
The authors concluded that vehicle safety has become more important to consumers over the past few
years. It is important to note that consumer preference surveys similar to the one conducted by the
Dohring Company (2003) are vulnerable to a number of biases, particularly hypothetical bias (i.e., when
an individual cannot or will not consider questions in a manner which responds to how they would treat the
real situation). One way to lessen the hypothetical bias is to only include participants who have recently
purchased a new vehicle (Dwyer Leslie, 1992). The reasoning here is that those who have made a recent
purchase are much more likely to have considered actual vehicle factors or options, and therefore may be
more able to consider the questions in a manner which responds to how they would have acted in the
‘real’ situation. Notwithstanding this limitation, the findings of this study indicate that consumers want
safety features and technology within their new vehicles and, when they understand the benefits
associated with the specific feature/technology, they are willing-to-pay for it.
The importance of vehicle safety was also investigated by Progressive Insurance Company, America’s
fourth largest auto insurer, who conducted a new vehicle purchasing attitude survey at the North American
International Auto Show (Progressive Insurance Co., 2001). The results of the survey revealed that the top
five considerations when purchasing a new vehicle were:
Overall purchase price (25%);
Practicality, such as gas mileage, insurance etc (22%);
Monthly payment (19%);
Looks/styling of the vehicle (14%), and
Safety features, such as airbags and anti-lock brakes (10%).
Other interesting findings from the survey included:
47 percent of participants considered the colour of the vehicle more important in their decision than if
the vehicle was equipped with side-impact airbags;
22 percent of participants reported that a CD player was more important than ABS in their new vehicle
purchase decision;

CEA/EC SARAC II Literature review
12
Participants with children were nearly twice as likely to report that monthly payments were more
important that its safety features;
Men were more likely than women to report safety features as the primary consideration, and
Participants earning more than $75,000 per year were nearly twice as likely to be concerned about the
purchase price of a vehicle than participants earning less than $25,000 per year.
The authors concluded that consumers place a premium on the appearance and other convenience and
comfort features offered in a new vehicle rather than its safety features. Consistent with the study reported
by the Dohring Company, this study is limited by the fact that the results were obtained from prospective
vehicle purchasers, and therefore the results may be subject to hypothetical bias (Dwyer Leslie, 1992). In
addition, the authors did not report their sample size and therefore it is not possible to determine whether
the sample is of adequate size to be extrapolated to the general purchasing population. In addition,
participants were recruited from an automotive show and therefore they may not be representative of the
general purchasing population.
In 2002, the Canadian Automobile Association (CAA) conducted a Vehicle Ownership survey with more
than 20,000 of their members across Canada (Desrosiers Automotive Report, 2002). The report
concluded that although safety features have grown in importance, they are still not the most important
vehicle-related factor for most consumers when they are purchasing a new vehicle. For example, safety
and security features were equally as desirable as vehicle ‘styling’ (17%). Consumers also rated the
following factors as more desirable than safety:
Reliability (50%);
Performance/Handling (35%);
Price/Incentives (34%);
Fuel Economy (31%);
Comfort (28%);
Interior/Luggage Space (22%);
Cost of Maintenance/Service (19%), and
Re-sale Value (18%).
The authors noted that these findings are consistent with previous market research conducted by General
Motors and the Ford Motor Company who reported that price and dependability/reliability have
consistently ranked higher on average than safety features in terms of possible reasons for choosing the
new vehicle they purchased over their second- choice vehicle (General Motors Corporation, 1994; J.D.
Power and Associates, 1993).

CEA/EC SARAC II Literature review
13
The importance of safety features to new vehicle purchasers relative to other convenience and comfort
features has also been investigated by the US Department of Transportation using focus groups (Charles
River Associates Incorporated, 1998). In this study, participants were eligible if they had participated
significantly in decisions about the purchase or lease of a new vehicle within the last 2 years. Eight
discussion groups were conducted, using a variety of selection criteria to reflect various climatological,
demographic and attitudinal differences. The composition of the groups was stratified by other potentially
influential factors:
Two groups were comprised of drivers aged 65 years and older;
One group comprised female drivers;
One group comprised drivers who had purchased a new “high-end vehicle” with a cost of at least
$35,000;
Two groups were stratified by whether the participants did mostly urban or suburban/rural driving, and
Two groups were not stratified but drawn from the general population.
Groups were asked to discuss why they decided to purchase/lease the particular make and model of the
vehicle, as well as how they decided on the final specification of features and optional equipment. The
types of vehicle information sources consulted were also discussed, as well as general impressions about
which sources provided the most credible or “objective” information.
For the majority of participants, vehicles were chosen on the basis of factors such as price, appearance,
associated status, reputation for reliability, previous experience with the make or model, or certain vehicle
specific attributes such as performance or carrying capacity. This finding is consistent with the market
research outlined above (e.g., The Dohring Company, 2003; Desrosiers Automotive Report, 2001;
Progressive Insurance Co., 2001).
In contrast to vehicle choice decisions, fewer participants appeared to have invested as much thought into
decisions about optional features, preferring to choose from “what’s on the lot” than to shop around or wait
for a vehicle meeting some well-considered specification. The authors noted that increased feature
‘bundling’ in recent years has served to reduce and simplify the set of options available on private
vehicles.
However, when participants did have specific options in mind, safety-related features (primarily
passenger-side airbags and antilock brake systems) featured high on the list. It appeared that
endorsement, or criticism, of safety options by a respected information or opinion source had the potential
to influence more consumer choices than either a good understanding of the technology or high-level
technical explanations.
Women seemed somewhat more concerned about safety matters than men, and appeared to be more
willing to admit to personal vulnerability. At the same time, they appeared to be more sceptical of the new

CEA/EC SARAC II Literature review
14
technology than the men. However, the authors suggest that the most pronounced difference between the
male and female participants is a parental distinction rather than a gender one per se.
Older drivers in the focus groups appeared to be significantly more interested in crash countermeasure
concepts than were younger participants. This was the case not only with the participants in the two
stratified older driver groups, but also with their peers in the other groups as well. Without being
specifically asked, many of the participants aged over 65 years volunteered that they were aware of their
declining driving skills, particularly with regard to vision and attention declines. They also appeared to be
more aware of and sensitive to the issues of personal safety and security than younger drivers.
Most participants reported that they read Consumer Reports or similar consumer-oriented publications at
some stage in their pre-purchase research. A small number of participants in each group reported using
the Internet – in many cases to obtain general information about a variety of makes and models. The
enthusiast or “car” magazines, as well as other periodicals such as “Popular Science” were used by
participants as a source of performance or feature information. Relatively few participants reported that
they consulted the automotive articles in general newspapers.
In addition to the information obtained from these documentary sources, prior personal experience with
the make or model, or ‘word of mouth’ recommendations from family or friends also figured heavily in
many purchase decisions. Information obtained from dealerships, whether in the form of brochures and
literature or conversations with salespeople, was also considered a primary and authoritative source of
information, particularly since many participants made a test drive of more than one vehicle. However,
documentary material from dealers was thought to be less objective than that from more independent
sources.
When asked specifically about the best sources for reliability and safety information, the consensus was
that Consumer Reports was the most credible and objective. The AAA and the Insurance Institute for
Highway Safety were also mentioned as credible sources. Few participants sought out crash test result
information specifically. Rather, they expected safety considerations to be incorporated into the reviews
and recommendations of consumer publications that they consult.
The overall findings from the focus groups revealed that for the majority of participants, vehicles were
chosen on the basis of factors such as price, appearance, associated status, reputation for reliability,
previous experience with the make or model, or certain vehicle specific attributes such as performance or
carrying capacity. Consumers appeared to regard vehicle purchases as major investments that merit
doing at least some homework. However, fairly “low engagement” methods of obtaining information
predominate: visits to the dealers, Consumer Reports and similar vehicle purchase guides that can be
picked up at a newsstand, word-of-mouth and so on. The authors noted that it is not clear from these
results whether dissemination of more detailed, high-content information about new safety options would
be sought out or valued by many consumers. Notwithstanding the limitations of qualitative market
research methods and an undefined sample size, the authors concluded that while safety is a
consideration in new vehicle purchase decisions, it is generally not the primary consideration.
CEA/EC SARAC II Literature review
15
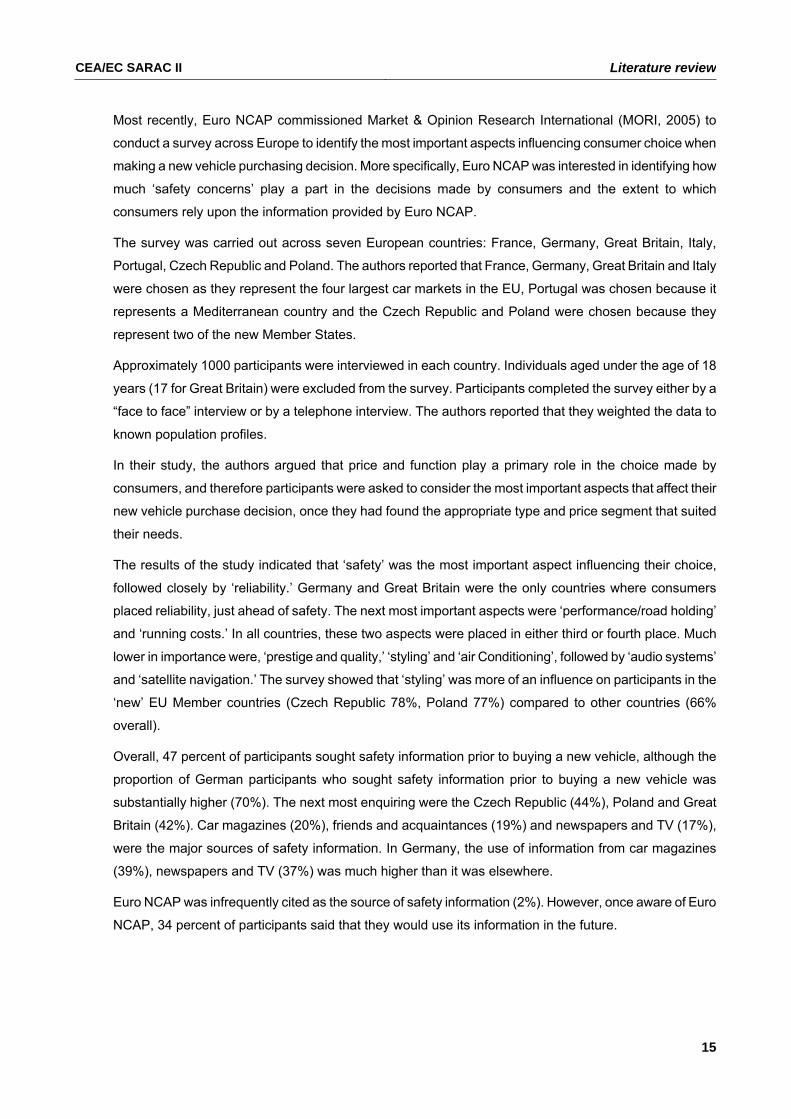
Most recently, Euro NCAP commissioned Market & Opinion Research International (MORI, 2005) to
conduct a survey across Europe to identify the most important aspects influencing consumer choice when
making a new vehicle purchasing decision. More specifically, Euro NCAP was interested in identifying how
much ‘safety concerns’ play a part in the decisions made by consumers and the extent to which
consumers rely upon the information provided by Euro NCAP.
The survey was carried out across seven European countries: France, Germany, Great Britain, Italy,
Portugal, Czech Republic and Poland. The authors reported that France, Germany, Great Britain and Italy
were chosen as they represent the four largest car markets in the EU, Portugal was chosen because it
represents a Mediterranean country and the Czech Republic and Poland were chosen because they
represent two of the new Member States.
Approximately 1000 participants were interviewed in each country. Individuals aged under the age of 18
years (17 for Great Britain) were excluded from the survey. Participants completed the survey either by a
“face to face” interview or by a telephone interview. The authors reported that they weighted the data to
known population profiles.
In their study, the authors argued that price and function play a primary role in the choice made by
consumers, and therefore participants were asked to consider the most important aspects that affect their
new vehicle purchase decision, once they had found the appropriate type and price segment that suited
their needs.
The results of the study indicated that ‘safety’ was the most important aspect influencing their choice,
followed closely by ‘reliability.’ Germany and Great Britain were the only countries where consumers
placed reliability, just ahead of safety. The next most important aspects were ‘performance/road holding’
and ‘running costs.’ In all countries, these two aspects were placed in either third or fourth place. Much
lower in importance were, ‘prestige and quality,’ ‘styling’ and ‘air Conditioning’, followed by ‘audio systems’
and ‘satellite navigation.’ The survey showed that ‘styling’ was more of an influence on participants in the
‘new’ EU Member countries (Czech Republic 78%, Poland 77%) compared to other countries (66%
overall).
Overall, 47 percent of participants sought safety information prior to buying a new vehicle, although the
proportion of German participants who sought safety information prior to buying a new vehicle was
substantially higher (70%). The next most enquiring were the Czech Republic (44%), Poland and Great
Britain (42%). Car magazines (20%), friends and acquaintances (19%) and newspapers and TV (17%),
were the major sources of safety information. In Germany, the use of information from car magazines
(39%), newspapers and TV (37%) was much higher than it was elsewhere.
Euro NCAP was infrequently cited as the source of safety information (2%). However, once aware of Euro
NCAP, 34 percent of participants said that they would use its information in the future.
CEA/EC SARAC II Literature review
16
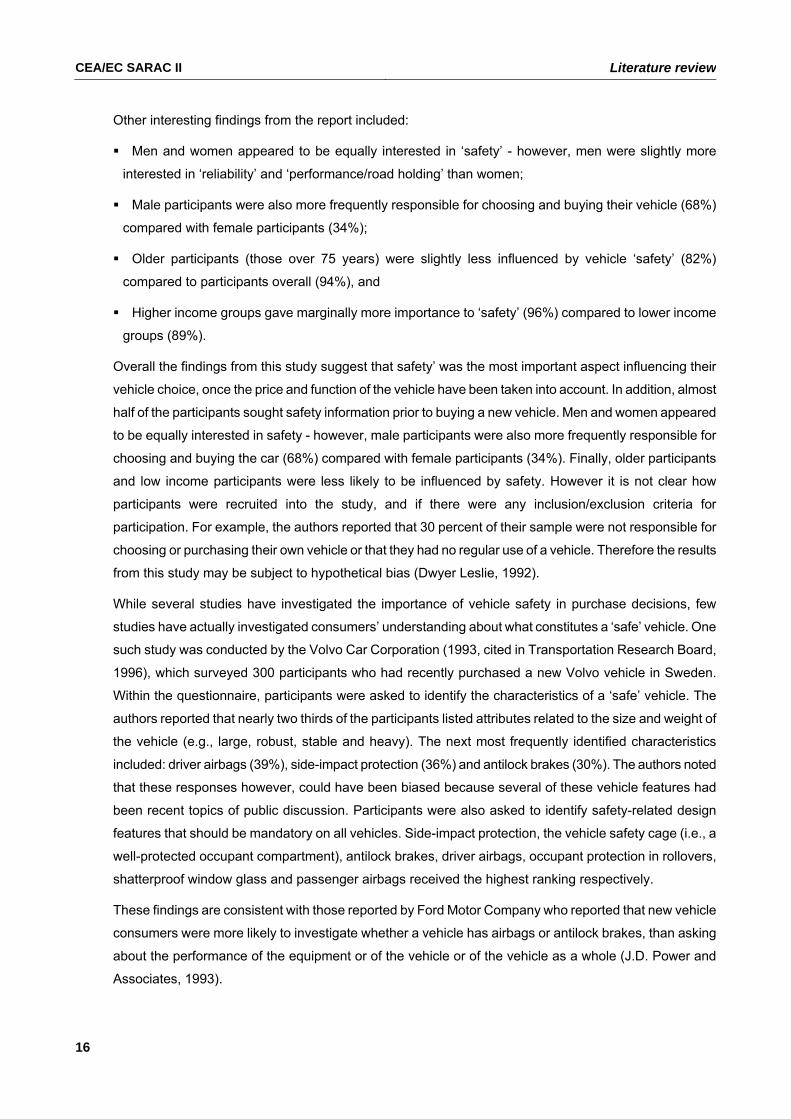
Other interesting findings from the report included:
Men and women appeared to be equally interested in ‘safety’ - however, men were slightly more
interested in ‘reliability’ and ‘performance/road holding’ than women;
Male participants were also more frequently responsible for choosing and buying their vehicle (68%)
compared with female participants (34%);
Older participants (those over 75 years) were slightly less influenced by vehicle ‘safety’ (82%)
compared to participants overall (94%), and
Higher income groups gave marginally more importance to ‘safety’ (96%) compared to lower income
groups (89%).
Overall the findings from this study suggest that safety’ was the most important aspect influencing their
vehicle choice, once the price and function of the vehicle have been taken into account. In addition, almost
half of the participants sought safety information prior to buying a new vehicle. Men and women appeared
to be equally interested in safety - however, male participants were also more frequently responsible for
choosing and buying the car (68%) compared with female participants (34%). Finally, older participants
and low income participants were less likely to be influenced by safety. However it is not clear how
participants were recruited into the study, and if there were any inclusion/exclusion criteria for
participation. For example, the authors reported that 30 percent of their sample were not responsible for
choosing or purchasing their own vehicle or that they had no regular use of a vehicle. Therefore the results
from this study may be subject to hypothetical bias (Dwyer Leslie, 1992).
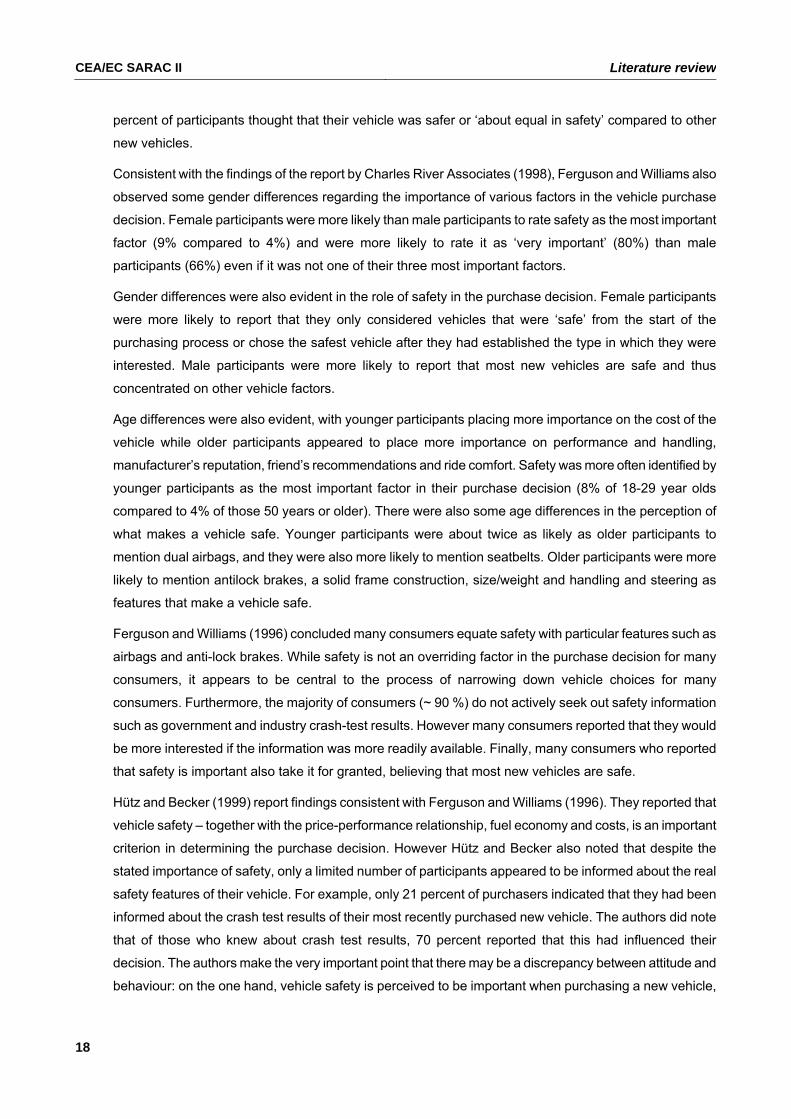
While several studies have investigated the importance of vehicle safety in purchase decisions, few
studies have actually investigated consumers’ understanding about what constitutes a ‘safe’ vehicle. One
such study was conducted by the Volvo Car Corporation (1993, cited in Transportation Research Board,
1996), which surveyed 300 participants who had recently purchased a new Volvo vehicle in Sweden.
Within the questionnaire, participants were asked to identify the characteristics of a ‘safe’ vehicle. The
authors reported that nearly two thirds of the participants listed attributes related to the size and weight of
the vehicle (e.g., large, robust, stable and heavy). The next most frequently identified characteristics
included: driver airbags (39%), side-impact protection (36%) and antilock brakes (30%). The authors noted
that these responses however, could have been biased because several of these vehicle features had
been recent topics of public discussion. Participants were also asked to identify safety-related design
features that should be mandatory on all vehicles. Side-impact protection, the vehicle safety cage (i.e., a
well-protected occupant compartment), antilock brakes, driver airbags, occupant protection in rollovers,
shatterproof window glass and passenger airbags received the highest ranking respectively.
These findings are consistent with those reported by Ford Motor Company who reported that new vehicle
consumers were more likely to investigate whether a vehicle has airbags or antilock brakes, than asking
about the performance of the equipment or of the vehicle or of the vehicle as a whole (J.D. Power and
Associates, 1993).

CEA/EC SARAC II Literature review
17
Consumer’s understanding of what makes a vehicle ‘safe’ has also been investigated by Ferguson and
Williams (1996). In this study, 1516 recent vehicle purchasers were surveyed and asked to list three things
that are important in making a vehicle ‘safe’. Consistent with the findings of Volvo Car Corporation (1995)
and Ford Motor Company (J.D. Power and Associates, 1993), participants appeared to equate vehicle
safety with specific vehicle safety features. Duel airbags were cited most often (73%), followed by antilock
brakes (44%), seat belts (35%) and a solid frame (26%). The authors noted that other factors that strongly
influence vehicle crashworthiness (e.g., size, weight, energy absorbing capacity) were not identified by
consumers. The authors also reported that some of the consumers appeared to be somewhat misguided
about what makes a vehicle safe or not. For example, 26 percent reported that a solid frame construction
would contribute to a vehicle’s safety.
Ferguson and Williams (1996) were also interested in determining the most important factors that
influenced the new vehicle purchase decision. Vehicle appearance (38%) and vehicle cost (37%) were
cited most often by participants, followed by manufacturer reputation (29%), and performance/handling
(20%). The authors reported that safety was not often spontaneously mentioned as a reason for
purchasing a new vehicle, however when participants were asked specifically about the importance of
vehicle safety in the purchase decision, 73 percent of participants indicated that safety was an important
factor in their decision.
Participants who indicated that safety was an important factor in their purchase decision were asked about
the types of safety information they obtained for the vehicle before they purchased it. Most participants
reported that they had not obtained information such as crash test results that would enable them to
evaluate vehicle performance in crashes, although 62 percent of participants reported that they would use
the information if it were made more readily available.
Participants who reported that safety was an important factor in their purchase decision were asked to
choose among three statements describing how vehicle safety influenced their decisions:
19 percent reported that they made sure they only considered ‘safe’ vehicles;
48 percent reported that they chose the type of vehicle they wanted first and then made sure the
specific make/model they selected was the safest of the type, and
33 percent reported that they considered most vehicles to be quite safe, so they concentrated on other
factors when selecting their new vehicle.
Finally, participants were asked to indicate whether they were satisfied with the safety of their vehicle or
whether they felt they had to compromise on some safety feature so they could purchase other features
they wanted. Most participants (91%) reported that they were satisfied with the safety of their vehicle and
therefore did not feel that they comprised on the safety of their vehicle. The authors noted that these
findings are consistent with earlier work conducted by the Ford Motor Company who reported that
consumers were generally satisfied with vehicle safety (J.D. Power and Associates, 1993). In addition, 95
CEA/EC SARAC II Literature review
18
percent of participants thought that their vehicle was safer or ‘about equal in safety’ compared to other
new vehicles.
Consistent with the findings of the report by Charles River Associates (1998), Ferguson and Williams also
observed some gender differences regarding the importance of various factors in the vehicle purchase
decision. Female participants were more likely than male participants to rate safety as the most important
factor (9% compared to 4%) and were more likely to rate it as ‘very important’ (80%) than male
participants (66%) even if it was not one of their three most important factors.
Gender differences were also evident in the role of safety in the purchase decision. Female participants
were more likely to report that they only considered vehicles that were ‘safe’ from the start of the
purchasing process or chose the safest vehicle after they had established the type in which they were
interested. Male participants were more likely to report that most new vehicles are safe and thus
concentrated on other vehicle factors.
Age differences were also evident, with younger participants placing more importance on the cost of the
vehicle while older participants appeared to place more importance on performance and handling,
manufacturer’s reputation, friend’s recommendations and ride comfort. Safety was more often identified by
younger participants as the most important factor in their purchase decision (8% of 18-29 year olds
compared to 4% of those 50 years or older). There were also some age differences in the perception of
what makes a vehicle safe. Younger participants were about twice as likely as older participants to
mention dual airbags, and they were also more likely to mention seatbelts. Older participants were more
likely to mention antilock brakes, a solid frame construction, size/weight and handling and steering as
features that make a vehicle safe.
Ferguson and Williams (1996) concluded many consumers equate safety with particular features such as
airbags and anti-lock brakes. While safety is not an overriding factor in the purchase decision for many
consumers, it appears to be central to the process of narrowing down vehicle choices for many
consumers. Furthermore, the majority of consumers (~ 90 %) do not actively seek out safety information
such as government and industry crash-test results. However many consumers reported that they would
be more interested if the information was more readily available. Finally, many consumers who reported
that safety is important also take it for granted, believing that most new vehicles are safe.
Hütz and Becker (1999) report findings consistent with Ferguson and Williams (1996). They reported that
vehicle safety – together with the price-performance relationship, fuel economy and costs, is an important
criterion in determining the purchase decision. However Hütz and Becker also noted that despite the
stated importance of safety, only a limited number of participants appeared to be informed about the real
safety features of their vehicle. For example, only 21 percent of purchasers indicated that they had been
informed about the crash test results of their most recently purchased new vehicle. The authors did note
that of those who knew about crash test results, 70 percent reported that this had influenced their
decision. The authors make the very important point that there may be a discrepancy between attitude and
behaviour: on the one hand, vehicle safety is perceived to be important when purchasing a new vehicle,

CEA/EC SARAC II Literature review
19
on the other hand only a minority of consumers request or acquire vehicle safety information. The study
also investigated whether consumers understood and believed crash-test information. The results showed
that two thirds rated the crash test information as “understandable”. However, despite the positive
judgements regarding understandability, a comprehension test showed that there were large gaps in the
knowledge of vehicle owners as well as frequent misinterpretations. EURONCAP was known to only 10
percent of participants as being the standard test method. The authors concluded that the results of this
study indicate that crash test results play only a minor role in the vehicle purchase decision.
Summary
In summary, several studies have investigated the factors that influence new vehicle purchasing decisions.
The findings of relevant market research conducted by vehicle manufacturers, the insurance industry, and
university researchers indicate that vehicle safety is important to consumers and has become more
important over the past decade. However, despite its importance, vehicle safety is generally not the
primary consideration. For example, in terms of desirable vehicle factors, vehicle safety is consistently
outranked by factors such as price, appearance and dependability/reliability. Within the vehicle purchasing
decision, safety appears to be used most often to help narrow choices among specific makes and models,
whereas the initial choice of type or class of car (e.g., van versus a midsize car) appears to be based
primarily on price and/or reliability.
Consumers appear to regard the purchase of a new vehicle as a major investment that merits doing at
least some homework. However, fairly “low engagement” methods of obtaining information predominate:
visits to dealers, Consumer Reports and similar vehicle purchase guides. Consumers rarely seek crash
test results although many consumers indicate that they would use the information if it were made more
readily available.
Despite the interesting findings outlined in the review above, there are still several gaps in the current
state of knowledge regarding the role of vehicle safety in the vehicle purchase process. For example,
there is little systematic information available on what consumers believe or understand about vehicle
safety. While there is some evidence that suggests that the average consumer equate ‘safety’ with specific
vehicle features, it is not clear how consumers conceptualise vehicle safety and whether they actually
understand how specific vehicle features operate to reduce their risk in a crash.
In addition, there is limited information in relation to whether the average consumer has a good
understanding of what consumer testing programs such as EuroNCAP, NCAP, ANCAP reveal about a
vehicle’s performance in a crash. There is some evidence to suggest that there are large gaps in the
knowledge of vehicle owners as well as frequent misinterpretations. Further research is needed to
examine this area in more detail.

CEA/EC SARAC II Literature review
20
It is also important to note that the majority of studies reported in this review are limited by several
methodological weaknesses:
Hypothetical bias - A number of studies were conducted with participants who have not recently
purchased a new vehicle and therefore may be vulnerable to a range or biases, particularly hypothetical
bias, which may mean that their responses do not truly reflect how they would respond in the actual
acquition of a new vehicle;
Cultural bias - It is likely that consumers in different countries may have substantially different views
about vehicle safety. For example, consumers in geographic locations with a high road toll may have a
significantly different view on safety and risk compared to consumers in countries with a relatively low
road toll. However, none of the reviewed studies conducted a survey across different countries and
therefore the results may be culturally biased;
Sampling bias – Several studies sampled only sampled only their own vehicle purchasers (e.g., the
DaimlerChrysler and Volvo studies), whereas other studies recruited participants from an automotive
show. It is unlikely that the results of these studies will be representative of the general new vehicle
purchaser population, and
Explanatory variables - It is likely that purchase behaviour and decision criteria will be significantly
related to other explanatory variables such as attitudes towards road safety issues, understanding and
knowledge of safety issues, prior experience of motor vehicle crashes and other demographic factors
such as age, gender, income and education level. However, no studies reviewed above controlled for
any of these factors, nor did they perform any statistical modelling to ascertain the relative contribution of
each of these factors, and therefore it is impossible to determine the most influential factor in the
purchase decision.
2.2 Vehicle Safety – At what Price? As well as understanding the role and importance of vehicle safety in the purchase decision process, it is
also important to determine what consumers would be willing to pay for vehicle safety features in order to
reduce their injury risk in the event of a crash. It is anticipated that this type of information will be important
for vehicle manufacturer marketing departments and other stakeholders.
The concept of “willingness-to-pay” and the range of safety features of interest are potentially complex
issues to be considered. The following section reviews several willingness-to-pay methodologies that may
be appropriate for valuing consumer’s perceptions of the benefits associated with vehicle safety features.
2.2.1 Willingness-to-pay techniques Willingness-to-pay (WTP) is a concept referring to the value an individual places on a good, service, or
reduction in the risk of death and/or illness by estimating the maximum currency amount an individual
would pay in order to obtain the good, service, or risk reduction (Gold, Siegel, Russel & Weinstein,
1996).

CEA/EC SARAC II Literature review
21
There are several methods for measuring consumers’ willingness-to-pay. The first type, revealed
preference data, uses data derived from actual market transactions. Due to the fact that this technique is
based on actual purchases observed under realistic marketing conditions, a high degree of external
validity can be assumed.
However, vehicle safety features are an unpriced public good. Therefore, in the absence of a market price,
a non-market valuation method must be employed. Stated preference data is a second type of WTP
method which has been developed for eliciting consumer preferences and economic values for non-
market goods (Centre for International Economics, 2001).
Stated preference techniques, such as contingent valuation (CV) and conjoint analysis (CA), are based on
behavioural intentions and responses to hypothetical choice situations. For example, consumers are
asked to consider one or more hypothetical options and to indicate their preference for these options.
However aside from this general commonality, there are significant differences between the techniques.
For example, CV techniques generally ask consumers to directly state their willingness-to-pay for goods,
whereas CA is generally based on rankings, ratings or choice decisions concerning product profiles that
are described on multiple attributes including price. Each stated preference willingness-to-pay technique is
outlined below in terms of their strengths and weakness at providing estimates of consumer preferences
and values (Centre for International Economics, 2001; Dwyer Leslie, 1992; Smith, Olsen & Harris, 1999).
2.2.1.1 Contingent Valuation (CV)
The CV technique originated from the economics discipline and is underpinned by the utility theory that
allows measures of consumer welfare to be estimated for changes in supply of non-market goods. CV is
used widely to value a wide range of non-market goods and is structured to describe a hypothetical market
to the individual in a way that places the individual in an active role in the market.
There are several different CV techniques:
i) Open-ended questionnaire – respondents are simply asked to state their maximum WTP value for a
given vehicle safety feature
Example - Prior to questioning, consumers are provided with sufficient information to formulate a true
objective value of the benefits of each safety feature. Once the background information has been
conveyed, participants would be questioned (for each safety feature or package of safety features):
“Given that safety feature ‘A’ is expected to reduce occupant injuries by ‘Z’%, what would you be willing to pay (in € terms) to have safety feature ‘A’ fitted to your new car?”

CEA/EC SARAC II Literature review
22
Advantages
- Statistical analysis of the data generated by this technique is relatively straightforward (mean WTP can
be calculated or Ordinary Least Squares (OLS) regression can be employed to “explain” the variation in
values across individuals by regressing the “bid” against a range of independent explanatory variables
such as socio-economic characteristics or respondent attitudes.
Disadvantages
- Vulnerable to a range of biases, particularly for “non-market” goods because consumers are not
accustomed to paying for non-market goods.
- Low response rate (particularly for self-complete, mail-based surveys).
ii) Bidding questionnaire – respondents are presented with an initial WTP amount to which they “bid” up
or down in increments (according to the acceptance or rejection of the initial WTP value presented) until
the respondent’s maximum WTP is reached
Example - Prior to questioning, consumers are provided with sufficient information to formulate a true
objective value of the benefits of each safety feature. Once the background information has been
conveyed, participants would be questioned (for each safety feature or package of safety features):
“Given safety feature ‘B’ is expected to reduce occupant injuries by ‘Y’%, would you be willing to pay ‘S’ (in € terms) to have safety feature ‘B’ fitted to your new car?” if NO
“Would you be willing to pay ‘S-100 (in € terms) to have safety feature ‘B’ fitted to you new car?”
Advantages
- Useful for combating low response often observed with open-ended questionnaires
Disadvantages
- Vulnerable to strategic bias where the respondent provides an artificially high or low bid to ‘game’ the
process
- Vulnerable to starting point and range bias
iii) Discrete questionnaires/closed-ended/dichotomous-choice/“take-it-or-leave-it/binary – respondents
are presented with a single WTP value for a hypothetical benefit and asked if they would pay it or not
Example – Prior to questioning, consumers are provided with sufficient information to formulate a true
objective value of the benefits of each safety feature. Once the background information has been
conveyed, participants would be questioned (for each safety feature or package of safety features):
“Given that safety feature ‘C’ is expected to reduce occupant injuries by ‘X’%, would you be willing to pay €’Z’ to have safety feature ‘C’ fitted to your new car (yes/no)?”

CEA/EC SARAC II Literature review
23
Advantages
- Considered to more closely resemble consumer choice in actual market situation
- Any one respondent cannot unduly influence the overall WTP value and thus provides less room for

CEA/EC SARAC II Literature review
24
Figure 1 Example of paired comparison question
Advantages
- Enables researcher to better define the range of attributes under investigation and to communicate the
frame of references to respondents in a meaningful way
- Can reduce the incentive for respondents to behave strategically or ‘yea-say’, as the questionnaire forces
respondents to consider multiple trade-offs between attributes
Disadvantages
- Consumers not required to make a commitment to select a particular option – one step removed from
economic theory
- Theoretical difficulties in analysing the data
- Do not require respondents to articulate an explicit value, rather values are inferred indirectly from the
preference data
- Places greater cognitive demand on respondents
2.2.2 Consumers’ willingness-to-pay for vehicle safety features A comprehensive search of the publicly available literature only elicited one study which specifically
examined consumers’ willingness-to-pay for vehicle safety features. This study was commissioned by the
Australian Transport Safety Bureau (formerly referred to as the Federal Office of Road Safety) in order to
determine the dollar value that Australian vehicle consumers would be willing-to-pay for safety features
(The Roy Morgan Research Centre, 1992). The safety features of interest were a range of in-vehicle
occupant protection countermeasures that had been recommended by an earlier feasibility report (CR
Decrease in risk of being killed in a crash Increase in vehicle cost
5% (or 10%, 20%, 50%) reduction in risk 2% increase in vehicle cost
No decrease in risk No increase in vehicle cost
OR
Which do you prefer? Strongly 1 2 3 4 5 Strongly (please circle a number) prefer left prefer right
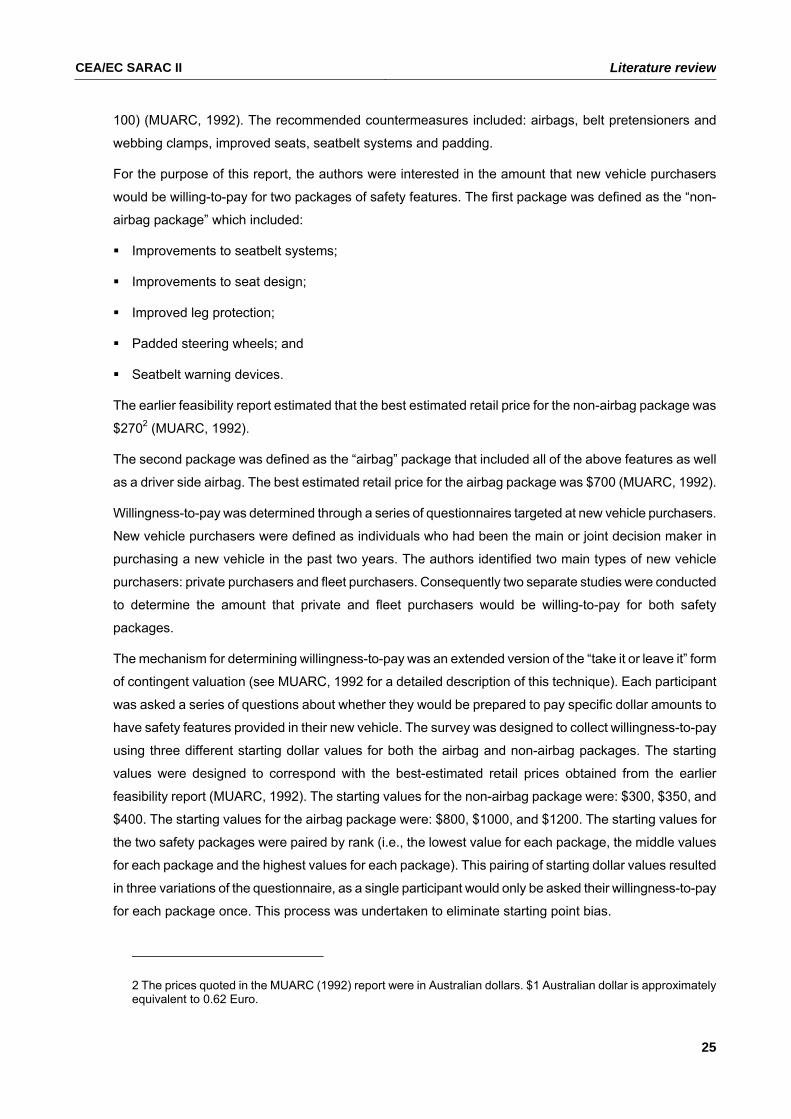
CEA/EC SARAC II Literature review
25
100) (MUARC, 1992). The recommended countermeasures included: airbags, belt pretensioners and
webbing clamps, improved seats, seatbelt systems and padding.
For the purpose of this report, the authors were interested in the amount that new vehicle purchasers
would be willing-to-pay for two packages of safety features. The first package was defined as the “non-
airbag package” which included:
Improvements to seatbelt systems;
Improvements to seat design;
Improved leg protection;
Padded steering wheels; and
Seatbelt warning devices.
The earlier feasibility report estimated that the best estimated retail price for the non-airbag package was
$2702 (MUARC, 1992).
The second package was defined as the “airbag” package that included all of the above features as well
as a driver side airbag. The best estimated retail price for the airbag package was $700 (MUARC, 1992).
Willingness-to-pay was determined through a series of questionnaires targeted at new vehicle purchasers.
New vehicle purchasers were defined as individuals who had been the main or joint decision maker in
purchasing a new vehicle in the past two years. The authors identified two main types of new vehicle
purchasers: private purchasers and fleet purchasers. Consequently two separate studies were conducted
to determine the amount that private and fleet purchasers would be willing-to-pay for both safety
packages.
The mechanism for determining willingness-to-pay was an extended version of the “take it or leave it” form
of contingent valuation (see MUARC, 1992 for a detailed description of this technique). Each participant
was asked a series of questions about whether they would be prepared to pay specific dollar amounts to
have safety features provided in their new vehicle. The survey was designed to collect willingness-to-pay
using three different starting dollar values for both the airbag and non-airbag packages. The starting
values were designed to correspond with the best-estimated retail prices obtained from the earlier
feasibility report (MUARC, 1992). The starting values for the non-airbag package were: $300, $350, and
$400. The starting values for the airbag package were: $800, $1000, and $1200. The starting values for
the two safety packages were paired by rank (i.e., the lowest value for each package, the middle values
for each package and the highest values for each package). This pairing of starting dollar values resulted
in three variations of the questionnaire, as a single participant would only be asked their willingness-to-pay
for each package once. This process was undertaken to eliminate starting point bias.
2 The prices quoted in the MUARC (1992) report were in Australian dollars. $1 Australian dollar is approximately equivalent to 0.62 Euro.

CEA/EC SARAC II Literature review
26
The order in which participants were asked to consider their willingness-to-pay for each package was also
varied in order to avoid creating an order bias when a participant’s willingness-to-pay for the second
package is affected by their response to the first package considered.
Prior to asking the willingness-to-pay questions, participants were provided with information to assist them
in making an informed and objective valuation of the safety packages. The information included a brief
description of the effects of a frontal collision, a simple description of each of the safety features, and an
indication of the effectiveness of the package in reducing occupant injuries and fatalities. Prompt cards
depicting the location of the features in the car, and how an air bag works were also shown. The
information provided to participants was intended to emulate marketing information used by manufacturers
if the safety packages became available.
In addition to collecting information about willingness-to-pay, participants were also asked questions about
the factors they considered in purchasing their vehicle, and willingness to trade additional features
purchased on their vehicle in order to afford safety features. Demographic information was also collected
in order to examine willingness-to-pay for different groups. The findings of the private vehicle purchaser
survey are presented first, followed by the findings from the fleet vehicle purchaser survey.
2.2.2.1 Private vehicle purchasers
The private vehicle purchaser sample comprised 515 participants who had been the main or joint decision
maker in the purchase of a privately registered vehicle in the past two years. Overall, the authors reported
that the willingness-to-pay for both the airbag and non-airbag packages was high. The authors reported
that over 80 percent of private vehicle purchasers would be willing-to-pay the best estimate retail price or
more for both the airbag ($700) and non-airbag package ($270).
In terms of the non-airbag package of safety features, the average willingness-to-pay value for private
vehicle purchasers was $486. In addition, 62 percent of new vehicle purchasers were willing-to-pay $500
or more.
The average willingness-to-pay value for private new vehicle purchasers with regard to the airbag package
of safety features was $1236. Thirty six percent of new vehicle purchasers were willing-to-pay at least
$1600.
The authors also noted that several demographic factors appeared to be related to willingness-to-pay
values, including age, gender and household income. Participants aged 25 to 34 years were more willing-
to-pay for both packages than participants in other age categories. The average willingness-to-pay value
for the non-airbag package was $498 and $1369 for the airbag package. Participants aged 50 years and
over were less willing-to-pay for the non-airbag package, with an average willingness-to-pay value of
$474. Participants aged 18 to 24 were least willing-to-pay for the airbag package with an average
willingness-to-pay value of $1160.
Willingness-to-pay for both the airbag and non-airbag safety packages varied by gender, though the
differences tended to be small. Women were willing-to-pay slightly more for safety features than men, with

CEA/EC SARAC II Literature review
27
an average willingness-to-pay of $505 for the non-airbag package and $1261 for the airbag package. Men
were willing-to-pay $472 for the non-airbag package and $1218 for the airbag package.
The average willingness-to-pay value for the non-airbag package for parents was $502, nearly $100
greater than the average willingness-to-pay value for non-parents ($403). Similarly, the average
willingness-to-pay value of the airbag package for parents was $1218 compared to $994 for non-parents.
A small positive relationship between household income and willingness-to-pay for the non-airbag
package (r = 0.42). The majority of new vehicle purchasers, even with restricted incomes were prepared to
pay $500 or more to obtain the benefits of the package. A stronger relationship between household
income and willingness-to-pay was evident for the airbag package (r = 0.65). Participants with higher
household incomes were more willing-to-pay for the inclusion of the air bag package than those with lower
household incomes.
Other factors related to willingness-to-pay included the size and cost of the car. In terms of car size,
consumers who recently purchased a small or medium sized car appeared to be more willing-to-pay for
the airbag package ($1234 and $1289 respectively) than consumers who purchased a large car ($1141).
There was little difference between buyers of different sized cars in relation to average willingness-to-pay
values for the non-airbag package.
Consumers who purchased more expensive vehicles tended to be more willing-to-pay for the safety
packages. However, it should be noted that willingness-to-pay was still quite high for consumers who
purchased vehicles from the lowest price range (i.e., less then $20,000). In fact, 82 percent of consumers
of low price range cars were still willing-to-pay the best estimated retail price or more for the non-airbag
package and 68 percent were willing-to-pay the best estimated retail price or more for the airbag package.
New vehicle purchasers who purchased at least one feature on their vehicle at an additional cost were
more willing-to-pay for both the non-airbag and airbag packages. For the non-airbag package, participants
who purchased at least one feature were willing-to-pay $501 on average, compared to $456 for those who
did not purchase any features at an additional cost. For the airbag package, the average willingness-to-
pay was $1276 for purchasers who had purchased at least one feature at additional cost, compared to
$1198 for those who had not.
Participants were asked to indicate which factors they had considered when choosing which vehicle to
purchase. The majority of participants indicated that they considered “value for money” (58%). Other
frequently considered factors were reliability (53%), fuel economy (53%), and reputation of make and
model (52%). Safety features were reported as being a consideration by 20 percent of private vehicle
purchasers. The frequency with which this factor was considered was ranked fifteenth out of the sixteen
factors presented to participants.
The most reported “main factor” considered when deciding which car to buy was value for money (18%).
This was followed by reliability (14%), reputation of the make/model (14%) and cost (11%). Only 3 percent
of participants considered safety features to be the main factor when purchasing their new vehicle.

CEA/EC SARAC II Literature review
28
In summary, most private vehicle purchasers would be willing-to-pay the best estimate retail price or more
for both the airbag and non-airbag package. The following factors appeared to influence willingness-to-pay
values:
Age - Participants aged 25-34 years were more willing-to-pay for both packages than participants in
other age categories;
Gender – Female participants were slightly more willing-to-pay for both packages than male
participants;
Parents – Participants with children were more willing-to-pay for both packages than participants
without children;
Household income – Participants with higher household incomes were more willing-to-pay for both
package than those with lower household incomes;
Size of the car – Participants who purchased small or medium sized vehicles were more willing-to-pay
for both packages than participants who purchased large sized vehicles;
Cost of the vehicle - Participants who purchased more expensive vehicles were more willing-to-pay for
both packages than participants who purchased vehicles from the lowest price range (i.e., less then
$20,000); and
Purchased an additional feature – Participants who purchased at least one feature on their vehicle at
an additional cost were more willing-to-pay for both the non-airbag and airbag packages than
participants who had not purchased additional features.
The main factors considered when choosing which vehicle to purchase included:
“value for money” (58%);
reliability (53%);
fuel economy (53%); and
reputation of make and model (52%).
Despite the participants’ high willingness-to-pay for both safety packages, safety features were only
considered by 20 percent of participants. In addition, the frequency with which safety features were
considered was ranked fifteenth out of the sixteen factors presented to participants. It is pleasing to note
that the authors tried to control for a range of biases by only recruiting participants who had recently
purchased a new vehicle and by recruiting them through car manufacturers. However, the results of this
study may be culturally biased because the authors only recruited Australian drivers. Finally, the authors
did not conduct any modelling to determine the most influential factors that affect the purchase decision.
2.2.2.2 Fleet vehicle purchasers
The willingness-to-pay for these safety features in fleet vehicles was also examined in fleet managers who
are responsible for the purchase of vehicles for their organisation. A sample of 30 fleet managers from

CEA/EC SARAC II Literature review
29
both public organisations and private businesses were interviewed. One hundred percent of the fleet
managers were willing-to-pay the best-estimated retail price ($270) or more for the non-airbag package.
On average, the managers were willing-to-pay $531 for the non-airbag package. In terms of the airbag
package, over 70 percent of fleet managers were willing-to-pay the $700 best estimated retail price for the
airbag package, with the average willingness-to-pay amount being $1238.
Fleet managers are generally more willing-to-pay for airbag packages and non-airbag packages in
vehicles purchased for individual use in comparison to vehicles purchased for general use. Approximately
73 percent of fleet managers were willing-to-pay $500 or more for non-airbag packages when the vehicle
was being purchased for an individual compared to approximately 56 percent of fleet managers when the
vehicle was being purchased for general use. Similarly, the willingness-to-pay for the airbag package
appeared to vary depending upon the purpose of the car. Approximately 39 percent of fleet manages were
willing-to-pay $1600 or more for airbag packages when the vehicle was being purchased for an individual
compared to approximately 31 percent of fleet managers who reported that they would be willing-to-pay
$1600 or more for airbag packages when the vehicle was being purchased for general use.
Fleet managers were asked to indicate which factors they had considered when purchasing or leasing the
vehicle for their fleet. Of the factors presented to the participants, purchase cost/lease cost (70%),
reliability (63%) and resale value (56%) were the most frequently considered factors when choosing which
vehicle to purchase or lease.
In summary, most fleet managers would be willing-to-pay the best estimate retail price or more for both the
airbag and non-airbag package. Fleet managers were generally more willing-to-pay for packages in
vehicles purchased for individual use in comparison to vehicles purchased for general use.
The main factors considered when choosing which vehicle to purchase or lease included:
purchase cost/lease cost (70%);
reliability (63%); and
resale value (56%).
Safety features were considered by 30 percent of fleet managers. The authors argued that despite the
small sample sizes in the fleet managers study, the data is consistent with the willingness-to-pay values
observed in the private consumer survey. It should be noted that the authors did not investigate whether
the companies had any specific guidelines or criteria for the purchase of their new vehicles (e.g., specific
price range, minimum safety features etc) that are likely to have a significant effect on the purchase
decision.
In summary, the findings from the Australian study (MUARC, 1992) showed that willingness-to-pay for
airbag and non-airbag packages was high for both private and fleet vehicle purchases. Overall, fleet
purchasers appeared to be slightly more willing-to-pay for safety features than private new vehicle
purchasers. The average willingness-to-pay values for both the airbag and non-airbag packages was
found to be well in excess of the best estimated retail values. This was true for both private new vehicle

CEA/EC SARAC II Literature review
30
purchasers and fleet managers. Several factors appeared to influence willingness-to-pay values for private
purchasers: age, gender, having children, household income, size of the vehicle purchased, cost of the
vehicle purchased and whether they purchased additional features.
Fleet managers are generally more willing-to-pay for safety features in vehicles purchased for individual
use in comparison to vehicles purchased for general use. Despite the high willingness-to-pay for both
safety packages, safety features were only considered by 20 percent of private purchasers and 30 percent
of fleet managers. The most considered factors when considering which vehicle to purchase/lease were
“value for money”, “purchase cost” and “reliability”.
2.3 Findings of the Literature review
An extensive search of publicly available information regarding the role of safety in vehicle purchasing
decisions yielded sparse results. Furthermore, it is difficult to make definitive conclusions from the
literature due to the fact that there are wide variations in the study designs, and due to the fact that the
majority of studies are limited by methodological weaknesses such as small or undefined sample sizes,
and a range of biases.
Notwithstanding these limitations, a summary of the findings of the literature review is provided below.
2.3.1 How important is “vehicle safety” to consumers?
- Vehicle safety is important to consumers and has become more important over the past decade,
however it is generally not the primary consideration in the vehicle purchase process.
- In terms of desirable vehicle factors, vehicle safety is consistently outranked by factors such as price,
appearance and dependability/reliability.
- Despite its importance, it is not clear from the literature whether consumers would be willing to pay extra
for vehicle safety.
2.3.2 How do consumers conceptualise or understand “vehicle safety”?
- Vehicle safety is often equated with the presence of specific safety features or technologies.
- Consumers are interested in whether vehicles have specific safety features or technologies but rarely
ask about the performance of the equipment or the crashworthiness of the vehicle. In addition, it is not
clear from the literature whether consumers actually understand the vehicle features they consider ‘safe’.
- Consumers are generally satisfied with the safety of their new vehicle and perceive driving as a low-risk
activity - vehicle safety may be somewhat taken for granted.

CEA/EC SARAC II Literature review
31
2.3.3 How do consumers incorporate safety and other attributes in making vehicle purchase decisions?
- Within the vehicle purchasing decision, safety appears to be used most often to help narrow choices
among specific makes and models.
- The initial choice of type or class of car (e.g., van versus a midsize car) appears to be based primarily on
price, reliability, and intended use.
2.3.4 Consumer’s willingness-to-pay for vehicle safety features?
- There are two significant new vehicle purchasing groups: private vehicle purchasers and fleet vehicle
purchasers. Despite the fact that fleet vehicle purchasers represent approximately 50 percent of the
purchasing market, the review only identified one study that surveyed both private and fleet purchasers.
- Overall, fleet purchasers appeared to be slightly more willing-to-pay for safety features than private new
vehicle purchasers.
- Several factors appear to influence private purchasers’ willingness-to-pay values. These include:
o Age of the consumer;
o Gender of the consumer;
o Whether the consumer has children;
o Household income of the consumer;
o Size of the vehicle purchased;
o Cost of the vehicle purchased, and
o Whether the consumer purchased any additional features at the time of purchase
- Fleet managers are generally more willing-to-pay for safety features in vehicles purchased for individual
use compared to vehicles purchased for general use.
- Although previous research has identified several factors that appear to influence willingness to pay
values, there are many other variables with the potential to influence vehicle purchase decisions that have
not been explored. Other potential variables that should be explored in future research for private
purchasers including the driver’s road safety record (previous crashes or infringements) or the cultural
values placed on safety. An important potential influential variable for fleet vehicles may be their
company’s purchasing selection criteria – however this has not been explored in the literature.
- In addition, none of the studies reviewed have used sophisticated statistical modelling to ascertain the
relative contribution of each of these factors, therefore it is not possible to determine the most influential
variable in the purchase decision?

CEA/EC SARAC II Literature review
32
2.3.5 Willingness to trade safety against other features?
- Vehicle purchase decisions often involve difficult trade-offs, such as those between price, intended use,
reliability and safety, however there is limited information in relation to consumer’s willingness to trade
safety against other features.
- There is some evidence elicited from consumer surveys that suggest that consumers place a premium
on the appearance and other convenience and comfort features offered in a new vehicle (i.e., a CD player)
rather than its safety features (ABS brakes).
2.3.6 How do consumers search for and use information in their purchase decisions? What information is most important?
- Automotive safety information is plentiful and available from many sources: crash test results,
dealerships, consumer orientated publications, though it is sometimes difficult to interpret and not always
accessible.
- The findings of the majority of studies showed that consumers read Consumer Reports or similar
consumer-oriented publications at some stage in their pre-purchase research.
- Most consumers do not seek out crash test result information specifically. Rather, they expect safety
considerations to be incorporated into the reviews and recommendations of consumer publications that
they consult. Indeed, the endorsement, or criticism, of safety options by a respected information or opinion
source has the potential to influence more consumer choices than either a good understanding of the
technology or high-level technical explanations.
- Consumer’s perception of driving as a low-risk activity may also affect their receptivity to vehicle safety
information
2.3.7 Understanding of vehicle safety information (eg; star ratings) in vehicle purchase decisions?
- There is limited information in relation to whether the average consumer has a good understanding of
what consumer testing programs such as EuroNCAP, NCAP, ANCAP reveal about a vehicle’s
performance in a crash
- There is some evidence to suggest that there are large gaps in the knowledge of vehicle owners
regarding crash test results, as well as frequent misinterpretations.

CEA/EC SARAC II Literature review
33
2.4 Aims of the current study The aims of the current study are to determine:
• How consumers conceptualise vehicle safety,
• What they understand about vehicle safety,
• How important vehicle safety is in the new vehicle purchase process, and
• What importance they place on safety options/features relative to convenience and comfort features3.
In addition, given that a significant proportion of the new vehicle market is comprised of two purchasing
groups: individuals who purchase vehicles for private use (private vehicle purchasers) and individuals who
purchase or lease vehicles for business use (fleet vehicle purchasers), two questionnaires will be
developed to investigate the role that safety plays for both groups. For example, there are a range of
variables that are likely to significantly influence the vehicle purchase decision for private vehicle
purchasers, including demographic variables (i.e., age, gender, education, income) and previous motor
vehicle crash history. These potential explanatory variables will be included in the questionnaires.
As outlined previously, consumer surveys are often vulnerable to a range of potential biases. In order to
reduce these potential biases, it was recommended that the current consumer survey:
- Recruit participants through a random selection of Insurance company records (reduced sampling bias);
- Recruit participants if they have recently purchased a new vehicle (i.e., reducing hypothetical bias), and
- Recruit participants from two or more different countries (i.e., reducing cultural bias). It was
recommended that countries should be selected on the basis of their road safety records. For example,
consumers in geographic locations with a low road toll (e.g., Sweden) may have a significantly different
view on safety and risk compared to consumers in countries with a relatively high road toll (e.g., Spain).
Consequently, this research project was conducted in two phases. The first phase of this project was
conducted in Sweden. The second phase of this project was conducted in Spain.
It is anticipated that the information elicited from these questionnaires will be important for policy makers,
manufacturers and other stakeholders as knowledge of consumers’ views and preferences regarding
safety features will enable these bodies to set priorities with regard to the promotion and publicity of safety
features. Such knowledge will also help dispel any misconceptions relating to safety, the value of safety
features and their role in reducing the risk of injury/death. If consumers are made aware of safety issues
and are fully aware of the benefits of safety features when purchasing a new vehicle, a further reduction in
injuries and deaths related to motor vehicle crashes may be realised.
3 Although participants’ ‘willingness to pay’ to specific safety features was also of interest, it was not possible to administer willingness-to-pay questions using the selected questionnaire format (see the next section for the selected format).

CEA/EC SARAC II Method
34
3 Method This section of the report outlines study method, including the recruitment of private and fleet vehicle
purchasers in both Sweden and Spain and the development of the private vehicle purchaser and the fleet
manager questionnaires.
3.1 Recruitment of Participants
3.1.1 Sweden
3.1.1.1 Private purchasers
For the purpose of this study, private vehicle purchasers were defined as individuals who were the main or
joint decision maker in the purchase of a new vehicle within the last 18 months.
Identification of potential participants
Private vehicle purchasers were identified by research staff at Folksam Insurance in Stockholm, Sweden
who searched through their insurance records for customers who had purchased a new vehicle within the
last 18 months.
It had been anticipated that 300 private vehicle purchasers would need to complete the questionnaire to
ensure that statistically rigorous analysis of the results could be performed. Assuming a modest response
rate (10%), it was anticipated that approximately 3000 questionnaires would need to be sent to private
vehicle purchasers in order to achieve the target number.
Consequently, approximately 3000 Folksam Insurance customers who had purchased a new vehicle
within the last 18 months and were sent a letter of invitation and a copy of the private vehicle
questionnaire (see Appendix 1 and Appendix 2 respectively). A breakdown of the Folksam Insurance
policy holders who were sent a copy of the private vehicle questionnaire is shown in Table 2.

CEA/EC SARAC II Method
35
Table 2 Recruitment stratification by Age and Gender for Swedish Survey
(Folksam insurance policy holders)
Gender Age (years)
Male Female
Total
< 19 0 2 2
20-29 126 76 202
265 148 413
40-49 296 267 563
50-59 524 322 846
60-69 533 199 732
70-79 199 45 244
80-89 32 8 40
90-99 2 0 2
Total 1977 1067 3044
The figures in Table 2 are representative of the age and gender distribution of insurance policy holders
for new vehicles purchased in the Folksam Insurance database. Note that this may not be
representative of the entire Swedish private vehicle fleet.
3.1.1.2 Fleet Managers
For the purpose of this study, fleet vehicle purchasers were defined as individuals who are currently
responsible for the fleet purchase/lease decisions of their company.
Identification of potential participants
Fleet vehicle purchasers were identified by research staff at Folksam Insurance who searched through
their insurance records for fleet customers who had purchased or leased a new vehicle within the last 18
months
Due to the likely higher homogeneity between fleet vehicle purchasers than between private vehicle
purchasers, it had been anticipated that fewer fleet purchasers would need to be recruited (i.e., n = 25-50).
Based on a predicted minimum response rate of 10 percent, it was decided that 250-500 letters of
invitation would need to be sent to fleet vehicle purchasers in each country.
Three hundred and twenty nine Swedish companies with a fleet of vehicle were randomly selected from
the Folksam Insurance database and were sent a letter of invitation and a copy of the fleet manager
vehicle questionnaire (Appendix 1 and Appendix 3, respectively).

CEA/EC SARAC II Method
36
3.1.2 Spain
3.1.2.1 Private purchasers
For the purpose of this study, Spanish private vehicle purchasers were also defined as individuals who
were the main or joint decision maker in the purchase of a new vehicle within the last 18 months.
Identification of potential participants
Due to a number of practical constraints, the recruitment procedure and identification of potential
participants in Spain was different to the recruitment procedure outlined above for Sweden. In Spain, a
consultant group VI-VA administered the questionnaire under the supervision of Centro-Zaragoza. VI-
VA contacted individuals living in Madrid, Barcelona and Aragon by telephone and asked them if they
would like to participate in a telephone survey. Individuals who agreed to participate in the survey were
asked some preliminary questions to determine if they had bought a new vehicle in the past 18
months, if they were the main or joint decision maker in the purchase decision and some other
demographic questions to ensure that the sample was similar to that recruited in Sweden. If this
information was confirmed, the interviewer administered the private vehicle questionnaire over the
telephone (see Appendix 2).
As outlined previously, it had been anticipated that 300 private vehicle purchasers would need to complete
the questionnaire to ensure that statistically rigorous analysis of the results could be performed.
Consequently, interviewers continued to recruit participants until they had interviewed 300 private vehicle
purchasers.
3.1.2.2 Fleet Managers
For the purpose of this study, Spanish fleet vehicle purchasers were also defined as individuals who are
currently responsible for the fleet purchase/lease decisions of their company.
Identification of potential participants
The recruitment procedure and identification of potential participants in Spain was different to the
recruitment procedure outlined above for Sweden. Spanish fleet managers of companies in Madrid,
Barcelona and Aragon were telephoned by VI-VA staff and were asked if they would like to participate in a
telephone survey. Fleet managers who agreed to participate in the survey were asked some preliminary
questions to determine if they had bought a new company vehicle in the past 18 months and if they were
the person who was responsible for the fleet purchasing. If this information was confirmed, the interviewer
administered the fleet manger questionnaire over the telephone (see Appendix 3). As outlined previously,
it had been anticipated that 30-50 fleet managers would need to complete the questionnaire to ensure that
statistically rigorous analysis of the results could be performed. Consequently, the interviewers continued
to recruit participants until they had interviewed 50 fleet managers.

CEA/EC SARAC II Method
37
3.2 Questionnaire Development The questionnaires were designed to gather information about how consumers conceptualise vehicle
safety, what they understand about specific safety features or safety ratings, and what importance they
place on safety options/features relative to other convenience and comfort features.
Given that a significant proportion of the new vehicle market is comprised of two purchasing groups:
individuals who purchase vehicles for private use (private vehicle purchasers) and individuals who
purchase or lease vehicles for business use (fleet vehicle purchasers), two questionnaires were developed
to investigate the role that safety plays for both groups.
Both questionnaires were developed by the researchers at Monash University Accident Research
Centre (MUARC). Draft versions of both questionnaires were presented to the SARAC members for
comment. Revisions were made to the questionnaires based on feedback from SARAC members (see
Appendix 2 and Appendix 3).
3.2.1 Private purchasers The final version of the private purchaser questionnaire included a series of questions designed to
elicit information about the particular vehicle and vehicle characteristics purchased by the individual.
The questions included:
- The vehicle (make, model, price);
- Purpose of vehicle (personal, business, both);
- Reason for purchase (replacement for old or damaged car, first car, additional car);
- Information used in purchase decision (EuroNCAP results, sales rep., company website, word of mouth;
- Vehicle options available at the time of purchase and their costs;
- Vehicle options purchased (what additional cost was associated with vehicle options);
- Safety features available or offered at the time of purchase and their costs;
- Safety features purchased (what additional cost was associated with safety features); and
- Future purchases (vehicle options or safety features likely to be taken into account in any future purchase of a motor vehicle).
In addition, a range of demographic factors and other variables that may significantly influence the
vehicle purchase decision for private vehicle purchasers were included in the questionnaire.
Demographics factors included: gender, age, education level, driving exposure measures, and
geographic location. Other variables included questions relating to their attitude towards road safety
issues (i.e., their understanding of issues such as driver distraction, speeding, fatigue, drunk driving),
and previous motor vehicle crash history.
The final version of the questionnaire was translated into both Swedish and Spanish.

CEA/EC SARAC II Method
38
3.2.2 Fleet Manager Questionnaire The final version of the fleet manager questionnaire included a series of questions designed to elicit
information regarding the selection criteria for vehicles and identify the number and purpose of
vehicles purchased during a year. The questions included:
- Does the company have an official policy regarding the selection criteria for new vehicle purchases;
- If yes, does the set contain each (or any) of the following criteria:
o Vehicle type/body design
o Purchase price
o Warranty period
o Service contracts
o Fuel economy
o Safety features (if yes to safety features, what weighting does this criteria have in the selection assessment)
o Driver preference
o Purpose of vehicle (courier, sales rep. etc)
o Country of manufacturer
o Vehicle leased or purchased
- Does the company have an official policy regarding the use of company vehicles
It was also anticipated that a company’s vehicle purchase criteria would be significantly related to other
explanatory variables such as attitudes towards road safety issues and prior experience of work-related
motor vehicle crashes. Questions relating to these explanatory variables were also included in the
questionnaire.
The final versions of the questionnaires were translated into both Swedish and Spanish.
3.3 Analyses Several descriptive analyses were undertaken to investigate the importance vehicle safety is in the new
vehicle purchase process. For example, t-tests and chi-squares analyses were conducted, where
appropriate, to explore differences between groups of participants based on country, gender, age and
other relevant variables. A Bonferroni correction was applied to adjust for the number of comparisons
being performed and protect against an inflated probability of Type 1 errors (finding a significant effect
when it is due to chance). Logistic regression analysis was also undertaken in order to identify the relative
contribution of variables in explaining ‘safe vehicle purchasers’.

CEA/EC SARAC II Results & Discussion – PRIVATE Purchasers
39
4 Results & Discussion – PRIVATE Purchasers The next section of the report describes the findings from the questionnaires in both Sweden and Spain.
The findings from the private purchaser questionnaire will be outlined and the implications dicussed first,
followed by the findings and discusion of the fleet manager questionnaire.
This section of the report describes the results of the private vehicle purchaser questionnaire. The
recruitment rates for each country are outlined first, followed by the participants’ responses to the private
purchaser questionnaire.
4.1 Recruitment Rates
4.1.1 Sweden As outlined earlier, private vehicle purchaser questionnaires were sent out to 3044 individuals who had
been identifed in the Folksam Insurance database.
A total of 1012 private vehicle questionnaires were completed and returned to the research staff at
Folksam Insurance, making a response rate of 33 percent. Table 3 shows the number and percentage of
policy holders (described in Table 2) who returned their questionnaire classified by age and gender. It
should be noted that the age and/or gender data for was not provided by 118 participants (12%).
Table 3 Number and Percentage of Folksam Insurance policy holders who returned their copy
of the private vehicle questionnaire sorted by Age and Gender
Gender
Male Female
Total Age (years)
N % N % N %
< 19 0 N/A 0 0% 0 0%
20-29 19 15% 16 21% 35 17%
30-39 39 15% 21 14% 60 15%
40-49 91 31% 59 22% 120 21%
50-59 163 31% 82 25% 245 29%
60-69 217 41% 76 38% 293 40%
70-79 73 37% 17 38% 90 37%
80-89 16 50% 3 38% 19 48%
90-99 2 100% 0 N/A 2 100%
Total 620 31% 274 26% 894 29%

CEA/EC SARAC II Results & Discussion – PRIVATE Purchasers
40
As shown in Table 3, the highest response rates for the sample were found amongst those aged 60 years
and over and the lowest response rates amongst those aged 39 years and under.
4.1.2 Spain The recruitment procedure for Spain was different to the recruitment procedure outlined above for
Sweden. In Spain, individuals living in Madrid, Catalonia and Aragon were telephoned by VI-VA staff and
were invited to participate in a telephone survey. Interviewers were instructed to continue to recruit
participants until they had interviewed 300 private vehicle purchasers. Those who declined to participate
were asked to indicate a reason for their non-participation. Table 4 shows the reasons for non-participation
across the three Spanish regions.
Table 4 Reasons for non-participation by Spanish region
Madrid Catalonia Aragon Total
N % N % N % N %
Did not answer 2nd call
2235 54% 1169 45% 977 51% 4381 51%
Did not want to participate
267 6% 222 6% 139 10% 628 7%
Did not meet requirements
1645 40% 917 49% 1036 39% 3598 42%
Incomplete responses
3 0% 2 0% 0 0% 5 0%
Total 4150 100 2310 100 2152 100 8612 100
As shown in Table 4, most individuals in Spain did not complete the questionnaire because they did not
answer the telephone call (51%) or did not meet the requirements (42%). Only a small proportion of
individuals were not interested in participating in the study (7%). In addition, 5 respondents failed to
provide sufficient information to be included in the questionnaire analysis.
4.2 Questionnaire Results The next section of the report describes the findings from the responses to the private vehicle purchaser
questionnaire for both countries. The first section will describe the participant’s responses to the
demographic section of the questionnaire, the second section will decribe the participant’s responses to
the crash and infringement history section of the questionnaire and the third section will describe the
participant’s responses to the vehicle purchase process questions. Within each section, the questions
from the questionannaire are stated, followed by the findings for each country and comparisons.
4.2.1 Demographic Information Participants were asked demographic questions relating to information that may significantly affect their
perceptions of safety and/or their vehicle purchase decision.

CEA/EC SARAC II Results & Discussion – PRIVATE Purchasers
41
Question: “What is your age and gender?”
New vehicle purchasers were asked to report their age and gender (see Figure 2).
0
10
20
30
40
50
60
70
< 19 20-29 30-39 40-49 50-59 60-69 70-79 80-89 90-99
Perc
enta
geSweden Male Sweden Female Spain MaleSpain Female
Figure 2 Percentage of Swedish and Spanish participants who completed the private vehicle
questionnaire sorted by Age and Gender
Over two thirds of the Swedish participants who completed and returned the private vehicle purchaser
questionnaire were male (69%). The mean age of Swedish participants was 56.30 years (SD = 13.00
years), with participants’ ages ranging from 20 years to 96 years. Swedish male participants were
significantly older (M = 58.78 years, SD = 12.75) than female participants (M = 53.24 years, SD = 12.60), t
(892) = 4.932, p < 0.001.
Similarily, over two thirds of the Spanish participants who completed the private vehicle purchaser
questionnaire were male (68%). The mean age of Spanish participants was 49.14 years (SD = 11.52
years), with participants’ ages ranging from 19 years to 75 years. Consistent with the Swedish sample,
Spanish male participants were also significantly older (M = 50.43 years, SD = 10.81 years) than female
participants (M = 46.35 years, SD = 12.52), t (161.36) = 2.74, p < 0.01.
Swedish participants who completed the questionnaire were significantly older (M = 56.30 years, SD =
13.00 years) than participants who completed the questionnaire in Spain (M = 49.14, SD = 11.52),
t(548.98) = 9.15, p < 0.001.
Question: “What is your marital status?”
Participants were asked to state their current marital status (see Figure 3).

CEA/EC SARAC II Results & Discussion – PRIVATE Purchasers
42
0
10
20
30
40
50
60
70
80
90
Married/Defacto Not married Widow ed Divorced/Separated
Perc
enta
ge
Sw eden
Spain
Figure 3: Participants’ current marital status for Sweden and Spain
As shown in Figure 3, the majority of both Sweden and Spanish participants reported that they were
currently either married or in a defacto relationship (82%, 77%, respectively). There was a significant
difference in the marital status of participants across the two countries, χ2 (3) = 24.83, p < 0.001.
Question: “How many children under the age of 16 years are living in your household?”
New vehicle purchasers were asked to state if there were any children under the age 16 years living in
their household (see Figure 4).
0
10
20
30
40
50
60
70
80
90
0 1 2 3 4
Per
cent
age
Sweden
Spain
Figure 4: Number of children under 16 years living in the household for Sweden and Spain

CEA/EC SARAC II Results & Discussion – PRIVATE Purchasers
43
Most Swedish and Spanish participants reported that there were no children under of the age of 16 years
living in their household (81%, 69%, respectively). There was no significant difference across the two
countries, χ2 (5) = 8.94, p > 0.1.
Question: “What is the highest level of education you reached?”
Participants were asked to state the highest level of education reached (see Figure 5).
0 5 10 15 20 25 30 35 40
Secondary school
Technical school or Commerical college
Some University or College training
Degree from University, College orhigher degree
Now at University or College
Other
Percentage
SpainSweden
Figure 5 Highest level of education reached for Sweden and Spain
Most Swedish and Spanish participants reported that they had finished technical school or commercial
college (which includes trade certificate or other certificate or apprenticeship) (35%, 34%, respectively) or
secondary school (29%, 24%, respectively).
Question: “What is your current yearly household income?”
Participants were asked to state their current yearly household (in Euro) (see Figure 6). There was a
significant difference in participants’ current yearly household income across the two countries, χ2 (5) =
81.28, p < 0.001. Most participants in Sweden reported that their current yearly household income was
over 50,001 euro per year, whereas most Spanish participants reported that their current yearly household
income was between 20,001 and 30,000 euro per year.

CEA/EC SARAC II Results & Discussion – PRIVATE Purchasers
44
0
5
10
15
20
25
30
35
40
< 10,000 10,001-20,000
20,001-30,000
30,001-40,000
40,001-50,000
> 50,001
Perc
enta
geSwedenSpain
Figure 6 Participants’ current yearly household income for Sweden and Spain
Question: “On average, how many kilometres is the vehicle driven per year?”
Particpants were asked to estimate how many kilometres they drive their recently purchased vehicle per
year (see Figure 7).
0
5
10
15
20
25
30
35
40
45
< 10,000 10,001-15,000
15,001-20,000
20,001-25,000
25,001-30,000
> 30,001
Perc
enta
ge
SwedenSpain
Figure 7 Number of kilometres the new vehicle is driven per year for Sweden and Spain
Most participants from both Sweden and Spain reported that their new vehicle is driven between 10,001-
15,000 kilometres per year (39%, 28%, respectively). There was, however, a significant difference
between the two groups in the number of kilometres the new vehicle is driven per year, χ2 (5) = 20.99, p <
0.001.

CEA/EC SARAC II Results & Discussion – PRIVATE Purchasers
45
4.2.2 Crash and Infringement History
In the second part of the questionnaire, participants were asked a number of questions about their crash
and infringement history that may have significantly affected their perceptions of safety and/or their vehicle
purchase decision.
Question: “Have you been involved in a motor vehicle crash in the last three years?”
New vehicle purchasers were asked to report if they had been involved in a motor vehicle crash in the past
three years. There was no significant difference in the proportion of participants who indicated that they
had been involved in a motor vehicle crash in the last three years across the two countries (Sweden: 8%,
Spain: 10%), χ2 (1) = 1.14, p > 0.1.
In Sweden, there was a significant relationship between crash history and age: Younger participants were
significantly more likely to report being involved in a crash (20%) compared to middle aged (7%) or older
driver (7%), χ2 (2) = 20.058, p < 0.001. In Spain there was no significant relationship between crash
history and age, χ2 (2) = 0.62, p > 0.5.
In both Sweden and Spain, there was no significant relationship between crash history and gender (χ2 (1)
= 0.107, p > 0.5; χ2 (1) = 0.23, p > 0.5, respectively).
Question: “If you have been involved in a motor vehicle crash, what were the outcomes?”
Participants, who indicated that they had been involved in a motor vehicle crash in the past three
years, were asked to describe the outcomes of their motor vehicle crash (see Figure 8).
0
10
20
30
40
50
60
70
Vehicle towedaway
No injuries Minor injuries Serious injuries
Perc
enta
ge
SwedenSpain*
Figure 8 Outcomes associated with participants’ motor vehcile crashes for Sweden and Spain

CEA/EC SARAC II Results & Discussion – PRIVATE Purchasers
46
As shown in Figure 8, Spanish participants were more likely to report that their motor vehicle crash
resulted in the vehicle being towed away (65%) compared to Swedish participants (37%), however this
result failed to reach statistical significance, χ2 (1) = 5.63, p > 0.01.
In addition, Swedish participants were significantly more likely to report that there were no injuries
associated with their motor vehicle crash (59%) compared to Spanish participants (29%), χ2 (1) = 11.30, p
< 0.001.
Question: “Have you incurred any traffic infringements in the past three years?”
Participants were asked to report if they had incurred any traffic infringements (other than parking fines)
over the past three years. Participants in Sweden were significantly more likely to report that they had
incurred a traffic infringement(s) over the past three years (49%) compared to participants in Spain (19%),
χ2 (1) = 88.58, p < 0.001.
In Sweden, there was a significant relationship between traffic infringements and age: Older participants
were significantly less likely to report incurring traffic infringements (40%) compared to middle aged (57%)
or younger participants (57%), χ2 (2) = 30.198, p < 0.001. In Spain, however, there was no significant
relationship between traffic infringements and age, χ2 (2) = 0.07, p > 0.5.
In Sweden, there was a significant relationship between traffic infringements and gender: Male participants
were significantly more likely to report having incurred traffic infringements (55%) compared to female
participants (39%), χ2 (1) = 19.549, p < 0.001. In Spain, however, there was no significant relationship
between traffic infringements and gender, χ2 (1) = 2.27, p > 0.1.
Interestingly, for both Sweden and Spain, there was no significant relationship between crash history and
traffic infringements (Sweden: χ2 (1) = 0.918, p > 0.1; Spain: χ2 (1) = 1.16, p > 0.1).
Question: “If you have incurred a traffic infringement over the past three years, please list them?”
Participants who reported having incurred traffic infringements over the past three years were asked to
describe them (see Figure 9). The majority of participants from both Sweden and Spain who reported that
they had received a traffic infringement indicated that their traffic infringement was for speeding (94%,
75%, respectively).

CEA/EC SARAC II Results & Discussion – PRIVATE Purchasers
47
0102030405060708090
100
Speeding Red lightrunning
Drink driving Not wearinga seatbelt
Other
Per
cent
age
SwedenSpain
*
Figure 9: Types of traffic infringements incurred by participants over the past three years
for Sweden and Spain
Participants in Sweden were significantly more likely to report that they incurred a speeding fine in the past
three years compared to participants in Spain, χ2 (1) = 32.21, p < 0.001. The cross-country differences for
the remaining traffic infringements did not reach statistical significance (Red light running: χ2 (1) = 9.88, p
> 0.01; Drink driving: χ2 (1) = 3.39, p > 0.05; Not wearing a seatbelt: χ2 (1) = 5.33, p > 0.01).
Question: “How concerned are you about the possibility of being involved in a motor vehicle crash?”
All new vehicle purchasers were asked to rate their level of concern about the possibility of being in a
motor vehicle crash (where 1 = “not at all concerned” and 5 = “very concerned”) (see Figure 10).
0
5
10
15
20
25
30
35
1 2 3 4 5
Perc
enta
ge
SwedenSpain
Not at all concerened
Very concerend
Figure 10: Participants’ concern about the possibility of being invovled in a motor vehicle crash for Sweden and Spain

CEA/EC SARAC II Results & Discussion – PRIVATE Purchasers
48
Participants’ concern about the possibility of being involved in a motor vehicle crash was significantly
different across the two countries, χ2 (4) = 337.898, p < 0.001. Most Swedish participants indicated a low
level of concern (33%) or not at all concerned (25%) however most Spanish participants indicated that
they were very concerned (31%) about the possibility of being involved in a motor vehicle crash.
There was a significant relationship between the Swedish participants’ age (younger/middle/older) and
their concern about being involved in a motor vehicle crash, χ2 (6) = 13.678, p < 0.01. Older participants
appeared to be less concerned about being involved in a crash than middle-aged participants.
In addition, there was a significant relationship between the Swedish participants’ gender and their
concern about being involved in a motor vehicle crash, χ2 (3) = 16.947, p < 0.05. Male participants
appeared to be significantly less concerned about being in a motor vehicle crash compared to female
participants.
Interestingly, there was no significant relationship for Swedish participants between being involved in a
motor vehicle crash over the past three years and concern about being involved in a motor vehicle crash,
χ2 (3) = 3.425, p > 0.10.
In contrast to the findings for Swedish participants, there was no significant relationship between the
Spanish participants’ concern about being involved in a motor vehicle crash and their age group
(younger/middle/older) (χ2 (8) = 11.270, p > 0.10), gender (χ2 (4) = 7.854, p > 0.10) or their crash history
(χ2 (4) = 4.179, p > 0.10).
Question: “To what extent do you feel that you are able to protect yourself and your family from a motor vehicle crash?”
All participants were asked to indicate the extent to which they feel they can protect themselves and their
family from a motor vehicle crash (where 1 = “I can’t do much” and 5 = “I can do a lot”) (see Figure 11).
0
5
10
15
20
25
30
35
40
1 2 3 4 5
Perc
enta
ge
SwedenSpain
I can do a lot
I can't do much
Figure 11 The extent to which participants believe that they are able to protect themselves and their family from a motor vehicle crash for Sweden and Spain

CEA/EC SARAC II Results & Discussion – PRIVATE Purchasers
49
The extent to which participants believe that they are able to protect themselves and their family from a
motor vehicle crash was significantly different across the two countries, χ2 (4) = 27.405, p < 0.001.
Swedish participants were less likely to report that they could do something or do a lot (63%) compared to
Spanish participants (49%).
For both countries, there was no significant relationship between the extent to which participants believe
that they can do something to protect themselves and their family from a motor vehicle crash and
participants’ age (younger/middle/older) (Sweden: χ2 (8) = 12.649, p > 0.10; Spain: χ2 (8) = 7.854, p >
0.10), gender (Sweden: χ2 (4) = 5.381, p > 0.10; Spain: χ2 (4) = 2.615, p > 0.50) and being involved in a
motor vehicle crash over the past three years (Sweden: χ2 (4) = 1.103, p > 0.50; Spain χ2 (4) = 2.116, p >
0.50).
4.2.3 Vehicle Purchase Section
The final section of questionnaire included a series of questions designed to elicit information about the
particular vehicle and vehicle characteristics purchased by the individual, the types of information used in
their purchase decision, the participant’s perception of vehicle safety and the importance of vehicle safety
features in the purchase decision.
Question: “What kind of vehicle make and model did you recently purchase?”
New vehicle purchasers were asked to indicate the make of the vehicle that they recently purchased (see
Figure 12).
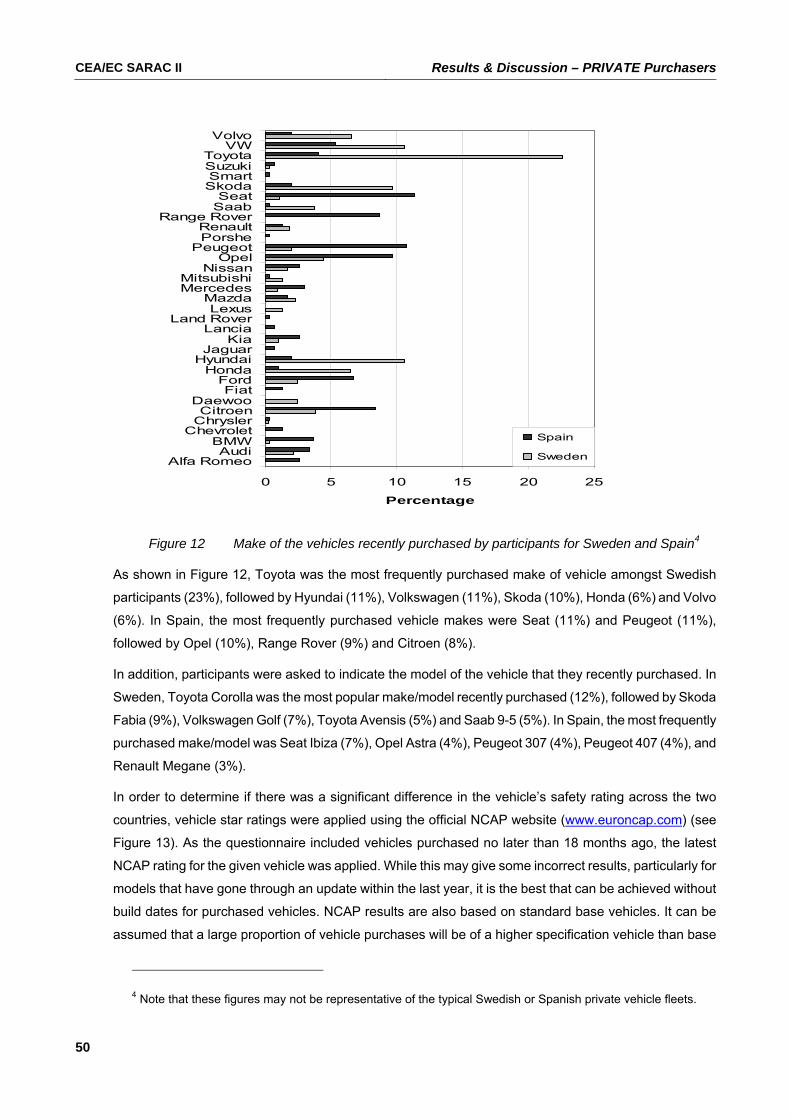
CEA/EC SARAC II Results & Discussion – PRIVATE Purchasers
50
0 5 10 15 20 25
Alfa RomeoAudi
BMWChevrolet
ChryslerCitroen
DaewooFiat
FordHonda
HyundaiJaguar
KiaLancia
Land RoverLexus
MazdaMercedesMitsubishi
NissanOpel
PeugeotPorsheRenault
Range RoverSaabSeat
SkodaSmartSuzukiToyota
VWVolvo
Percentage
Spain
Sweden
Figure 12 Make of the vehicles recently purchased by participants for Sweden and Spain4
As shown in Figure 12, Toyota was the most frequently purchased make of vehicle amongst Swedish
participants (23%), followed by Hyundai (11%), Volkswagen (11%), Skoda (10%), Honda (6%) and Volvo
(6%). In Spain, the most frequently purchased vehicle makes were Seat (11%) and Peugeot (11%),
followed by Opel (10%), Range Rover (9%) and Citroen (8%).
In addition, participants were asked to indicate the model of the vehicle that they recently purchased. In
Sweden, Toyota Corolla was the most popular make/model recently purchased (12%), followed by Skoda
Fabia (9%), Volkswagen Golf (7%), Toyota Avensis (5%) and Saab 9-5 (5%). In Spain, the most frequently
purchased make/model was Seat Ibiza (7%), Opel Astra (4%), Peugeot 307 (4%), Peugeot 407 (4%), and
Renault Megane (3%).
In order to determine if there was a significant difference in the vehicle’s safety rating across the two
countries, vehicle star ratings were applied using the official NCAP website (www.euroncap.com) (see
Figure 13). As the questionnaire included vehicles purchased no later than 18 months ago, the latest
NCAP rating for the given vehicle was applied. While this may give some incorrect results, particularly for
models that have gone through an update within the last year, it is the best that can be achieved without
build dates for purchased vehicles. NCAP results are also based on standard base vehicles. It can be
assumed that a large proportion of vehicle purchases will be of a higher specification vehicle than base
4 Note that these figures may not be representative of the typical Swedish or Spanish private vehicle fleets.

CEA/EC SARAC II Results & Discussion – PRIVATE Purchasers
51
model vehicle, as the survey conducted was for private purchases. Fleet sales, tend to make up the bulk
of base model vehicle sales. While this may not necessarily mean the addition of extra safety features in
the vehicle, it is to be expected that some models will gain extra safety equipment. Thus the star ratings
will be somewhat conservative. Where NCAP ratings were not available for Europe, results from
Australian NCAP were substituted (http://www.aaa.asn.au/NCAP/ozindex.htm). While vehicle specification
levels can be different in Europe and Australia, it is often Europe that has standard safety features that are
either unavailable in Australia or an optional extra. Thus again the results presented will be somewhat
conservative.
0 10 20 30 40 50 60
Not tested
1 star
2 stars
3 stars
4 stars
5 stars
Percentage
SpainSweden
Figure 13 Latest NCAP ratings for participants’ new vehicles for both Sweden and Spain5
As shown in Figure 13, most of the new vehicles purchased by participants from both Sweden and Spain
had a 4 star NCAP rating (54%, 45%, respectively), however there was a significant difference across the
two countries, χ2(4) = 22.716, p < 0.001. More specifically, participants from Sweden were significantly
more likely to purchase a 4 or 5 star rated new vehicle (87%) compared to Spanish participants (81%),
χ2(1) = 7.472, p < 0.01.
In addition, each of the new vehicles purchased in each country were classified according to their market
class (see Figure 14). Market classification was taken from the class categorisation from the official NCAP
website. Classifications in Europe tend to be somewhat different to the Australian fleet classifications.
Where possible though, vehicles rated via the ANCAP system were given a classification that suited
similar vehicles in the NCAP defined classification system. More obscure vehicles that did not meet any
existing classifications, or alternatively were unfamiliar, were left without a vehicle classification.
Considering that the majority of these vehicles were not tested using the NCAP rating system, it was felt
that it somewhat unnecessary to classify these vehicles.
5 Note that this is a characteristic of the sample studied and is unlikely to be representative of the typical Swedish and Spanish private vehicle fleet.
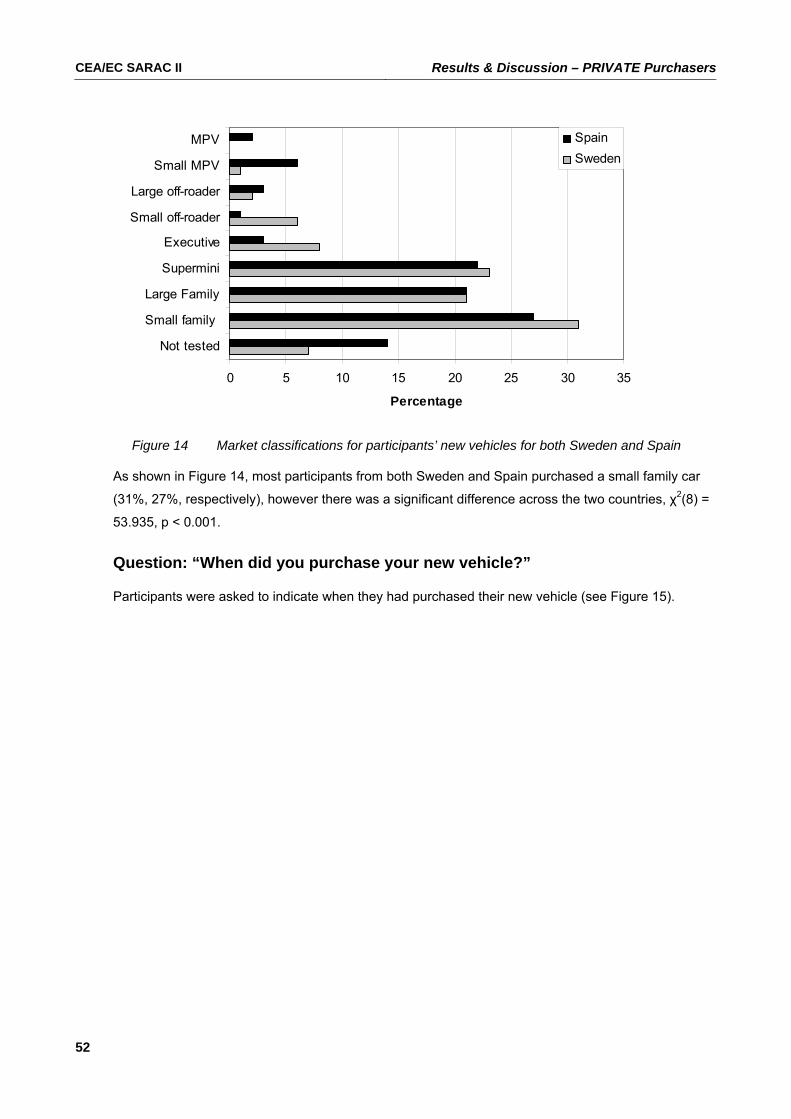
CEA/EC SARAC II Results & Discussion – PRIVATE Purchasers
52
0 5 10 15 20 25 30 35
Not tested
Small family
Large Family
Supermini
Executive
Small off-roader
Large off-roader
Small MPV
MPV
Percentage
Spain Sweden
Figure 14 Market classifications for participants’ new vehicles for both Sweden and Spain
As shown in Figure 14, most participants from both Sweden and Spain purchased a small family car
(31%, 27%, respectively), however there was a significant difference across the two countries, χ2(8) =
53.935, p < 0.001.
Question: “When did you purchase your new vehicle?”
Participants were asked to indicate when they had purchased their new vehicle (see Figure 15).

CEA/EC SARAC II Results & Discussion – PRIVATE Purchasers
53
0
1020
30
40
5060
70
8090
100
1-6 months ago 7-12 months ago 13-18 months ago
Per
cent
age
SwedenSpain
Figure 15 Time frame in which participants have purchased their new vehicle
for both Sweden and Spain
There was a significant difference across the two countries in terms of the time frame in which the
participants had purchased their new vehicle, χ2(2) = 524.835, p < 0.001. In Sweden, most participants
reported that they had purchased their new vehicle in the past 6 months (94%). The remaining participants
indicated that they had purchased their vehicle in the past 7-12 months (6%). In Spain, most participants
reported that they had purchased their new vehicle in the past 6 months (35%) or in the past 7-12 months
(36%).
Question: “Were you the main or joint decision maker when deciding which vehicle to purchase?”
New vehicle purchasers were asked to indicate if they were the main or joint decision maker in their new
vehicle purchase. Participants in Sweden were significantly more likely to state that they made the
decision jointly (73%) compared to participants in Spain (62%), χ2(2) = 16.700, p < 0.001.
For both Swedish and Spanish participants, there was no significant relationship between being the main
decision maker and age group (Sweden: χ2 (2) = 2.056, p > 0.05; Spain: χ2 (2) = 10.372, p < 0.01) or
gender: (Sweden: χ2 (1) = 5.287, p > 0.01; Spain: χ2 (1) = 0.544, p > 0.50).
Question: “If you made the decision jointly, please state who else made the decision about the new vehicle with you?”
Participants who indicated that they had made the new vehicle decision jointly, were then asked to list the
other decision makers (see Figure 16).

CEA/EC SARAC II Results & Discussion – PRIVATE Purchasers
54
0
1020
30
40
5060
70
8090
100
Spouse Son/daughter Other
Perc
enta
ge
SwedenSpain
Figure 16 Individuals who made the new vehicle decision jointly with participants
for Sweden and Spain
Of those Swedish and Spanish participants who indicated that they had made the new vehicle decision
jointly, most indicated that the decision had been made with their spouse/partner (94%, 84%,
respectively).
Question: “How long do you plan to own this vehicle?”
New vehicle purchasers were asked to indicate how long they intended to own their new vehicle.
Participants from Spain anticipated that they would own their vehicle for a significantly longer time period
(M = 7.46 years, SD = 3.27 years, Range 1-20 years) compared to participants from Sweden (M = 5.88
years, SD = 3.47 years, Range = 1-32 years), t(1119) = -6.24, p< 0.001.
Question: “Are you the main driver of this new vehicle?”
Participants were asked to indicate if they were the main driver of the new vehicle.
Most participants from both Sweden and Spain reported that they were the main driver of the new vehicle
(84%, 80%, respectively). There was no significant difference across the two countries, χ2 (1) = 2.201, p >
0.10.
For both countries, there was no significant relationship between being the main driver and age group
(Sweden: χ2 (2) = 0.965, p > 0.50; Spain: χ2 (2) = 0.426, p > 0.50) or gender (Sweden: χ2 (2) = 0.267, p >
0.50; Spain: χ2 (1) = 3.466, p > 0.05).
Question: “What were the main reasons for purchasing this vehicle?”
Participants were asked to indicate the main reasons for purchasing their new vehicle. Participants were
instructed to indicate as many reasons as appropriate (see Figure 17).

CEA/EC SARAC II Results & Discussion – PRIVATE Purchasers
55
0 20 40 60 80 100
Replacing old vehicleReplacing damaged vehicle
Replacing another vehiclePurchasing for son/daughter
Purchasing for spousePurchasing for business
Purchasing 1st vehiclePurchasing safer vehicle
Purchasing more suitable vehicleOther
Percentage
Spain
Sweden
*
*
*
*
Figure 17 Participants’ main reasons for purchasing their new vehicle for Sweden and Spain
As shown in Figure 17, most participants from both Sweden and Spain reported that they purchased a
new vehicle because they were replacing an old vehicle (77%, 73%, respectively).
Several reasons for purchasing the new vehicle differed significantly across the two countries. Swedish
participants were significantly more likely to report that they were purchasing their first vehicle compared
to Spanish participants, χ2 (1) = 21.017, p < 0.001.
Spanish participants were significantly more likely to report that they were purchasing a safer vehicle, a
vehicle for business purposes or to replace another vehicle compared to Swedish participants (χ2 (1) =
40.986, p < 0.001; χ2 (1) = 24.525, p < 0.001; χ2 (1) = 24.687, p < 0.001, respectively).
Question: “What sources of information did you use when purchasing your new vehicle?”
New vehicle purchasers were asked to indicate the sources of information they used when purchasing
their new vehicle. Participants were instructed to indicate as many sources as appropriate (see Figure 18).

CEA/EC SARAC II Results & Discussion – PRIVATE Purchasers
56
0 20 40 60 80 100
Manufacturer website
EuroNCAP
Motoring websites
Consumer reports
Motoring magazines
Vehicle dealership
Word of mouth (professional)
Word of mouth (family/friend)
Other
Percentage
Spain
Sweden
*
*
*
*
*
*
*
*
Figure 18 Information sources used when purchasing their new vehicle for Sweden and Spain
As shown in Figure 18, Swedish participants were significantly more likely to report that they used
manufacturer websites, EuroNCAP ratings, motoring websites, consumer reports, motoring magazines,
information from professional sources and other sources of information compared to Spanish participants
(χ2 (1) = 131.831, p < 0.001; χ2 (1) = 103.800, p < 0.001; χ2 (1) = 30.389, p < 0.001; χ2 (1) = 102.942, p <
0.001; χ2 (1) = 10.557, p < 0.01; χ2 (1) = 56.247, p < 0.001; χ2 (1) = 12.489, p < 0.001, respectively).
Spanish participants were significantly more likely to report that they used the vehicle dealership
compared to Swedish participants, χ2 (1) = 461.367, p < 0.001.
Question: “What source of information was most valuable when deciding which vehicle to purchase?”
Participants were asked to indicate which source of information was the most valuable to them in the
purchasing decision (see Figure 19).
CEA/EC SARAC II Results & Discussion – PRIVATE Purchasers
57
0 10 20 30 40 50 60 70 80
Manufacturer website
EuroNCAP
Motoring websites
Consumer reports
Motoring magazines
Vehicle dealership
Word of mouth (professional)
Word of mouth (family/friend)
Other
Percentage
SpainSweden
Figure 19 The most valuable source of information when deciding which vehicle to purchase
As shown in Figure 19, the most valuable source of information used in the new vehicle purchase process
differed significantly across the two countries, χ2 (8) = 442.571, p < 0.001. Swedish new vehicle
purchasers cited motoring magazines (32%) as the most valuable source of information, whereas Spanish
participants were more likely to list the vehicle dealership as the most valuable source of information.
Question: “List the three most important factors that you considered when deciding which vehicle to purchase?”
Participants were then asked to list the three most important factors that they considered when deciding
which vehicle to purchase6. Participants were instructed to list the most important factor first (see Table 5).
When considering the factors that were considered first (i.e., the most important consideration), Swedish
participants listed safety (36%), price (14%) and fuel consumption (7%), Spanish participants also listed
safety (19%), as well as design (13%), price (10%) and engine (10%).
The majority of Swedish and Spanish participants listed ‘safety’ as one of the three important factors when
deciding which vehicle to purchase (70%, 43%, respectively).
Swedish participants were significantly more likely to list safety as their most important consideration and
as one of their top three considerations than Spanish participants (χ2 (1) = 31.935, p < 0.001, χ2 (1) =
73.004, p < 0.001, respectively).
6 Note that this question was designed to be an open-ended (i.e., un-prompted) question.

CEA/EC SARAC II Results & Discussion – PRIVATE Purchasers
58
Table 5: Three most important factors considered by participants when purchasing their new
vehicle for Sweden and Spain (tabled data are the % of participants)
1st Factor 2nd Factor 3rd Factor Sweden Spain Sweden Spain Sweden Spain
Comfort 4 5 10 5 13 8
Design/style 3 13 4 14 11 11
Feeling when driving 1 1 3 1 5 1
Economy/value 4 1 5 0 4 2
Engine 0 10 0 6 1 6
Equip/Tech/Features 0 3 3 3 3 8
ESP 0 3 0 5 0 5
Fuel consumption 7 3 10 6 7 2
Maintenance/Service 1 0 3 0 5 0
Make/model 2 8 2 6 1 6
Performance 0 3 1 8 1 6
Price 14 10 10 8 11 9
Reliability 6 1 3 1 4 1
Safety 36 19 22 13 12 11
Size 3 6 3 5 3 4
Space 1 5 3 4 3 6
It was interesting to note that factors such as safety and price appeared to be considered first by the new
vehicle purchasers, whereas factors such as vehicle design, comfort, fuel consumption,
maintenance/service and the feelings associated with driving the vehicle were more likely to be considered
as the second or third factor.
Several analyses were conducted which aimed to examine the differences between participants who had
listed ‘safety’ as an important consideration compared to those who did not.
Swedish participants who listed ‘safety’ as an important consideration in the new vehicle purchase process
were significantly younger (M = 55.44 years, SD = 12.63 years) compared to participants who did not
consider safety (M = 57.67 years, SD = 13.46 years), t(990) = 2.632, p < 0.01. In addition, female
participants were more likely to list safety as a consideration (66%) compared to males (60%), however
this finding failed to meet significance, χ2 (1) = 3.283, p = 0.07.
There was no relationship between Spanish participants who had listed ‘safety’ as an important
consideration and their age (t(298) = 0.317, p > 0.5) or their gender (χ2 (1) = 0.521, p > 0.01).

CEA/EC SARAC II Results & Discussion – PRIVATE Purchasers
59
Question: “Which factors are priorities in your new vehicle choice?”
New vehicle purchasers were asked to select vehicles factors from a list that were a priority in their new
vehicle choice by indicating whether the factors were a ‘high’, ‘medium’ or ‘low’ priority. Figure 20 shows
the items that were reported to be a ‘high’ priority for participants in their new vehicle purchase decision.
0 20 40 60 80 100
Comfort Country
EuroNCAPFuel
Make/ModelPerformance
PriceReliability
ReputationRe-sale
Running costsStyleSizeType
Warranty
Percentage
SpainSweden
**
**
**
**
*
Figure 20 Factors that were priorities to participants in the new vehicle purchase decision7
As shown in this figure, reliability was cited most often by participants from both Sweden and Spain as a
‘high priority’ in the new vehicle purchase decision (79%, 76% respectively).
There were, however, several significant differences across the two countries in terms of the factors that
were considered to be ‘high priorities’. For example, Swedish participants were significantly more likely to
report that the vehicle’s EuroNCAP rating/other safety reports, fuel consumption, reputation, re-sale value,
running costs, and warranty and service plans were high priorities in their new vehicle decision process
compared to Spanish participants (χ2(1) = 27.548, p < 0.001; χ2(1) = 18.798, p < 0.001; χ2(1) = 24.269, p <
0.001; χ2(1) = 81.397, p < 0.001 χ2(1) = 139.096, p < 0.001; χ2(1) = 48.635, p < 0.001, respectively).
Spanish participants were significantly more likely to report that the vehicle’s make/model, performance
and style were high priorities in their new vehicle decision process compared to Swedish participants
(χ2(1) = 9.352, p < 0.01; χ2(1) = 67.395, p < 0.001; χ2(1) = 31.282, p < 0.001, respectively).
7 Note that EuroNCAP was listed on the questionnaire as ‘EuroNCAP/other safety reports’.

CEA/EC SARAC II Results & Discussion – PRIVATE Purchasers
60
Question: “For those factors that you rated ‘high’, please rank in order from highest (1) to lowest?”
For those factors rated as a ‘high’ priority, participants were then asked to rank the factors in order from
highest (1) to lowest. Figure 21 shows the items that were ranked as the most important factor in their new
vehicle purchase/lease decision.
0 10 20 30 40 50
Comfort Country
EuroNCAPFuel
Make/ModelPerformance
PriceReliability
ReputationRe-sale
Running costsStyleSizeType
Warranty
Percentage
SpainSweden
*
*
*
*
**
*
Figure 21 Factors ranked as the highest priority in the new vehicle purchase decision for Sweden and Spain8
EuroNCAP ratings/other safety reports ranked as the most important factor by most Swedish participants
(43%), while comfort ranked as the most important factor by most Spanish participants (30%).
There were several significant differences across the two countries in terms of the factors that were
ranked as the highest priority in the new vehicle purchase process.
Swedish participants were significantly more likely to rank the vehicle’s EuroNCAP rating/other safety
reprots, price, reputation, running costs, style, warranty and service plans as the highest priority in their
new vehicle purchase process compared to Spanish participants (χ2(1) = 12.676, p < 0.001; χ2(1) = 7.611,
p < 0.01; χ2(1) = 8.507, p < 0.01; χ2(1) = 16.676, p < 0.001; χ2(1) = 12.852, p < 0.001; χ2(1) = 8.774, p <
0.01, respectively).
Spanish participants were significantly more likely to rank comfort as the highest priority in the new vehicle
purchase process compared to Swedish participants (χ2(1) = 19.270, p < 0.001).
Several analyses were conducted which aimed to examine the differences between participants who had
ranked the vehicle’s safety (defined as the vehicle’s EuroNCAP rating/other safety reports) as the highest
priority compared to those who did not.
8 Note that EuroNCAP was listed on the questionnaire as ‘EuroNCAP/other safety reports’.

CEA/EC SARAC II Results & Discussion – PRIVATE Purchasers
61
There was no significant relationship between ranking the vehicle’s safety as the highest priority and the
participants’ age (Sweden: χ2 (2) = 0.274, p > 0.5; Spain: χ2 (4) = 0.185, p > 0.5) or gender (Sweden: χ2
(1) = 1.537, p > 0.1; Spain: χ2 (1) = 0.586, p > 0.1).
Question: “Which features were priorities when choosing which new vehicle to purchase?”
Participants were asked to indicate which features were a priority in their new vehicle choice by indicating
whether the factors were a ‘high’, ‘medium’ or ‘low’ priority. Figure 22 shows the features that were
reported to be a ‘high’ priority for participants in their new vehicle purchase/lease decision.
0 10 20 30 40 50 60 70 80 90
Act.head restraints ABS
Air conditioning Anti-theft devices
Automatic Body kit
CD player Cruise control
Cruise control-FDWCurtain airbags
Driver airbag DVD/Video systems
Following distance sensor Front passenger airbag
High intensity headlight Lane warning device
Parking assistancePower windows/mirrors
Route navigation Seatbelt reminder
Speed alert Side airbags
Stability(e.g., ESP)Three-point belt in centre
Vehicle spec. child restraint Window tinting Spain
Sweden
**
*
**
*
*
*
*
*
Figure 22: Features that were rated as high priorities in the new vehicle purchase decision
by participants for Sweden and Spain
Advanced braking systems (81%) were cited most often by Swedish participants, while Spanish
participants cited driver airbags most often as a high priority in the new vehicle purchase process (82%).
There were several significant differences across the two countries in terms of the features that were
considered to be ‘high priorities’. For example, Swedish participants were significantly more likely to report
that active head restraints, automatic transmission, cruise control, lane warning device, parking

CEA/EC SARAC II Results & Discussion – PRIVATE Purchasers
63
Automatic transmission was ranked as the most important feature by Swedish participants (52%), whereas
Spanish participants were most likely to rank advanced braking systems (52%) as the most important
feature in their new vehicle.
There were several significant differences between the two countries. Swedish participants were
significantly more likely to cite air conditioning, automatic transmission, CD player, front passenger airbag,
power windows/mirrors, route navigation system, seatbelt reminder system, speed alert, side airbags and
a vehicle specific child restraint as the highest priority feature in their new vehicle purchase process
compared to Spanish participants (χ2(1) = 32.286, p < 0.001; χ2(1) = 16.709, p < 0.001; χ2(1) = 9.297, p <
0.01; χ2(1) = 32.442, p < 0.001; χ2(1) = 12.813, p < 0.001; χ2(1) = 18.201, p < 0.001; χ2(1) = 14.083, p <
0.001; χ2(1) = 6.990, p < 0.001; χ2(1) = 51.055, p < 0.001; χ2(1) = 12.186, p < 0.001; χ2(1) = 7.004, p <
0.001, respectively).
Spanish participants were significantly more likely to report that driver airbags were the most important
consideration in their new vehicle purchase process compared to Swedish participants (χ2(1) = 57.919, p <
0.001). Several analyses were then conducted to determine whether participants were more likely to rank
a safety vehicle feature as their number one priority or a comfort/design/convenience feature. The vehicle
features shown in Figure 23, were broadly divided into safety and non-safety features. Features included
in the safety features included active head restraints, advanced braking systems, cruise control with frontal
distance warning, curtain airbags, driver airbag, following distance sensor, front passenger airbag, lane
warning device, seatbelt reminder system, speed alert, side airbags, stability control systems, three-point
belt in the centre rear seat and vehicle specific child restraint. The remaining features were classified as
non-safety related features.
The proportion of participants that ranked a safety vehicle feature as their highest priority differed
significantly across countries. Participants in Spain were significantly more likely to rank a safety feature
as their number one priority (90%) compared to participants from Sweden (67%), χ2(1) = 52.298, p <
0.001.
Interestingly, participants from both countries who had previous listed ‘safety’ as their most important
consideration or in their top three considerations were no more likely to rank a safety vehicle feature as
their number one priority (77%, 76% respectively) compared to participants who did not list ‘safety’ as their
most important consideration or in their top three considerations when purchasing a new vehicle (73%,
72%) (top consideration: χ2(1) = 1.991, p > 0.1; top three consideration: χ2(1) = 1.985, p > 0.1). In addition,
participants who ranked their vehicle’s EuroNCAP rating as their number one vehicle factor priority were
not more likely to rank a safety vehicle feature as their number one priority (77%) compared to participants
who did not rank their vehicle’s EuroNCAP rating as their number one vehicle factor priority (80%, χ2(1) =
0.526, p > 0.1).

CEA/EC SARAC II Results & Discussion – PRIVATE Purchasers
64
Question: “Did you consider any other vehicles at the time of purchasing your new vehicle?”
New vehicle purchasers were asked to indicate if they had considered any other vehicles at the time of
purchasing their new vehicle. Spanish participants were more likely to report that they had considered
other vehicles (53%) then Swedish participants, however this finding failed to reach statistical significance,
χ2 (1) = 6.161, p = 0.01.
Question: “If you considered other vehicles at the time of purchasing your new vehicle, please list the make and model of these vehicles?”
Participants, who indicated that they had considered other vehicles at the timing of purchasing their new
vehicle, were asked to indicate the make and model of the other vehicles considered. The top vehicle
models considered by Swedish participants at the time of purchasing their new vehicle were the Toyota
Corolla (6%), Volvo V70 (6%) and Volkswagen Golf (6%). The top vehicle models considered by Spanish
participants were Seat Ibiza (6%), Peugeot 206 (6%), Peugeot 307 (5%) and Audi A3 (5%).
Question: “If you considered other vehicles at the time of purchasing your new vehicle, please list your reasons for selecting your current vehicle in preference to other vehicles?”
Participants, who indicated that they had considered other vehicles at the timing of purchasing their new
vehicle, were then asked to indicate the reasons for selecting their current vehicle in preference to the
other vehicles.
Swedish participants indicated that the most important reason for selecting their current vehicle over other
considered vehicles was price (38%). Other reasons included comfort (6%), issues related to the
dealership and/or service (6%), quality of the vehicle (6%), and the trade-in price that they were offered for
their old vehicle (6%).
The most important reason for Spanish participants for choosing their vehicle over other vehicles was also
price (25%). Other reasons included the reputation of the make/model (8%) and the economy/value of the
vehicle (8%).
Question: “Please list up to three factors that you believe make vehicles safe?”
Participants were then asked to list up to three factors that they believe make vehicles safe. Participants
were instructed to list the most important factor first (see Table 6).
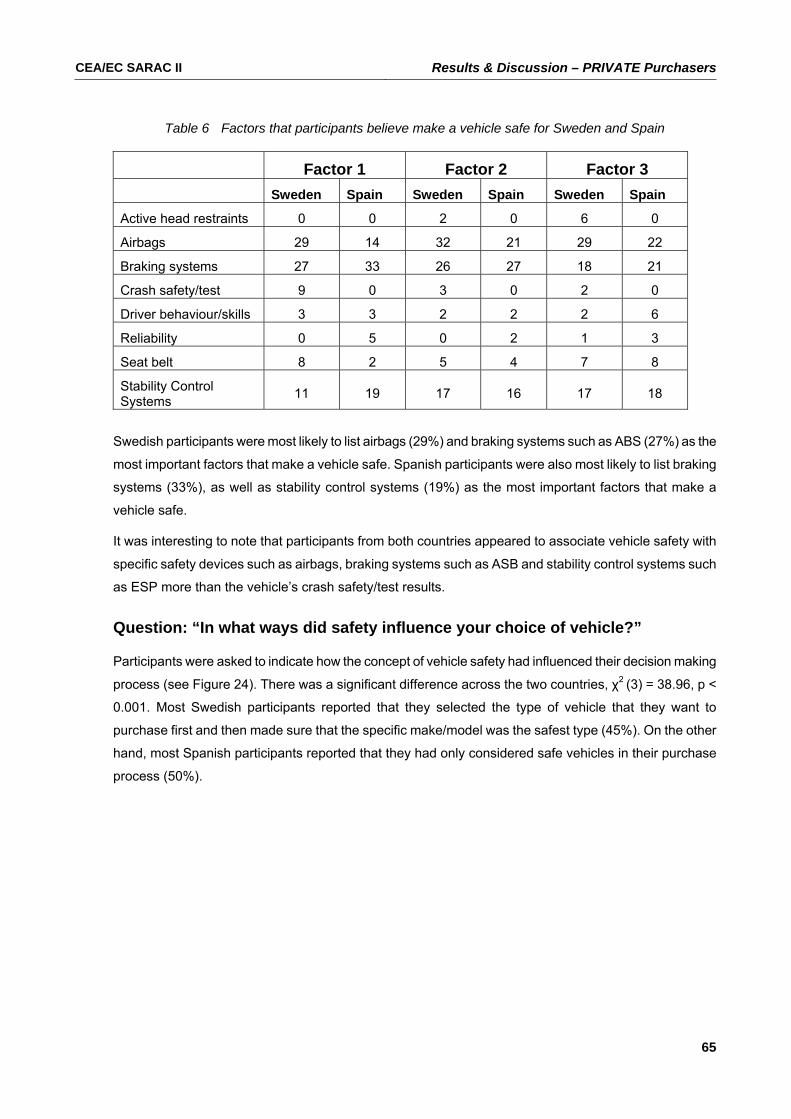
CEA/EC SARAC II Results & Discussion – PRIVATE Purchasers
65
Table 6 Factors that participants believe make a vehicle safe for Sweden and Spain
Factor 1 Factor 2 Factor 3 Sweden Spain Sweden Spain Sweden Spain
Active head restraints 0 0 2 0 6 0
Airbags 29 14 32 21 29 22
Braking systems 27 33 26 27 18 21
Crash safety/test 9 0 3 0 2 0
Driver behaviour/skills 3 3 2 2 2 6
Reliability 0 5 0 2 1 3
Seat belt 8 2 5 4 7 8
Stability Control Systems 11 19 17 16 17 18
Swedish participants were most likely to list airbags (29%) and braking systems such as ABS (27%) as the
most important factors that make a vehicle safe. Spanish participants were also most likely to list braking
systems (33%), as well as stability control systems (19%) as the most important factors that make a
vehicle safe.
It was interesting to note that participants from both countries appeared to associate vehicle safety with
specific safety devices such as airbags, braking systems such as ASB and stability control systems such
as ESP more than the vehicle’s crash safety/test results.
Question: “In what ways did safety influence your choice of vehicle?”
Participants were asked to indicate how the concept of vehicle safety had influenced their decision making
process (see Figure 24). There was a significant difference across the two countries, χ2 (3) = 38.96, p <
0.001. Most Swedish participants reported that they selected the type of vehicle that they want to
purchase first and then made sure that the specific make/model was the safest type (45%). On the other
hand, most Spanish participants reported that they had only considered safe vehicles in their purchase
process (50%).
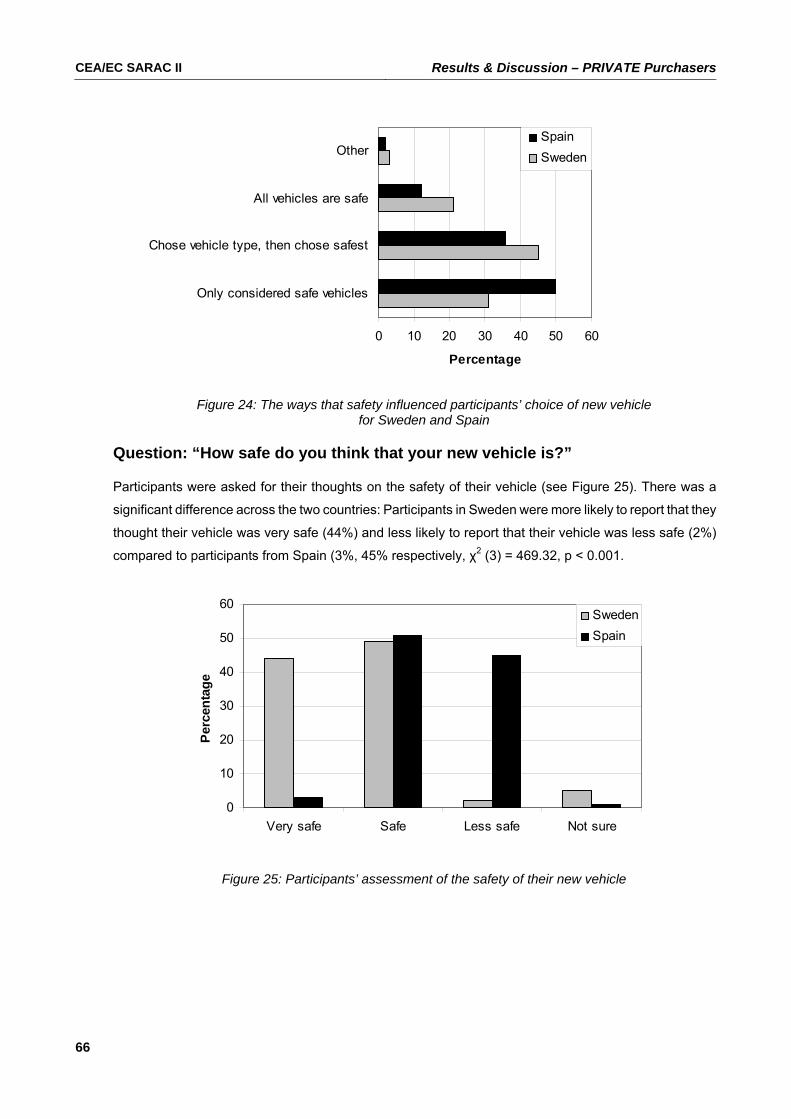
CEA/EC SARAC II Results & Discussion – PRIVATE Purchasers
66
0 10 20 30 40 50 60
Only considered safe vehicles
Chose vehicle type, then chose safest
All vehicles are safe
Other
Percentage
SpainSweden
Figure 24: The ways that safety influenced participants’ choice of new vehicle
for Sweden and Spain
Question: “How safe do you think that your new vehicle is?”
Participants were asked for their thoughts on the safety of their vehicle (see Figure 25). There was a
significant difference across the two countries: Participants in Sweden were more likely to report that they
thought their vehicle was very safe (44%) and less likely to report that their vehicle was less safe (2%)
compared to participants from Spain (3%, 45% respectively, χ2 (3) = 469.32, p < 0.001.
0
10
20
30
40
50
60
Very safe Safe Less safe Not sure
Perc
enta
ge
SwedenSpain
Figure 25: Participants’ assessment of the safety of their new vehicle

CEA/EC SARAC II Results & Discussion – PRIVATE Purchasers
67
Question: “Were there any safety options (i.e., features to help prevent a crash or to protect you in the case of a crash) that were available to you that you did not purchase?”
Participants were asked if there were there any safety options (i.e., features to help prevent a crash or to
protect occupants in the case of a crash) that were available to them that they did not purchase.
Participants from Spain were significantly more likely to report that they purchased safety options if they
were available to them (93%) compared to participants from Sweden (88%), χ2 (1) = 7.40, p < 0.01.
Participants, who indicated were there safety options that were available to them that they did not
purchase, were then asked to list the options. Most Swedish participants indicated that they did not
purchase stability control systems (26%), parking assistance/reversing sensors (16%) and frontal warning
device (9%). Most Spanish participants indicated that they did not purchase ‘6 airbags’ (24%), curtain
airbags (20%) or lane warning devices (16%).
Finally, participants, who indicated were there safety options that were available to them that they did not
purchase, were asked to describe the reasons why they had decided not to purchase the safety options
(see Figure 26).
0
10
20
30
40
50
60
70
80
Too Expensive Unnecessary Preferred otheroptions
Other
Per
cent
age
Sweden
Spain
Figure 26: Participants’ reasons for not purchasing safety options at the time of purchasing
their new vehicle for Sweden and Spain Most participants reported that the safety options were too expensive (Sweden: 72%; Spain: 55%),
unnecessary (Sweden, 17%; Spain: 37%) or preferred to purchase other options (Sweden: 14%; Spain:
5%). There were no significant differences across the two countries.

CEA/EC SARAC II Results & Discussion – PRIVATE Purchasers
68
4.2.4 Factors associated with ‘safe vehicle purchasers’ To determine the predictive relationship between consumers who stated that vehicle safety was the most
important consideration (i.e., the first consideration listed in response to “List the three most important
factors that you considered when deciding which vehicle to purchase”) in the new vehicle purchase
process and other questionnaire items, a series of univariate logistic regression models were performed.
Questionnaire factors with a statistical significance value of p = 0.25 were accepted, recognising that while
a particular variable may not be highly predictive in the univariate sense, it may influence or moderate the
effect of another variable. The variables ‘consumer’s nationality’, ‘age’ and ‘gender’ were ‘forced’
variables, that is, they were determined important at the outset to enter into the statistical predictive model,
irrespective of statistical p-values.
It is important to note that most variables suffered from missing data, the implication being that the
univariate models are not matched on participants. Further, as the pattern of missing data was not
consistent across all questions, the final number of cases used in the multivariable model is two-thirds of
the available survey sample.
The final predictive multivariable model of whether safety was the most important consideration in the new
vehicle purchase process involved the analysis of 881 participants (67% of the total sample, n=1312) and
is comprised of the following factors, with relevant odds ratios presented in Table 7 (and Table 8 for
education/gender comparisons):
1. Country of participant;
2. Age (< 55 years/ > 55 years);
3. Gender;
4. Education, defined as having completed secondary school, completed technical education, and completed or undertaking tertiary education;
5. Income, defined as Low (<€20,000), Medium (€20,000-€40,000); High (€40,000+)
6. Crash history: whether involved in a vehicle crash where the vehicle required towing from the scene;
7. Whether Euro-NCAP information was used to inform the purchasing decision;
8. Whether the vehicle was purchased for the spouse;
9. Kilometres driven on average per year, expressed as low (<15,000), medium (15,001-25,000), & high (25,001);
10. Whether the vehicle purchased was the first vehicle purchased;
11. Concern of the possibility of being involved in a future motor vehicle accident, where a 5-point Likert scale ranging from ‘Not at all’ – Very concerned’ was used, and
12. Infringement history, indicated by the variable predictor ‘unbelted’, defined as ‘no traffic infringement’, ‘traffic infringement but not for being unbelted,’ and ‘traffic infringement for being unbelted’.
The multivariable logistic regression model was strongly predictive of those stating safety was the most
important factor in the vehicle purchase, χ2 (20) =105.5, p ≤ 0.001, with the Hosmer-Lemeshow
goodness of fit suggesting good model fit, p ≥ 0.05. The model was seen to correctly classify 71.2
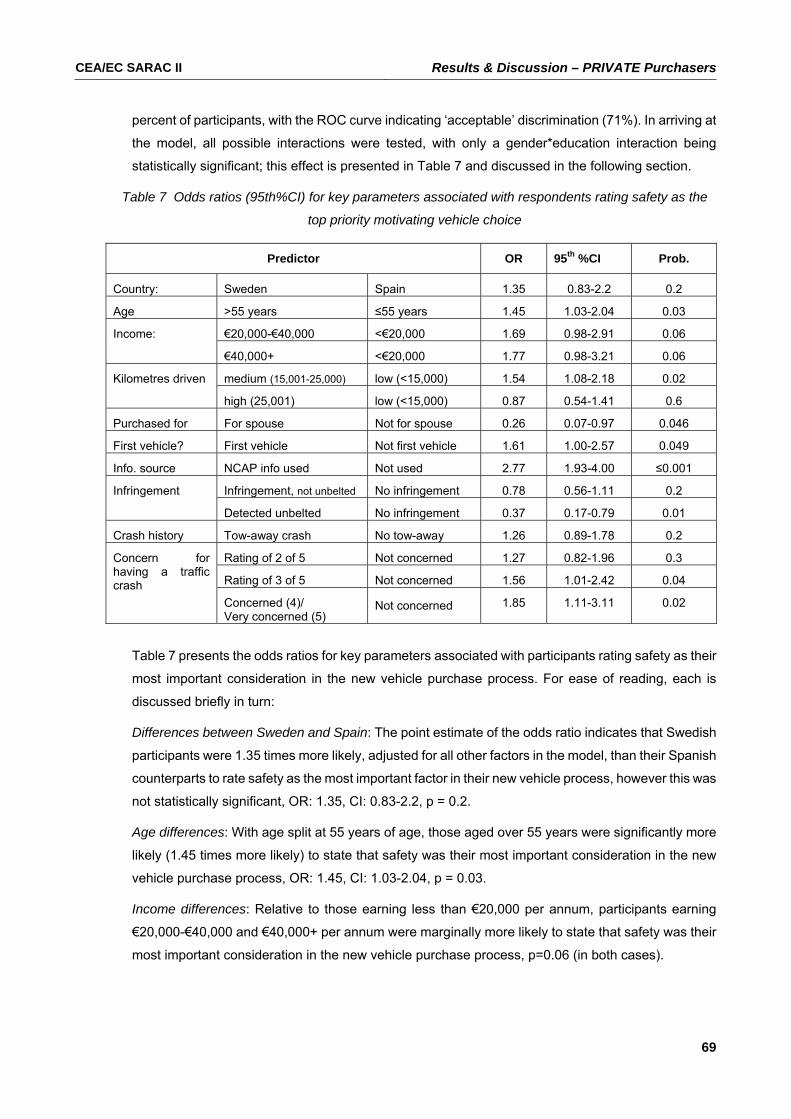
CEA/EC SARAC II Results & Discussion – PRIVATE Purchasers
69
percent of participants, with the ROC curve indicating ‘acceptable’ discrimination (71%). In arriving at
the model, all possible interactions were tested, with only a gender*education interaction being
statistically significant; this effect is presented in Table 7 and discussed in the following section.
Table 7 Odds ratios (95th%CI) for key parameters associated with respondents rating safety as the
top priority motivating vehicle choice
Predictor OR 95th %CI Prob.
Country: Sweden Spain 1.35 0.83-2.2 0.2
Age >55 years ≤55 years 1.45 1.03-2.04 0.03
€20,000-€40,000 <€20,000 1.69 0.98-2.91 0.06 Income:
€40,000+ <€20,000 1.77 0.98-3.21 0.06
medium (15,001-25,000) low (<15,000) 1.54 1.08-2.18 0.02 Kilometres driven
high (25,001) low (<15,000) 0.87 0.54-1.41 0.6
Purchased for For spouse Not for spouse 0.26 0.07-0.97 0.046
First vehicle? First vehicle Not first vehicle 1.61 1.00-2.57 0.049
Info. source NCAP info used Not used 2.77 1.93-4.00 ≤0.001
Infringement, not unbelted No infringement 0.78 0.56-1.11 0.2 Infringement
Detected unbelted No infringement 0.37 0.17-0.79 0.01
Crash history Tow-away crash No tow-away 1.26 0.89-1.78 0.2
Rating of 2 of 5 Not concerned 1.27 0.82-1.96 0.3
Rating of 3 of 5 Not concerned 1.56 1.01-2.42 0.04
Concern for having a traffic crash
Concerned (4)/ Very concerned (5)
Not concerned 1.85 1.11-3.11 0.02
Table 7 presents the odds ratios for key parameters associated with participants rating safety as their
most important consideration in the new vehicle purchase process. For ease of reading, each is
discussed briefly in turn:
Differences between Sweden and Spain: The point estimate of the odds ratio indicates that Swedish
participants were 1.35 times more likely, adjusted for all other factors in the model, than their Spanish
counterparts to rate safety as the most important factor in their new vehicle process, however this was
not statistically significant, OR: 1.35, CI: 0.83-2.2, p = 0.2.
Age differences: With age split at 55 years of age, those aged over 55 years were significantly more
likely (1.45 times more likely) to state that safety was their most important consideration in the new
vehicle purchase process, OR: 1.45, CI: 1.03-2.04, p = 0.03.
Income differences: Relative to those earning less than €20,000 per annum, participants earning
€20,000-€40,000 and €40,000+ per annum were marginally more likely to state that safety was their
most important consideration in the new vehicle purchase process, p=0.06 (in both cases).

CEA/EC SARAC II Results & Discussion – PRIVATE Purchasers
70
Average distance driven per annum: Participants that stated they drove 15,001-25,000 km/per annum
were 54 percent more likely to rate safety as their most important consideration in the new vehicle
purchase process compared to low mileage drivers (< 15,000) (OR: 1.54, 1.08-2.18, p = 0.02),
however there was no difference between those driving the longest distance (25,001+ km/per annum)
compared to those driving the shortest annual distance, OR: 0.87, CI: 0.54-1.41, p = 0.6.
Purchasing for ones’ spouse: Participants purchasing the vehicle for their spouse were significantly
less likely to rate safety as their most important consideration in the new vehicle purchase process,
OR: 0.26, CI: 0.07-0.97, p = 0.046.
Purchasing for the first time: Participants purchasing a vehicle for the first time were 61 percent more
likely to purchase a vehicle with safety as their most important consideration, compared to other
purchasers, OR: 1.61, CI: 1.00-2.57, p = 0.049.
Information source used: Those using NCAP information were, not surprisingly, 2.8 times more likely to
state that safety was their most important consideration in the new vehicle purchase process compared
to those not using such information, OR: 2.77, CI: 1.93-4.00, p ≤ 0.001.
Infringement history: Participants with a history of being detected by regulatory authorities for being
unbelted whilst driving were 63 percent less likely to rate safety as the most important consideration in
the new vehicle purchase process relative to those without a history of traffic infringements, OR: 0.37,
CI: 0.17-0.79, p = 0.01. Those with another type of traffic infringement were 22 percent less likely to
rate safety as their top priority, however this was not statistically significant, OR: 0.78, CI: 0.56-1.11, p
= 0.2.
Crash history: Involvement in a tow-away crash was an important factor associated with the purchase
of a safe vehicle, as it appeared to influence the odds ratios of other predictor variables. As such, it
was left in the model, and the point estimate while not statistically significant suggests those involved in
a tow-away crash were marginally more likely to rate safety as their most important consideration
relative to those who had not been involved in a tow-away crash.
Concern for the possibility of being involved in a traffic crash: The three comparisons relative to
respondents ‘not concerned’ at being involved in a traffic crash indicate a linear effect, with increasing
levels of concern, the odds or likelihood of rating safety as the most important consideration also
increased. While there is no difference between those rating their concern as ‘2’ relative to those rating
their level of concern as ‘1’ (not concerned), those rating a ‘3’ were 56 percent more likely than those
not concerned to rate safety as the most important factor, OR: 1.56, CI: 1.01-2.42, p = 0.04. Due to
relatively low numbers, those rating concern (4) or very concerned (5) were collapsed into a single
‘concerned’ category, and this group were 85 percent more likely to rate safety as the most important
factor in the new vehicle purchase process, OR: 1.85, CI: 1.11-3.11, p = 0.02.
As noted above, there was a statistical interaction between gender and education, meaning that the
likelihood of males and females rating safety as the most important factor in the new vehicle purchase

CEA/EC SARAC II Results & Discussion – PRIVATE Purchasers
71
process is dependent upon level of education. Table 8 presents the odds ratios for combinations of
gender and level of education relative to males with a secondary school level education. With one
exception, none of the comparisons are statistically significant, indicating no difference in the tendency
to rate safety as the most important factor when compared to secondary school educated males. The
one notable exception is the finding that tertiary education males were 53 percent less likely than their
secondary school educated counterparts to rate safety as the most important consideration when
purchasing a new vehicle, OR: 0.47, CI: 0.29-0.78, p = 0.003.
Table 8: Odds ratios (95th%CI) for rating safety as the most important factor in vehicle purchasing
choice, by gender and level of education
Gender
Males Females Education
OR 95% C.I. Prob. OR 95% C.I. Prob.
Secondary 1.0 (reference) 0.85 0.39-1.83 0.7
Technical 0.92 0.58-1.47 0.7 1.20 0.7-2.06 0.5
Tertiary 0.47 0.29-0.78 0.003 0.98 0.55-1.75 0.9
Further analysis of the interaction effect at each level of education indicated differences among
similarly educated males and females in their predisposition to rate safety as the most important
consideration in the new vehicle purchase process. At the secondary school level, there was no
difference between males and females as indicated by Table 8 (OR: 0.85, CI: 0.39-1.83, p=0.7).
Similarly, there was no difference between males and females with a technical level education (OR:
1.07, CI: 0.62-1.84, p=0.8). However, among those with, or undergoing a tertiary education, females
were 2.5 times more likely than males to rate safety as their most important factor, OR: 2.51, 1.48-4.26,
p = 0.001.
4.3 Discussion of the Private Vehicle Purchaser results
4.3.1 How important is ‘vehicle safety’ to consumers?
One of the main aims of this research project was to try to determine how important ‘vehicle safety’ is in
the new vehicle purchase process. Previous research outlined earlier, concluded that while vehicle safety
has become increasingly important to new vehicle consumers over the past decade, it is generally not the
primary consideration in the vehicle purchase process. For example, in terms of desirable vehicle factors,
the findings of relevant market research have previously shown that vehicle safety is consistently
outranked by factors such as price, appearance and dependability/reliability (e.g., The Dohring Company,
2003; Desrosiers Automotive Report, 2001; Progressive Insurance Co., 2001).

CEA/EC SARAC II Results & Discussion – PRIVATE Purchasers
72
Indeed, when participants in the current study were asked to select vehicle factors from a list that were a
high priority in their purchase decision, participants were more likely to select the vehicle’s reliability,
comfort and fuel consumption as high priorities compared to their vehicle’s safety (defined as the vehicle’s
EuroNCAP rating/other safety reports). However, when participants in the current study were asked to
rank the importance of these vehicle factor priorities, most participants ranked their vehicle’s safety as the
most important factor. Similarly, when participants were asked to identify vehicle features from a list that
were a high priority in their new vehicle purchase process, participants were most likely to list vehicle
features that were safety related (e.g., advanced braking systems). In addition, when asked to rank the
importance of these vehicle feature priorities, participants were more likely to rank a safety-related vehicle
feature as their number one priority than a non safety-related feature. Furthermore, when participants in
the current study were asked to list the three most important factors that they considered when deciding
which vehicle to purchase (in an open-ended format), participants were most likely to list safety as the
most important consideration, or in their top three considerations, compared to the vehicle’s price, design,
fuel consumption etc.
4.3.2 Who is “vehicle safety” more important to?
Overall, the findings of the current study indicate that vehicle safety was a high priority in the purchase
process for new vehicle consumer. Another key aim of the current study was to identify factors, including
demographic characteristics (country of residence, age, gender) that may influence the importance of
vehicle safety in the new vehicle purchase process.
The findings from the current study showed that the importance of vehicle safety in the new vehicle
purchase process differed significantly for participants from Sweden compared to participants from Spain.
For example, participants from Sweden were significantly more likely to rate their vehicle’s safety (defined
as the vehicle’s EuroNCAP rating/other safety reports) as a high priority and as the highest ranked vehicle
factor in the new vehicle process compared to participants from Spain. On the other hand, while most
participants from Sweden ranked their vehicle’s safety as the most important factor, most Spanish
participants ranked their vehicle’s comfort as the most important factor, with their vehicle’s safety ranked
equal second with their vehicle’s reliability. Furthermore, when participants were asked to list the three
most important factors that they considered when deciding which vehicle to purchase, participants from
Sweden were significantly more likely to list safety as their most important consideration and as one of
their top three considerations than Spanish participants.
These findings are not surprising, given the well-documented vehicle safety culture in Sweden
(http://www.vv.se/templates/page3____1363.aspx).
When participants were asked to indicate the vehicle feature that they considered to be the highest ranked
priority in their new vehicle purchase process, participants from Spain were significantly more likely to list
a vehicle feature that was safety related (e.g., advanced braking systems and driver airbag) compared to
participants from Sweden where the highest ranked priority features were not safety related (e.g.,

CEA/EC SARAC II Results & Discussion – PRIVATE Purchasers
73
automatic transmission and route navigation systems). These findings are surprising given the converse
was true for the priority ratings for overall safety factors for Sweden and Spain. It is possible that the
priority placed on broad safety factors by Swedish participants’ might be explained by the ‘long-held ‘ and
deep-rooted safety culture’ in Sweden. In addition, there may be an expectation by Swedish consumers
that safe vehicle features come as standard, whilst in Spain, there is a need for consumers to be more
vigilant and selective in choosing specific vehicle features that contribute to the overall safety of the
vehicle. However, the availability of such features in Spain is not clear.
Previous research has also suggested that demographic factors such as age and gender may also
significantly influence the importance of vehicle safety in the new vehicle purchase process (e.g., MORI,
2005). When the data from both countries was pooled, older participants tended to be more likely to list
‘safety’ as their most important consideration in the new vehicle purchase process compared to middle
aged and younger participants. In addition, female participants were more likely to list safety as their most
important consideration compared to males. These findings are consistent with the findings from the US
Department of Transportation (Charles River Associates Incorporated, 1998) who reported that older
consumers and female consumers were significantly more interested in vehicle safety and appeared to be
more willing to admit to personal vulnerability than younger or male participants. However these findings
are not consistent with the findings recently reported by Euro NCAP (MORI, 2005) who found that older
participants were less likely to consider ‘safety’ in their new vehicle purchase process compared to all
other participants. However, as outlined earlier, it is not clear how participants in the Euro NCAP study
were recruited and their finding might be susceptible to hypothetical bias because at least 30 percent of
the participants indicated that they were not responsible for choosing or purchasing a new vehicle or that
they had no regular use of a vehicle.
In addition, a regression model revealed significant relationships between consumers who stated that
‘vehicle safety’ was the most important consideration in the new vehicle purchase process and other
questionnaire items, including:
• Those aged over 55 years were significantly more likely (1.45 times more likely) to state that safety was
their most important consideration in the new vehicle purchase process,
• Participants who drove 15,001-25,000 km/per annum were significantly more likely to rate safety as
their most important consideration in the new vehicle purchase process compared to low mileage
drivers (< 15,000),
• Participants purchasing the vehicle for their spouse were significantly less likely to rate safety as their
most important consideration in the new vehicle purchase process,
• Participants purchasing a vehicle for the first time were significantly more likely to state that safety was
their most important consideration, compared to other purchasers,

CEA/EC SARAC II Results & Discussion – PRIVATE Purchasers
74
• Participants who reported using EuroNCAP ratings as a source of information were significantly more
likely to state that safety was their most important consideration in the new vehicle purchase process
compared to those not using such information,
• Participants with a history of being detected by regulatory authorities for being unbelted whilst driving
were significantly percent less likely to rate safety as the most important consideration relative to those
without a history of traffic infringements,
• Participants who indicated that they were ‘concerned’ or ‘very concerned’ about the possibility of being
involved in a motor vehicle crash were significantly more likely to list safety as their most important
consideration compared to participants who were ‘not at all concerned’
• Tertiary educated males were significantly less likely than their secondary school educated counterparts
to rate safety as the most important consideration when purchasing a new vehicle. In addition, female
participants who were undergoing tertiary education, were significantly more likely than males to rate
safety as their most important factor.
4.3.3 How do consumers conceptualise or understand “vehicle safety”?
In the current study, participants were asked to list up to three factors that they believe make vehicles
safe. Swedish participants were most likely to list airbags and braking systems such as ABS as the most
important factors that make a vehicle safe. Spanish participants were also most likely to list braking
systems, as well as stability control systems as the most important factors that make a vehicle safe. These
are consistent with earlier research conducted by Ferguson and Williams (1996), the Volvo Car
Corporation (1995) and Ford Motor Company (J.D. Power and Associates, 1993), who reported that
participants are more likely to equate vehicle safety with the presence of specific vehicle safety features or
technologies rather than the vehicle’s crash safety/test results or crashworthiness.
In the current study, there was a significant difference in the level of satisfaction in the safety of their new
vehicle across the two countries. Participants from Sweden were more likely to state that their new vehicle
was safe or very safe, whereas participants from Spain were more likely to state that their new vehicle was
safe or less safe. The findings from Sweden are consistent with previous research conducted in the United
States, which reported that most participants were satisfied with the safety of their vehicle (Ferguson &
Williams, 1996; J.D. Power and Associates, 1993). In addition, this is consistent with the finding from the
current study that Swedish participants were significantly more likely to purchase a four or five 5 star-rated
new vehicle compared to Spanish participants.
There was also a significant difference across the two countries in terms of the level of concern about the
possibility of being involved in a motor vehicle crash. Participants from Sweden were more likely to state
that they were “not really concerned” or “not at all concerned” about being involved in a motor vehicle
crash, whereas Spanish participants were more likely to report that they were “very concerned” about the
possibility of being involved in a motor vehicle crash. This finding is not surprising, given Spain’s higher

CEA/EC SARAC II Results & Discussion – PRIVATE Purchasers
75
crash rate (per 100,000). In addition, Swedish participants may be less concerned about being involved in
a motor vehicle crash because of the lower crash rate in Sweden or because they are more likely to be
travelling in a four of five star rated vehicle, and therefore may perceive driving as a low-risk activity.
4.3.4 How do consumers incorporate safety and other attributes in making vehicle purchase decisions?
When participants were asked to indicate the reasons for selecting their current vehicle in preference to
other considered vehicles, most participants from both countries reported that the main reason was price
rather than safety related features. This finding is consistent with previous research, in which participants
listed price and dependability/reliability as the most important reason for purchasing their new vehicle
(General Motors Corporation, 1994; J.D. Power and Associates, 1993).
However, when participants were asked to indicate how the concept of vehicle safety had influenced their
decision making process, most Swedish participants reported that they selected the type of vehicle that
they wanted to purchase first and then made sure that the specific make/model was the safest type. These
findings are consistent with the findings of Ferguson and Williams (1996) who concluded that, while the
initial choice of type or class of car (e.g., van versus a midsize car) appears to be based primarily on price,
reliability, and intended use, safety appears to be used most often to help narrow choices among specific
makes and models. On the other hand, most Spanish participants reported that they had only considered
safe vehicles in their purchase process. This latter finding is somewhat surprising given the finding that
Spanish participants were significantly less likely to be driving a four or five star rated vehicle compared to
Swedish participants.
4.3.5 How do consumers search for and use information in their purchase decisions? What information is most important?
When asked to indicate the sources of information they used when purchasing their new vehicle, there
were several significant differences across the two countries. Swedish participants were significantly more
likely to report that they used manufacturer websites, motoring websites, and EuroNCAP ratings, whereas
Spanish participants were significantly more likely to report that they used the vehicle dealership.
There was also a significant difference across the two countries when participants were asked to indicate
which source of information that was the most valuable to them in the pre-purchase decision. Swedish
participants cited motoring magazines as the most valuable source of information, whereas Spanish
participants were more likely to list the vehicle dealership as the most valuable source of information. It
was interesting to note that even though EuroNCAP ratings were ranked as the number one priority by
Swedish participants and the number two priority by Spanish participants in terms of desirable vehicle
factors, only four percent of Swedish participants and no Spanish participants stated that their vehicle’s
EuroNCAP rating was the most valuable source of information in the new vehicle process. Although this
results is somewhat surprising, it is consistent with previous research conducted by the US Department of
Transportation, where the majority of participants stated that crash test result information such as

CEA/EC SARAC II Results & Discussion – PRIVATE Purchasers
76
EuroNCAP ratings are not the most valuable source of information in the pre-purchase process because
participants expect safety considerations to be incorporated into the reviews and recommendations of
consumer publications that they consult (Charles River Associates Incorporated, 1998; MORI, 2005).

CEA/EC SARAC II Results & Discussion – FLEET Managers
77
5 Results & Discussion – FLEET Managers This section describes the results for the fleet manager questionnaire from both countries. The recruitment
rates are outlined first, followed by the fleet managers’ responses to the vehicle purchase process and
policy questions. Within each section, the questions from the questionannaire are stated, followed by the
findings for each country.
5.1 Recruitment Rates
5.1.1 Sweden As outlined earlier, 329 Swedish companies identified with a fleet of vehicles were randomly selected from
the Folksam Insurance database and were sent a letter of invitation and a copy of the fleet manager
vehicle questionnaire (see Appendix 3). Ninety seven of the mailed out fleet vehicle manager
questionnaires were completed and returned to the research staff at Folksam Insurance, making the
response rate 29 percent.
5.1.2 Spain As outlined earlier, the recruitment procedure and identification of potential participants in Spain was
different to the recruitment procedure outlined above for Sweden.
In Spain, fleet managers of companies individuals living in Madrid, Catalonia and Aragon were telephoned
by VI-VA staff and were invited to participate in a telephone survey (see Appendix 3). Interviewers were
instructed to continue to recruit participants until they had interviewed 50 fleet managers. Those who
declined to participate were asked to indicate a reason for their non-participation. Table 9 shows the
reasons for non-participation across the three Spanish regions.
Table 9: Description of the Fleets who did not participate in the study
Madrid Barcelona Aragon Total
N % N % N % N %
Did not answer second call
99 45% 87 40% 50 33% 236 39%
Did not want to complete the questionnaire
29 13% 38 17% 54 36% 121 20%
Did not meet the requirements
92 42% 104 45% 47 31% 243 41%
Did not complete the whole questionnaire
0 0% 1 0% 0 0% 1 0%
Total 220 100% 230 100% 151 100% 601 100%

CEA/EC SARAC II Results & Discussion – FLEET Managers
78
As shown in Table 9, most fleet managers did not complete the questionnaire because they did not meet
the requirements (41%) or did not answer the telephone call (39%). The remaining participants did not
want to complete the questionnaire (20%).
5.2 Questionnaire Results
Question: “Please describe your company's passenger vehicle fleet”
Fleet managers were asked to record the number of executive and/or general duty/use vehicles that had
been purchased or leased by their company.
Table 10 shows a description of the vehicle fleets for both Sweden and Spain.
Table 10: Description of the Vehicle Fleets
Minimum Maximum Mean SD
Executive vehicles purchased
Sweden 1 900 24.00 118.29 Spain 1 3 0.12 0.52
Executive vehicles leased
Sweden 5 88 95.00 135.57 Spain 1 50 2.40 8.42
General duty/use vehicles purchased
Sweden 1 1595 32.00 174.05 Spain 1 40 6.94 8.86
General duty/use vehicles leased
Sweden 2 1552 64.00 231.69 Spain 1 950 30.38 141.22
Total vehicles purchased
Sweden 1 1985 61.00 243.93 Spain 1 40 7.06 8.86
Total vehicles leased
Sweden 1 1892 159.00 286.55 Spain 1 1000 32.78 149.05
As shown in Table 10, there were differences in the size of the two vehicle fleets. The Swedish vehicle
fleet ranged from 5 to 1985 vehicles, whereas the Spanish vehicle fleet ranged from 1 to 1000 vehicles.
There was also a significant difference in the proportion of vehicles purchased and leased across the two
countries, χ2 (2) = 32.00, p < 0.001, (see Figure 27). In Sweden, most fleet managers reported that

CEA/EC SARAC II Results & Discussion – FLEET Managers
79
vehicles driven for their company were leased (52%), whereas most Spanish fleet managers reported that
their company vehicles were purchased (52%).
0
10
20
30
40
50
60
Purchased only Leased only Purchased & leased
Perc
enta
ge
SwedenSpain
Figure 27: Proportion of vehicles purchased, leased or purchased and leased
Question: Are these factors included in your criteria for new vehicles?
Fleet managers were asked to indicate the factors that are included in their company’s criteria for
purchasing/leasing new vehicles (see Figure 28).

CEA/EC SARAC II Results & Discussion – FLEET Managers
80
0 20 40 60 80 100 120
Comfort Country
EuroNCAPFuel
Make/ModelPerformance
PriceReliability
ReputationRe-sale
Running costsStyleSizeType
Warranty
Percentage
SpainSweden
*
*
*
**
*
Figure 28: Factors included in the company’s criteria for purchasing/leasing new vehicles9
As shown in Figure 28, purchase price (92%, 96%) and reliability (82%, 98%) were cited most often by
both Swedish and Spanish fleet managers as factors included in their company’s criteria for
purchasing/leasing new vehicles.
There were also significant differences between the two countries. Spanish fleet managers were
significantly more likely to report that fuel economy (χ2 (1) = 8.098, p < 0.01), performance (χ2 (1) =
23.382, p < 0.001), reliability (χ2 (1) = 8.271, p < 0.01), vehicle size (χ2 (1) = 10.384, p < 0.01), and
warranty and service plans (χ2 (1) = 8.098, p < 0.01) were important factors in their new vehicle
purchase/lease decision. On the other hand, Swedish fleet managers were more likely to state that the re-
sale value of the new vehicle was an important consideration, χ2 (1) = 10.903, p < 0.01.
Vehicle type was also a factor more likely to be considered by Spanish fleet managers compared to
Swedish managers however this difference did not reach statistical significance (χ2 (1) = 4.844, p = 0.03).
Question: “Which of the following factors are priorities in your new vehicle choice?”
Fleet managers were then asked to indicate which factors were a priority in their new vehicle choice by
indicating whether the factors were a ‘high’, ‘medium’ or ‘low’ priority. Figure 29 shows the items that were
reported to be a ‘high’ priority for fleet managers in the new vehicle purchase/lease decision.
9 EuroNCAP was listed on the questionnaire as ‘EuroNCAP rating/other safety reports’.

CEA/EC SARAC II Results & Discussion – FLEET Managers
81
0 20 40 60 80 100
Comfort Country
EuroNCAPFuel
Make/ModelPerformance
PriceReliability
ReputationRe-sale
Running costsStyleSizeType
Warranty
Percentage
SpainSweden
**
*
*
Figure 29: Factors reported as a ‘high’ priority for the company when purchasing/leasing
a new vehicle10
EuroNCAP ratings/other safety reports were judged highest priority (73%), followed by reliability (72%)
and purchase price (69%) by Swedish fleet managers, whereas purchase price (88%), vehicle size (88%),
reliability (76%) and vehicle type (74%) were the factors most often cited by Spanish fleet managers.
There were also several significant differences between the two countries in terms of the factors that were
high priorities in the new vehicle purchase/lease decision. Spanish fleet managers were significantly more
likely to report that fuel economy (χ2 (1) = 9.149, p < 0.01), performance (χ2 (1) = 32.510, p < 0.001),
vehicle size (χ2 (1) = 10.384, p < 0.01), and warranty and service plans (χ2 (1) = 8.098, p < 0.01) as being
high priorities factors in their new vehicle purchase/lease decision. On the other hand, Swedish fleet
managers were more likely to state that the re-sale value of the new vehicle was a high priority, χ2 (1) =
10.903, p < 0.01.
In addition, there were other differences across the two countries that did not quite reach statistical
significance. Spanish fleet managers were more likely to rate purchase price and warranty and service
plans as high priorities compared to Swedish fleet managers (χ2 (1) = 4.821, p = 0.03; χ2 (1) = 3.776, p =
0.05, respectively). Alternately, Swedish fleet managers were more likely to cite the vehicle’s EuroNCAP
rating/other safety reports and country of vehicle’s manufacturer as a high priority compared to Spanish
fleet managers (χ2 (1) = 4.915, p = 0.03; (χ2 (1) = 4.961, p < 0.03, respectively).
Question: “Does your company have a policy for new vehicle purchases/leases?”
Fleet managers were then asked to indicate whether their company has a policy for new purchases/leases
for company executives and/or other types of vehicles. As shown in Figure 30, significantly more Swedish
10 EuroNCAP was listed on the questionnaire as ‘EuroNCAP rating/other safety reports’.

CEA/EC SARAC II Results & Discussion – FLEET Managers
82
fleet managers reported that their company does have an official policy for the purchase/lease of
executive driven vehicles (87%) compared Spanish fleet managers (32%), χ2 (1) = 19.801, p < 0.001.
Similarly, Swedish fleet managers were significantly more likely to have reported that their company has
an official policy for the purchase/lease of other types of vehicles (68%) compared to Spanish fleet
managers (22%), (χ2 (1) = 24.043, p < 0.001).
0
10
20
30
40
50
60
70
80
90
100
Executives Others
Perc
enta
ge
SwedenSpain
*
*
Figure 30: Proportion of companies with an official policy for the purchase/lease of new vehicles
Question: “If your company does have a policy, please indicate the factors in that policy.”
Fleet managers who had indicated that their company had an official policy for the purchase or lease of
new vehicles were then asked to indicate which factors are included in their policy. As shown in Figure 31,
purchase price was reported by most Swedish fleet managers as being part of the vehicle
purchasing/leasing policy (86%), followed by make/model (75%). Only 50 percent of fleet managers
indicated that EuroNCAP ratings were part of the official policy.
For Spanish fleet managers, most fleet managers reported reliability as being part of the vehicle
purchasing/leasing policy (90%), followed by performance (80%), purchase price (80%) and warranty and
service plans (80%).
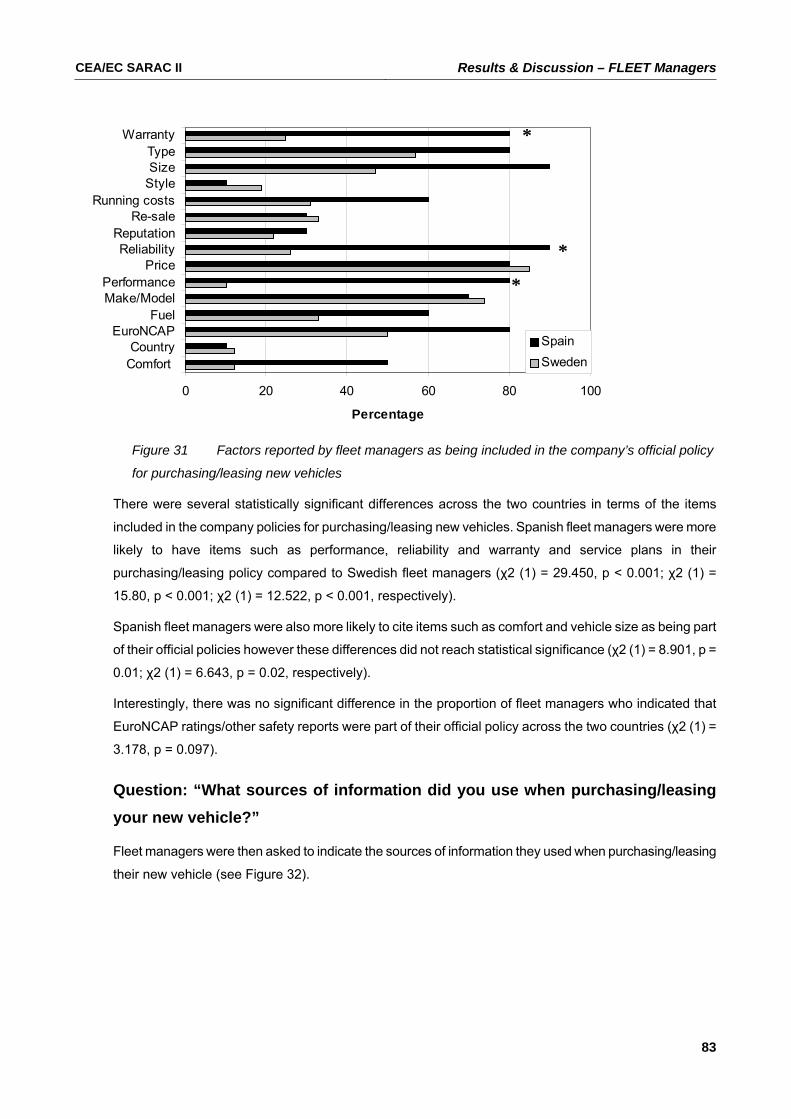
CEA/EC SARAC II Results & Discussion – FLEET Managers
83
Figure 31 Factors reported by fleet managers as being included in the company’s official policy
for purchasing/leasing new vehicles
There were several statistically significant differences across the two countries in terms of the items
included in the company policies for purchasing/leasing new vehicles. Spanish fleet managers were more
likely to have items such as performance, reliability and warranty and service plans in their
purchasing/leasing policy compared to Swedish fleet managers (χ2 (1) = 29.450, p < 0.001; χ2 (1) =
15.80, p < 0.001; χ2 (1) = 12.522, p < 0.001, respectively).
Spanish fleet managers were also more likely to cite items such as comfort and vehicle size as being part
of their official policies however these differences did not reach statistical significance (χ2 (1) = 8.901, p =
0.01; χ2 (1) = 6.643, p = 0.02, respectively).
Interestingly, there was no significant difference in the proportion of fleet managers who indicated that
EuroNCAP ratings/other safety reports were part of their official policy across the two countries (χ2 (1) =
3.178, p = 0.097).
Question: “What sources of information did you use when purchasing/leasing your new vehicle?”
Fleet managers were then asked to indicate the sources of information they used when purchasing/leasing
their new vehicle (see Figure 32).
0 20 40 60 80 100
Comfort Country
EuroNCAPFuel
Make/ModelPerformance
PriceReliability
ReputationRe-sale
Running costsStyleSizeType
Warranty
Percentage
SpainSweden
*
*
*

CEA/EC SARAC II Results & Discussion – FLEET Managers
84
0 20 40 60 80 100
Manufacturer website
EuroNCAP
Motoring websites
Consumer reports
Motoring magazines
Vehicle dealership
Word of mouth (professional)
Word of mouth (family/friend)
Other
Percentage
Spain
Sweden
*
*
**
**
Figure 32: Sources of information used by fleet managers when purchasing/leasing new vehicles
Swedish fleet managers reported that they used the vehicle manufacturer’s website (87%), EuroNCAP
ratings (39%), specialised motoring websites (36%) and recommendations from family of friends (35%) to
help them make their decision about which new vehicle to purchase/lease. On the other hand, Spanish
fleet managers reported that they used information from recommendations from professionals (74%) and
consumer reports (28%) to make their decisions. EuroNCAP ratings were not cited by any Spanish fleet
managers.
There were several significant differences in the proportion of fleet managers who indicated that they used
particular information sources across the two countries. Swedish fleet managers were significantly more
likely to report using the vehicle manufacturer’s website, motor magazines, specialised motoring websites,
EuroNCAP rating and information from a family or friend, (χ2 (1) = 73.895, p < 0.001; χ2 (1) = 17.968, p <
0.001; χ2 (1) = 9.248, p < 0.01; χ2 (1) = 26.280, p < 0.001, respectively).
Spanish fleet managers were significantly more likely to use information provided by
professional/technical/mechanical sources compared to Swedish fleet managers (χ2 (1) = 74.371, p <
0.001).
Other sources of information cited by Swedish fleet managers included leasing-plans supplied by the
companies who lease them the vehicles, information regarding the environmental class of the vehicle or
the statistics regarding a vehicle’s performance at its yearly roadworthy. Other sources of information cited
by Spanish fleet managers included leasing-plans supplied by the companies who lease them the
vehicles, information from the internet, vehicle shows, advertising, and information from renting
companies.

CEA/EC SARAC II Results & Discussion – FLEET Managers
85
Question: “What source of information was most valuable when deciding which vehicle to purchase/lease?”
Fleet managers were then asked to indicate which source of information was the most valuable to them in
the purchasing/leasing decision (see Figure 33).
0 20 40 60 80 100
Manufacturer website
EuroNCAP
Motoring websites
Consumer reports
Motoring magazines
Vehicle dealership
Word of mouth (professional)
Word of mouth (family/friend)
Other
Percentage
SpainSweden
Figure 33: The most valuable sources of information used by fleet managers when
purchasing/leasing a new vehicle
Most Swedish fleet managers cited the vehicle manufacturer’s website (45%) as the most valuable source
of information whereas most Spanish fleet managers cited the vehicle dealerships (60%) as the most
valuable source of information. EuroNCAP ratings were only cited by two percent of Swedish fleet
managers and were not cited by any of the Spanish fleet managers as the most valuable source of
information.
Question: “Does your company have a policy or set of guidelines for use of company vehicles (i.e., a policy regarding speeding, drink driving)?”
Fleet managers were asked whether their company has a policy regarding the use of company vehicles.
More Swedish fleet managers reported that their company had a policy regarding the use of company
vehicles (66%) than Spanish fleet managers (48%), however this did not reach statistical significance (χ2
(1) = 4.517, p = 0.034).

CEA/EC SARAC II Results & Discussion – FLEET Managers
86
Question: “If your company does have a policy or set of guidelines for use of company vehicles, please describe your company's policy.”
All fleet managers who had reported that their company had a policy regarding the use of company vehicle
were asked to briefly describe the types of guidelines that were included in the vehicle use policy.
Items that were specifically reported to be included in Swedish company’s policy included a) alcohol -
several fleet managers reported that their company policy stated that employees were not allowed to drink
and drive company vehicles, with some companies reported that they were trialling alcohol interlocks; b)
eco-training - several company policies encouraged their employees to attend eco-driving courses, and c)
vehicle maintenance- most fleet managers reported that their policy stated that employees were
responsible for maintaining, servicing and cleaning their vehicle. It was interesting to note that most
Swedish fleet managers stated that their company’s policy is for employees to “follow the road rules” – that
is, no speeding or drink driving. Most Spanish fleet managers indicated that their policies also included
issues such as: speeding, drink driving, not using a mobile phone while driving and that the driver pays
any fines rather than the company.
Question: “Have any company employees been involved in a work-related crash, after which the vehicle had to be towed away?”
In the last section of the questionnaire, fleet managers were asked about their company’s work-related
crash history. First, fleet managers were asked if any of their company vehicles had been involved in a
work-related crash where the vehicle had to be towed away? Swedish fleet managers were more likely to
report that a company vehicle had been involved in a work-related crash where the vehicle had to be
towed away (64%) compared to Spanish fleet managers (32%).
Question: “How many company employees been involved in a work-related crash, after which the vehicle had to be towed away?”
Fleet managers who indicated that there had been a work-related crash, after which the vehicle had to be
towed away who then asked to indicate how many company employees been involved in a work-related
crash (see Table 11).
Most Swedish fleet managers indicated that there had been 5 or less employees in work-related crashes
after which the vehicle had to be towed away (66%). All Spanish fleet managers indicated that there had
been 4 or less employees in work-related crashes after which the vehicle had to be towed away11.
11 Note that this does not control for the number of employees and/or fleet vehicles.

CEA/EC SARAC II Results & Discussion – FLEET Managers
87
Table 11: Number and percentage of employees who have been involved in a motor
vehicle crash where the vehicle had to be towed away.
Employees Sweden Spain
Number Percentage Number Percentage
0 0 0 4 24
1 7 17 2 12
2 4 10 5 29
3 10 24 4 24
4 6 15 2 12
5 5 12 0 0
6 0 0 0 0
7 1 2 0 0
8 0 0 0 0
9 0 0 0 0
10 + 8 20 0 0
TOTAL 41 100 17 100
Question: “How many work-related crashes resulted in an employee sustaining minor injuries (i.e., injured but not hospitalised)?”
Fleet managers were than asked to indicate the number of work related crashes in which an employee
sustained minor injuries (see Table 12).
Table 12: Number and percentage of work-related crashes resulted in an employee
sustaining minor injuries?
Crashes Sweden Spain
Number Percentage Number Percentage
0 25 51 8 44
1 7 14 4 22
2 8 16 3 17
3 4 8 2 11
4 1 2 1 6
5 2 4 0 0
10 2 4 0 0
TOTAL 49 100 18 100
Most Swedish and Spanish fleet managers reported that there were no work-related crashes that had
resulted in an employee sustaining minor injuries (51%, 44% respectively).

CEA/EC SARAC II Results & Discussion – FLEET Managers
88
Question: “How many work-related crashes resulted in an employee sustaining serious injuries (i.e., hospitalised)?”
Fleet managers were than asked to indicate the number of work related crashes in which an employee
sustained serious injuries (see Table 13).
Table 13: Number and percentage of work-related crashes that resulted in an employee
sustaining serious injuries
Crashes Sweden Spain
Number Percentage Number Percentage
0 48 90 19 100
1 2 4 0 0
2 2 4 0 0
3 1 2 0 0
TOTAL 53 100 19 100
Most Swedish and Spanish fleet managers reported that there were no work-related crashes that had
resulted in an employee sustaining serious injuries (91%, 100% respectively).

CEA/EC SARAC II Results & Discussion – FLEET Managers
89
5.3 Discussion of the Fleet Managers results
5.3.1 How important is ‘vehicle safety’ to Fleet Managers?
When asked to indicate the vehicle factors that are included in their company’s criteria for
purchasing/leasing a new vehicle, fleet managers from both Sweden and Spain were more likely to list the
vehicle’s price, reliability, running costs, size and fuel consumption then the vehicle’s safety (defined as
the vehicle’s EuroNCAP rating). In addition, when asked to indicate the vehicle factors that were a high
priority in their purchase/lease decision, fleet managers from both Sweden and Spain were more likely to
list the vehicle’s price and reliability as higher priorities compared to their vehicle’s safety (defined as the
vehicle’s EuroNCAP rating). Furthermore, when asked to indicate the vehicle factors that are included in
their company’s policy regarding new vehicle purchases/leases, fleet managers from both Sweden and
Spain were more likely to state that the vehicle’s price, make/model and type were included in the policy
compared specifications regarding the vehicle’s safety (defined as the vehicle’s EuroNCAP rating).
Consistent with previous research conducted with private consumers (e.g., The Dohring Company, 2003;
Desrosiers Automotive Report, 2001; Progressive Insurance Co., 2001), the findings of the current study
suggest that vehicle safety is generally not the primary consideration in the vehicle purchase process and
is consistently outranked by factors such as price and dependability/reliability
5.3.2 Who is “vehicle safety” more important to?
Consistent with the overall findings for the private consumers, vehicle safety appears to be more important
to Swedish fleet managers compared to Spanish fleet managers. For example, Swedish fleet managers
were more likely to state that the vehicle’s EuroNCAP rating was a high priority and included in their
criteria for purchasing/leasing a new vehicle (although these differences did not meet statistical
significance). Interestingly, there was no significant difference in the proportion of fleet managers who
indicated that EuroNCAP ratings were part of their official policy across the two countries.
5.3.3 How do consumers search for and use information in their purchase decisions? What information is most important?
When asked to indicate the sources of information they used when purchasing their new vehicle, there
were several significant differences across the two countries. Swedish fleet managers were significantly
more likely to report that they used manufacturer websites, motoring websites, and EuroNCAP ratings,
whereas Spanish participants were significantly more likely to report that they used information from
professional/technical/mechanical sources.
There was also a significant difference across the two countries when fleet managers were asked to
indicate which source of information that was the most valuable to them in the pre-purchase decision.
Most Swedish fleet managers cited the vehicle manufacturer’s website as the most valuable source of

CEA/EC SARAC II Results & Discussion – FLEET Managers
90
information whereas most Spanish fleet managers cited the vehicle dealerships as the most valuable
source of information. Interestingly, EuroNCAP ratings were only cited by small proportion of Swedish fleet
managers and no Spanish fleet managers as the most valuable source of information. This finding is
consistent with the current findings for private new vehicle purchasers and previous research conducted
by the US Department of Transportation, where the majority of participants stated that crash test result
information such as EuroNCAP ratings are not the most valuable source of information in the pre-
purchase process because participants expect safety considerations to be incorporated into the reviews
and recommendations of consumer publications that they consult (Charles River Associates Incorporated,
1998).

CEA/EC SARAC II Conclusions and Recommendations
91
6 Conclusions and Recommendations The findings of the current study indicate that vehicle safety is the primary consideration in the purchase
process for private new vehicle consumers in both Sweden and Spain. Overall, participants from both
countries were most likely select safety related factor (e.g., EuroNCAP rating) and a safety-related feature
(e.g., ABS) from a list of factors and features as their highest priorities in the new vehicle process.
However, vehicle safety was significantly more important to Swedish new private vehicle consumers
overall compared to Spanish new private vehicle consumers. Consistent with previous research, most
participants equated vehicle safety with the presence of specific vehicle safety features or technologies
rather than the vehicle’s crash safety/test results or crashworthiness.
Fleet managers from both Sweden and Spain indicated that vehicle safety is not the primary consideration
when purchasing/leasing a new company vehicle. Rather, factors such as price and reliability appear to be
the highest priorities in the new vehicle purchase/lease process. Consistent with the overall findings for the
private consumers, vehicle safety appears to be more important to Swedish fleet managers in the new
vehicle purchase/lease process compared to Spanish fleet managers. Most Swedish fleet managers cited
the vehicle manufacturer’s website as the most valuable source of information whereas most Spanish fleet
managers cited the vehicle dealerships as the most valuable source of information.
Overall, the study suggests a need to increase the profile of vehicle safety amongst both fleet managers
and private vehicle purchasers. One important way of achieving this may be to educate consumers about
where to locate objective information about vehicle safety, such as EuroNCAP. In addition, EuroNCAP
needs to be promoted more widely and effectively so that it plays a more prominent role in the purchase
decisions of consumers.
• For fleet managers, awareness needs to be raised about vehicle safety especially with respect to
costs and benefits for occupational health and safety in order to protect their most valuable company
resources. Fleet owners should also be encouraged to develop vehicle purchase policies that would
include specific criteria for ensuring a high level of safety in their fleet.
• For private vehicle purchasers, the findings highlighted the need to target particular consumer groups
(such as younger consumers) in order to increase their knowledge regarding vehicle safety and to
encourage them to place highest priority on safety in the new vehicle purchase process.
6.1 Future Research
This study identified a number of interesting differences between Sweden and Spain in terms of the
importance of safety in the new vehicle purchase process. It will be important to determine whether these
findings can be generalised to other European countries, especially where there is a poor safety record.

CEA/EC SARAC II Conclusions and Recommendations
92
Whilst this study has been successful in exploring the importance of vehicle safety in the new vehicle
purchase process, the findings could be enhanced by use of other survey methods such as willingness-to-
pay. These techniques offer greater potential to explore these issues as they involve the use of in-depth
questioning and trade-off scenarios to get behind what is really important in people’s buying strategies.
Unfortunately, while questionnaires are useful for uncovering some of these details, they generally
assume people are fully aware of their actions, which can be challenged when faced with multiple choices.

CEA/EC SARAC II References
93
7 References Charles River Associates Incorporated (1998). Consumer Acceptance of Automotive Crash Avoidance Devices – A report of qualitative research. Boston, Massachusetts: US Department of Transportation. Centre for International Economics (2001). Review of Willingness-to-Pay Methodologies. Canberra, ACT: Centre for International Economics. Desrosiers Automotive Reports (2002). The need for dialogue: A perspective on vehicle safety. Volume 16(9). ISSN 0841-9957. Dohring Company (2003). Dohring Study: Americans Drivers Love Safety Equipment and Incentives. Accessed on 27th August, 2003 at http://www.dohring.com/press Dwyer Leslie Pty. Ltd. (1992). Willingness to Pay for Vehicle Safety Features. Phase 1 Report: Methodology and Survey Techniques. Federal Office of Road Safety, CR 102. Ferguson, S.A. (1992). Survey of new car buyers. Arlington, VA: Insurance Institute for Highway Safety. Ferguson, S.A. (1999). Consumer demand. Recovery, 10 (4), 11-13. Ferguson, S.A. & Williams, A.H. (1996). What safety means to consumers and its role in the purchase decisions? Journal of Traffic Medicine, 24(3-4), 83-89. Hütz, H. & Becker, St. (1999). Verstãndlichkeit von Crash-Test-Information und deren Kaufentscheidungsrelevanz, in: TÜV Rheinland/Berlin Brandenburg (Hrsg.): Symposium weltweite Harmonisierung von Crash-Test-Programmen, Kõln. General Motors Corporation (1994). Continuous Automotive Market Information Program Buyer Behaviour. General Motors Corporation: Detroit, US Gold M.R., Siegel J.E., Russel L.B., & Weinstein M. (1996). Cost-effectiveness in health and medicine. New York: Oxford University Press. Insurance Research Council (1990). Public Attitude Monitor: A Survey of Public Attitudes on Auto Safety Issues. Oakbrook, Illinois: Insurance Research Council. Insurance Research Council (1999). Public Attitude Monitor 1999: Vehicle Safety Issues. Malvern, PA: Insurance Research Council. J.D. Power and Associates (1993). Automotive Consumer Profile Study. Agoura Hills, CA: J.D. Power and Associates. Monash University Accident Research Centre (1992). Feasibility of occupant protection countermeasures (CR 100) by A.P. Vulcan, B.N. Fildes, M. Cameron, R. Parish, D. Taylor & K. Digges. National Highway Traffic Safety Administration (1995). Customer Satisfaction Survey, National Highway Traffic Safety Administration. Washington DC: U.S. Department of Transportation. National Highway Traffic Safety Administration (1997). Customer Satisfaction Survey, National Highway Traffic Safety Administration. Washington DC: U.S. Department of Transportation. Princeton Survey Research (1994). Auto Safety in America. Emmaus, PA: Princeton Survey Research Associates. Princeton Survey Research (1995). Auto Safety in America. Emmaus, PA: Princeton Survey Research Associates.

CEA/EC SARAC II References
94
Progressive Insurance Co. (2001). Safety takes a back seat when shopping for a new car. Accessed on 21st August, 2003 at http://www.progressive.com/newsroom/new_car.asp Smith, R., Olsen, J.A. & Harris, A. (1999). A Review of Methodological Issues in the Conduct of WTP Studies in Health Care II: Administration of a CV Survey. Centre for Health Program Evaluation, Working paper 85. Stoffer, H. (2000). Safety steps into the spotlight. Automotive News 5864 (March), 3. The Roy Morgan Research Centre Pty Ltd (1992). Willingness-to-pay for Vehicle Safety Features. Federal Office of Road Safety, CR 112 Transportation Research Board (TRB) (1996). Shopping for Safety: Providing consumer automotive safety information, Special Report 248. Washington DC: Transportation Research Board. Zeidler, F., Kullgren, A., Fildes, B., Morris, A. & O’Neill, B. (2001). Problems in Defining Safety and Consequences for Consumer Information. Report of Sub-Task 1.7 prepared for the SARAC Committee.

CEA/EC SARAC II Appendices
95
8 Appendices
Appendix 1: Swedish Letter of Invitation to Private and Fleet Vehicle Purchasers

CEA/EC SARAC II Appendices
96
Appendix 2 Private Vehicle Purchaser Questionnaire
Factors considered by Fleet Managers when purchasing a new vehicle Please answer the following questions about your recent new vehicle purchase. A.1 What kind of vehicle make and model did you recently purchase? Make (e.g., Saab) ___________________ Model (e.g., 9-3)____________________ A.2 When did you purchase your new vehicle? (Tick One) � 1-6 months ago � 7-12 months ago � 13-18 months ago Other:__________________ A.3 Were you the main decision maker or a joint decision maker when deciding which vehicle to purchase? � Main � Joint � NOT a decision maker A.4 If you stated that you were the 'joint decision maker' in A.3, please state who else made the decision about the new vehicle with you? � Spouse � Son/daughter � Other: ____________________ A.5 How long do you plan to own this vehicle? _______ years A.6 Are you the main driver of this new vehicle? � Yes � No A.7 What were the main reasons for purchasing this vehicle? (Tick as many as appropriate) � Replacing an old vehicle � Replacing a vehicle damaged in a crash � Purchasing for business purposes � Purchasing for your spouse � Purchasing a safer vehicle � Purchasing your first vehicle � Purchasing for your son or daughter � Purchasing a more suitable vehicle � Purchasing to replace another mode of transport �Other: _____________________________ A.8 What sources of information did you use when purchasing your new vehicle (Tick as many as appropriate) � Vehicle manufacturer website � EuroNCAP � Specialised motoring newspaper sections � Motor magazines � Vehicle dealership � Word of mouth (family/friend) � Word of mouth (professional/technical/mechanical) � Other: ____________________________ A.9 What source of information in A.8 was most valuable when deciding which vehicle to purchase? _________________________________________________________________________________

CEA/EC SARAC II Appendices
97
A.10 List the three most important factors that you considered when deciding which vehicle to purchase (Please list the most important factor first) 1.__________________________________ 2.__________________________________ 3.__________________________________ A.11 Which of the following factors are a priority in your new vehicle choice? Choose between high/medium/low priority
High Medium Low A.12 Rank
Comfort Country of manufacturer EuroNCAP ratings/Other safety reports Fuel economy Make/Model Performance (including power & handling) Purchase price Reliability Reputation of make/model Re-sale value Running costs Style/look/colour Vehicle size Vehicle type Warranty and service plans A.12 For those factors that you rated 'high' in A.11, please rank only these in order from highest (1) to lowest priority Use the right hand column of the table in A.11 (1 = highest priority)

CEA/EC SARAC II Appendices
98
A.13 What features were a priority when choosing which vehicle to purchase? (High/medium/low) High Medium Low A.14
Rank A.15 Standard/ Optional
Active head restraints Advanced braking systems (e.g., ABS) Air conditioning Anti-theft devices/ alarms Automatic transmission Body kit (e.g., spoiler, wheels) CD player Cruise control Cruise control with frontal distance warning Curtain airbags Driver airbag DVD/Video systems Following distance sensor Front passenger airbag High intensity discharge headlight Lane warning device Parking assistance/reversing sensor Power windows/mirrors Route navigation Seatbelt reminder systems Speed alert Side airbags Stability control systems (e.g., ESP) Three-point belt in the centre rear seat Vehicle specific child restraint Window tinting A.14 For those factors that you rated 'high' in A.13, please rank only these in order from highest (1) to lowest priority Use the right hand column of the table in A.13 (1 = highest priority) A.15 Please indicate which of the features in A.13 were standard or which features you purchased at an additional cost. A.16 Did you consider any other vehicles at the time of purchasing your current vehicle? A.17 If you answered 'YES' in A.16, which other vehicles did you consider purchasing? Make Model Type Year _________________________________________________________________________________ _________________________________________________________________________________

CEA/EC SARAC II Appendices
99
A.18 If you answered 'YES' in A.16, what were the reasons for selecting your current vehicle in preference to the other vehicles? ___________________________________________________________________________________________________________________________________________________________________________________________________________________________________________________ A.19 Please list up to three factors that you believe make vehicles safe? (1=most important) 1.__________________________________ 2.__________________________________ 3.__________________________________ A.20 In what way did safety influence your choice of car? Choose the alternative that best describes your choice. � I only considered safe vehicles from the start � I chose the type of vehicle I wanted first, then made sure the specific make/model was the safest type � I believe all new vehicles are safe, so I concentrated on other factors in selecting the vehicle � Other reason: ____________________________________________________________________ A.21 How safe do you think that your new vehicle is? � Very safe � Safe � Less safe � Not sure A.22 Please describe why you consider your new vehicle to be very safe/safe/less safe? ___________________________________________________________________________________________________________________________________________________________________________________________________________________________________________________ A.23 Were there any safety options (i.e., features to help prevent a crash or to protect you in the case of a crash) that were available to you that you did not purchase? � Yes � No A.24 If you answered 'YES' in A.22, please list those options ___________________________________________________________________________________________________________________________________________________________________________________________________________________________________________________ A.25 If you answered 'YES' in A.22, why did you decide not to purchase those safety options? � Too expensive � Unnecessary � Preferred other options � Other:__________________________

CEA/EC SARAC II Appendices
100
Section B: Personal Information B.1 Age__________ B.2 � Male � Female B.3 Marital Status � Married/De facto � Not married � Widowed � Divorced/Separated B.4 How many children under the age of 16 years are living in your household? __________ B.5 Highest level of education you reached? � Finished secondary school � Finished Techinal school or Commercial college (including trade certificate or other certificate or apprenticeship) � Some University or College of Advanced Education training � Degree from University, College of Advanced Education or higher Degree � Now at University or College of Advanced Education � Other: _________________________ B.6 What is your current yearly household income (euro)? � Under 10 000 � 10 000-20 000 � 20 000-30 000 � 30 000-40 000 � 40 000-50 000 � Over 50 000 B.7 On average, how many kilometres is the car driven per year? � Less than 10,000 � 10, 001-15,000 � 15, 001-20,000 � 20,001-25,500 � 25,001-30,000 � More than 30,000
Section C: Motor Vehicle Crashes C.1 Have you been involved in a motor vehicle crash in the last three years? � Yes � No If you answered 'YES' in C.1, did the crash result in Choose as many alternatives as appropriate. � Where the vehicle had to be towed away � No injuries to any occupants in your motor vehicle � Minor injuries (i.e., not hospitalised) to a driver or passenger in your motor vehicle? � Serious injuries (i.e., hospitalised) or fatal to a driver or passenger in your motor vehicle? C.3 Have you incurred any traffic infringements in the past three years (other than parking fines)? � Yes � No C.4 If you answered 'YES' in C.3, please list the traffic infringements that you have incurred? � Speeding � Red light running � Drink driving

CEA/EC SARAC II Appendices
101
� Not wearing a seatbelt � Other: _________________ C.5 How concerned are you about the possibility of being in a motor vehicle crash? Not at all concerned Very concerned 1 2 3 4 5 C.6 To what extent do you feel that you are able to protect yourself and your family from a motor vehicle crash? I can’t do much I can do a lot 1 2 3 4 5
Thank you for your participation.

CEA/EC SARAC II Appendices
102
Appendix 3 Fleet Manager Vehicle Purchaser Questionnaire
Factors considered by Fleet Managers when purchasing a new vehicle
Please answer the following questions about your company. A.1 Please write down the name and type of company that you work for? Name of company: ________________________________________ Type of company: ________________________________________ A.2 Please describe your company’s passenger vehicle fleet
Type of passenger vehicle
Number purchased Number leased
Executives
General duties/use
Section B: Policy for purchase/lease and use of vehicles
B.1 Are the factors in the table below included in your criteria for purchasing/leasing new vehicles? (Answer Yes/No in the left hand column) B.2 Which of the following factors are a priority in your new vehicle choice? (Choose between high/medium/low priority)
B.1 Priority for B.2 B.4 Yes/No High Mediu
m Low Included
Yes/No Comfort Country of manufacturer EuroNCAP ratings/Other safety reports
Fuel economy Performance (including power and handling)
Purchase price Reliability Reputation of make/model Re-sale value Running costs Style/look/colour Vehicle size Vehicle type Warranty and Service plans

CEA/EC SARAC II Appendices
103
B.3 Does your company have a policy for new vehicle purchases/leases? Executives: Others: � Yes � Yes � No � No If possible, please send a copy of your company's policy/policies. B.4 If your company does have a policy, please tick in the right column the factors in that policy. B.5 If your company does not have a purchasing/leasing policy, please describe how you make the decision regarding which specific make/model to purchase/lease in your company's fleet? ___________________________________________________________________________ ___________________________________________________________________________ ___________________________________________________________________________ B.6 What sources of information did you use when purchasing your new vehicle? (Tick as many as appropriate) � Vehicle manufacturer website � EuroNCAP � Specialised motoring newspaper sections � Other consumer reports � Motor magazines � Vehicle dealership � Word of mouth (professional/technical/mechanical) � Word of mouth (family/friend) Other: _____________________________________________________________________ B.7 What source of information in B.6 was most valuable when deciding which vehicle to purchase? ___________________________________________________________________________ B.8 Does your company have a policy or set of guidelines for use of company vehicles (i.e., a policy regarding speeding, drink driving)? � Yes � No B.9 If you answered 'YES' to B.8, please describe your company's policy If it is possible, please attach a copy of the policy and return it with the survey. ___________________________________________________________________________ ___________________________________________________________________________ ___________________________________________________________________________ ___________________________________________________________________________

CEA/EC SARAC II Appendices
104
Section C: Motor Vehicle Crashes
C.1 Have any company employees been involved in a work-related crash, after which the vehicle was not driveable?
(during duty)
� Yes � No
If you answered 'YES' in C.1
C.2 How many company employees been involved in a work-related crash, after which the vehicle was not driveable?
Number: ____________________
C.3 How many work-related crashes resulted in an employee sustaining minor injuries (i.e., injured but not hospitalised)?
Number: ____________________
C.4 How many work-related crashes resulted in an employee sustaining serious injuries (i.e., hospitalised)?
Number: ____________________
Thank you for your participation.
If applicable, please attach a copy of your company's policy regarding vehicle purchase/lease and vehicle use.

CEA/EC SARAC II Appendices
105
Appendix 4: Availability of Safety Features: Pilot Study
Background
Little information is available regarding the different car related issues influencing consumers’ car
selection. Consequently, the role of safety, in contrast to economic and environmental issues and car
performance and comfort, is quite unclear. However, there is considerable available information
regarding vehicle safety. Tests carried out by the independent EuroNCAP group provide vehicle safety
information safety for most of the new vehicles sold in Finland and the rest of Europe by assigning
them a “star rating” based on how well they perform in a standardised crashworthiness test. This
information is then published to help the consumers to decide which vehicle to buy by allowing
comparison of various alternatives.
Most safety advocates reluctantly accept that it is not possible to prevent all crashes, although they do
agree that the consequences of them can be substantially mitigated by the vehicle design. This
depends not only on the crashworthiness of the vehicle’s structure but also on its in-built safety
features. This has been shown to vary considerably across the different makes and models.
Consumers make a choice of what level of safety they require when buying a new car by their decision
of what make and model they choose, as well what safety equipment (often optional) they select at the
time of purchase. The degree to which consumers will choose safety equipment of course depends not
only on what is available and what they can afford but also how much they value safety generally. The
issue of the importance of safety per se in this decision making process is unclear, compared to the
many other features involved in this buying decision.
Study Aims and Method
The purpose of this pilot study was to identify the safety features that are available among popular
passenger car makes and models currently sold in Finland. From data provided by The Finnish Vehicle
Administration (AKE) on first year registration statistics, eight popular types of cars for model years
1999, 2001 and 2003 were chosen to follow-up. These are listed in Table 1 below. It is important to
note that most of these vehicles are classified as lower medium-class vehicles (Fiat Punto and Peugeot
206 are classified as small vehicles), reflecting current popularity trends in Finland.
After the vehicle types had been chosen, the options list for each of these types and model years had
to be collected. At first, the main source of this information was the websites of the various
manufacturer representatives and published printed brochures with their annexed price lists. Some
options could also be traced by looking at the type-approval documents. For instance, according to the
Council Directive 70/156/EEC as last amended by the Commission Directive 2001/116/EC, the
manufacturer of the vehicle has to inform whether the ABS brakes are standard or extra. In addition, if
airbags or belt pre-tensioning systems exist, their positioning and availability for different variants and
versions must also be documented as part of the type-approval system found in electronic form at the
register of the Finnish type-approving authority (AKE).

CEA/EC SARAC II Appendices
106
Table A4-1. First registrations and percentages in Finland
Make/Model 1999 Score % 2001 Score % 2003 Score %
Fiat Punto 1819 23 1,3 2924 9 2,7 3278 11 2,2
Ford Focus 7449 2 5,5 4276 4 3,9 4506 5 3,1
Nissan Almera 4485 6 3,3 4114 5 3,8 4518 4 3,1
Opel Astra 9668 1 7,1 5749 1 5,3 2590 18 1,8
Peugeot 206 2098 19 1,5 2505 12 2,3 3126 13 2,1
Renault Megane 3533 9 2,6 2947 8 2,7 3278 11 2,8
Toyota Corolla 5335 4 3,9 3771 7 3,4 9681 1 6,6
Volkswagen Golf 4757 5 3,5 4000 6 3,7 7309 2 5,0
Total 41143 28,7 32287 27,8 40289 26,7
Total cars 137017 109428 147405
In addition to these data sources, the manufacturer’s representatives were also asked to estimate or
provide exact figures of how many of the sold vehicles were equipped with options described in the
following section. Unfortunately, little information was received from European manufacturers in
assembling these data.
Optional Safety Equipments
A list of 26 items that could be considered to have some safety benefit was compiled from discussion
among the various expert members of the SARAC committee. These were considered to have either
active or passive safety benefits. These features are shown in Table A4-2 below.
Table A4-2: List of 26 safety features available in current model passenger cars in Europe
Active head restraints Front passenger airbag Advanced braking systems (e.g., ABS) High intensity discharge headlight Air conditioning Lane warning device Anti-theft devices/ alarms Parking assistance/reversing sensor Automatic transmission Power windows/mirrors Body kit (e.g., spoiler, wheels) Route navigation CD player Seatbelt reminder systems Cruise control Speed alert Cruise control with front distance warning Side airbags Curtain airbags Stability control systems (e.g., ESP) Driver airbag Three-point belt in the centre rear seat DVD/Video systems Vehicle specific child restraint Following distance sensor Window tinting

CEA/EC SARAC II Appendices
107
Features improving driving comfort, such as automatic transmission, heated seats or solid cellular
phone system were excluded. The options were grouped into three categories of safety devices,
namely interior safety, vehicle control and visibility. From these, the following seven features were
selected for follow-up, each of which appeared optional in at least some of the selected vehicle-types
of interest. These included:
• side air bags in front (interior safety)
• head or head/thorax air bags such as inflatable curtains (interior safety)
• vehicle-stability control / electronic stability program (vehicle control)
• traction control (vehicle control)
• rear parking assist (vehicle control)
• xenon headlights (visibility)
• fog lights (visibility)
Each of these options could be either standard in the entire range of models, standard in some
versions, optional in some versions, optional in all models, or not available at all.
As noted earlier, there was not a single official database available where all this kind of information is
recorded. While some of these features could be identified from the VIN-code, unfortunately, most of
them, especially the optional equipment, is not listed in VIN. Manufacturers sales material was a useful
source of information but not totally explicit. Representatives were approached to help identify what is
available among the selected cars but unfortunately, were not able to deliver additional information
requested. Neither the type-approval number nor the variant or version code could be properly
facilitated in this study, hence, only scant information on what features are available on these makes
and models is possible at this time.
Results
The known availability of safety equipment for the vehicles of interest is listed in the following tables for
the seven safety features selected.
Side Airbags
Side airbags comprise a wide range of different designs from thorax-only bags in the seat or door,
head/thorax bags in the seat, to air curtains or bags installed in the upper side rails of the vehicle.
These airbags provide protection mainly for the front-seat occupants, although some of the curtain
designs do offer rear seat protection as well. The findings for the availability of these units are shown in
Tables A4-3 and A4-4 below.
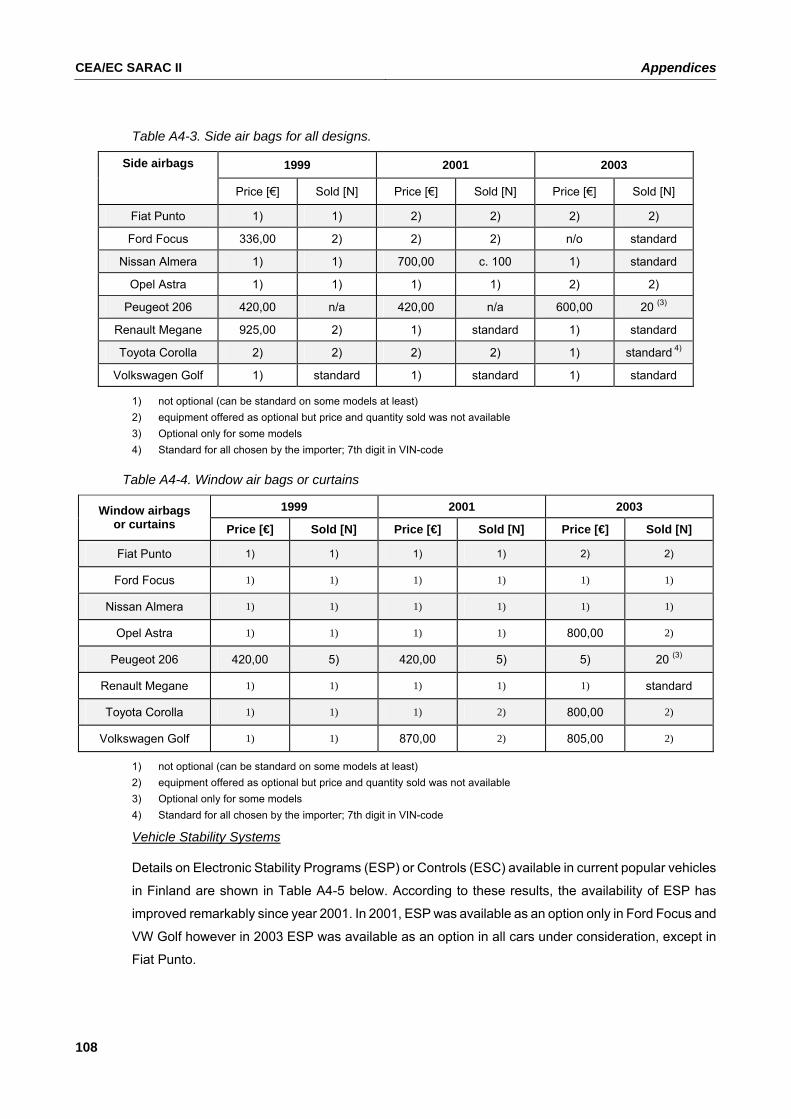
CEA/EC SARAC II Appendices
108
Table A4-3. Side air bags for all designs.
1999 2001 2003 Side airbags
Price [€] Sold [N] Price [€] Sold [N] Price [€] Sold [N]
Fiat Punto 1) 1) 2) 2) 2) 2)
Ford Focus 336,00 2) 2) 2) n/o standard
Nissan Almera 1) 1) 700,00 c. 100 1) standard
Opel Astra 1) 1) 1) 1) 2) 2)
Peugeot 206 420,00 n/a 420,00 n/a 600,00 20 (3)
Renault Megane 925,00 2) 1) standard 1) standard
Toyota Corolla 2) 2) 2) 2) 1) standard 4)
Volkswagen Golf 1) standard 1) standard 1) standard
1) not optional (can be standard on some models at least) 2) equipment offered as optional but price and quantity sold was not available 3) Optional only for some models 4) Standard for all chosen by the importer; 7th digit in VIN-code
Table A4-4. Window air bags or curtains
1999 2001 2003 Window airbags or curtains Price [€] Sold [N] Price [€] Sold [N] Price [€] Sold [N]
Fiat Punto 1) 1) 1) 1) 2) 2)
Ford Focus 1) 1) 1) 1) 1) 1)
Nissan Almera 1) 1) 1) 1) 1) 1)
Opel Astra 1) 1) 1) 1) 800,00 2)
Peugeot 206 420,00 5) 420,00 5) 5) 20 (3)
Renault Megane 1) 1) 1) 1) 1) standard
Toyota Corolla 1) 1) 1) 2) 800,00 2)
Volkswagen Golf 1) 1) 870,00 2) 805,00 2)
1) not optional (can be standard on some models at least) 2) equipment offered as optional but price and quantity sold was not available 3) Optional only for some models 4) Standard for all chosen by the importer; 7th digit in VIN-code
Vehicle Stability Systems
Details on Electronic Stability Programs (ESP) or Controls (ESC) available in current popular vehicles
in Finland are shown in Table A4-5 below. According to these results, the availability of ESP has
improved remarkably since year 2001. In 2001, ESP was available as an option only in Ford Focus and
VW Golf however in 2003 ESP was available as an option in all cars under consideration, except in
Fiat Punto.
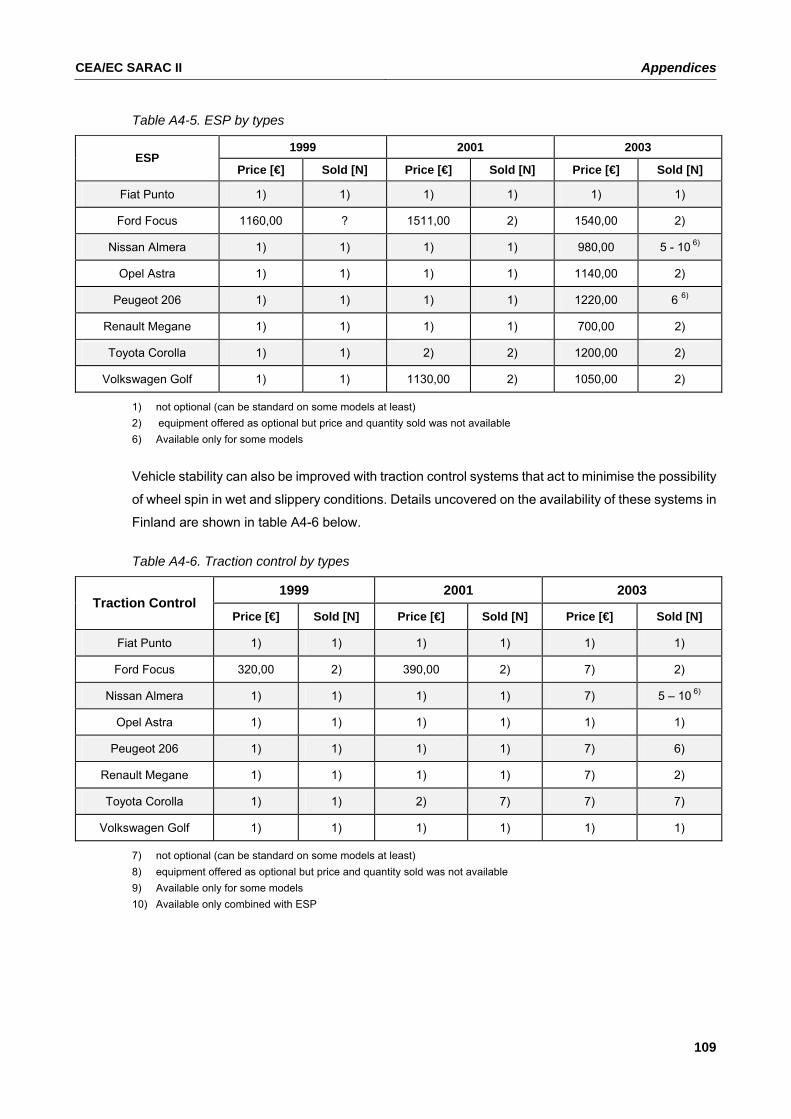
CEA/EC SARAC II Appendices
109
Table A4-5. ESP by types
1999 2001 2003 ESP
Price [€] Sold [N] Price [€] Sold [N] Price [€] Sold [N]
Fiat Punto 1) 1) 1) 1) 1) 1)
Ford Focus 1160,00 ? 1511,00 2) 1540,00 2)
Nissan Almera 1) 1) 1) 1) 980,00 5 - 10 6)
Opel Astra 1) 1) 1) 1) 1140,00 2)
Peugeot 206 1) 1) 1) 1) 1220,00 6 6)
Renault Megane 1) 1) 1) 1) 700,00 2)
Toyota Corolla 1) 1) 2) 2) 1200,00 2)
Volkswagen Golf 1) 1) 1130,00 2) 1050,00 2)
1) not optional (can be standard on some models at least) 2) equipment offered as optional but price and quantity sold was not available 6) Available only for some models
Vehicle stability can also be improved with traction control systems that act to minimise the possibility
of wheel spin in wet and slippery conditions. Details uncovered on the availability of these systems in
Finland are shown in table A4-6 below.
Table A4-6. Traction control by types
1999 2001 2003 Traction Control
Price [€] Sold [N] Price [€] Sold [N] Price [€] Sold [N]
Fiat Punto 1) 1) 1) 1) 1) 1)
Ford Focus 320,00 2) 390,00 2) 7) 2)
Nissan Almera 1) 1) 1) 1) 7) 5 – 10 6)
Opel Astra 1) 1) 1) 1) 1) 1)
Peugeot 206 1) 1) 1) 1) 7) 6)
Renault Megane 1) 1) 1) 1) 7) 2)
Toyota Corolla 1) 1) 2) 7) 7) 7)
Volkswagen Golf 1) 1) 1) 1) 1) 1)
7) not optional (can be standard on some models at least) 8) equipment offered as optional but price and quantity sold was not available 9) Available only for some models 10) Available only combined with ESP

CEA/EC SARAC II Appendices
110
Rear-Sensing Technology
Another potential important safety feature is parking (or reversing) assist technology which can
minimise the risk of a rear-end collision with another object or a pedestrian. Details on the availability of
these systems in Finland are shown in Table A4-7 below. It is important to note that several types of
cheaper parking assist systems are available from independent car accessory dealers and they are
quite popular due to easy installation.
Table A4-7. Parking assistant (reversing radar)
1999 2001 2003 Parking assistant
Price[€] Sold [N] Price [€] Sold [N] Price [€] Sold [N]
Fiat Punto 2) 2) 2) 2) 2) 2)
Ford Focus 2) 2) 1100,00 2) 1130,00 2)
Nissan Almera 1) 1) 350,00 50 -75 237,00 50 -75
Opel Astra 1) 1) 1) 1) 1) 1)
Peugeot 206 1) 1) 1) 1) 1) 1)
Renault Megane 1) 1) 1) 1) 2) 2)
Toyota Corolla 1) 1) 1) 1) 1) 1)
Volkswagen Golf 1) 1) 860,00 2) 795,00 2)
11) not optional (can be standard on some models at least) 12) equipment offered as optional but price and quantity sold was not available
Improved Visibility
The final category of safety features potentially available on current model passenger cars in Finland is
shown in Tables A4-8 and A4-9 below.
Table A4-8. Xenon headlights
1999 2001 2003 Xenon lights
Price [€] Sold [N] Price [€] Sold [N] Price [€] Sold [N]
Fiat Punto 2) 2) 2) 2) - -
Ford Focus 1) 1) 1) 1) 1230,00 2)
Nissan Almera 1) 1) 1) 1) 1) 1)
Opel Astra 1) 1) 1) 1) 1400,00 2)
Peugeot 206 1) 1) 1) 1) 1) 1)
Renault Megane 1) 1) 1) 1) 1000,00 2)
Toyota Corolla 1) 1) 1) 1) 1) -
Volkswagen Golf 1) 1) 1750,00 2) 1395,00 2)

CEA/EC SARAC II Appendices
111
Table A4-9: Fog lights in the front by types.
1999 2001 2003 Fog lights
Price [€] Sold [N] Price [€] Sold [N] Price [€] Sold [N]
Fiat Punto 2) 2) 2) 2) 2) 2)
Ford Focus 202,00 2) 250,00 2) 280,00 2)
Nissan Almera 168-252,00 300 - 400 168-252,00 500 - 600 168 -252,00 500 - 600
Opel Astra 2) 2) 2) 2) 315,00 2)
Peugeot 206 1) 1) 1) 1) 1) 1)
Renault Megane 1) standard 1) standard 1) standard
Toyota Corolla 1) 1) 1) 1) 1) 1)
Volkswagen Golf 555,00 2) 570,00 2) 540,00 2)
Discussion
The most obvious finding from this study is that the availability of optional safety equipment has
increased remarkably during the four-year span among smaller car segments (ESP for example).
Frontal airbags are standard for both the driver and the co-driver in each of these types, and ABS
brakes, side air bags, belt pre-tensioning devices and the rear seat head restraints are more often
standard than optional. It seems that many of these popular makes and models offer quite a range of
safety features, either as standard or optional equipment, which is particularly important for cars of
these sizes.
This current study aimed to determine availability of safety technology in the current Finnish fleet using
information from various databases and available information sources. As noted earlier, information on
prices and availability was difficult to collect, and hence, much of these data were not available. It
would be important to carry out a more extensive cataloguing of safety feature technology for providing
this information to consumers so that they can take this information into account in their purchasing
decision. The Subtask 4.2 report12 provides one system whereby this information can be made
available for consumers, however a more extensive examination of what is available throughout all
European vehicles first needs to be undertaken to collect this information and keep it updated.
Car selling volumes are relative low in Finland. Transporting cars from the factory to Finland is rather
expensive due to its distant location and its complicated transport chain. Therefore, from the car
importers’ point of view, it is more reasonable to import a series of cars with similar equipments than to
12 Fildes, Clarke and Langford. Conflicting Ratings and Enhanced Consumer Information, Report 2-215, November, 2005.

CEA/EC SARAC II Appendices
112
import cars separately with customer specific equipments. Furthermore, the true customer price of
extra equipment is quite high due to taxation (taxes are calculated according to the summarized price
of the car and its equipments) and therefore the cars are imported as better selling cheaper versions
with limited equipments. Hence, the level of car equipping depends strongly on actions of car
importers.
Study limitations
While this was a limited attempt to identify safety technology in new passenger cars, it illustrates what
could be done, given the availability of more extensive resources. As noted several times during this
study, it is difficult to identify what safety features are available in new makes and models without
access to more information. Dealer’s guides and vehicle specification manuals can provide much of
this information if they are available. In many instances, this requires establishing a library of vehicle
details, which, given that these are generally commercial materials often with restricted access, can be
problematic for an organisation outside the industry. Unfortunately, these materials were not available
for this study. Moreover, it would be valuable for input from the manufacturers or their dealers if this
pilot exercise were to be repeated.
Unfortunately, this study could only be conducted in Finland. The availability of safety features and
whether they are standard or optional varies across countries both within Europe and worldwide. It
would be useful, therefore, in any future research effort in this area, to expand the study across a
number of countries to demonstrate the range of differences of safety feature availability across
countries. This would illustrate the need for greater efforts on harmonisation of safety features in the
same vehicle sold in different countries to ensure that all populations are able to gain the same benefits
from vehicle safety improvement.