How Important Are Financing Constraints? - World...
47
1 How Important Are Financing Constraints? The role of finance in the business environment Meghana Ayyagari Asli Demirgüç-Kunt Vojislav Maksimovic* June 2008 Abstract: What role does the business environment play in promoting and restraining firm growth? Recent literature points to a number of factors as obstacles to growth. Inefficient functioning of financial markets, inadequate security and enforcement of property rights, poor provision of infrastructure, inefficient regulation and taxation, and broader governance features such as corruption and macroeconomic stability are all discussed without any comparative evidence on their ordering. In this paper, we use firm level survey data to present evidence on the relative importance of different features of the business environment. We find that although firms report many obstacles to growth, not all the obstacles are equally constraining. Some affect firm growth only indirectly through their influence on other obstacles, or not at all. Using Directed Acyclic Graph (DAG) methodology as well as regressions, we find that only obstacles related to Finance, Crime and Policy Instability directly affect the growth rate of firms. Robustness tests further show that the Finance result is the most robust of the three. These results have important policy implications for the priority of reform efforts. Our results show that maintaining policy stability, keeping crime under control, and undertaking financial sector reforms to relax financing constraints are likely to be the most effective routes to promote firm growth. Keywords: Financing Constraints, Firm Growth, Business Environment JEL Classification: D21, G30, O12 _______________________________ *Ayyagari: Assistant Professor, School of Business, George Washington University, [email protected] ; Demirgüç-Kunt, Senior Research Manager, Finance and Private Sector Development, Development Economics Research Group, World Bank, [email protected] ; Maksimovic: Dean's Chair Professor of Finance, Robert H. Smith School of Business at the University of Maryland, [email protected] . We would like to thank Gerard Caprio, Stijn Claessens, Patrick Honohan, Leora Klapper, Aart Kraay, Norman Loayza, David Mckenzie, Dani Rodrik, L. Alan Winters, Rajesh Chakrabarti and seminar participants at the World Bank’s Economist Forum, George Washington University, and Indian School of Business for their suggestions and comments. This paper’s findings, interpretations, and conclusions are entirely those of the authors and do not necessarily represent the views of the World Bank, its Executive Directors, or the countries they represent.
Transcript of How Important Are Financing Constraints? - World...
1
How Important Are Financing Constraints?
The role of finance in the business environment
Meghana Ayyagari Asli Demirgüç-Kunt Vojislav Maksimovic*
June 2008
Abstract: What role does the business environment play in promoting and restraining firm growth? Recent literature points to a number of factors as obstacles to growth. Inefficient functioning of financial markets, inadequate security and enforcement of property rights, poor provision of infrastructure, inefficient regulation and taxation, and broader governance features such as corruption and macroeconomic stability are all discussed without any comparative evidence on their ordering. In this paper, we use firm level survey data to present evidence on the relative importance of different features of the business environment. We find that although firms report many obstacles to growth, not all the obstacles are equally constraining. Some affect firm growth only indirectly through their influence on other obstacles, or not at all. Using Directed Acyclic Graph (DAG) methodology as well as regressions, we find that only obstacles related to Finance, Crime and Policy Instability directly affect the growth rate of firms. Robustness tests further show that the Finance result is the most robust of the three. These results have important policy implications for the priority of reform efforts. Our results show that maintaining policy stability, keeping crime under control, and undertaking financial sector reforms to relax financing constraints are likely to be the most effective routes to promote firm growth.
Keywords: Financing Constraints, Firm Growth, Business Environment
JEL Classification: D21, G30, O12
_______________________________
*Ayyagari: Assistant Professor, School of Business, George Washington University, [email protected] ; Demirgüç-Kunt, Senior Research Manager, Finance and Private Sector Development, Development Economics Research Group, World Bank, [email protected] ; Maksimovic: Dean's Chair Professor of Finance, Robert H. Smith School of Business at the University of Maryland, [email protected] . We would like to thank Gerard Caprio, Stijn Claessens, Patrick Honohan, Leora Klapper, Aart Kraay, Norman Loayza, David Mckenzie, Dani Rodrik, L. Alan Winters, Rajesh Chakrabarti and seminar participants at the World Bank’s Economist Forum, George Washington University, and Indian School of Business for their suggestions and comments. This paper’s findings, interpretations, and conclusions are entirely those of the authors and do not necessarily represent the views of the World Bank, its Executive Directors, or the countries they represent.

2
Understanding firm growth is at the heart of the development process, making it a much
researched area in finance and economics. More recently, the field has seen resurgence
in interest from policymakers and researchers, with a new focus on the broader business
environment in which firms operate. Researchers have documented through surveys that
firms report many features of their business environment as obstacles to their growth.
Firms report being affected by inadequate security and enforcement of property rights,
inefficient functioning of financial markets, poor provision of infrastructure services,
inefficient regulations and taxation, and broader governance features such as corruption
and macroeconomic instability. Many of these perceived obstacles are correlated with
low performance.
These findings can inform government policies that shape the opportunities and
incentives facing firms, by influencing their business environment. However, even if
firm performance is likely to benefit from improvements in all dimensions of the business
environment, addressing all of them at once would be challenging for any government.
Thus, understanding how these different obstacles interact and which ones influence firm
growth directly is important in prioritizing reform efforts. Further, since the relative
importance of obstacles may also vary according to the level of development of the
country and according to firm characteristics such as firm size, it is important to assess
whether the same obstacles affect all sub-populations of firms.
In this paper we examine which features of the business environment directly
affect firm growth. We use evidence from the World Business Environment Survey
(WBES), a major firm level survey conducted by the World Bank in 1999 and 2000 in 80
developed and developing countries around the world. We use this data to assess (i)

3
whether each feature of the business environment that firms report as an obstacle affects
their growth, (ii) the relative economic importance of the obstacles that do constrain firm
growth, (iii) whether an obstacle has a direct effect on firm growth or whether the
obstacle acts indirectly by reinforcing other obstacles which have a direct effect, and (iv)
whether these relationships vary by different levels of economic development and
different firm characteristics.
We define an obstacle to be binding if it has a significant impact on firm growth.
Our regression results indicate that out of a full set of ten different business environment
obstacles that firms report, only Finance, Crime, and Policy Instability emerge as the
binding constraints with a direct association with firm growth. In order to reduce
dimensionality of the different business environment factors in a systematic structured
approach, we use the Directed Acyclic Graph (DAG) methodology implemented by an
algorithm used in artificial intelligence and computer science (Sprites, Glymour, and
Scheines (2000)). The DAG algorithm also confirms Finance, Crime and Policy
Instability to be the binding constraints, with other obstacles having an indirect
association, if at all, on firm growth through the binding constraints.
In further robustness tests, we find that the finance result is the most robust, in
that the Finance obstacle is binding regardless of which countries and firms are included
in the sample. Regression analysis also shows that the Finance obstacle has the largest
direct effect on firm growth. These results are not due to influential observations, reverse
causality or perception biases likely to be found in survey responses. Policy Instability
and Crime, the other two binding constraints in the full sample, are driven by the
inclusion of African and Transition economies where, arguably, they might be the most

4
problematic. Instrumental variable regressions also show Finance to be the most robust
result.
We also find that the relative importance of different factors varies according to
firm characteristics. Larger firms are affected by the Finance obstacle to a significantly
lesser extent but being larger does not relax the obstacles related to Crime or Policy
Instability to the same extent.
Examining the Finance obstacle in more detail, we find that although firms
perceive many specific financing obstacles, such as lack of access to long-term capital
and collateral requirements, only the cost of borrowing is directly associated with firm
growth. However, we find that the cost of borrowing itself is affected by imperfections in
the financial markets. Thus we find that the firms that face high interest rates are the ones
that perceive banks they have access to, as being corrupt, under-funded, and requiring
excessive paperwork. We also find that difficulties with posting collateral and limited
access to long-term financing are also correlated with high interest rates. It is likely that
these latter obstacles are also aggravated by underdeveloped institutions.1
Several papers have specifically pointed to the importance of financing obstacles.
Using firm level data, Demirguc-Kunt and Maksimovic (1998) and others provide
evidence on the importance of the financial system and legal enforcement in relaxing
firm’s external financing constraints and facilitating their growth. Rajan and Zingales
(1998) show that industries that are dependent on external finance grow faster in
countries with better developed financial systems.2 Although these papers investigate
different obstacles to firm growth and their impact, they generally focus on a small subset
of broadly characterized obstacles faced by firms.

5
Our work is most closely related to Beck, Demirguc-Kunt, and Maksimovic
(2005) but differs significantly from that study in the question being asked, the execution,
and the findings. The focus of the Beck et al. study is to examine if the following three
obstacles selected on a priori grounds – finance, corruption, and legal obstacles – have an
effect on firm growth rates individually. Hence, the goal in that study is not to compare
the obstacles to identify the most binding constraint. This is crucial since we know from
our study that most obstacles when entered individually as in the Beck et al. paper are
significant in the growth regressions. Our paper also differs from the Beck et al study in
the methodology used since their paper does not incorporate country fixed effects (or the
DAG methodology) and has limited discussion of causality issues.
This paper on the other hand looks at the full set of business environment
obstacles - finance, corruption, infrastructure, taxes and regulations, judicial efficiency,
crime, anti-competitive practices, policy instability/uncertainty, inflation and exchange
rate - and finds finance, crime, and policy instability to be the most binding obstacles. We
also find the financial sector result to be the most robust of the three binding obstacles
and hence deserving of greater policy focus. Thus this paper has implications for the
priority of reform efforts while the other paper does not, which is crucial for governments
contemplating reform of their business environments.
A number of qualifications need to be emphasized. First, as common in the
literature, in our paper we take as given the existing population of firms in each country
and study the constraints they face. However, as also described by Hausman, Rodrik, and
Velasco (2004), it must be noted that in a more general setting the population of firms is
itself endogenous. For example, Beck, Demirguc-Kunt, and Makimovic (2006) show that

6
firm size distribution adapts to the business environment, and Demirguc-Kunt, Love, and
Maksimovic (2006) show that certain organizational forms are better adapted to specific
business environments. Nevertheless, the analysis in this paper can be seen as a way of
identifying and targeting the most binding constraints for existing firms, conditional on
having entered, but not necessarily identifying the constraints to entry. Second, this paper
examines cross-country firm-level regressions and therefore does not detail the
experience of any single country in depth. However we believe that having controlled for
country fixed effects, we have useful - albeit not definitive - information from the cross-
country set-up on the binding constraints to firm growth. Finally in the absence of panel
data and firm fixed effects, we have to recognize that potential reverse causality concerns
are endemic to the growth literature. We address these issues in detail using instrumental
variables in the robustness section of the paper.
The paper is organized as follows. The next section describes the methodology.
Section II discusses the data and summary statistics. Section III presents our main
results. Section IV presents the conclusions and policy implications.
I. Methodology: Identification of Binding Constraints
Numerous studies argue that differences in business environment can explain much of the
variation across countries in firms’ financial policies and performance. While much of
the early work relied on country-level indicators and firms’ financial reports, more recent
work has relied on surveys of firms which provide data on a wide range of potential
obstacles to growth.3

7
Given the large number of potential obstacles to growth that have been identified
in surveys, we face a number of difficulties in identifying the obstacles that are truly
constraining. First, a potential problem with using survey data is that enterprise
managers may identify several operational issues while not all of them may be
constraining. Therefore, we examine the extent to which reported obstacles affect growth
rates of firms. An obstacle is only considered to be a “constraint” or a “binding
constraint” if it has a significant impact on firm growth. Significant impact requires that
the coefficient of the obstacle in the firm growth regression be significant and that the
enterprise managers identified the factor as an obstacle.4
Second, to the extent that the characteristics of a firm’s business environment are
correlated, it is likely that many perceived business environment characteristics will be
correlated with realized firm growth. It is important to sort these into obstacles that
directly affect growth and obstacles that may be correlated with firm growth but affect it
only indirectly.
Since there is no theoretical basis for classifying the obstacles, we must proceed
empirically. To reduce dimensionality in a more structured way, we use the Directed
Acyclic Graph (DAG) methodology. The DAG algorithm begins with a set of potentially
related variables and uses the conditional correlations between them to rule out possible
relations among these variables. The final output of the algorithm is a pattern of graphs
listing potential relations between the variables that have not been ruled out and shows (i)
variables that have direct effects on the dependent variable or other variables, (ii)
variables that only have indirect effects on the dependent variable through other
variables, and (iii) variables that lack a consistent statistical relation with the other
8
variables. If DAG identifies a particular obstacle as having a direct effect on firm growth,
that obstacle would also have a significant coefficient in all OLS regressions regardless
of which subset of other obstacles are entered as control variables in the regression
equation. Ayyagari, Demirguc-Kunt, and Maksimovic (2005) further illustrate the use of
this methodology.5
We also use regression analysis to do further robustness tests, such as testing for
possible endogeneity bias via instrumental variable methods. We also perform other
robustness tests, controlling for additional variables at the firm and country level, growth
opportunities, influential observations and potential perception biases in survey responses
using regression analysis.
The obstacles a firm faces depend on the institutions in each country, but are not
likely to be the same for each firm in each country. Thus, our unit of analysis is the firm.
As described below, the regressions have country-level fixed effects.
II. Data and Summary Statistics
The main purpose of the WBES survey is to identify obstacles to firm performance and
growth around the world. Thus, the survey contains a large number of questions on the
nature and severity of different obstacles. Specifically, firms are asked to rate the extent
to which Finance, Corruption, Infrastructure, Taxes and Regulations, Judicial Efficiency,
Crime, Anti-Competitive Practices, Policy Instability/Uncertainty, and macro issues such
as Inflation and Exchange Rate constitute obstacles to their growth.6
In addition to the detail on the obstacles, one of the greatest values of this survey
is its wide coverage of smaller firms. The survey is size-stratified, with 40 percent of

9
observations on small firms (defined as employing 5-50 employees), 40 percent on
medium-sized firms (51-500 employees), and the remainder from large firms (>500
employees).
Insert Table 1 here
The firm level obstacles are reported in Table 1. The WBES asked enterprise
managers to rate the extent to which each factor presented an obstacle to the operation
and growth of their business. A rating of one denotes no obstacle; two, a minor obstacle;
three, a moderate obstacle; and four, a major obstacle. Panel A of Table 1 shows that
firms in high income countries tend to face lower obstacles in all areas. Panel B
highlights regional differences: When it comes to Corruption and Infrastructure, African
firms report the highest obstacles; Latin American Crime and Judicial Efficiency
obstacles are the highest in the sample; and Financing obstacles in Asian countries are
lowest in the sample of developing countries. Finally, from Panel C we see that smaller
firms face higher obstacles than larger firms in all areas, except in those related to
Judicial Efficiency and Infrastructure, where the ranking is reversed.
As a measure of firm performance we use firm sales growth over the past three
years. We prefer to use growth as a measure of performance rather than productivity
because the productivity measures are noisier and available for a much smaller sample of
firms. We do not have information on other performance measures such as profits. In the
Appendix Table A.1 we report firm growth and the different obstacles that firms report,
averaged over all firms in each country. Firm Growth is the sales growth rate for
individual firms averaged over all sampled firms in each country. Average firm growth
across countries shows a wide dispersion, from negative rates of 20 percent for Armenia

10
and Azerbaijan to 64 percent for Malawi and Uzbekistan. Looking at average obstacles
across countries we see that firms report Taxes and Regulations to be their greatest
obstacle. Inflation, Policy Instability and Financing obstacles are also reported to be
highly constraining. By contrast, factors associated with Judicial Efficiency and
Infrastructure are ranked as the lowest obstacles faced by entrepreneurs.
The correlations among the obstacles reported by firms are significant but fairly
low, with few above 0.5 (correlation matrix not shown). As expected, the two macro
obstacles, Inflation and Exchange Rate, are highly correlated at 0.58. The correlations of
Corruption with Crime and Judicial Efficiency are also relatively high at 0.55 each,
indicating that in environments where corruption and crime are wide-spread, judicial
efficiency is adversely affected. It is also interesting that the correlation between the
Financing obstacle and all other obstacles is among the lowest, indicating that the
Financing obstacle may capture different effects than those captured by other reported
obstacles. All obstacles are negatively and significantly correlated with firm growth.
We explore these relations further in the next section.
III. Firm Growth and Reported Obstacles
In this section we explore the link between the various obstacles that firms report and
firm growth rates using country fixed effect regressions and DAG analysis. We find that
finance, crime, and policy instability are most significantly associated with firm growth
suggesting that these are the binding constraints. We find our results robust to a number
of checks including variation across different firm sizes and income levels of the
countries, endogeneity concerns, removal of outliers and perception biases. We also find

11
that of the individual financing obstacles, high interest rates are most significantly
associated with firm growth. The results are discussed in detail below.
Obtaining the Binding Constraints
In Table 2 we regress firm growth rates on the different obstacles they report. All
regressions are estimated with firm-level data using country-level fixed effects.7 The
standard errors are adjusted for clustering at the country level. Specifically, the regression
equations we estimate take the form:
Firm Growth = α + β1 Obstacle + β2 Firm Size + Country Fixed Effects + ε (1)
To test the hypothesis that a reported obstacle is a binding constraint, that is, it has
a significant impact on firm growth, we test whether β1 is significantly different from
zero. Significant impact also requires that the obstacle has a value higher than one, which
is true for all obstacles.
Insert Table 2 here
The results in Table 2 show that when we analyze individual obstacles separately,
most are significantly related to firm growth. The only exceptions are Corruption,
Exchange Rate, Anti-Competitive behavior, and Infrastructure obstacles which are not
significantly related to firm growth. The regressions explain up to 7.4 percent of the
variation in firm growth across countries. The coefficients of the significant obstacles
range from 0.021 for the Judicial Efficiency obstacle to 0.032 for the Finance Obstacle.
Thus, firms that say financing is a minor obstacle grow 3.2% slower than those that say
finance is not an obstacle or firms that say that finance is a moderate (major) obstacle
grow 3.2% slower than those that say finance is a minor (moderate) obstacle.
12
Alternatively, in terms of standard deviation, a one standard deviation increase in the
financing obstacle decreases firm growth rate by 3.6%.
In column 11, we include all the significant obstacles in the regression equation.
In this specification, only Finance, Policy Instability and Crime obstacles have a
significant constraining effect on growth. Dropping the remaining obstacles from the
regression (which are jointly insignificant as well) as in specification 12 shows only
Finance and Crime as having a constraining effect on growth. The economic impact of
the Finance obstacle is higher than that of Crime but the difference is not statistically
significant.
It is also possible to do such impact evaluation at the regional level, at the country
level or even at the firm level, instead of the sample mean we have used above. Looking
at the mean obstacles for individual countries reported in the Appendix Table A.1, it is
clear that the binding obstacles are not equally important in every country. For example,
in Singapore, where the mean value of the binding obstacles are all closer to one, the
economic impact of the obstacles is much smaller compared to their impact in a country
such as Nigeria, where the mean value of all three obstacles are over three, indicating
severe constraints. Thus, it is possible to use these cross-country results to do growth
diagnostics at the country level as discussed in Hausmann et al. (2004). Going further
down, there may also be some firms in Nigeria for which the constraints are not binding
(depending on the value of the obstacles they report) and others in Singapore for which
they are. In fact, average values of obstacles by firm size as shown in Table 1 suggests
that the three obstacles will always be more binding for smaller firms compared to larger
firms.
13
Overall, these results suggest that the three obstacles- Finance, Crime and Policy
Instability – are the only true constraints, in that they are the only obstacles that affect
firm growth directly at the margin. The other obstacles may also affect firm growth
through their impact on each other and on the three binding constraints; however they
have no direct effect on firm growth.
Have we identified the key constraints? - Robustness Checks
We use the DAG methodology to check the robustness of our regression findings since
DAG is useful in simplifying the set of independent variables in a systematic way as
described in Ayyagari, Demirguc-Kunt, and Maksimovic (2005).
The DAG analysis is implemented by the software program TETRAD III
(Scheines, et al 1994). In keeping with common practice, we impose the following
assumptions that are regularly used in the regression setting - the business environment
obstacles cause firm growth, not the other way around, and the model contains all
common causes of the variables in the model. To be consistent with the fixed effects
specification in Table 2, we use demeaned values of the business environment obstacles
where the country average of each obstacle is subtracted from the corresponding obstacle.
Figure 1 illustrates the application of this algorithm to our full sample. The input
to the algorithm is the correlation matrix between firm growth and the ten demeaned
business environment obstacles from the sample of 4197 firms. 8
Insert Figure 1 here
Figure 1 shows that the only business environment obstacles that have a direct
effect on firm growth are Financing, Crime and Policy Instability. Financing in turn is
directly affected by the Taxes and Regulation obstacle which includes factors such as
14
taxes and tax administration, as well as regulations in the areas of business licensing,
labor, foreign exchange, environment, fire and safety. Crime is directly affected by the
Corruption obstacle and Policy Instability is affected by Corruption, Infrastructure, and
Anticompetitive behavior9. The dashed double-headed arrows between Policy Instability
and the following variables – Crime, Inflation, Taxes and Regulation, and Judicial
Efficiency – indicate that the direction of orientation between Policy Instability and these
variables changes between patterns.
The output also shows that relations between the obstacles themselves is quite
complex and there are multiple relations in the DAG between the various business
environment obstacles.10 Since the main focus of this paper is to determine the business
environment obstacles that have a direct effect on growth, we do not dwell on the
interactions between the different variables and leave it for future work. Hence, rather
than start at the bottom and focus on the farthest variable, which is likely to have a very
diluted impact on firm growth, we start at the top of the agenda and focus on the variables
with direct effects which are likely to have the biggest impact on growth. Most
importantly, the DAG analysis also identifies only Financing, Crime and Policy Stability
as having direct effects on firm growth, as suggested by specification 11 of Table 2. As
discussed in Section II, the analysis identifies direct effects after conditioning on all
subsets of the other variables. This suggests that in regression analysis, Financing, Crime
and Policy Instability will always have significant coefficients irrespective of the subsets
of other obstacles included in the regression. Thus, these are binding constraints, and
policies that relax these constraints can be expected to directly increase firm growth.

15
Binding Constraints and Firm Size and Level of Development
Next we explore if these relationships are different for firms of different sizes and at
different levels of development. The first three columns of Table 3 include specifications
that interact the three obstacles with firm size, given by the Logarithm of sales. The
interaction term with the Financing obstacle is positive and significant at one percent,
suggesting that larger firms are less financially constrained, confirming the findings of
Beck, Demirguc-Kunt, and Maksimovic (2005). The interaction terms with Policy
Instability and Crime are also positive but not significant. When we enter all the
interactions together in specification (4), only the interaction term with the Financing
obstacle is significant. Thus, although there is also some indication that large firms are
also affected less by Crime and Policy Instability, this evidence is much weaker.
Insert Table 3 here
We also interact the three obstacles with the following country income dummies
- Upper Middle Income, Lower Middle Income and Low Income. The excluded category
is High Income. The results indicate that all three obstacles tend to be more constraining
for middle income countries. This finding suggests that middle income countries having
overcome country-specific institutional obstacles are now more constrained by a common
set of obstacles pertaining to finance, crime, and policy instability. This is consistent with
Gelb et al. (2007) who find that the extent to which firms complain on different obstacles
differs according to the income level of the countries. The F-tests for the hypotheses that
all the entered interactions are jointly equal to zero, are rejected at the one percent level
of significance for Crime and Policy Instability obstacles but not for the Financing

16
obstacle. This suggests that firms in countries in all income groups are similarly affected
by the Financing obstacle.
Checking for Reverse Causality
So far we have identified Financing, Crime, and Policy Instability as first order
constraints, significantly affecting firm growth. However, the relations we observe may
also be due to reverse causality. This is most likely to bias the Financing obstacle result
since it is easy to imagine that entrepreneurs might complain about restricted access to
external finance even in cases where access is restricted due to their own deficiencies. In
the case of the Crime and Policy Instability obstacles, for reverse causality to be an issue
it would have to be the case that inefficient slow growing firms blame the environment
for their performance, in particular, the crime and policy instability. It is interesting
however that only Financing, Crime, and Policy Instability consistently emerge as the
first order constraints with the strongest association with firm growth. While reverse
causality is potentially a concern it doesn’t explain why poorly performing firms
systematically complain most about Financing, Crime, and Policy Instability and not
about the other obstacles. While there might be a causal relation between poor
performance and availability of financing, which we examine using instrumental
variables below, it is harder to posit a causal relation between poor performance and
crime and policy instability.
As a check for reverse causality for the Street Crime and Policy Instability
obstacles, we adopt the approach in Carlin, Schaffer, and Seabright (2005) who
recommend checking for causality by comparing the coefficients of the fixed effects
within estimator and the between estimator and test for sign changes. They argue that

17
since reverse causality is more likely to be significant at the firm-level, it will cause the
within estimator and the between estimator to change signs. 11 When we run the fixed
effects model using the within regression estimator on our data, we find the obstacle
coefficients to be negative when entered individually. None of the coefficients are
perversely positive that might have suggested reverse causality. The between effects
estimator also shows the obstacle coefficients to be negative.
Furthermore, as seen in Table 1, some factors such as Taxes & Regulation are
rated very highly compared to other obstacles by firms but do not appear as binding
constraints where as Street Crime which is not rated very highly (except in the case of
Latin America) still emerges as one of the binding constraints. This suggests that firms
may complain about many factors when surveyed but we need to control for country
differences and firm heterogeneity to identify which obstacles have the largest
association with firm growth.
To assess the robustness of our results, we use instrumental variable (IV)
regressions (limited information maximum likelihood (LIML) estimators) to extract the
exogenous component of the three obstacles. We use two sets of instruments for
Financing, Crime, and Policy Instability. First, we use the average value of the obstacles
for the industry groups in each country. While it is likely that individual firms may
blame the different obstacles for their poor performance, it is less likely for all firms in a
given country industry group to engage in such blame shifting. By instrumenting the
obstacles with the average obstacle for each industry group in the country, we are
isolating the exogenous part of the possibly endogenous obstacle the firm reports, and
using that to predict growth. When we consider the obstacles at the country-industry level

18
of aggregation, the causality is likely to run from the average obstacles to individual
firms, not vice versa. In addition, country-industry averages also helps us deal with
potential measurement errors that are largely idiosyncratic to the firm and hence
uncorrelated with average values of the obstacles. It may be noted that use of group
averages as instruments is a common technique as used in Fisman and Svensson (2007)
and described in Krueger and Angrist (2001). Second, we use firm responses to the
survey question “Does your firm use international accounting standards?” A firm’s
adoption of international accounting standards is likely to influence its business
environment constraints, in particular the financing constraint, but is not necessarily
linked to firm growth rates independently.
Insert Table 4 here
We also do the analysis at the country level averaging the obstacle variables and
firm growth rates across countries. Since we are performing the analysis at the country
level, we control for Log GDP/capita and do not control for any of the firm level
variables. As instruments for Financing and Policy Instability obstacles we use the
country’s Common Law dummy that takes the value 1 if the country follows Common
Law tradition and three religion variables, Protestant, Muslim, and Catholic that each
represent the percentage of population that is Protestant, Muslim or Catholic respectively
in each country. As an instrument for Street Crime, we use Common Law dummy and the
Latitude of a country’s capital city. A huge literature has identified the above institutional
variables to be a good instrument for institutional development and hence they are not
used as explanatory variables in the short term growth regressions in the second stage.
19
When we use country-industry averages of the obstacles as instruments (columns
(1)-(3) in Panel A of Table 4) only the financing obstacle is negative and significant. The
first stage F-statistic is large indicating that the country-industry average of the financing
obstacle is a good instrument.12 While the country-industry averages pass the test of
instruments for policy instability and street crime, instrumenting these obstacles renders
them insignificant in the regression. In addition, when we instrument all the three
obstacles at once, as in column 4, we again find Financing to be the only significant
constraint. This reinforces our finding that Financing is the most robust constraint of the
three binding constraints.
When we use firms’ adoption of international accounting standards as an
instrument, we find that all three obstacles have a significant negative impact on firm
growth. While the first stage F-statistics are significant in each case, it is greater than 10
only for the Financing and Crime obstacles (Stock and Watson (2003) rule of thumb for
good instruments). However, the Anderson Rubin Wald Test which is the preferred test
for robust inference in the weak instrument case is rejected in all three cases suggesting
that all three obstacles are individually important in affecting firm growth. We do not
report overidentification tests since the equation is just identified in each case in panel A.
Panel B presents cross-country regressions using historical institutional variables
as instruments. Standard errors reported are robust standard errors. We find that all three
obstacle variables are negative and significantly associated with firm growth. When we
look at the various tests of instruments, while the first stage F-tests are significant at least
at the 5% level in each case, the F-statistic is less than ten suggesting that the instruments
may be weak. Hence we rely on the tests for robust inference under weak identification.

20
The Anderson Rubin Wald test of the null hypothesis that the obstacle coefficient is zero
is rejected in all cases. In addition we also compute confidence intervals for these
coefficients. Following Moreira and Poi (2001) and Mikusheva and Poi (2001) we obtain
critical values of the likelihood ratio tests that yield correct rejection probabilities even
when the instruments are weak. The confidence region and p-value for the coefficient on
the obstacle variable based on the conditional likelihood show that the estimated
coefficients belong to the confidence region. The underidentification test (Kleibergen-
Paap rk Wald statistic) is rejected in each case indicating that the equation is identified
and instruments pass the test of instrument relevance. The Hansen J statistic of
overidentification is never rejected suggesting that the instruments used are valid
instruments. In unreported results we control for a number of other country-level
variables including growth rates, inflation, property rights protection, level of financial
development and level of institutional development and find our results unchanged.
Overall, using different sets of instruments at the firm level and country level our
results suggest that there are exogenous components of Financing, Crime and Policy
Instability obstacles that predict firm growth and the results we obtain are not due to
reverse causality. The IV estimations also show that finance is once again the most robust
of the binding obstacles. It must be noted however that it is very difficult to find perfect
instruments at the level of the firm in cross-country regressions and hence some caveats
regarding the instruments are in order. The country-industry averages of the instruments
could potentially be correlated with the error term so we could have systematic
differences in growth rates and firm complaints across country-industry groups that raises
reverse causality concerns. Regarding the use of international accounting standards as an

21
instrument, in the absence of panel data we are unable to use firm fixed effects and hence
there is always the risk that a firm’s adoption of accounting standards might be correlated
with unobservables that affect firm growth. Finally, while the instruments in the country-
averages regressions can be considered to be exogenous since we are using historical
institutional variables, there is the possibility of omitted variable bias in the absence of
country fixed effects.
Other Robustness
In this section, we describe several robustness checks of our main findings. First we
investigate whether our results are driven by a few countries or firms. In particular, we
investigate two sets of countries: African and Transition economies. Chandra et al. (2001)
suggest that firms in African countries may exhibit different responses than the other
firms in the sample. A report by the United States General Accounting Office, GAO-04-
506 (2004) analyzes several firm level surveys on Africa, including the WBES, and
concludes that perceptions of corruption levels vary greatly for African countries, proving
a challenge for broad-based US Anticorruption Programs. Ayyagari, Demirguc-Kunt, and
Maksimovic (2008) argue that Transition economies are fundamentally different from
other countries in their perceptions of protection of property rights.
Insert Table 5 here
In the first four columns of Table 5 we run our preferred specification on different
samples eliminating Transition and African countries. We find that while Financing and
Crime are binding constraints as before, Policy Instability loses significance if we do not
include these countries in the sample. These results suggest that the type of Policy

22
Instability present in Transition and African economies is particularly damaging to firm
expansion.
We also noted that high inflation rates may be responsible for the very high firm
growth rates we observe in some countries, particularly in Uzbekistan, Estonia and
Bosnia-Herzegovina. However, constructing real firm growth rates and replicating all the
analyses in this paper does not change the main results.
To check whether our results are driven by specific outlier firms, we eliminate
firms with very high growth rates (>100%). Firms reporting growth rates in excess of
100%, are typically from the Transition and African countries and it is conceivable that
these firms achieve high growth rates because of political connections and are not
impacted by general business environment obstacles. Thus, the experience of these firms
may differ from that of the typical firm. We find that Financing remains the most binding
constraint to firm growth in our reduced sample, confirming that our results are not
driven by the fastest growing firms in the sample. The impact of Crime on firm growth is
less robust to eliminating high growth rate firms, however.
It is also possible that young firms in the sample are affected differently by
business environment obstacles. Excluding all firms younger than five years old from the
sample (results not reported) leaves the Financing result unchanged, while Crime and
Policy Instability are not significant in the regressions. This suggests that policy stability
and controlling crime are particularly important to ensure growth of younger firms.
Financing is still the main binding constraint to growth when we use robust regression
analysis or quantile regressions to control for the presence of possible influential outliers.

23
Below we report several other robustness checks of our main findings. The tables
are available on request. First, in unreported regressions we separate out the variation at
the firm level and variation at the country level. That is, we incorporate both the
individual firm level effect of the obstacle (i.e. the demeaned value of the obstacle which
is Obstacle minus the Country average of the obstacle) and the cross-country effect (i.e.
the country average of the obstacle). We find that in the full specification including the
firm level and country level effects of all the ten business environment obstacles, the only
individual firm level obstacles that are binding constraints to growth are Financing,
Policy Instability and Crime.
We next perform various tests to detect outliers and influential points. We
compute DFBETA statistics for each of the obstacle variables. The DFBETAs for
regressor i measures the distance that this regression coefficient shifts when the j-th
observation is included/excluded from the regression scaled by the estimated standard
errors of the coefficient. None of the obstacles in our regressions have |DFBETA| >1 or
even the stricter cutoff of |DFBETA|>2sqrt(N) as suggested by Besley, Kuh, and Welsch
(1980). This implies that our results are not driven by influential observations. Financing
and Crime have a significant negative effect on firm growth while Policy Instability is
insignificant.13
We then control for growth opportunities using average industry growth or firm
level dependence on external finance. The observed association between obstacles and
firm growth might occur because firms that face higher obstacles are also those that face
limited growth opportunities. Our results remain unchanged using either measure of
growth opportunities. Financing, Policy Instability and Street Crime come in significant

24
when entered individually and when entered together, only Financing and Street Crime
are significant.
In unreported regressions, we also investigated whether firm ownership drives our
results. The sample includes 203 firms with government ownership. Excluding these
firms leaves the Financing and Crime results unchanged. The sample also includes 1340
firms with over 50 percent foreign ownership. Excluding these foreign firms from the
analysis leaves only the Financing obstacle significant. This suggests that foreign owned
firms are particularly sensitive to Policy Instability and Crime. Including dummy
variables to control for government and foreign firms also leads to similar results in that
only Financing and Crime are significant.
Finally, we check if our results are robust subject to controlling for perception
biases. Following Kaufmann and Wei (1999), we construct two kvetch variables,
Kvetch1 and Kvetch2, which are deviations of each firm’s response from the mean
country response to two general survey questions. Kvetch1 uses the responses to the
question “How helpful do you find the central government today towards businesses like
yours?” and Kvetch2 is constructed using the responses to “How predictable are changes
in economic and financial policies?” Since higher values correspond to unfavorable
responses, positive deviations from the country mean indicate pessimism whereas
negative deviations indicate optimism. Controlling for differences in perceptions using
the kvetch variables leaves only Financing and Crime results unchanged. Policy
Instability remains insignificant.

25
Individual Financing Obstacles
Our results indicate that Financing is one of the most important obstacles that directly
constrain firm growth. We would like to get a better understanding of exactly what type
of obstacles related to financing are constraining firm growth. Fortunately, our survey
data also includes more detailed questions regarding the Financing obstacles.
To get at specific issues, the entrepreneurs were asked to rate the extent to which
the following financing factors represent an obstacle to their growth: (i) collateral
requirements of banks and financial institutions, (ii) bank paperwork and bureaucracy,
(iii) high interest rates, (iv) need for special connections with banks and financial
institutions, (v) banks lacking money to lend, (vi) access to foreign banks, (vii) access to
non-bank equity, (viii) access to export finance, (ix) access to financing for leasing
equipment, (x) inadequate credit and financial information on customers, and (xi) access
to long-term loans. The ratings are again on a scale of one to four, increasing in the
severity of obstacles.
Insert Table 6 here
Table 6 reports the regressions that parallel those in Table 2, but this time
focusing on specific financing obstacles. In addition to the individual financing
obstacles, we also include a residual, the component of the general financing obstacle not
explained by the individual obstacles. The results indicate that not all financing obstacles
reported by firms are constraining. Only the coefficients of collateral, paperwork, high
interest rates, special connections, banks’ lack of money to lend, lease finance and the
residual are significant when entered individually. In terms of economic impact high
interest rates has the highest impact – a one standard deviation increase in the obstacle
26
results in a decrease in firm growth by 3.3 percent. Unlike the different obstacles we
examined above, specific financing obstacles are highly correlated with each other. In
specification 13 we include all obstacles that are significant when entered individually,
and find that only the high interest rates coefficient is significant, although only at the
10% level. If we also include the residual as in specification 14, only the residual
remains significant. The residual is likely to summarize how different firms are affected
differently by the structure and ownership of the financial system, the level of
competition and other factors which are not fully captured by the specific financial
obstacles thus proxying for general access to credit.14
When we look at the correlations among obstacles using DAG analysis (not
shown), we find that high interest rates is the only financial obstacle directly constraining
firm growth. It may be noted that while we restrict the direction of causation to be from
the various financing obstacles to growth, we impose no ordering amongst the individual
financing obstacles themselves. The finding that high interest rates constrains firm
growth is not surprising since the high interest rate obstacle captures the cost of financing
and is itself an endogenous variable that depends on the ability of the financial system to
satisfy the demand for capital. It can be expected to constrain all firms in all countries.
Collectively, specific financing obstacles still do not capture everything measured by the
general financing obstacle, as illustrated by the effect of the residual. This also suggests
that the general access to credit is an important constraint for firms.
The DAG analysis also suggests that perceptions of high collateral requirements
of banks and financial institutions and paperwork influence the perceptions of high
interest rates. High interest rates also influence perceptions of lack of access to lease

27
finance, banks lacking money to lend, as well as the need for special connections in
banking. In unreported results we also ran regressions of the high interest rate obstacle
on individual financing obstacles. Specific financing obstacles are all individually
correlated with high interest rates. When we consider all financing obstacles together,
only collateral, paperwork, special connections, lack of money to lend, and access to long
term loans are correlated with high interest rates, as in the DAG analysis.
IV. Conclusions and Policy Implications We use firm level survey data for 80 countries to investigate which features of the
business environment are the most constraining for firm growth. Specifically, we
examine factors such as taxes and regulations, judicial efficiency, infrastructure
weaknesses, and financing issues that have attracted significant attention in the literature.
Although firms report many obstacles to their growth, not all of them are equally
constraining – in that they either affect firm growth only indirectly through their
influence on other factors, or not at all. Using regressions as well as Directed Acyclic
Graph (DAG) methodology, we find that only Finance, Crime and Policy Instability are
binding constraints, which have a direct association with the growth rate of firms. Thus,
while other obstacles we study in this paper are also associated with firm growth, through
their impact on each other and on direct obstacles, maintaining policy stability, keeping
crime under control, and undertaking financial sector reforms to relax financing
constraints are likely to be the most effective routes to promote firm growth. We also find
that the Financing obstacle’s impact on growth is robust to varying samples of countries
while the Policy Instability and Crime results are less robust to the exclusion of

28
Transition and African countries where they might be the most problematic for business
growth. We subject our results to a battery of robustness tests including changes in
sample, controlling for reverse causality, growth opportunities and potential perception
biases in survey responses. We find the financing obstacle to be the most robust to all
these tests. This is further confirmed through instrumental variable regressions. This
suggests that financial sector reform should be a priority for governments contemplating
reform of their business environments.15
Further investigation of the Financing obstacles reveals the importance of high
interest rates in constraining firm growth. This result highlights the importance of
macroeconomic policies in influencing growth at the firm level as indicated by the
correlation between high interest rates and banks’ lack of money to lend. Furthermore,
high interest rates are also correlated with high collateral and paperwork requirements,
the need for special connections with banks and unavailability of long term loans. These
results suggest that bureaucracy and corruption in banking, greater collateral
requirements and lack of long term loans are common in high interest rate environments.
In addition to the cost of financing, we also find that general access to credit is an
important constraint to firm growth. We leave further investigation of country and firm
level determinants of financing obstacles to future work.

29
App
endi
x T
able
A.1
: G
ener
al O
bsta
cles
G
ener
al O
bsta
cles
Nat
ion
Firm
G
row
th
Num
ber
of f
irm
s Fi
nanc
ing
Po
licy
Inst
abili
ty
Infl
atio
n E
xcha
nge
Rat
e Ju
dici
al
Eff
icie
ncy
Stre
et
Cri
me
Cor
rupt
ion
Tax
es a
nd
Reg
ulat
ion
Ant
i-co
mpe
titiv
e B
ehav
ior
Infr
astr
uctu
re
Alb
ania
0.
22
103
3.04
3.
48
2.75
2.
61
2.69
3.
42
3.34
3.
15
2.72
3
Arg
enti
na
0.08
82
3.
01
3.07
1.
77
1.73
2.
27
2.39
2.
58
3.34
2.
41
1.93
Arm
enia
-0
.2
96
2.45
2.
87
2.73
2.
69
1.5
1.85
1.
96
3.39
1.
9 1.
77
Aze
rbai
jan
-0.2
70
3.
11
2.55
2.
9 2.
61
2.59
2.
39
3 3.
17
2.96
2.
43
Ban
glad
esh
0.13
34
2.
6 3.
08
2.86
3.
09
2.38
3.
07
3.61
3.
03
2.4
Bel
arus
0.
1 97
3.
33
2.95
3.
63
3.16
1.
55
2.17
1.
88
3.34
1.
99
1.7
Bel
ize
0.12
26
2.
81
2.38
2.
04
1.73
1.
56
2.12
1.
96
2.77
1.
96
2.19
Bol
ivia
0.
04
80
3.03
3.
1 2.
58
2.46
2.
78
2.76
3.
56
3.15
2.
71
2.63
Bos
nia
& H
erze
govi
na
0.63
76
3.
09
3.19
1.
33
1.25
2.
54
1.86
2.
56
3.16
2.
58
2.65
Bot
swan
a 0.
32
72
2.24
1.
55
1.93
1.
33
1.
88
1.65
1.
89
2.
16
Bra
zil
0.03
14
8 2.
67
3.53
2.
8 2.
94
2.56
2.
83
2.53
3.
66
2.49
2.
18
Bul
gari
a 0.
15
101
3.16
3.
03
2.76
2.
37
2.26
2.
64
2.64
3.
1 2.
34
2.23
Cam
bodi
a 0.
07
298
2.04
2.
9 2.
61
2.32
2
3.29
2.23
2.
21
2.33
Cam
eroo
n 0.
12
44
3.14
2.
03
2.03
2.
28
2.
94
3.36
2.
7
3.44
Can
ada
0.17
74
2.
1 2.
18
2.15
2.
16
1.47
1.
32
1.4
2.59
1.
62
1.41
Chi
le
0.09
81
2.
36
2.58
2.
16
2.59
1.
97
2.4
1.86
2.
36
1.91
1.
86
Chi
na
0.05
70
3.
36
2.1
2.23
1.
83
1.5
1.83
1.
94
2.03
2.
13
1.89
Col
ombi
a 0.
06
83
2.67
3.
49
3.01
3.
34
2.4
3.37
2.
87
3.17
2.
33
2.46
Cos
ta R
ica
0.25
81
2.
62
2.67
2.
93
2.75
2.
2 2.
89
2.52
2.
8 2.
44
2.63
Cot
e d'
Ivoi
re
0.05
47
2.
78
2.85
2.
37
1.97
3.29
3.
24
2.49
2.29
Cro
atia
0.
1 97
3.
26
3.11
2.
47
2.86
2.
74
2.09
2.
59
3.34
2.
04
1.94
Cze
ch R
epub
lic
0.1
80
3.18
2.
95
3 2.
46
2.18
2.
09
2.1
3.44
2.
16
2.5
Dom
inic
an R
epub
lic
0.21
95
2.
63
3.02
2.
85
2.88
2.
43
3.22
3
3.96
2.
75
2.63
Ecu
ador
-0
.06
74
3.27
3.
6 3.
76
3.78
3.
04
3.49
3.
53
3.07
2.
55
2.67
Egy
pt, A
rab
Rep
. 0.
16
44
2.91
3.
14
2.68
2.
9
2.24
3.
14
3.43
3.23
El S
alva
dor
-0.0
2 73
2.
93
2.97
3.
16
2.55
2.
65
3.67
3.
06
2.93
2.
36
2.52
Est
onia
0.
63
109
2.47
2.
62
2.41
1.
89
1.72
2.
09
1.88
2.
67
1.85
1.
64
Eth
iopi
a 0.
26
70
3.02
2.
38
2.26
2.
47
1.
51
2.46
2.
33
3.
04

30
G
ener
al O
bsta
cles
Nat
ion
Firm
G
row
th
Num
ber
of f
irm
s Fi
nanc
ing
Po
licy
Inst
abili
ty
Infl
atio
n E
xcha
nge
Rat
e Ju
dici
al
Eff
icie
ncy
Stre
et
Cri
me
Cor
rupt
ion
Tax
es a
nd
Reg
ulat
ion
Ant
i-co
mpe
titiv
e B
ehav
ior
Infr
astr
uctu
re
Fran
ce
0.2
62
2.61
2.
2 2.
03
1.82
1.
79
1.77
1.
62
3.13
2.
02
1.81
Geo
rgia
0.
14
78
3.29
2.
84
3.29
2.
94
1.86
2.
32
3.04
3.
22
2.18
2.
14
Ger
man
y 0.
11
60
2.59
1.
63
1.87
1.
64
2.12
1.
56
1.88
3.
17
2.3
1.71
Gha
na
0.19
58
3.
1 2.
37
3.43
2.
58
2.
37
2.78
2.
83
2.
74
Gua
tem
ala
0.18
84
2.
99
3.16
3.
32
3.6
2.5
3.22
2.
7 2.
75
2.28
2.
52
Hai
ti 0
62
3.28
3.
18
2.92
2.
9 2.
35
3.81
3.
08
2.73
3.
1 3.
89
Hon
dura
s 0.
1 65
2.
97
2.53
3.
41
3.3
2.41
3.
23
2.9
2.83
2.
79
2.56
Hun
gary
0.
28
98
2.6
2.61
2.
59
1.6
1.32
1.
76
1.95
3.
01
2.14
1.
53
Indi
a 0.
15
152
2.59
2.
81
2.77
2.
42
2.02
1.
98
2.8
2.43
2.8
Indo
nesi
a -0
.05
70
2.83
3.
14
3.21
3.
4 2.
26
2.69
2.
69
2.59
2.
96
2.37
Ital
y 0.
16
64
1.97
2.
97
2.23
1.
83
2.22
2.
22
1.76
3.
25
2.19
2.
24
Kaz
akhs
tan
0.1
89
3.29
2.
88
3.62
3.
48
2.08
2.
6 2.
7 3.
37
2.55
2.
1
Ken
ya
0.03
70
2.
76
3.03
2.
8 1.
75
3.
27
3.56
2.
53
3.
64
Kyr
gyz
Rep
ublic
0
68
3.47
3.
23
3.78
3.
48
2.13
3.
26
3.19
3.
59
3 1.
98
Lit
huan
ia
0.08
68
3.
03
2.27
2.
3 1.
91
2.25
2.
52
2.44
3.
26
2.31
1.
82
Mad
agas
car
0.16
67
3.
08
2.67
3.
32
2.3
2.
79
3.44
2.
75
3.
03
Mal
awi
0.64
30
2.
81
2.2
3.56
2.
54
3.
08
2.65
2.
37
3.
76
Mal
aysi
a 0.
01
37
2.57
2.
14
2.44
1.
94
1.63
1.
78
2 2.
03
1.91
1.
92
Mex
ico
0.24
71
3.
24
3.27
3.
48
3.13
2.
77
3.37
3.
31
3.21
2.
75
2.23
Mol
dova
-0
.15
84
3.42
3.
6 3.
86
3.51
2.
51
3.11
2.
93
3.58
2.
93
2.64
Nam
ibia
0.
3 52
2
1.66
2.
08
2.08
1.96
1.
71
1.98
1.63
Nic
arag
ua
0.21
76
3.
05
2.91
3.
39
3.07
2.
33
2.8
2.88
2.
96
2.42
2.
71
Nig
eria
0.
26
63
3.11
3.
43
3.21
2.
92
3.
3 3.
37
3.1
3.
68
Paki
stan
0.
05
61
3.28
3.
64
3.21
2.
87
2.56
3.
03
3.54
3.
2 2.
67
3.08
Pana
ma
0.09
81
2.
06
2.72
2.
04
1.42
2.
4 2.
98
2.8
2.38
2.
44
2.19
Peru
-0
.02
83
3.09
3.
21
2.85
2.
99
2.55
2.
81
2.83
3.
35
2.68
2.
27
Phili
ppin
es
0.07
84
2.
69
2.85
3.
36
3.43
2.
24
2.8
3.13
3.
08
2.9
2.88
Pola
nd
0.33
17
5 2.
47
2.75
2.
58
2.27
2.
3 2.
37
2.27
3.
08
2.23
1.
67
Port
ugal
0.
12
52
1.8
2.08
2.
1 1.
74
1.88
1.
64
1.73
2.
15
2.18
1.
75

31
G
ener
al O
bsta
cles
Nat
ion
Firm
G
row
th
Num
ber
of f
irm
s Fi
nanc
ing
Po
licy
Inst
abili
ty
Infl
atio
n E
xcha
nge
Rat
e Ju
dici
al
Eff
icie
ncy
Stre
et
Cri
me
Cor
rupt
ion
Tax
es a
nd
Reg
ulat
ion
Ant
i-co
mpe
titiv
e B
ehav
ior
Infr
astr
uctu
re
Rom
ania
0.
07
96
3.26
3.
44
3.75
3.
19
2.59
2.
45
2.88
3.
57
2.52
2.
44
Rus
sian
Fed
erat
ion
0.29
38
4 3.
2 3.
49
3.53
3.
15
2.17
2.
65
2.62
3.
58
2.67
2.
12
Sene
gal
0.15
38
3
2.21
2.
56
2
2.61
3.
04
2.97
2.88
Sing
apor
e 0.
12
74
1.97
1.
5 1.
61
1.88
1.
32
1.22
1.
28
1.55
1.
58
1.42
Slov
ak R
epub
lic
0.14
91
3.
34
1.53
3.
13
2.43
2.
13
2.49
2.
47
3.25
2.
26
1.98
Slov
enia
0.
29
101
2.3
2.6
2.23
2.
21
2.29
1.
68
1.64
2.
91
2.43
1.
74
Sout
h A
fric
a 0.
26
87
2.34
1.
97
2.45
2.
39
3.
58
2.58
2.
64
1.
83
Spai
n 0.
25
66
2.21
2.
17
2.27
1.
93
1.97
1.
92
2.08
2.
65
2.25
1.
94
Swed
en
0.23
73
1.
83
2.46
1.
66
1.78
1.
46
1.54
1.
18
2.67
1.
97
1.52
Tan
zani
a 0.
25
40
2.85
2.
48
2.65
2.
07
1.
96
2.88
2.
7
3.21
Tha
iland
-0
.02
337
3.1
3.49
3.
4 3.
62
2.13
3.
48
3.47
3.
54
3.6
2.76
Tri
nida
d an
d T
obag
o 0.
18
80
3.03
1.
81
2.49
2.
41
1.45
2.
18
1.68
2.
78
1.79
2.
1
Tun
isia
0.
14
41
1.79
1.
94
1.7
1.94
1.55
2.
11
2.12
2.1
Tur
key
0.1
115
3.12
3.
55
3.61
2.
83
2.3
2.09
2.
89
3.16
2.
79
2.22
Uga
nda
0.18
67
3.
17
2.47
2.
68
1.78
2.27
2.
93
2.48
2.81
Ukr
aine
0.
03
170
3.45
3.
22
3.43
3.
05
2.16
2.
49
2.51
3.
7 2.
86
2.22
Uni
ted
Kin
gdom
0.
27
62
2.33
2.
19
2.16
2.
28
1.5
1.95
1.
24
2.87
1.
72
1.69
Uni
ted
Stat
es
0.16
66
2.
38
2.05
2.
12
1.71
1.
84
2.14
1.
88
2.39
1.
7 1.
83
Uru
guay
0
72
2.73
2.
61
2.03
2.
39
1.91
2.
07
2 3.
21
1.71
1.
9
Uzb
ekis
tan
0.64
94
2.
77
2.03
3.
04
2.6
1.68
1.
77
2.22
2.
66
2.28
1.
95
Ven
ezue
la
-0.0
2 78
2.
62
3.64
3.
48
3.12
2.
65
3.18
3
3.1
2.63
2.
31
Zam
bia
0.18
46
2.
95
2.57
3.
45
1.88
3.18
2.
78
2.39
3.07
Zim
babw
e 0.
47
91
3.05
2.
73
3.83
2.
93
2.
57
2.87
2.
87
2.
53
Ave
rage
0.
15
86.7
3 2.
8 2.
72
2.76
2.
49
2.15
2.
51
2.56
2.
9 2.
37
2.34
N
ote:
The
var
iabl
es a
re d
escr
ibed
as
follo
ws:
Fir
m g
row
th is
the
perc
enta
ge c
hang
e in
fir
m s
ales
ove
r th
e pa
st th
ree
year
s (1
996-
99).
Fin
anci
ng, P
olic
y In
stab
ility
, Inf
lati
on, E
xcha
nge
Rat
e, J
udic
ial
Eff
icie
ncy,
Str
eet C
rim
e, C
orru
ptio
n, T
axes
and
Reg
ulat
ion,
Ant
i-co
mpe
titiv
e B
ehav
ior
and
Infr
astr
uctu
re a
re g
ener
al o
bsta
cles
as
indi
cate
d in
the
firm
que
stio
nnai
re. T
hey
take
val
ues
1 to
4, w
ith
high
er v
alue
s in
dica
ting
grea
ter
obst
acle
s. F
irm
obs
tacl
es a
re a
vera
ged
over
all
firm
s in
eac
h co
untr
y. T
he n
umbe
r of
fir
ms
repo
rted
are
the
firm
s w
ith n
on-m
issi
ng f
irm
gro
wth
rat
es.
Sour
ce: A
utho
rs’
anal
ysis
bas
ed o
n da
ta d
escr
ibed
in t
he te
xt.

32
1 Fleisig (1996) highlights the problem with posting collateral in developing and transition countries with
the example of financing available to Uruguayan farmers raising cattle. While cattle are viewed as one of
the best forms of loan collateral by the US, a pledge on cattle is worthless in Uruguay. Uruguayan law
requires for specific description of the pledged property, in this case, an identification of the cows pledged.
The need to identify collateral so specifically undermines the secured transaction since the bank is not
allowed to repossess a different group of cows in the event of nonpayment.
2 There is a parallel literature on financial development and growth at the country level. Specifically, cross-
country studies (King and Levine 1993; Beck, Levine, and Loayza 2000; Levine, Loayza, and Beck 2000)
show that financial development fosters economic growth. Also see Levine (2005) for a review of the
finance and growth literature.
3 See Dollar, Hallward-Driemeier, and Mengistae (2004), Gelb, Ramachandran, Shah, and Turner (2007),
Carlin, Schaffer, and Seabright (2005) and Svejnar and Commander (2007).
4In the survey managers indicate that an obstacle is a problem by assigning a value greater than one, on a
four point scale to that obstacle. The significance of the coefficient in the growth regression is usually
sufficient to determine whether an obstacle is binding or not since the mean value of all obstacles exceeds
one. However, in determining the relative impact, it is important to take into account the level of the
obstacles.
5 DAG analysis is related to the use of different analytical methods to identify the most reliable predictors
of economic growth such as the Extreme Bounds Analysis (EBA) used in Kormendi and Meguire (1985),
Barro (1991), and Levine and Renelt (1992) and the technique in Sala-i-Martin (1997). DAG analysis has
several advantages over these methods. While these methods start from an equation specified by the
researcher, that embodies a causal ordering which is then tested, DAG can endogenously discover the
causal ordering. Moreover, whereas EBA treats one relation at a time, the graphs produced by DAG show
robust relations between all the variables being analyzed, taking into account the implications of robust
relations elsewhere in the system on the ordering in a specific relation.

33
6 The survey provides two obstacles on crime, one capturing street crime and the other organized crime.
Since the correlation between the two obstacles is higher than 70 percent, we use only street crime in our
analysis, which is also more strongly correlated with firm growth among the two.
7 In unreported regressions we also checked the robustness of our results to including additional control
variables in the regression. Specifically, adding variables at the firm level capturing a firm’s industry,
number of competitors, organizational structure, and whether it is government or foreign owned, an
exporter, or a subsidy receiver reduces country coverage from 80 to 56, but does not affect the results
significantly for individual obstacles. Of the three binding constraints identified above, only the Policy
Instability obstacle loses significance. We get similar results with country random effects controlling for
GDP/Capita and inflation at the country level.
8 In addition, we select the significance level for the tests of conditional independence performed by
TETRAD. Because the algorithm performs a complex sequence of statistical tests, each at the given
significance level, the significance level is not an indication of error probabilities of the entire procedure.
Spirtes, Glymour, and Sheines (1993) after exploring several versions of the algorithm on simulated data
conclude that “in order for the method to converge to correct decisions with probability 1, the significance
level used in making decisions should decrease as the sample size increases, and the use of higher
significance levels may improve performance at small sample sizes.” For the results in this paper obtained
from samples ranging from 2659-4197 observations, we use a significance level of 0.10. At the 5%
significance level, Finance, Crime, and Policy Instability have a direct effect on firm growth where as at the
1% level only Finance and Crime have a direct effect on growth.
9 We find the DAG analysis and the set of causal structures determined by the algorithm as being useful for
an objective selection of variables, with the heuristic interpretation that if DAG analysis shows that
obstacle X causes obstacle Y, then firms’ reports of X as an obstacle is also likely to affect the probability
that they report of Y as an obstacle. For details refer to formal definitions.
10 In addition to the directed arrows and bi-directional arrows, Figure 1 also shows that in some cases
common latent causes drive association between some variables (e.g. financing and corruption) and in other
cases, the direction of orientation is inconsistent i.e. some statistical tests indicate that an edge should be
oriented as x1 x2, and other statistical tests indicate that it should be oriented as x1←x2.
34
11 Carlin, Schaffer, and Seabright (2005) argue that only in the case of the financing constraint, reverse
causality makes the within coefficient more negative than the true value, thus making this method
inapplicable
12 This is further confirmed by the Weak Identification test statistic (Kleibergen-Paap Wald statistic) which
is much larger than the critical value of 16.38
13 In unreported results we also computed the DFITS statistic of Welsch and Kuh (1977) which identifies
the influence of each observation on the fitted model. Besley, Kuh, and Welsch (1980) suggest that a cutoff
of |DFITSj| > 2sqrt(k/N) indicates influential observations where k is the number of estimated coefficients
and N is the number of observations. We have 145 observations in our sample with |DFITS| greater than the
cutoff value. When we drop these influential observations we find that Financing, Policy Instability, and
Crime are all negative and significant
14 The residual remains significant if in addition to the residual and the significant individual financing
obstacles (collateral, paperwork, high interest rates, special connections, lack money to lend and lease
finance), we were to include all the general obstacles (Policy Instability, Crime, Inflation, Exchange rates,
Taxes & Regulation, Anti-Competitive Behavior, Judicial Efficiency, Corruption and Infrastructure).
15 An implicit assumption with the use of any survey data is that firm managers are knowledgeable about
the different obstacles and understand the true workings of the financial and legal systems.

35
REFERENCES
Ayyagari, M., Demirgüç-Kunt, A., Maksimovic, V., 2008. How well do Institutional theories Explain Firms’ Perceptions of Property Rights? Review of Financial Studies forthcoming. Ayyagari, M., Demirgüç-Kunt, A., Maksimovic, V., 2005. What determines protection of property rights? Analysis of direct and indirect effects using DAG methodology. Mimeo Barro, R. J., 1991. Economic Growth in a Cross Section of Countries. Quarterly Journal of Economics 106: 407–443 Beck, T., Demirgüç-Kunt, A., Maksimovic, V., 2005. Financial and Legal Constraints to Firm Growth: Does Firm Size Matter. Journal of Finance 60(1), 137-177. Beck, T., Demirgüç-Kunt, A., Maksimovic, V., 2006. The Influence of Financial and Legal Institutions on Firm Size. Forthcoming Journal of Banking and Finance. Beck, T., Levine, R., Loayza, N., 2000. Finance and the Sources of Growth. Journal of Financial Economics 58, 261-300. Belsley, D.A., Kuh, E. and Welsch, R.E., 1980. Regression diagnostics. , Wiley, New York, NY. Carlin, W., Schaffer, M., Seabright, P., 2005. Where are the Real Bottlenecks? A Lagrangian Approach to Identifying Constraints on Growth from Subjective Survey Data. CEPR Discussion Paper No. 5719. Chandra, V., Moorty, L., Nganou, J., Rajaratnam, B., Schaefer, K., 2001. Constraints to Growth and Employment in South Africa. Discussion Paper, World Bank Southern Africa Department. Demirgüç-Kunt, A., Maksimovic, V., 1998. Law, finance, and firm growth, Journal of Finance 53, 2107-2137. Demirgüç-Kunt, A., Love, Inessa, Maksimovic, V., 2006. Business Environment and the Incorporation Decision, Forthcoming Journal of Banking and Finance. Dollar, D., Hallward-Driemeier, M., Mengistae, T., 2004. Investment Climate and Firm Performance in Developing Countries, World Bank mimeo. Gelb, Alan, Vijaya Ramachandran, Manju Kedia Shah and Ginger Turner, (2007) "What Matters to African Firms? The Relevance of Perceptions Data". World Bank Policy Research Working Paper No. 4446. Fisman, R. and J. Svensson, 2007, Are Corruption and Taxation Really Harmful to

36
Growth? Firm Level Evidence, Journal of Development Economics Vol. 83, No. 1, 63-75. Fleisig, H., 1996. Secured Transactions: The Power of Collateral. Finance and Development, 44-46. GAO-04-506, 2004. U.S. Anticorruption Programs in Sub-Saharan Africa Will Require Time and Commitment, United States General Accounting Office (GAO) Report to the Subcommittee on African Affairs, Committee on Foreign Relations, U.S. Senate. Hausmann, R., Rodrik, D., Velasco, A., 2004. Growth Diagnostics. Harvard University working paper. Kaufmann, D. and S. Wei, 1999, Does grease money speed up the wheels of commerce? World Bank Policy Working Paper No 2254, Washington DC. King, R.G., Levine, R.,1993, Finance and Growth: Schumpeter Might Be Right, Quarterly Journal of Economics, 108, 717-38. Kormendi, R.C., Meguire, P.G., 1985. Macroeconomic Determinants of Growth: Cross-Country Evidence. Journal of Monetary Economics 16, 141-163. Krueger, A.B., Angrist, J., 2001. Instrumental variables and the search for identification: from supply and demand to natural experiments? Journal of Economic Perspectives 15, 69–85. La Porta, R., Lopez-de-Silanes, F., Shleifer, A., Vishny, R.W., 1997. Legal determinants of external finance. Journal of Finance 52, 1131-1150. Levine, R., 2005. Finance and Growth: Theory and Evidence forthcoming in Philippe Aghion and Steven Durlauf, eds. Handbook of Economic Growth. The Netherlands: Elsevier Science. Levine, R., Loayza, N., Beck, T. 2000. Financial Intermediation and Growth: Causality and Causes. Journal of Monetary Economics 46, 31-77. Levine, R., Renelt, D., 1992. A Sensitivity Analysis of Cross-Country Growth Regressions. American Economic Review 82(4), 942-963. Moreira, Marcelo J., and Brian P. Poi, 2001, Implementing tests with correct size in the simultaneous equation model, The Stata Journal 1, 1-15. Mikusheva, A. and Brian P. Poi, 2006, Tests and confidence sets with correct size when instruments are potentially weak, The Stata Journal 6(3). Rajan, R., Zingales, L., 1998. Financial dependence and growth, American Economic Review 88, 559-587.

37
Sala-i-Martin, X. 1997. I Just Ran Two Million Regressions. American Economic Review 87 (2), 178-183. Scheines, R., Spirtes, P., Glymour, C., Meek, C., 1994. TETRAD II: Users Manual, Lawrence Erlbaum Associates, Hillsdale, NJ. Spirtes, P., Glymour, C., Scheines, R., 1993. Causation, Prediction and Search, New York: Springer-Verlag. Stock, J., and M. Watson. 2003. Introduction to Econometrics. Reading, MA: Addison– Wesley Svejnar, J., and S. Commander, 2007. Do Institutions, Ownership, Exporting and Competition Explain Firm Performance? Evidence from 26 Transition Countries, IZA Discussion Paper No. 2637 Welsch, R. E., and Kuh, E. (1977), "Linear Regression Diagnostics," Working Paper 173, Cambridge, Mass.: National Bureau of Economic Research

38
Fig
ure
1: F
irm
Gro
wth
– G
ener
al O
bsta
cles
: D
AG
Ana
lysi
s
So
urce
: Aut
hors
’ an
alys
is b
ased
on
data
des
crib
ed in
text
.
Exc
hang
e R
ates
Infl
atio
n
Cor
rupt
ion
Judi
cial
Eff
icie
ncy
Tax
es &
Reg
ulat
ion
Infr
astr
uctu
re
Ant
i-C
ompe
titi
ve
Beh
avio
r
Sale
s G
row
th
Stre
et C
rim
e
Pol
icy
Inst
abili
ty
Fin
anci
ng

39
T
able
1:
Eco
nom
ic I
ndic
ator
s an
d G
ener
al O
bsta
cles
P
anel
A:
Ave
rage
d A
cros
s C
ount
ries
G
ener
al O
bsta
cles
Nat
ion
GD
P p
er
capi
ta
Fir
m
Gro
wth
F
inan
cing
P
olic
y In
stab
ility
In
flat
ion
Exc
hang
e R
ate
Judi
cial
E
ffic
ienc
y St
reet
C
rim
e C
orru
ptio
n T
axes
and
R
egul
atio
n
Ant
i-co
mpe
titi
ve
Beh
avio
r In
fras
truc
ture
Pan
el A
: A
vera
ged
Acr
oss
Cou
ntry
Inc
ome
Gro
ups
Hig
h (N
=11)
21
376.
34
0.19
2.
19
2.2
2.04
1.
93
1.81
1.
71
1.59
2.
67
2 1.
72
Upp
er-M
iddl
e (N
=18
) 41
31.8
17
0.19
2.
75
2.62
2.
54
2.27
2.
13
2.38
2.
29
2.93
2.
18
1.99
Low
er-M
iddl
e (N
=26
) 19
84.8
52
0.11
3
3.14
3.
1 2.
94
2.31
2.
72
2.73
3.
24
2.59
2.
31
Low
Inc
ome
(N=
25)
435.
3 0.
14
2.85
2.
84
3.02
2.
61
2.15
2.
78
2.98
2.
73
2.53
2.
7
Pan
el B
: A
vera
ged
Acr
oss
5 G
eogr
aphi
c R
egio
ns
Eur
ope
and
Nor
th
Am
eric
a (N
=9)
2286
3.72
0.
19
2.2
2.22
2.
06
1.89
1.
79
1.78
1.
63
2.77
1.
98
1.76
Lat
in A
mer
ica
(N=
20)
3022
.2
0.09
2.
83
3.02
2.
84
2.8
2.39
2.
95
2.74
3.
01
2.43
2.
4
Asi
a (N
=10
) 27
72.5
2 0.
05
2.59
2.
82
2.74
2.
66
1.99
2.
62
2.71
2.
51
2.44
2.
43
Tra
nsiti
on (
N=2
3)
2417
.02
0.19
3.
05
2.99
3.
06
2.7
2.17
2.
39
2.5
3.28
2.
44
2.09
Afr
ica
(N=1
8)
1115
.81
0.23
2.
77
2.43
2.
75
2.21
2.64
2.
80
2.32
2.75
Pan
el C
: A
vera
ged
Acr
oss
3 Si
ze G
roup
s
Smal
l 37
59.3
3 0.
13
2.89
2.
84
2.90
2.
59
2.13
2.
64
2.62
2.
94
2.43
2.
24
Med
ium
43
77.9
8 0.
16
2.86
2.
87
2.84
2.
60
2.18
2.
46
2.53
3.
00
2.41
2.
26
Lar
ge
4365
.68
0.17
2.
54
2.75
2.
65
2.55
2.
19
2.49
2.
43
2.70
2.
23
2.36
N
ote:
The
var
iabl
es a
re d
escr
ibed
as
follo
ws:
GD
P pe
r ca
pita
is r
eal G
DP
per
capi
ta in
US
dolla
rs a
vera
ged
over
199
5-19
99. F
irm
gro
wth
is th
e pe
rcen
tage
cha
nge
in f
irm
sal
es o
ver
the
past
thre
e ye
ars
(199
6-99
). F
inan
cing
, Po
licy
Inst
abili
ty,
Infl
atio
n, E
xcha
nge
Rat
e, J
udic
ial
Eff
icie
ncy,
Str
eet
Cri
me,
Cor
rupt
ion,
Tax
es a
nd R
egul
atio
n, A
nti-
com
petit
ive
Beh
avio
r an
d In
fras
truc
ture
are
gen
eral
ob
stac
les
as in
dica
ted
in th
e fi
rm q
uest
ionn
aire
. The
y ta
ke v
alue
s 1
to 4
, wit
h hi
gher
val
ues
indi
catin
g gr
eate
r ob
stac
les.
In
Pane
l A, t
he c
ount
ries
are
cla
ssif
ied
into
Hig
h In
com
e, U
pper
Mid
dle
Inco
me,
L
ower
Mid
dle
Inco
me
and
Low
Inc
ome
grou
p co
untr
ies
acco
rdin
g to
WD
I an
d fi
rm v
aria
bles
are
ave
rage
d ov
er a
ll fi
rms
in th
e pa
rtic
ular
gro
up o
f co
untr
ies.
In
Pane
l B, t
he c
ount
ries
are
cla
ssif
ied
into
fi
ve g
eogr
aphi
c re
gion
s an
d fi
rm v
aria
bles
are
ave
rage
d ov
er a
ll fi
rms
in t
he p
arti
cula
r ge
ogra
phic
reg
ion.
In
Pane
l C
, fi
rm v
aria
bles
are
ave
rage
d ac
ross
thr
ee s
ize
grou
ps-S
mal
l, M
ediu
m a
nd L
arge
Fi
rms.
So
urce
: Aut
hors
’ an
alys
is b
ased
on
data
des
crib
ed in
text
.

Tab
le 2
: F
irm
Gro
wth
-Im
pact
of
Obs
tacl
es
12
63
85
74
910
1112
Firm
Gro
wth
Firm
Gro
wth
Firm
Gro
wth
Firm
Gro
wth
Firm
Gro
wth
Firm
Gro
wth
Firm
Gro
wth
Firm
Gro
wth
Firm
Gro
wth
Firm
Gro
wth
Firm
Gro
wth
Firm
Gro
wth
Con
stan
t0.
205*
**0.
165*
**0.
193*
**0.
170*
**0.
180*
**0.
140*
**0.
152*
**0.
117*
**0.
111*
**0.
126*
**0.
332*
**0.
297*
**(0
.028
)(0
.036
)(0
.034
)(0
.029
)(0
.040
)(0
.026
)(0
.032
)(0
.029
)(0
.028
)(0
.030
)(0
.059
)(0
.047
)Si
ze0.
003
0.00
5**
0.00
40.
004
0.00
5*0.
005*
0.00
5*0.
003
0.00
5*0.
005*
0.00
40.
004
(0.0
02)
(0.0
03)
(0.0
02)
(0.0
02)
(0.0
03)
(0.0
03)
(0.0
03)
(0.0
02)
(0.0
03)
(0.0
03)
(0.0
03)
(0.0
02)
Fina
ncin
g-0
.032
***
-0.0
34**
*-0
.028
***
(0.0
08)
(0.0
09)
(0.0
08)
Polic
y In
stab
ility
-0.0
24**
-0.0
22*
-0.0
14(0
.010
)(0
.013
)(0
.009
)St
reet
Cri
me
-0.0
30**
-0.0
33**
-0.0
25*
(0.0
13)
(0.0
15)
(0.0
14)
Infl
atio
n-0
.020
**-0
.002
(0.0
09)
(0.0
11)
Tax
Reg
ulat
ion
-0.0
27**
0.00
1(0
.012
)(0
.013
)Ju
dici
al E
ffic
ienc
y-0
.021
**-0
.003
(0.0
10)
(0.0
09)
Cor
rupt
ion
-0.0
170.
011
(0.0
11)
(0.0
12)
Exc
hang
e R
ates
-0.0
00(0
.009
)A
nti-
Com
petit
ive
Beh
avio
r-0
.004
(0.0
07)
Infr
astr
uctu
re-0
.009
(0.0
08)
N62
3561
3359
6461
7563
4351
4256
2060
6850
9162
0545
5157
78N
Cou
ntri
es79
7979
7979
6178
7960
7959
78A
djus
ted.
R-s
q0.
070.
073
0.07
0.06
80.
069
0.07
0.07
20.
069
0.06
90.
068
0.07
40.
072
*,
**,
and
***
indi
cate
sig
nifi
canc
e le
vels
of
10, 5
, and
1 p
erce
nt r
espe
ctiv
ely.
N
ote:
The
reg
ress
ion
equa
tion
est
imat
ed i
s: F
irm
Gro
wth
= α
+ β
1 Si
ze+
β2
Fina
ncin
g +
β3P
olic
y In
stab
ility
+ β
4Inf
lati
on +
β5E
xcha
nge
Rat
es+
β6J
udic
ial
Eff
icie
ncy
+ β
7Str
eet
Cri
me+
β8C
orru
ptio
n +
β 9T
axes
and
Reg
ulat
ion+
β10
Ant
i-co
mpe
titiv
e B
ehav
ior
+ β 1
1 In
fras
truc
ture
+ β
12C
ount
ry F
ixed
Eff
ects
+ e
. The
var
iabl
es a
re d
escr
ibed
as
follo
ws:
Fir
m G
row
th i
s th
e pe
rcen
tage
inc
reas
e in
fir
m s
ales
ov
er t
he p
ast
thre
e ye
ars.
Fir
m S
ize
is t
he L
og o
f fi
rm s
ales
. Fi
nanc
ing,
Pol
icy
Inst
abili
ty,
Infl
atio
n, E
xcha
nge
Rat
e, J
udic
ial
Eff
icie
ncy,
Str
eet
Cri
me,
Cor
rupt
ion,
Tax
es a
nd R
egul
atio
n, A
nti-
com
petit
ive
Beh
avio
r an
d In
fras
truc
ture
are
gen
eral
obs
tacl
es a
s in
dica
ted
in t
he f
irm
que
stio
nnai
re.
The
y ta
ke v
alue
s 1
to 4
, w
here
1 i
ndic
ates
no
obst
acle
and
4 i
ndic
ates
maj
or o
bsta
cle.
In
spec
ific
atio
ns (
1) t
o (1
0), e
ach
of th
e ob
stac
le v
aria
bles
is
incl
uded
indi
vidu
ally
. Spe
cifi
catio
n 11
incl
udes
all
the
obst
acle
s th
at w
ere
sign
ific
ant i
n (1
) to
(10
) to
geth
er w
here
as
in s
peci
fica
tion
12
only
Fi
nanc
ing,
Pol
icy
Inst
abili
ty a
nd S
tree
t Cri
me
obst
acle
s ar
e en
tere
d. A
ll re
gres
sion
s in
spe
cifi
catio
ns 1
-12
are
esti
mat
ed u
sing
cou
ntry
fix
ed e
ffec
ts w
ith
clus
tere
d st
anda
rd e
rror
s.
Sour
ce: A
utho
rs’
anal
ysis
bas
ed o
n da
ta d
escr
ibed
in te
xt.
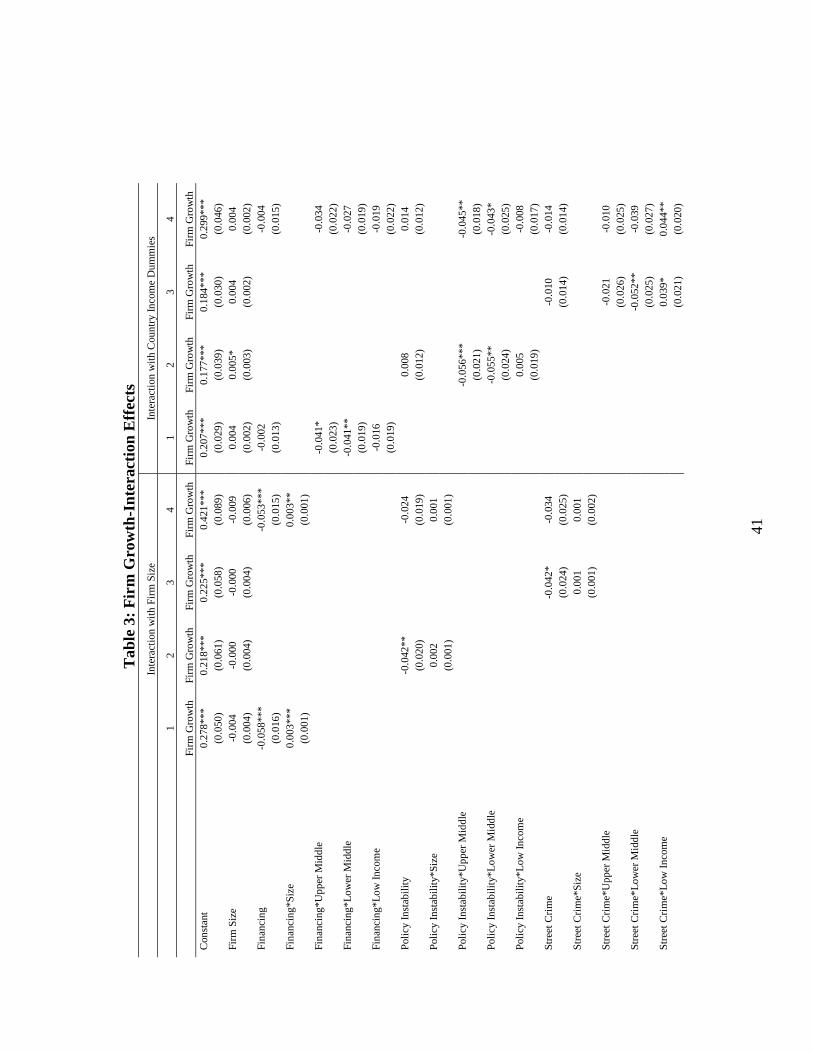
41
Tab
le 3
: F
irm
Gro
wth
-Int
erac
tion
Eff
ects
In
tera
ctio
n w
ith
Firm
Siz
e In
tera
ctio
n w
ith
Cou
ntry
Inc
ome
Dum
mie
s
1
2 3
4 1
2 3
4
Fi
rm G
row
th
Firm
Gro
wth
Fi
rm G
row
th
Firm
Gro
wth
Fi
rm G
row
th
Firm
Gro
wth
Fi
rm G
row
th
Firm
Gro
wth
C
onst
ant
0.27
8***
0.
218*
**
0.22
5***
0.
421*
**
0.20
7***
0.
177*
**
0.18
4***
0.
299*
**
(0
.050
) (0
.061
) (0
.058
) (0
.089
) (0
.029
) (0
.039
) (0
.030
) (0
.046
) Fi
rm S
ize
-0.0
04
-0.0
00
-0.0
00
-0.0
09
0.00
4 0.
005*
0.
004
0.00
4
(0.0
04)
(0.0
04)
(0.0
04)
(0.0
06)
(0.0
02)
(0.0
03)
(0.0
02)
(0.0
02)
Fina
ncin
g -0
.058
***
-0.0
53**
* -0
.002
-0
.004
(0.0
16)
(0.0
15)
(0.0
13)
(0.0
15)
Fina
ncin
g*Si
ze
0.00
3***
0.
003*
*
(0.0
01)
(0.0
01)
Fina
ncin
g*U
pper
Mid
dle
-0.0
41*
-0.0
34
(0
.023
)
(0
.022
) Fi
nanc
ing*
Low
er M
iddl
e
-0
.041
**
-0.0
27
(0
.019
)
(0
.019
) Fi
nanc
ing*
Low
Inc
ome
-0.0
16
-0.0
19
(0
.019
)
(0
.022
) Po
licy
Inst
abili
ty
-0
.042
**
-0
.024
0.00
8
0.01
4
(0
.020
)
(0.0
19)
(0
.012
)
(0.0
12)
Polic
y In
stab
ility
*Siz
e
0.00
2
0.00
1
(0
.001
)
(0.0
01)
Polic
y In
stab
ility
*Upp
er M
iddl
e
-0.0
56**
*
-0.0
45**
(0
.021
)
(0.0
18)
Polic
y In
stab
ility
*Low
er M
iddl
e
-0.0
55**
-0.0
43*
(0.0
24)
(0
.025
) Po
licy
Inst
abili
ty*L
ow I
ncom
e
0.00
5
-0.0
08
(0.0
19)
(0
.017
) St
reet
Cri
me
-0.0
42*
-0.0
34
-0.0
10
-0.0
14
(0
.024
) (0
.025
)
(0
.014
) (0
.014
) St
reet
Cri
me*
Size
0.
001
0.00
1
(0.0
01)
(0.0
02)
Stre
et C
rim
e*U
pper
Mid
dle
-0.0
21
-0.0
10
(0
.026
) (0
.025
) St
reet
Cri
me*
Low
er M
iddl
e
-0
.052
**
-0.0
39
(0
.025
) (0
.027
) St
reet
Cri
me*
Low
Inc
ome
0.03
9*
0.04
4**
(0
.021
) (0
.020
)

42
In
tera
ctio
n w
ith
Firm
Siz
e In
tera
ctio
n w
ith
Cou
ntry
Inc
ome
Dum
mie
s
1
2 3
4 1
2 3
4
Fi
rm G
row
th
Firm
Gro
wth
Fi
rm G
row
th
Firm
Gro
wth
Fi
rm G
row
th
Firm
Gro
wth
Fi
rm G
row
th
Firm
Gro
wth
N
62
35
6133
59
64
5778
62
35
6133
59
64
5778
N
Cou
ntri
es
79
79
79
78
79
79
79
78
Adj
uste
d R
-Squ
are
0.07
1 0.
074
0.07
1 0.
074
0.07
0 0.
075
0.07
3 0.
075
F-T
est o
f In
tera
ctio
ns
0.
0503
0.
1184
0.
0088
0.
0039
0.
0022
*,
**,
and
***
indi
cate
sig
nifi
canc
e le
vels
of
10, 5
, and
1 p
erce
nt r
espe
ctiv
ely
Not
e: T
he r
egre
ssio
n eq
uati
on e
stim
ated
is: F
irm
Gro
wth
= α
+ β
1 Si
ze +
β2 F
inan
cing
+ β
3 Po
licy
Inst
abili
ty +
β4 S
tree
t Cri
me+
β5 Fi
nanc
ing
x In
com
e D
umm
ies
+ β 6
Fin
anci
ng x
Siz
e +
β7 Po
licy
Inst
abili
ty x
Inc
ome
Dum
mie
s +
β8 Po
licy
Inst
abili
ty x
Siz
e+ β
9 St
reet
Cri
me
x In
com
e D
umm
ies
+ β
10 S
tree
t Cri
me
x Si
ze. T
he v
aria
bles
are
des
crib
ed a
s fo
llow
s: F
irm
Gro
wth
is th
e pe
rcen
tage
in
crea
se in
fir
m s
ales
ove
r th
e pa
st th
ree
year
s. F
irm
Siz
e is
the
log
of s
ales
. Fin
anci
ng, P
olic
y In
stab
ility
and
Str
eet C
rim
e ar
e ge
nera
l obs
tacl
es a
s in
dica
ted
in th
e fi
rm q
uest
ionn
aire
. The
y ta
ke v
alue
s 1
to 4
, whe
re 1
indi
cate
s no
obs
tacl
e an
d 4
indi
cate
s m
ajor
obs
tacl
e. I
ncom
e du
mm
ies
are
coun
try
dum
mie
s cr
eate
d on
the
basi
s of
inco
me
leve
l of
the
coun
try.
Hig
h In
com
e D
umm
y ta
kes
the
valu
e 1
for
coun
trie
s be
long
ing
to th
e hi
gh in
com
e gr
oup
and
0 ot
herw
ise,
Upp
er M
iddl
e In
com
e du
mm
y ta
kes
the
valu
e 1
for
coun
trie
s be
long
ing
to th
e up
per
mid
dle
inco
me
grou
p an
d 0
othe
rwis
e, L
ower
Mid
dle
Inco
me
dum
my
take
s th
e va
lue
1 fo
r co
untr
ies
belo
ngin
g to
the
low
er m
iddl
e in
com
e gr
oup
and
0 ot
her
wis
e, L
ow I
ncom
e du
mm
y ta
kes
the
valu
e 1
for
low
inco
me
grou
p co
untr
ies
and
0 ot
herw
ise.
In
spec
ific
atio
ns (
1) to
(3)
in e
ach
pane
l, th
e ob
stac
le v
aria
bles
and
its
inte
ract
ions
is in
clud
ed in
divi
dual
ly. S
peci
fica
tion
4 in
bot
h pa
nels
incl
udes
the
full
mod
el.
All
regr
essi
ons
are
esti
mat
ed u
sing
co
untr
y fi
xed
effe
cts
wit
h cl
uste
red
stan
dard
err
ors.
Eac
h sp
ecif
icat
ion
also
rep
orts
the
p-va
lue
of th
e jo
int s
igni
fica
nce
test
of
the
inte
ract
ion
term
s.
Sour
ce: A
utho
rs’
anal
ysis
bas
ed o
n da
ta d
escr
ibed
in te
xt

43
Tab
le 4
: R
obus
tnes
s T
est-
Inst
rum
enta
l Var
iabl
es
Pan
el A
: F
irm
Lev
el R
egre
ssio
ns
1
2 3
4 5
6 7
Fi
rm
Gro
wth
Fi
rm
Gro
wth
Fi
rm
Gro
wth
Fi
rm
Gro
wth
Fi
rm
Gro
wth
Fi
rm
Gro
wth
Fi
rm
Gro
wth
Inst
rum
ent(
s)
Cou
ntry
-Ind
ustr
y A
vera
ge o
f th
e ob
stac
le v
aria
ble
Doe
s th
e fi
rm f
ollo
w in
tern
atio
nal a
ccou
ntin
g st
anda
rds?
Size
0.
002
0.00
6***
0.
004*
0.
003
-0.0
04
0.01
1*
-0.0
05
(0
.002
) (0
.002
) (0
.002
) (0
.002
) (0
.004
) (0
.006
) (0
.005
) Fi
nanc
ing
-0.0
66**
*
-0
.067
**
-0.2
85**
*
(0
.025
)
(0
.028
) (0
.101
)
Polic
y In
stab
ility
-0.0
45
-0
.041
-0.8
97*
(0.0
29)
(0
.031
)
(0.4
99)
St
reet
Cri
me
-0.0
11
0.01
4
-0
.529
**
(0
.029
) (0
.032
)
(0
.232
)
N
6235
61
33
5964
57
78
5846
57
47
5592
Fir
st S
tage
Tes
t of
Exc
lude
d In
stru
men
ts
F-St
at (
Fina
ncin
g)
382.
32
(0.0
000)
11
2.13
(0
.000
0)
36.4
8 (0
.000
0)
F-St
at (
Polic
y In
stab
ility
)
334.
57
(0.0
000)
106.
44
(0.0
000)
4.66
(0
.030
9)
F-St
at (
Cri
me)
35
1.30
(0
.000
0)
110.
22
(0.0
000)
11
.11
(0.0
009)
Und
erid
enti
fica
tion
Tes
t
Kle
iber
gen-
Paap
rk
Wal
d st
atis
tic
549.
12
(0.0
000)
40
5.91
(0
.000
0)
453.
67
(0.0
000)
36
6.18
(0
.000
0)
35.9
0 (0
.000
0)
4.54
(0
.033
1)
11.2
0 (0
.000
8)
Wea
k In
stru
men
t R
obus
t In
fere
nce
And
erso
n R
ubin
Wal
d T
est
7.06
(0
.007
9)
2.41
(0
.120
5)
0.14
(0
.704
1)
3.55
(0
.013
8)
9.43
(0
.002
1)
9.82
(0
.001
7)
9.18
(0
.002
4)
Pan
el B
: C
ross
-cou
ntry
reg
ress
ions
1 2
3
Fi
rm G
row
th
Firm
Gro
wth
Fi
rm G
row
th
Inst
rum
ents
C
omm
on la
w d
umm
y, 3
re
ligi
on d
umm
ies
Com
mon
law
dum
my,
3
reli
gion
dum
mie
s C
omm
on la
w d
umm
y,
Lat
itud
e
Con
stan
t 2.
385*
* 1.
122*
**
1.20
6***
(1
.013
) (0
.344
) (0
.465
)
GD
P/C
apita
-0
.091
**
-0.0
31*
-0.0
52*

44
1
2 3
Fi
rm G
row
th
Firm
Gro
wth
Fi
rm G
row
th
Inst
rum
ents
C
omm
on la
w d
umm
y, 3
re
ligi
on d
umm
ies
Com
mon
law
dum
my,
3
reli
gion
dum
mie
s C
omm
on la
w d
umm
y,
Lat
itud
e
(0
.043
) (0
.016
) (0
.029
)
Fina
ncin
g -0
.556
**
(0
.255
)
Polic
y In
stab
ility
-0.2
70**
*
(0.0
93)
Stre
et C
rim
e
-0
.264
***
(0
.102
)
N
79
79
80
F-St
at
2.71
(0
.036
5)
6.44
(0
.000
2)
6.95
(0
.001
7)
Und
erid
enti
fica
tion
Tes
t K
leib
erge
n-Pa
ap r
k W
ald
stat
isti
c 11
.74
(0.0
194)
27
.86
(0.0
000)
14
.63
(0.0
007)
W
eak
Inst
rum
ents
Rob
ust
Infe
renc
e
And
erso
n R
ubin
Wal
d T
est
3.30
(0
.015
4)
3.30
(0
.015
4)
6.69
(0
.002
1)
Mor
eira
and
Poi
Con
diti
onal
Lik
elih
ood
Rat
io T
est
[-2.
2644
38, -
.213
4783
(0
.985
7)
[-.5
6911
54, -
.115
2336
] (0
.920
7)
[-.7
2571
77, -
.084
9116
] (0
.983
2)
Ove
ride
ntif
icat
ion
Tes
t of
all I
nstr
umen
ts
Han
sen
J St
atis
tic
0.96
6 (0
.809
4)
1.22
7 (0
.746
5)
0.56
2 (0
.453
5)
*, *
*, a
nd *
** in
dica
te s
igni
fica
nce
leve
ls o
f 10
, 5, a
nd 1
per
cent
res
pect
ivel
y N
ote:
Tw
o st
age
inst
rum
enta
l var
iabl
e re
gres
sion
s ar
e us
ed. I
n Pa
nel A
, the
fir
st s
tage
reg
ress
ion
equa
tion
estim
ated
is F
inan
cing
(or
Pol
icy
Inst
abili
ty o
r St
reet
Cri
me)
= α
+ γ
1 Cou
ntry
Fix
ed E
ffec
ts +
γ
2 Fi
rm S
ize
+ γ
3 I
nstr
umen
t. T
he s
econ
d st
age
regr
essi
on e
quat
ion
estim
ated
is: F
irm
Gro
wth
= α
+ β
1 Cou
ntry
Fix
ed E
ffec
ts +
β2 Fi
rm S
ize+
β3 F
inan
cing
(pr
edic
ted
valu
e fr
om f
irst
sta
ge)
+ β 4
Polic
y In
stab
ility
(pr
edic
ted
valu
e fr
om f
irst
sta
ge)
+ β
5 St
reet
Cri
me
(pre
dict
ed v
alue
fro
m f
irst
sta
ge).
In s
peci
fica
tions
(1)
-(4)
, the
inst
rum
ent u
sed
is th
e av
erag
e va
lue
of th
e ob
stac
le a
cros
s ea
ch in
dust
ry in
ea
ch c
ount
ry. I
n sp
ecif
icat
ions
(5)
-(7)
, the
inst
rum
ent u
sed
is f
irm
res
pons
e to
the
vari
able
“D
oes
the
firm
ado
pt in
tern
atio
nal a
ccou
ntin
g st
anda
rds?
”.
Pane
l B r
epor
ts c
ross
-cou
ntry
reg
ress
ions
wit
h ro
bust
sta
ndar
d er
rors
. The
fir
st s
tage
reg
ress
ion
equa
tion
est
imat
ed is
Fin
anci
ng (
or P
olic
y In
stab
ility
or
Stre
et C
rim
e) a
vera
ged
acro
ss c
ount
ries
= α
+ γ
1 C
omm
on L
aw d
umm
y +
γ 2
Lat
itude
+ γ
3 P
rote
stan
t + γ
4 C
atho
lic +
γ 5 M
uslim
+ γ
6 G
DP/
Cap
ita +
e. T
he s
econ
d st
age
regr
essi
on e
quat
ion
estim
ated
is: F
irm
Gro
wth
= α
+ β
1 GD
P/C
apita
+ β
2
Fina
ncin
g (p
redi
cted
val
ue f
rom
fir
st s
tage
) +
β3P
olic
y In
stab
ility
(pr
edic
ted
valu
e fr
om f
irst
sta
ge)
+ β
4 St
reet
Cri
me
(pre
dict
ed v
alue
fro
m f
irst
sta
ge.
The
var
iabl
es a
re d
escr
ibed
as
follo
ws:
Fir
m
Gro
wth
is th
e pe
rcen
tage
incr
ease
in f
irm
sal
es o
ver
the
past
thre
e ye
ars.
Fir
m S
ize
is th
e L
og o
f Sa
les.
GD
P/ca
pita
is lo
g of
rea
l GD
P pe
r ca
pita
in U
S$. F
inan
cing
, Pol
icy
Inst
abili
ty, a
nd S
tree
t Cri
me
are
gene
ral o
bsta
cles
as
indi
cate
d in
the
firm
que
stio
nnai
re. T
hey
take
val
ues
1 to
4, w
here
1 in
dica
tes
no o
bsta
cle
and
4 in
dica
tes
maj
or o
bsta
cle.
Eng
lish
Com
mon
Law
is a
dum
my
vari
able
that
take
s th
e va
lue
1 fo
r C
omm
on L
aw C
ount
ries
. Lat
itude
is th
e ab
solu
te v
alue
of
the
lati
tude
of
the
coun
try
scal
ed b
etw
een
zero
and
one
. Pro
test
ant,
Cat
holic
, and
Mus
lim v
aria
bles
are
the
perc
enta
ge o
f pr
otes
tant
, cat
holic
and
mus
lim r
elig
ions
in e
ach
coun
try
from
La
Port
a et
al.
(199
7).
Doe
s th
e fi
rm a
dopt
inte
rnat
iona
l acc
ount
ing
stan
dard
s is
a d
umm
y va
riab
le th
at ta
kes
valu
e 1
if th
e fi
rm a
dopt
s in
tern
atio
nal a
ccou
ntin
g st
anda
rds
and
0 ot
herw
ise.
So
urce
: Aut
hors
’ an
alys
is b
ased
on
data
des
crib
ed in
text
.

45
Tab
le 5
: R
obus
tnes
s T
est
-Var
ying
Sam
ples
Hig
h G
row
th F
irm
s In
clud
ed
Hig
h G
row
th F
irm
s E
xclu
ded
Cou
ntri
es E
xclu
ded
Cou
ntri
es E
xclu
ded
Tra
nsiti
on
Eco
nom
ies
Afr
ican
ec
onom
ies
Afr
ican
an
d T
rans
ition
E
cono
mie
s
Uzb
ekis
tan,
B
osni
a &
H
erze
govi
na,
Est
onia
N
one
Tra
nsiti
on
Eco
nom
ies
Afr
ican
ec
onom
ies
Afr
ican
an
d T
rans
ition
E
cono
mie
s
Uzb
ekis
tan,
B
osni
a &
H
erze
govi
na,
Est
onia
1 2
3 4
5 6
7 8
9
Firm
G
row
th
Firm
G
row
th
Firm
G
row
th
Firm
G
row
th
Firm
G
row
th
Firm
G
row
th
Firm
G
row
th
Firm
G
row
th
Firm
G
row
th
Con
stan
t 0.
227*
**
0.30
7***
0.
233*
**
0.22
6***
0.
172*
**
0.22
5***
0.
175*
**
0.23
6***
0.
165*
**
(0
.045
) (0
.045
) (0
.045
) (0
.041
) (0
.028
) (0
.039
) (0
.029
) (0
.042
) (0
.028
) Fi
rm S
ize
-0.0
00
0.00
5 0.
000
0.00
4 0.
003
0.00
1 0.
003
0.00
0 0.
003
(0
.002
) (0
.003
) (0
.002
) (0
.003
) (0
.002
) (0
.002
) (0
.002
) (0
.002
) (0
.002
) -0
.012
* -0
.033
***
-0.0
20**
* -0
.019
***
-0.0
18**
* -0
.017
***
-0.0
20**
* -0
.022
***
-0.0
16**
* Fi
nanc
ing
(0.0
06)
(0.0
08)
(0.0
07)
(0.0
07)
(0.0
05)
(0.0
06)
(0.0
05)
(0.0
06)
(0.0
05)
-0.0
07
-0.0
15*
-0.0
10
-0.0
08
-0.0
15**
* -0
.011
-0
.015
**
-0.0
10
-0.0
14**
* Po
licy
Inst
abili
ty
(0.0
08)
(0.0
09)
(0.0
08)
(0.0
08)
(0.0
05)
(0.0
07)
(0.0
06)
(0.0
08)
(0.0
05)
-0.0
16**
-0
.027
***
-0.0
20**
* -0
.021
***
-0.0
07
-0.0
18**
* -0
.008
-0
.020
***
-0.0
09*
Stre
et C
rim
e
(0.0
07)
(0.0
08)
(0.0
07)
(0.0
07)
(0.0
05)
(0.0
06)
(0.0
05)
(0.0
07)
(0.0
05)
N
3224
52
36
2682
55
34
5631
32
02
5107
26
78
5421
N
Cou
ntri
es
54
62
38
75
78
54
62
38
75
Adj
uste
d R
-Squ
are
0.07
3 0.
072
0.05
6 0.
053
0.08
6 0.
074
0.08
2 0.
068
0.08
4 *,
**,
and
***
indi
cate
sig
nifi
canc
e le
vels
of
10, 5
, and
1 p
erce
nt r
espe
ctiv
ely
Not
e: T
he r
egre
ssio
n eq
uati
on e
stim
ated
is: F
irm
Gro
wth
= α
+ β
1 G
DP/
capi
ta +
β2 Si
ze+
β3
Fina
ncin
g + β 4
Polic
y In
stab
ility
+ β
5 St
reet
Cri
me.
The
var
iabl
es a
re d
escr
ibed
as
follo
ws:
Fir
m G
row
th is
the
perc
enta
ge in
crea
se in
fir
m s
ales
ove
r th
e pa
st th
ree
year
s. G
DP/
capi
ta is
log
of r
eal G
DP
per
capi
ta in
US$
. Fir
m S
ize
is th
e L
og o
f fi
rm s
ales
. Fin
anci
ng, P
olic
y In
stab
ility
, and
Str
eet C
rim
e ar
e ge
nera
l ob
stac
les
as in
dica
ted
in th
e fi
rm q
uest
ionn
aire
. The
y ta
ke v
alue
s 1
to 4
, with
whe
re 1
indi
cate
s no
obs
tacl
e an
d 4
indi
cate
s m
ajor
obs
tacl
e. S
peci
fica
tion
s (1
) to
(4)
exc
lude
cer
tain
cou
ntri
es f
rom
the
full
sam
ple
of f
irm
s w
hile
spe
cifi
cati
ons
(5)
to (
9) e
xclu
de th
e co
untr
ies
from
a r
educ
ed s
ampl
e w
hich
doe
s no
t inc
lude
fir
ms
repo
rtin
g ve
ry h
igh(
/low
) gr
owth
rat
es (
>+/
-100
%).
All
regr
essi
ons
are
esti
mat
ed u
sing
cou
ntry
fix
ed e
ffec
ts w
ith
clus
tere
d st
anda
rd e
rror
s.
Sour
ce: A
utho
rs’
anal
ysis
bas
ed o
n da
ta d
escr
ibed
in th
e te
xt

46
Tab
le 6
: F
irm
Gro
wth
-Im
pact
of
Indi
vidu
al F
inan
cing
Obs
tacl
es
1
2 3
4 5
6 7
8 9
10
11
12
13
14
Fi
rm
Gro
wth
Fi
rm
Gro
wth
Fi
rm
Gro
wth
Fi
rm
Gro
wth
Fi
rm
Gro
wth
Fi
rm
Gro
wth
Fi
rm
Gro
wth
Fi
rm
Gro
wth
Fi
rm
Gro
wth
Fi
rm
Gro
wth
Fi
rm
Gro
wth
Fi
rm
Gro
wth
Fi
rm
Gro
wth
Fi
rm
Gro
wth
Con
stan
t 0.
180*
**
0.17
2***
0.
211*
**
0.13
2***
0.
166*
**
0.15
8***
0.
129*
**
0.12
9***
0.
106*
**
0.12
2***
0.
121*
**
0.09
4***
0.
264*
**
0.21
2***
(0
.031
) (0
.029
) (0
.033
) (0
.030
) (0
.034
) (0
.028
) (0
.040
) (0
.039
) (0
.034
) (0
.036
) (0
.039
) (0
.032
) (0
.040
) (0
.048
)
Firm
Siz
e 0.
003
0.00
4 0.
004
0.00
5 0.
004
0.00
4 0.
004
0.00
5 0.
005*
0.
004
0.00
5*
0.00
6*
0.00
2 0.
005
(0
.003
) (0
.002
) (0
.003
) (0
.003
) (0
.003
) (0
.003
) (0
.003
) (0
.003
) (0
.003
) (0
.003
) (0
.003
) (0
.003
) (0
.003
) (0
.003
)
Col
late
ral
-0.0
23**
*
-0.0
06
-0.0
08
(0
.007
)
(0.0
10)
(0.0
11)
Pape
rwor
k
-0.0
25**
*
-0
.010
-0
.015
(0
.009
)
(0
.010
) (0
.011
) H
igh
Inte
rest
R
ates
-0
.032
***
-0
.020
* -0
.011
(0
.010
)
(0.0
11)
(0.0
12)
Spec
ial
Con
nect
ions
-0.0
15**
-0
.001
-0
.002
(0
.007
)
(0
.010
) (0
.014
) L
ack
Mon
ey
to le
nd
-0.0
24**
*
-0.0
11
-0.0
07
(0
.008
)
(0.0
09)
(0.0
12)
Lea
se
Fina
nce
-0
.015
(0
.009
)
A
cces
s to
fo
reig
n ba
nks
-0.0
02
(0
.007
)
Acc
ess
to
non-
bank
eq
uity
-0.0
05
(0.0
08)
Exp
ort
Fina
nce
0.00
4
(0
.009
)
Cre
dit
0.
003
(0.0
07)
Lon
g T
erm
L
oans
-0
.008
(0
.008
)

47
1
2 3
4 5
6 7
8 9
10
11
12
13
14
Fi
rm
Gro
wth
Fi
rm
Gro
wth
Fi
rm
Gro
wth
Fi
rm
Gro
wth
Fi
rm
Gro
wth
Fi
rm
Gro
wth
Fi
rm
Gro
wth
Fi
rm
Gro
wth
Fi
rm
Gro
wth
Fi
rm
Gro
wth
Fi
rm
Gro
wth
Fi
rm
Gro
wth
Fi
rm
Gro
wth
Fi
rm
Gro
wth
Fi
nanc
ing
Res
idua
l
-0.0
22**
-0.0
23**
(0.0
11)
(0
.011
)
N
6024
61
33
6298
60
02
5808
50
76
5093
50
37
4440
53
32
5030
29
88
5317
29
88
NC
ount
ries
79
79
79
79
79
78
78
78
78
78
60
58
79
58
Adj
. R-s
q 0.
070
0.06
9 0.
070
0.06
4 0.
074
0.07
0 0.
065
0.07
0 0.
071
0.07
2 0.
068
0.00
6 0.
071
0.06
5 *
, **,
and
***
indi
cate
sig
nifi
canc
e le
vels
of
10, 5
, and
1 p
erce
nt r
espe
ctiv
ely
Not
e: T
he r
egre
ssio
n eq
uatio
n es
tim
ated
is:
Fir
m G
row
th =
α +
β1
Size
+ β
2 C
olla
tera
l +
β3P
aper
wor
k +
β4H
igh
Inte
rest
Rat
es +
β5
Spec
ial
Con
nect
ions
+ β
6 L
ack
mon
ey t
o le
nd+
β7
Acc
ess
to f
orei
gn
bank
s +
β8
Acc
ess
to n
on-b
ank
equi
ty+
β9 E
xpor
t fi
nanc
e +
β10
Lea
se f
inan
ce +
β11
Cre
dit +
β12
Lon
g T
erm
Loa
ns +
β13
(Res
idua
l). T
he v
aria
bles
are
des
crib
ed a
s fo
llow
s: F
irm
Gro
wth
is
the
perc
enta
ge
incr
ease
in
firm
sal
es o
ver
the
past
thr
ee y
ears
. Fir
m S
ize
is t
he L
og o
f Sa
les.
Col
late
ral,
Pape
rwor
k, H
igh
Inte
rest
Rat
es, S
peci
al C
onne
ctio
ns, L
ack
mon
ey t
o le
nd, A
cces
s to
for
eign
ban
ks, A
cces
s to
no
n-ba
nk e
quit
y, E
xpor
t fi
nanc
e, L
ease
fin
ance
, Cre
dit,
Lon
g T
erm
Loa
ns a
re i
ndiv
idua
l fi
nanc
ing
obst
acle
s as
ind
icat
ed i
n th
e fi
rm q
uest
ionn
aire
. T
hey
take
val
ues
1 to
4,
wit
h w
here
1 i
ndic
ates
no
obst
acle
and
4 in
dica
tes
maj
or o
bsta
cle.
In
spec
ific
atio
ns (
1) t
o (1
1), e
ach
of t
he o
bsta
cle
vari
able
s is
incl
uded
indi
vidu
ally
. Res
idua
l is
the
resi
dual
fro
m a
reg
ress
ion
of t
he G
ener
al F
inan
cing
Obs
tacl
e on
all
the
indi
vidu
al f
inan
cing
obs
tacl
es.
Spec
ific
atio
n 13
inc
lude
s C
olla
tera
l, Pa
perw
ork,
Hig
h In
tere
st R
ates
, Sp
ecia
l C
onne
ctio
ns,
Lac
k m
oney
to
lend
, an
d L
ease
Fin
ance
. Sp
ecif
icat
ions
12
and
14
incl
ude
the
Fina
ncin
g R
esid
ual.
All
regr
essi
ons
are
esti
mat
ed u
sing
cou
ntry
fix
ed e
ffec
ts w
ith
clus
tere
d st
anda
rd e
rror
s.
Sour
ce: A
utho
rs’
anal
ysis
bas
ed o
n da
ta d
escr
ibed
in th
e te
xt.