How has globalisation affected emerging market · 2018-12-19 · BIS Papers No 100 27 How has...
29
BIS Papers No 100 27 How has globalisation affected emerging market economies? Yavuz Arslan, Juan Contreras, Nikhil Patel, Chang Shu Abstract This paper analyses various facets of the economic impact of globalisation in EMEs, focussing in particular on international trade and migration. It covers both aggregate (growth and inflation) and distributional (inequality, sectoral concentration) effects. The paper concludes with a discussion of policy implications that can be drawn from the analysis, and the possible risk of de-globalisation given the recent backlash against globalisation in various parts of the world. Keywords: Globalisation, growth, sectoral concentration, inequality, migration. JEL classification: F6
Transcript of How has globalisation affected emerging market · 2018-12-19 · BIS Papers No 100 27 How has...
BIS Papers No 100 27
How has globalisation affected emerging market economies?
Yavuz Arslan, Juan Contreras, Nikhil Patel, Chang Shu
Abstract
This paper analyses various facets of the economic impact of globalisation in EMEs, focussing in particular on international trade and migration. It covers both aggregate (growth and inflation) and distributional (inequality, sectoral concentration) effects. The paper concludes with a discussion of policy implications that can be drawn from the analysis, and the possible risk of de-globalisation given the recent backlash against globalisation in various parts of the world.
Keywords: Globalisation, growth, sectoral concentration, inequality, migration.
JEL classification: F6
28 BIS Papers No 100
1. Introduction
The world economy has become much more integrated since the Second World War, during the second wave of globalisation (BIS (2017)). This process has profoundly affected people’s lives, in that globalisation is widely considered to have supported the strong income growth and significant poverty reduction of recent decades, especially in emerging market economies (EMEs). Globalisation, in particular tighter trade linkages, has also helped improve social conditions more broadly, such as by narrowing gender wage gaps (Black and Brainerd (2004)), and it may have contributed to a reduction in inter-state wars (Lee and Pyun (2008)).
Despite these benefits, there has been a backlash against globalisation and a greater support for inward-looking policies in several developed countries. And in many EMEs, globalisation has attracted a fair share of criticism. What explains this? Has the number of those perceiving themselves as losers from globalisation grown? Indeed, even the theoretical frameworks that show unambiguous gains from globalisation imply that there can be losers.1
This note analyses how globalisation has affected EMEs. The next section discusses selected macroeconomic implications. Section 3 explores some of the distributional consequences, seeking to identify which segments of the population have gained and which have not. Section 4 considers the impact of trends in migration on EMEs’ human capital. The last discusses policy challenges emanating from globalisation and how certain EMEs have responded.
Movements of goods, finance and people associated with globalisation have transformed the world economy over the past few decades. However, as financial aspects have been recently covered elsewhere, this note focuses primarily on the rise of trade linkages and migration and how this relates to output and prices.2
2. Globalisation and macroeconomic dynamics in EMEs
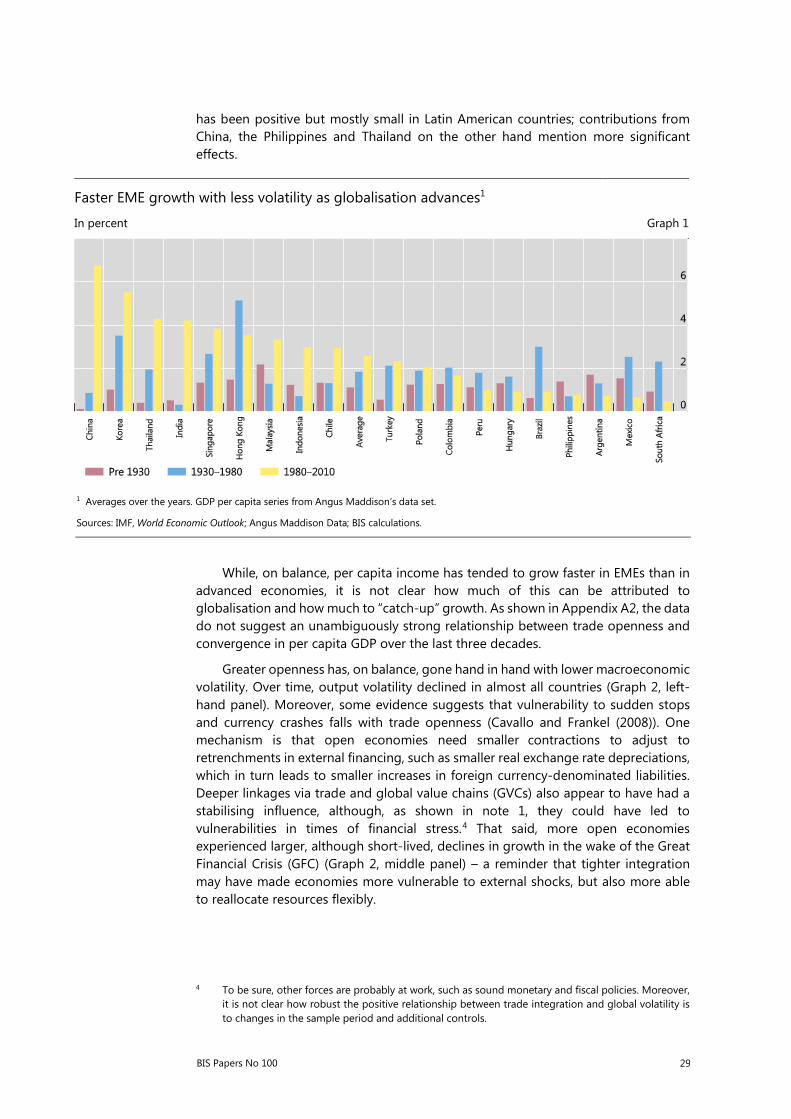
Several trends indicate that trade openness has coincided with better macroeconomic performance in many EMEs. Output growth accelerated from the 1980s alongside rapidly expanding trade (Graph 1). Indeed, growth regressions estimated on a panel of EMEs find that trade openness is associated with higher GDP growth (Annex Table A1).3 Country contributions for this meeting also broadly confirm that globalisation has boosted growth. But the experience varies greatly across countries and time. The notes by Argentina and Brazil indicate that the impact of trade openness on growth
1 See for instance Rodrik (2017) and Antràs et al (2016). In particular, according to the Stolper-
Samuelson theorem, an increase in the relative price of a good brings about a concomitant increase in the return to the factor used most intensively in its production and, conversely, a fall in the return to the other factor. That would imply, for example, that the wages of unskilled labour will tend to fall in developed economies as a result of more intensive trade with less developed ones.
2 See BIS, 87th Annual Report, 2017, Chapter VI for an overview of the financial facets and a discussion of the interconnections between the real and financial aspects of globalisation. For a discussion of financial aspects of globalisation in EMEs, see the conference volumes for the meeting of deputy governors from major emerging market economies on “Foreign exchange intervention by emerging market economies: issues and implications” (2003) and ”The influence of external factors on monetary policy frameworks and operations” (2011).
3 See Dreher (2006) for a more comprehensive analysis based on 123 countries.
BIS Papers No 100 29
has been positive but mostly small in Latin American countries; contributions from China, the Philippines and Thailand on the other hand mention more significant effects.
1 Averages over the years. GDP per capita series from Angus Maddison’s data set.
Sources: IMF, World Economic Outlook; Angus Maddison Data; BIS calculations.
While, on balance, per capita income has tended to grow faster in EMEs than in advanced economies, it is not clear how much of this can be attributed to globalisation and how much to “catch-up” growth. As shown in Appendix A2, the data do not suggest an unambiguously strong relationship between trade openness and convergence in per capita GDP over the last three decades.
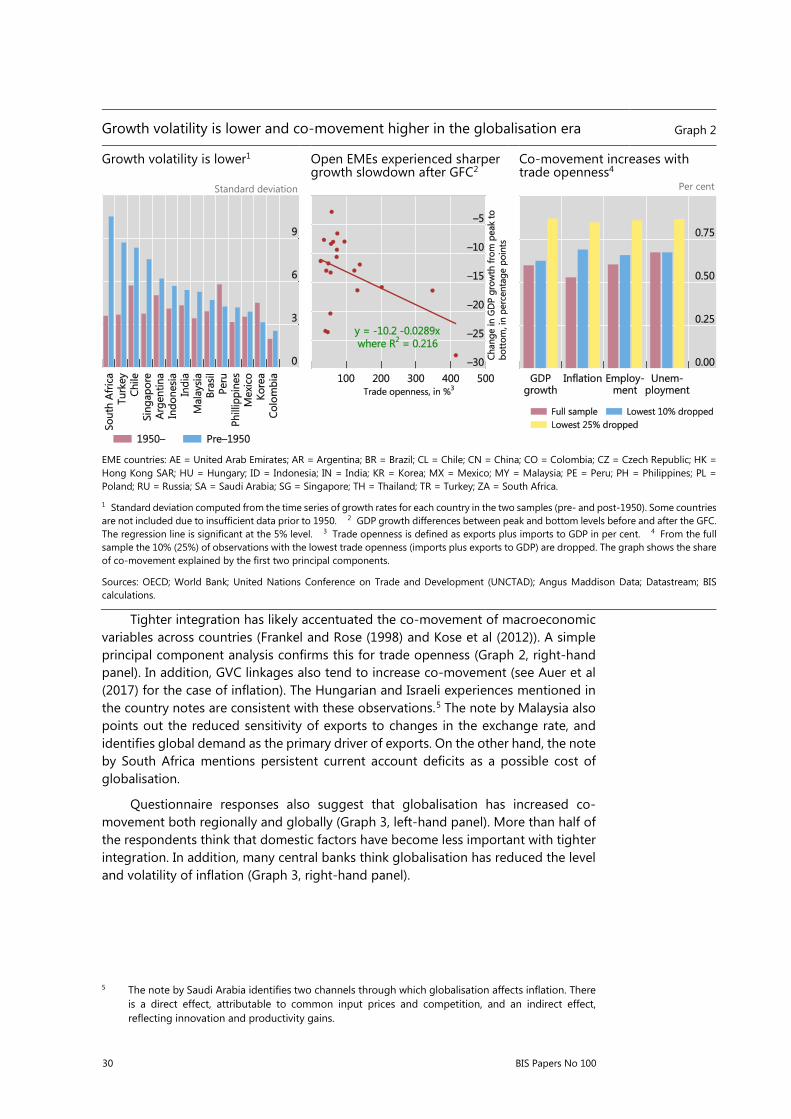
Greater openness has, on balance, gone hand in hand with lower macroeconomic volatility. Over time, output volatility declined in almost all countries (Graph 2, left-hand panel). Moreover, some evidence suggests that vulnerability to sudden stops and currency crashes falls with trade openness (Cavallo and Frankel (2008)). One mechanism is that open economies need smaller contractions to adjust to
retrenchments in external financing, such as smaller real exchange rate depreciations, which in turn leads to smaller increases in foreign currency-denominated liabilities. Deeper linkages via trade and global value chains (GVCs) also appear to have had a stabilising influence, although, as shown in note 1, they could have led to vulnerabilities in times of financial stress.4 That said, more open economies experienced larger, although short-lived, declines in growth in the wake of the Great Financial Crisis (GFC) (Graph 2, middle panel) – a reminder that tighter integration may have made economies more vulnerable to external shocks, but also more able to reallocate resources flexibly.
4 To be sure, other forces are probably at work, such as sound monetary and fiscal policies. Moreover,
it is not clear how robust the positive relationship between trade integration and global volatility is to changes in the sample period and additional controls.
Faster EME growth with less volatility as globalisation advances1
In percent Graph 1
30 BIS Papers No 100
Growth volatility is lower and co-movement higher in the globalisation era Graph 2
Growth volatility is lower1
Standard deviation
Open EMEs experienced sharper growth slowdown after GFC2
Co-movement increases with trade openness4
Per cent
EME countries: AE = United Arab Emirates; AR = Argentina; BR = Brazil; CL = Chile; CN = China; CO = Colombia; CZ = Czech Republic; HK = Hong Kong SAR; HU = Hungary; ID = Indonesia; IN = India; KR = Korea; MX = Mexico; MY = Malaysia; PE = Peru; PH = Philippines; PL = Poland; RU = Russia; SA = Saudi Arabia; SG = Singapore; TH = Thailand; TR = Turkey; ZA = South Africa.
1 Standard deviation computed from the time series of growth rates for each country in the two samples (pre- and post-1950). Some countries are not included due to insufficient data prior to 1950. 2 GDP growth differences between peak and bottom levels before and after the GFC. The regression line is significant at the 5% level. 3 Trade openness is defined as exports plus imports to GDP in per cent. 4 From the full sample the 10% (25%) of observations with the lowest trade openness (imports plus exports to GDP) are dropped. The graph shows the share of co-movement explained by the first two principal components.
Sources: OECD; World Bank; United Nations Conference on Trade and Development (UNCTAD); Angus Maddison Data; Datastream; BIS calculations.
Tighter integration has likely accentuated the co-movement of macroeconomic variables across countries (Frankel and Rose (1998) and Kose et al (2012)). A simple principal component analysis confirms this for trade openness (Graph 2, right-hand panel). In addition, GVC linkages also tend to increase co-movement (see Auer et al (2017) for the case of inflation). The Hungarian and Israeli experiences mentioned in the country notes are consistent with these observations.5 The note by Malaysia also points out the reduced sensitivity of exports to changes in the exchange rate, and identifies global demand as the primary driver of exports. On the other hand, the note by South Africa mentions persistent current account deficits as a possible cost of globalisation.
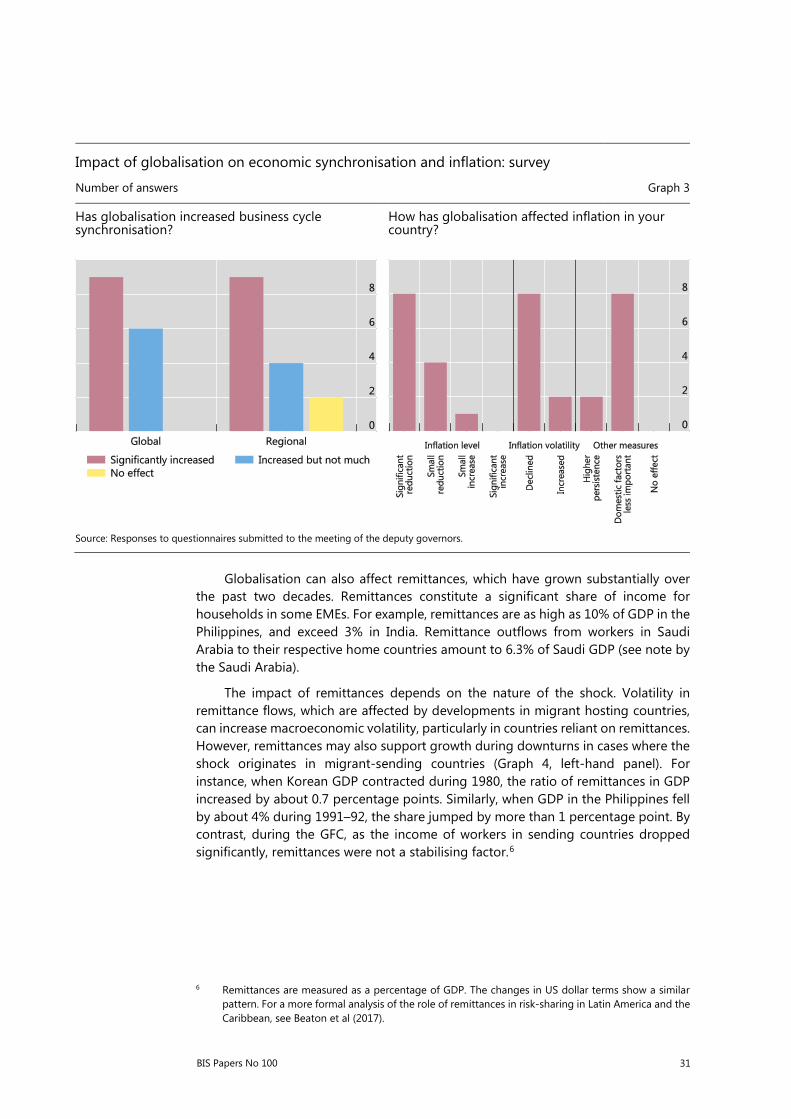
Questionnaire responses also suggest that globalisation has increased co-movement both regionally and globally (Graph 3, left-hand panel). More than half of the respondents think that domestic factors have become less important with tighter integration. In addition, many central banks think globalisation has reduced the level and volatility of inflation (Graph 3, right-hand panel).
5 The note by Saudi Arabia identifies two channels through which globalisation affects inflation. There
is a direct effect, attributable to common input prices and competition, and an indirect effect, reflecting innovation and productivity gains.
BIS Papers No 100 31
Globalisation can also affect remittances, which have grown substantially over the past two decades. Remittances constitute a significant share of income for households in some EMEs. For example, remittances are as high as 10% of GDP in the Philippines, and exceed 3% in India. Remittance outflows from workers in Saudi Arabia to their respective home countries amount to 6.3% of Saudi GDP (see note by the Saudi Arabia).
The impact of remittances depends on the nature of the shock. Volatility in remittance flows, which are affected by developments in migrant hosting countries, can increase macroeconomic volatility, particularly in countries reliant on remittances. However, remittances may also support growth during downturns in cases where the shock originates in migrant-sending countries (Graph 4, left-hand panel). For instance, when Korean GDP contracted during 1980, the ratio of remittances in GDP increased by about 0.7 percentage points. Similarly, when GDP in the Philippines fell by about 4% during 1991–92, the share jumped by more than 1 percentage point. By contrast, during the GFC, as the income of workers in sending countries dropped significantly, remittances were not a stabilising factor.6
6 Remittances are measured as a percentage of GDP. The changes in US dollar terms show a similar
pattern. For a more formal analysis of the role of remittances in risk-sharing in Latin America and the Caribbean, see Beaton et al (2017).
Impact of globalisation on economic synchronisation and inflation: survey
Number of answers Graph 3
Has globalisation increased business cycle synchronisation?
How has globalisation affected inflation in your country?
Source: Responses to questionnaires submitted to the meeting of the deputy governors.

32 BIS Papers No 100
Some costs and benefits of globalisation Graph 4
Remittances buffer GDP during major downturns1
Change in GDP share Carbon dioxide emissions increase with trade
openness3
Countries included: AE, AR, BR, CL, CN, CO, CZ, HK, HU, ID, IN, KR, MX, MY, PE, PH, PL, RU, SA, SG, TH, TR and ZA (see footnote in Graph 1 for country codes). For some panels, a subset of these countries is included due to data availability.
1 In most cases, remittances (as a share of GDP) during the crisis were subtracted from the two-year average of the preceding period. If there is only one year separating two downturns, the change compared with the preceding year (instead of the two-year average) is plotted. For the Asian crisis and the GFC, the average changes across affected countries are used. 2 Trade openness is defined as exports plus imports to GDP in percent. 3 CO2 emissions measured in kilotonnes. The regression line is significant at the 5% level.
Sources: World Bank; Datastream; national data; BIS calculations.
At the same time, globalisation has coincided with some challenging environmental trends.7 The increased weight of the tradable sector appears to have coincided with an increase in the share of energy-intensive manufacturing sectors, which, in turn, has brought greater environmental risks. There is a tight link between trade openness and carbon dioxide emissions (Graph 4, right-hand panel). And this relationship remains statistically significant even after controlling for GDP growth.
7 Local environmental risks are probably higher than the global risks. Gases such as carbon dioxide
diffuse rapidly in the atmosphere but solid and liquid wastes remain local. Relatively less environmentally friendly production technologies, environmental emissions due to transportation and more production due to cheap labour may increase environmental risks globally.

BIS Papers No 100 33
Sectoral impact
The sectoral composition of economic activity in EMEs has changed considerably over the last 40 years. The share of services in GDP has risen by 15 percentage points on average and that of agriculture has fallen to the same extent. Manufacturing has remained relatively stable at around 33%.8 As the economist Simon Kuznets pointed out, sectoral transformation naturally accompanies economic development (Kuznets (1971)). Globalisation may have accelerated this process. For example, the share of employment in industry and services increased while agriculture’s share declined more sharply in those EMEs where trade barriers fell more (Graph 5). Not surprisingly, the decline in agricultural employment coincided with rising urbanisation and female labour force participation rates (Graph 6).
8 These averages hide large cross-country differences. For instance, in Korea and Thailand the share of
manufacturing in GDP increased by more than 10 percentage points between 1970 and 2016, reaching 36%. In China, it rose from well over 40% in 1970 to a peak of 47% in 2006, before declining below 40%. In Latin America, it fell by more than 10 percentage points in Argentina, Brazil and Chile but remained relatively stable in Colombia, Mexico and Peru. The changes in employment shares have been larger than those in value added. On average, the share of agricultural employment declined by more than 20 percentage points, that of services rose by more than 20 percentage points, while industrial employment remained stable. However, there is cross-country variation: the share of employment in manufacturing increased in China, Korea, and Thailand but decreased elsewhere.
Decline in trade barriers coincides with sectoral change Graph 5
Lower trade barriers, higher industry employment share1
Lower trade barriers, higher services employment share1
Lower trade barriers, lower agricultural employment share1
Countries included: AR, BR, CL, CN, CO, CZ, HK, HU, ID, IN, KR, MX, MY, PE, PH, PL, RU, SG, TH, TR and ZA (see footnote in Graph 2 for country codes).
1 The regression line is significant at the 1% level. 2 Average tariff in a country.
Sources: OECD; United Nations Conference on Trade and Development (UNCTAD); World Bank; World Trade Organization; Datastream; BIS calculations.
34 BIS Papers No 100
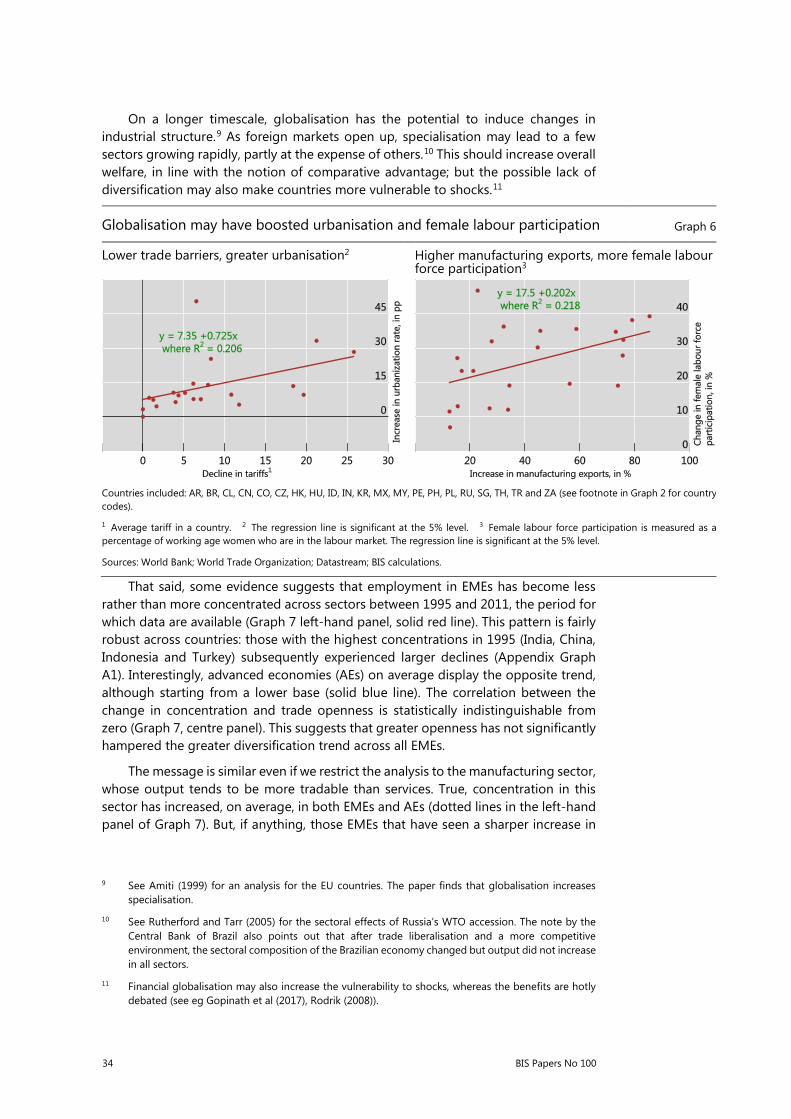
On a longer timescale, globalisation has the potential to induce changes in industrial structure.9 As foreign markets open up, specialisation may lead to a few sectors growing rapidly, partly at the expense of others.10 This should increase overall welfare, in line with the notion of comparative advantage; but the possible lack of diversification may also make countries more vulnerable to shocks.11
Globalisation may have boosted urbanisation and female labour participation Graph 6
Lower trade barriers, greater urbanisation2 Higher manufacturing exports, more female labour force participation3
Countries included: AR, BR, CL, CN, CO, CZ, HK, HU, ID, IN, KR, MX, MY, PE, PH, PL, RU, SG, TH, TR and ZA (see footnote in Graph 2 for country codes).
1 Average tariff in a country. 2 The regression line is significant at the 5% level. 3 Female labour force participation is measured as a percentage of working age women who are in the labour market. The regression line is significant at the 5% level.
Sources: World Bank; World Trade Organization; Datastream; BIS calculations.
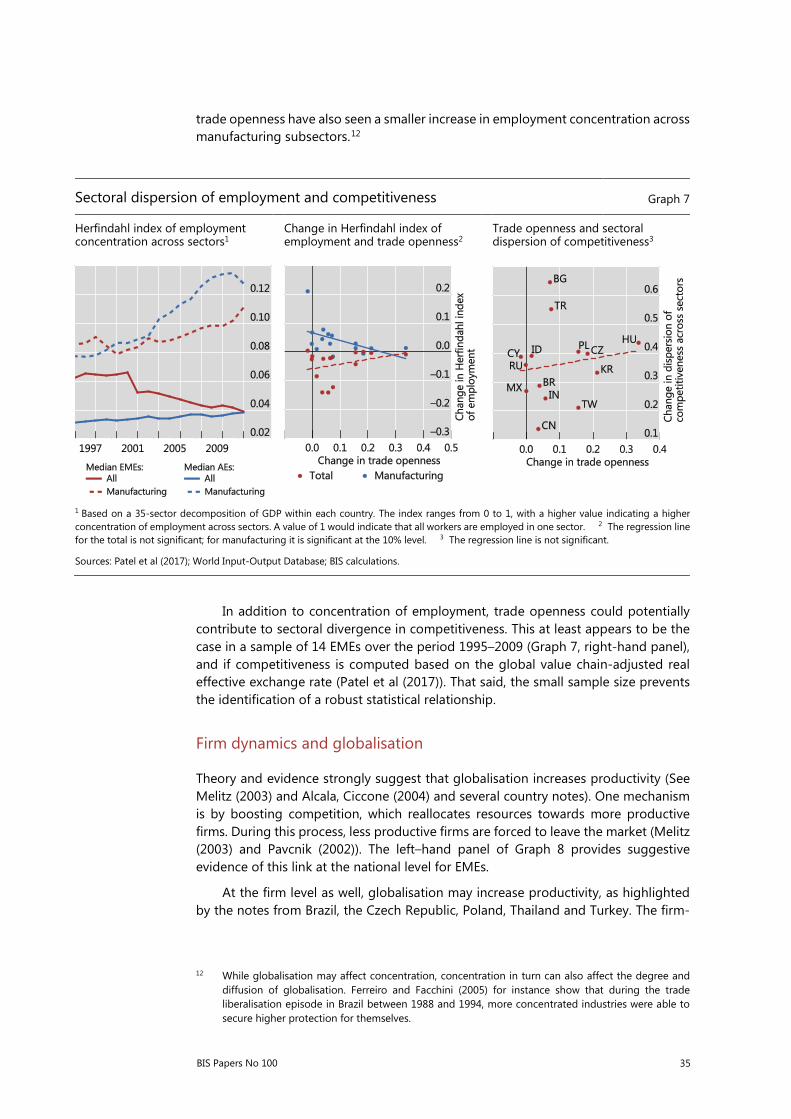
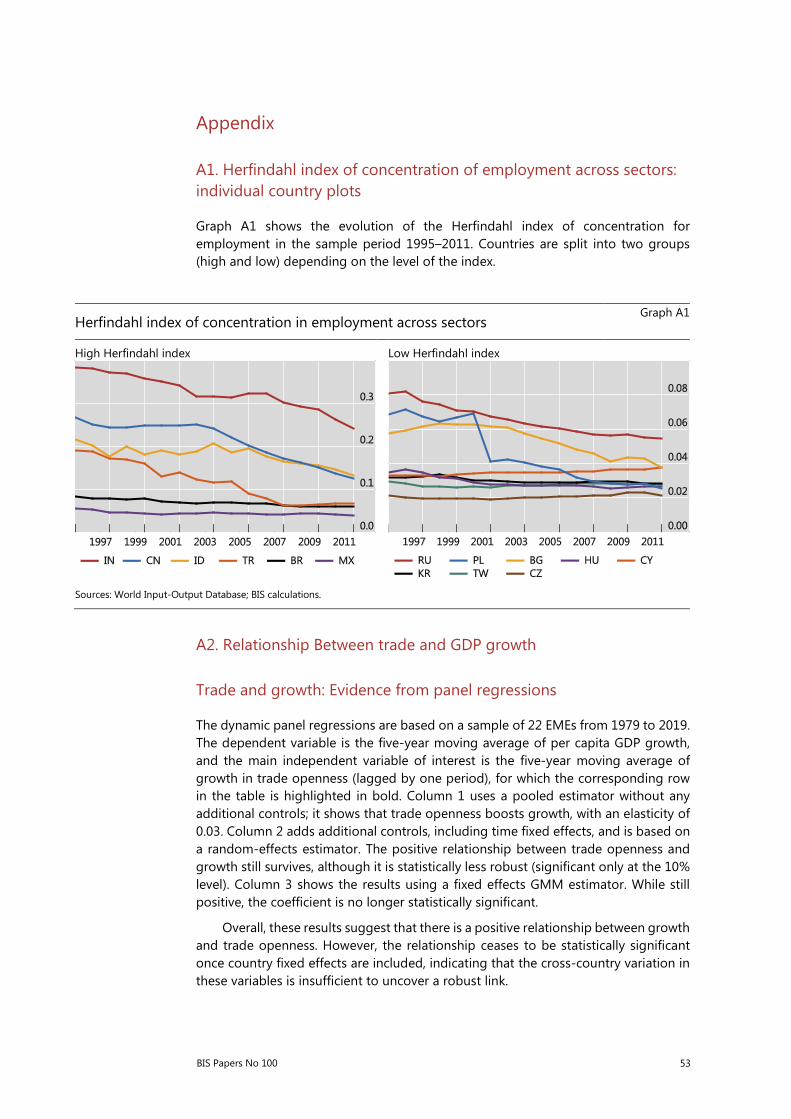
That said, some evidence suggests that employment in EMEs has become less rather than more concentrated across sectors between 1995 and 2011, the period for which data are available (Graph 7 left-hand panel, solid red line). This pattern is fairly robust across countries: those with the highest concentrations in 1995 (India, China, Indonesia and Turkey) subsequently experienced larger declines (Appendix Graph A1). Interestingly, advanced economies (AEs) on average display the opposite trend, although starting from a lower base (solid blue line). The correlation between the change in concentration and trade openness is statistically indistinguishable from zero (Graph 7, centre panel). This suggests that greater openness has not significantly hampered the greater diversification trend across all EMEs.
The message is similar even if we restrict the analysis to the manufacturing sector, whose output tends to be more tradable than services. True, concentration in this sector has increased, on average, in both EMEs and AEs (dotted lines in the left-hand panel of Graph 7). But, if anything, those EMEs that have seen a sharper increase in
9 See Amiti (1999) for an analysis for the EU countries. The paper finds that globalisation increases
specialisation.
10 See Rutherford and Tarr (2005) for the sectoral effects of Russia’s WTO accession. The note by the Central Bank of Brazil also points out that after trade liberalisation and a more competitive environment, the sectoral composition of the Brazilian economy changed but output did not increase in all sectors.
11 Financial globalisation may also increase the vulnerability to shocks, whereas the benefits are hotly debated (see eg Gopinath et al (2017), Rodrik (2008)).
BIS Papers No 100 35
trade openness have also seen a smaller increase in employment concentration across manufacturing subsectors.12
Sectoral dispersion of employment and competitiveness Graph 7
Herfindahl index of employment concentration across sectors1
Change in Herfindahl index of employment and trade openness2
Trade openness and sectoral dispersion of competitiveness3
1 Based on a 35-sector decomposition of GDP within each country. The index ranges from 0 to 1, with a higher value indicating a higher concentration of employment across sectors. A value of 1 would indicate that all workers are employed in one sector. 2 The regression line for the total is not significant; for manufacturing it is significant at the 10% level. 3 The regression line is not significant.
Sources: Patel et al (2017); World Input-Output Database; BIS calculations.
In addition to concentration of employment, trade openness could potentially contribute to sectoral divergence in competitiveness. This at least appears to be the case in a sample of 14 EMEs over the period 1995–2009 (Graph 7, right-hand panel), and if competitiveness is computed based on the global value chain-adjusted real effective exchange rate (Patel et al (2017)). That said, the small sample size prevents the identification of a robust statistical relationship.
Firm dynamics and globalisation
Theory and evidence strongly suggest that globalisation increases productivity (See Melitz (2003) and Alcala, Ciccone (2004) and several country notes). One mechanism is by boosting competition, which reallocates resources towards more productive firms. During this process, less productive firms are forced to leave the market (Melitz (2003) and Pavcnik (2002)). The left–hand panel of Graph 8 provides suggestive evidence of this link at the national level for EMEs.
At the firm level as well, globalisation may increase productivity, as highlighted by the notes from Brazil, the Czech Republic, Poland, Thailand and Turkey. The firm-
12 While globalisation may affect concentration, concentration in turn can also affect the degree and
diffusion of globalisation. Ferreiro and Facchini (2005) for instance show that during the trade liberalisation episode in Brazil between 1988 and 1994, more concentrated industries were able to secure higher protection for themselves.

36 BIS Papers No 100
level analysis in Polish note shows that internationalised firms perform better than the rest, through both exporting and foreign ownership. The note by the Czech Republic undertakes a meta-analysis and concludes that a 10-percentage point increase in foreign presence is likely to lift the productivity of domestic firms by 11%. The effect is even larger for joint ventures, reaching 19%.
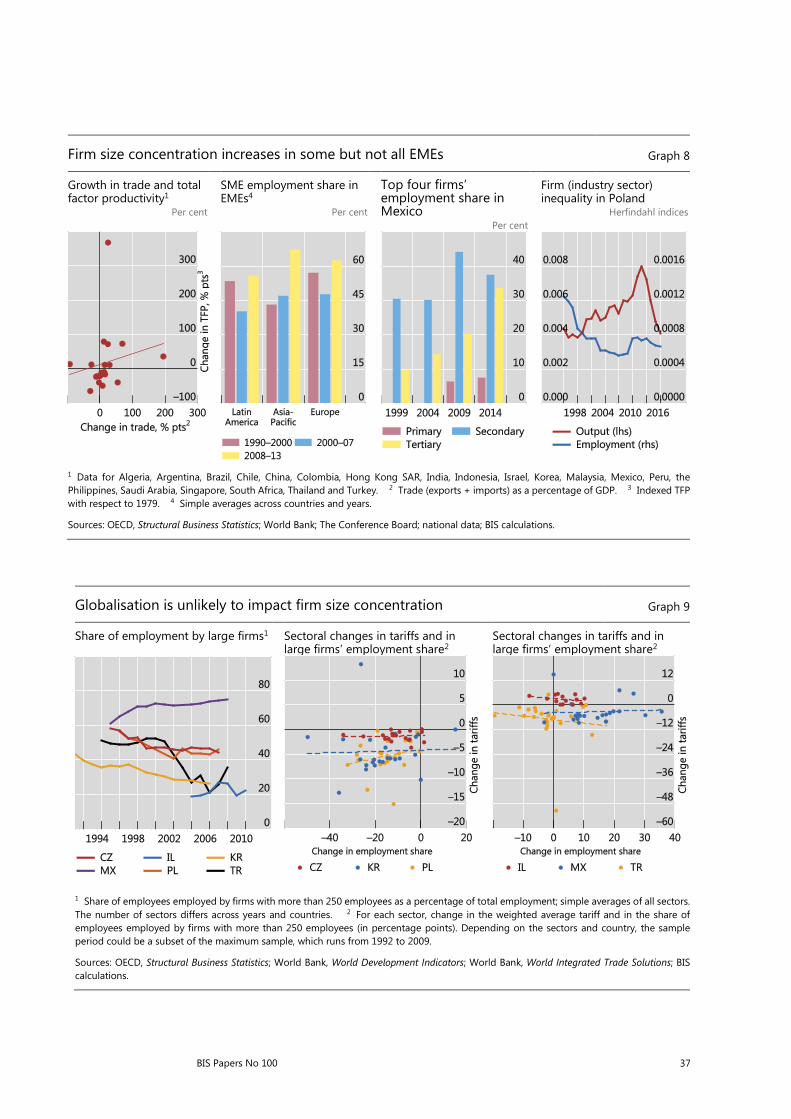
As a downside risk, globalisation may increase firm size concentration, benefiting larger firms at the expense of smaller ones.13 This is in part because access to a larger market allows firms to benefit from economies of both scale and scope, as offshoring and allocating production in multiple locations increases productivity. This, in turn, manifests itself in lower prices, increasing quality and product diversification (Schwörer (2013) and Constantinescu et al (2017)). While good for consumers, the transition may be painful for many smaller firms and their employees. Furthermore, in the long term, greater firm concentration may even harm productivity and growth by decreasing incentives for firms to invest due to lack of competition (Gutierrez and Philippon (2017)).
However, available data do not suggest a stark increase in firm size concentration.14 For example, while the share of employment in small and medium-sized enterprises (SMEs) decreased in EMEs in Latin America and Europe from the 1990s to the early 2000s, it increased post-GFC (Graph 8, second panel).15 Moreover, the SME share of employment share has been increasing in Asia-Pacific EMEs since the 1990s. And, other than in Mexico, the employment share of large firms has been declining in the EMEs for which data is available (Graph 9, left-hand panel). In Mexico, the share of employment in the top four firms (by employment) increased across sectors (Graph 8 third panel). In Poland, firm concentration, measured by Herfindahl indices, has been declining for employment but increasing for output (Graph 8, right-hand panel).
While firm inequality has not increased considerably in many EMEs, globalisation may have prevented a more equal size distribution. One way to analyse this channel is to examine whether sectors facing larger tariff declines experienced larger increases (or smaller declines) in the employment share of large firms.16 Graph 9 (centre and right-hand panels) shows that there is no such relationship in the data, suggesting that it is unlikely that globalisation has had a large impact.
13 Mechanisms outlined in Melitz (2003) would imply these dynamics. More highly productive firms are
likely to be bigger and to gain more from trade.
14 See ERIA Research Project Report (2013) for country-level evidence.
15 Employment is used as the measure of firm size.
16 Lower tariffs boost globalisation and may thus affect firm concentration.
BIS Papers No 100 37
Firm size concentration increases in some but not all EMEs Graph 8
Growth in trade and total factor productivity1
Per cent
SME employment share in EMEs4
Per cent
Top four firms’ employment share in Mexico
Per cent
Firm (industry sector) inequality in Poland
Herfindahl indices
1 Data for Algeria, Argentina, Brazil, Chile, China, Colombia, Hong Kong SAR, India, Indonesia, Israel, Korea, Malaysia, Mexico, Peru, the Philippines, Saudi Arabia, Singapore, South Africa, Thailand and Turkey. 2 Trade (exports + imports) as a percentage of GDP. 3 Indexed TFP with respect to 1979. 4 Simple averages across countries and years.
Sources: OECD, Structural Business Statistics; World Bank; The Conference Board; national data; BIS calculations.
Globalisation is unlikely to impact firm size concentration Graph 9
Share of employment by large firms1 Sectoral changes in tariffs and in large firms’ employment share2
Sectoral changes in tariffs and in large firms’ employment share2
1 Share of employees employed by firms with more than 250 employees as a percentage of total employment; simple averages of all sectors. The number of sectors differs across years and countries. 2 For each sector, change in the weighted average tariff and in the share of employees employed by firms with more than 250 employees (in percentage points). Depending on the sectors and country, the sample period could be a subset of the maximum sample, which runs from 1992 to 2009.
Sources: OECD, Structural Business Statistics; World Bank, World Development Indicators; World Bank, World Integrated Trade Solutions; BIS calculations.
38 BIS Papers No 100
3. Income and consumption inequality
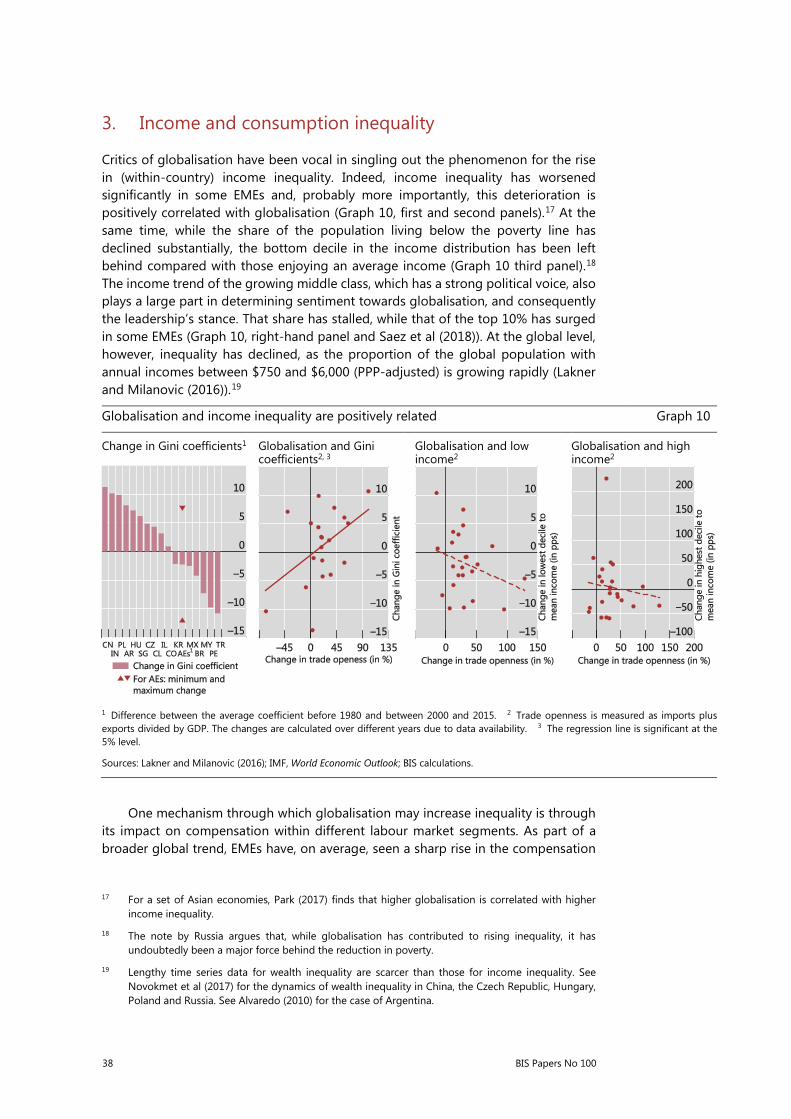
Critics of globalisation have been vocal in singling out the phenomenon for the rise in (within-country) income inequality. Indeed, income inequality has worsened significantly in some EMEs and, probably more importantly, this deterioration is positively correlated with globalisation (Graph 10, first and second panels).17 At the same time, while the share of the population living below the poverty line has declined substantially, the bottom decile in the income distribution has been left behind compared with those enjoying an average income (Graph 10 third panel).18 The income trend of the growing middle class, which has a strong political voice, also plays a large part in determining sentiment towards globalisation, and consequently the leadership’s stance. That share has stalled, while that of the top 10% has surged in some EMEs (Graph 10, right-hand panel and Saez et al (2018)). At the global level, however, inequality has declined, as the proportion of the global population with annual incomes between $750 and $6,000 (PPP-adjusted) is growing rapidly (Lakner and Milanovic (2016)).19
Globalisation and income inequality are positively related Graph 10
Change in Gini coefficients1 Globalisation and Gini coefficients2, 3
Globalisation and low income2
Globalisation and high income2
1 Difference between the average coefficient before 1980 and between 2000 and 2015. 2 Trade openness is measured as imports plus exports divided by GDP. The changes are calculated over different years due to data availability. 3 The regression line is significant at the 5% level.
Sources: Lakner and Milanovic (2016); IMF, World Economic Outlook; BIS calculations.
One mechanism through which globalisation may increase inequality is through its impact on compensation within different labour market segments. As part of a broader global trend, EMEs have, on average, seen a sharp rise in the compensation
17 For a set of Asian economies, Park (2017) finds that higher globalisation is correlated with higher
income inequality.
18 The note by Russia argues that, while globalisation has contributed to rising inequality, it has undoubtedly been a major force behind the reduction in poverty.
19 Lengthy time series data for wealth inequality are scarcer than those for income inequality. See Novokmet et al (2017) for the dynamics of wealth inequality in China, the Czech Republic, Hungary, Poland and Russia. See Alvaredo (2010) for the case of Argentina.
BIS Papers No 100 39
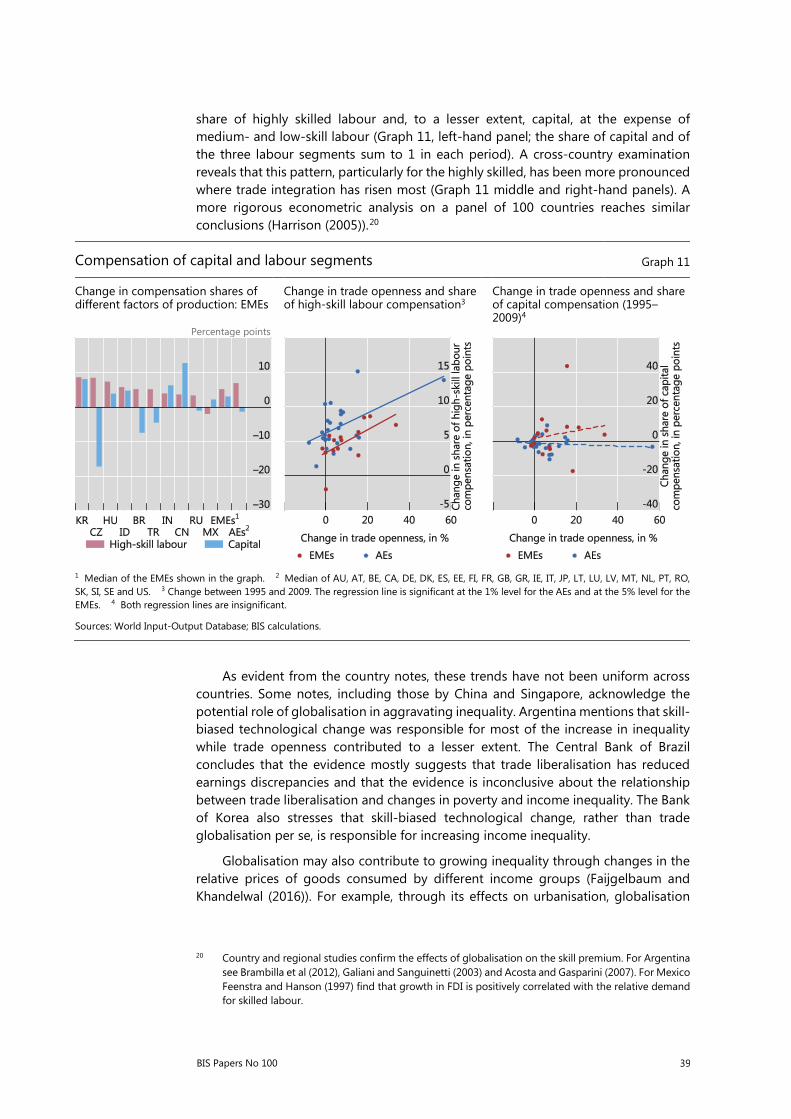
share of highly skilled labour and, to a lesser extent, capital, at the expense of medium- and low-skill labour (Graph 11, left-hand panel; the share of capital and of the three labour segments sum to 1 in each period). A cross-country examination reveals that this pattern, particularly for the highly skilled, has been more pronounced where trade integration has risen most (Graph 11 middle and right-hand panels). A more rigorous econometric analysis on a panel of 100 countries reaches similar conclusions (Harrison (2005)).20
As evident from the country notes, these trends have not been uniform across countries. Some notes, including those by China and Singapore, acknowledge the potential role of globalisation in aggravating inequality. Argentina mentions that skill-biased technological change was responsible for most of the increase in inequality while trade openness contributed to a lesser extent. The Central Bank of Brazil concludes that the evidence mostly suggests that trade liberalisation has reduced earnings discrepancies and that the evidence is inconclusive about the relationship between trade liberalisation and changes in poverty and income inequality. The Bank of Korea also stresses that skill-biased technological change, rather than trade globalisation per se, is responsible for increasing income inequality.
Globalisation may also contribute to growing inequality through changes in the relative prices of goods consumed by different income groups (Faijgelbaum and Khandelwal (2016)). For example, through its effects on urbanisation, globalisation
20 Country and regional studies confirm the effects of globalisation on the skill premium. For Argentina
see Brambilla et al (2012), Galiani and Sanguinetti (2003) and Acosta and Gasparini (2007). For Mexico Feenstra and Hanson (1997) find that growth in FDI is positively correlated with the relative demand for skilled labour.
Compensation of capital and labour segments Graph 11
Change in compensation shares of different factors of production: EMEs
Change in trade openness and share of high-skill labour compensation3
Change in trade openness and share of capital compensation (1995–2009)4
Percentage points
1 Median of the EMEs shown in the graph. 2 Median of AU, AT, BE, CA, DE, DK, ES, EE, FI, FR, GB, GR, IE, IT, JP, LT, LU, LV, MT, NL, PT, RO, SK, SI, SE and US. 3 Change between 1995 and 2009. The regression line is significant at the 1% level for the AEs and at the 5% level for the EMEs. 4 Both regression lines are insignificant.
Sources: World Input-Output Database; BIS calculations.
40 BIS Papers No 100
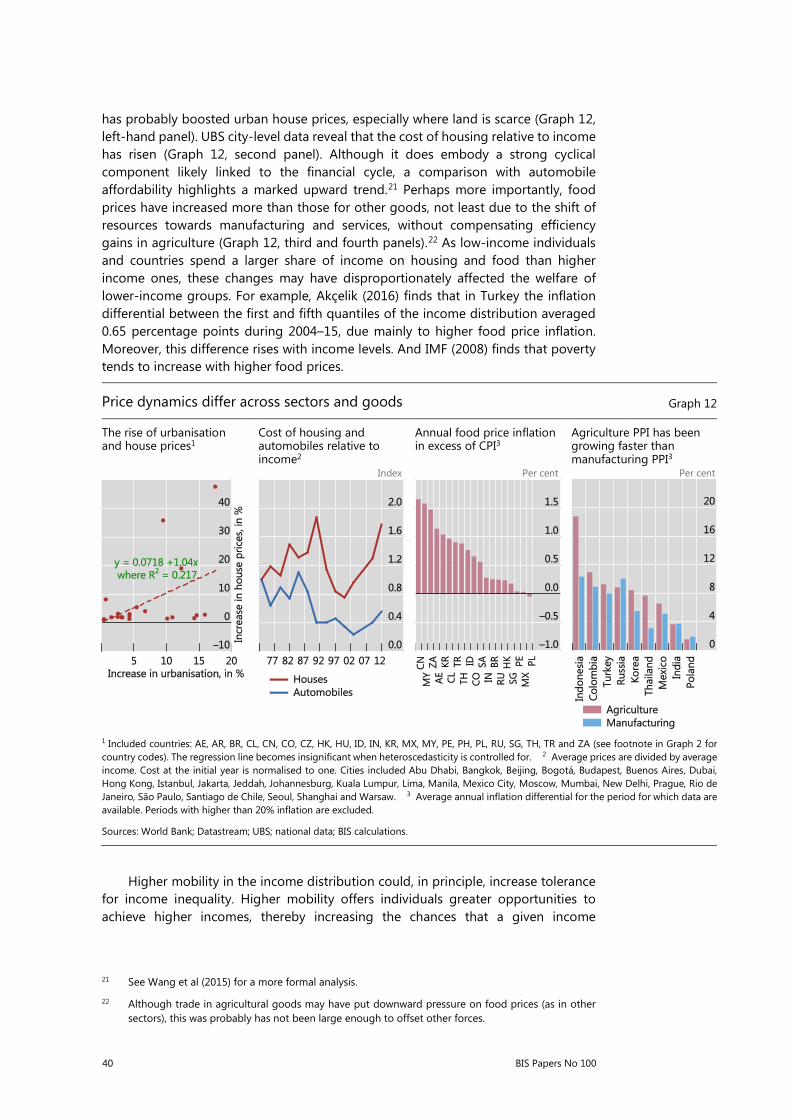
has probably boosted urban house prices, especially where land is scarce (Graph 12, left-hand panel). UBS city-level data reveal that the cost of housing relative to income has risen (Graph 12, second panel). Although it does embody a strong cyclical component likely linked to the financial cycle, a comparison with automobile affordability highlights a marked upward trend.21 Perhaps more importantly, food prices have increased more than those for other goods, not least due to the shift of resources towards manufacturing and services, without compensating efficiency gains in agriculture (Graph 12, third and fourth panels).22 As low-income individuals and countries spend a larger share of income on housing and food than higher income ones, these changes may have disproportionately affected the welfare of lower-income groups. For example, Akçelik (2016) finds that in Turkey the inflation differential between the first and fifth quantiles of the income distribution averaged 0.65 percentage points during 2004–15, due mainly to higher food price inflation. Moreover, this difference rises with income levels. And IMF (2008) finds that poverty tends to increase with higher food prices.
Price dynamics differ across sectors and goods Graph 12
The rise of urbanisation and house prices1
Cost of housing and automobiles relative to income2
Annual food price inflation in excess of CPI3
Agriculture PPI has been growing faster than manufacturing PPI3
Index Per cent Per cent
1 Included countries: AE, AR, BR, CL, CN, CO, CZ, HK, HU, ID, IN, KR, MX, MY, PE, PH, PL, RU, SG, TH, TR and ZA (see footnote in Graph 2 for country codes). The regression line becomes insignificant when heteroscedasticity is controlled for. 2 Average prices are divided by average income. Cost at the initial year is normalised to one. Cities included Abu Dhabi, Bangkok, Beijing, Bogotá, Budapest, Buenos Aires, Dubai, Hong Kong, Istanbul, Jakarta, Jeddah, Johannesburg, Kuala Lumpur, Lima, Manila, Mexico City, Moscow, Mumbai, New Delhi, Prague, Rio de Janeiro, São Paulo, Santiago de Chile, Seoul, Shanghai and Warsaw. 3 Average annual inflation differential for the period for which data are available. Periods with higher than 20% inflation are excluded.
Sources: World Bank; Datastream; UBS; national data; BIS calculations.
Higher mobility in the income distribution could, in principle, increase tolerance for income inequality. Higher mobility offers individuals greater opportunities to achieve higher incomes, thereby increasing the chances that a given income
21 See Wang et al (2015) for a more formal analysis. 22 Although trade in agricultural goods may have put downward pressure on food prices (as in other
sectors), this was probably has not been large enough to offset other forces.
BIS Papers No 100 41
distribution is perceived as fair. However, the data suggest that higher income inequality tends to be associated with greater inequality of opportunity and lower intergenerational economic mobility (Krueger (2012)). One reason could be that income inequality reduces opportunities for children from lower-income backgrounds to obtain education and skills (see also World Bank (2018)). This leads to a vicious circle in which higher income inequality and lower income mobility reinforce one another.
4. Effects of migration on human capital in EMEs
There are concerns that outward migration, particularly that of highly skilled workers, constitutes a “brain drain” for EMEs. Indeed, the migration of highly skilled workers, defined as those with a tertiary degree, has increased more rapidly than that of the less skilled. Growing by 170% between 1980 and 2010, the share of highly skilled workers in total immigrants to advanced economies rose by close to 20 percentage points to almost 40% (Graph 13, left-hand panel). This was at the expense of the share of low-skill workers (with little education), while that of medium-skill ones (with secondary level education) stayed largely unchanged.
EMEs have contributed significantly to the migration flows of skilled workers (Graph 13, right-hand panel). The number of highly skilled immigrants from major EMEs to advanced economies tripled between 1980 and 2010. Workers in the high-skill segment tend to emigrate at a higher rate than those in lower skill segments. The proportion of highly skilled emigrants in the highly skilled population averaged 13.5% in 2010 among EMEs (Graph 13, right-hand panel). The corresponding number was much lower for the low-skill segment. This pattern is also true at the country level (Graph 14, darker colours indicate more high (low) skill emigrants as a proportion of population with high (low) skill levels).
Some EMEs have seen particularly large shares of highly skilled workers emigrating. The note by the central bank of the Philippines points to a shift in the profile of Filipino migrants from mostly medium- or low-skill workers in the 1970s to professional workers in the 1990s as well as services and production (manufacturing and construction) workers from the 2000s.
Such a loss of skilled labour may cause skill shortages in some sectors. Obvious examples include occupations in the health and financial sectors, which are staffed by a higher portion of highly educated professionals. On a larger scale, such losses can dampen productivity and long-term growth prospects. In their note, the central bank of the Philippines identified emigration and the associated labour shortage as a major policy concern.
Yet, a few factors can dampen or even more than offset this negative impact. Remittances are disproportionally spent on education and health (Ratha and Mohapatra (2011); Cardona-Sosa and Medina (2006)). This not only gives emigrants’ families greater access to education, but also creates demand for better education and helps retain staff. Many migrants travel between their home and host countries, helping “brain circulation” by facilitating information and knowledge-sharing. In the longer run, migrants returning to their home countries with skills learned abroad can help improve domestic technology, management and institutions, leading to “brain gains”.

42 BIS Papers No 100
Higher outward migration from EMEs Graph 13
Immigration to advanced economies by skill level EME emigrants by skill levels in origin countries Per cent millions Per cent
1 EME high/low skill emigrants as percentage of EME high/low skill population. 2 EME emigrants as percentage of EME population.
Sources: OECD; United Nations.
In addition to the impact on source countries, there are several costs and benefits
of migration for recipient EME countries. For instance, as pointed out in the Bank of Korea’s note, migration has been important in helping the economy cope with a shrinking working-age population. Even so, the large inflow of mostly low-skill migrants has led to a rising wage gap, which is now an important policy concern. The note by Russia highlights how the adjustment of foreign migrant flows in response to the strength of the Russian economy acts as a cushioning device and reduces volatility of wages and employment for domestic workers.

BIS Papers No 100 43
A higher proportion of the highly skilled population emigrates from EMEs1 Graph 14
High-skill emigrants
Low-skill emigrants
Boundaries in this map are not necessarily endorsed by the BIS.
1 The variables are calculated as high (low) skill emigrations as % of high (low) skill population in country of origin.
Sources: OECD; BIS calculations.
5. The future of globalisation
After decades of rapid integration, globalisation has shown signs of stalling since the GFC. This has naturally raised concerns that it may have peaked. Looking ahead, there are at least three possible risks that could shape its evolution. First, some globalisation drivers, such as transportation costs and tariff rates, may have reached their trough. That said, there are still large regulatory burdens on trade or cross-ownership in some countries that, if lifted, could provide some boost (see companion note). Moreover, the globalisation of ideas and technology is likely to continue for many years (Baldwin (2016)).
>105-101-5<1NA
%
>105-101-5<1NA
%
44 BIS Papers No 100
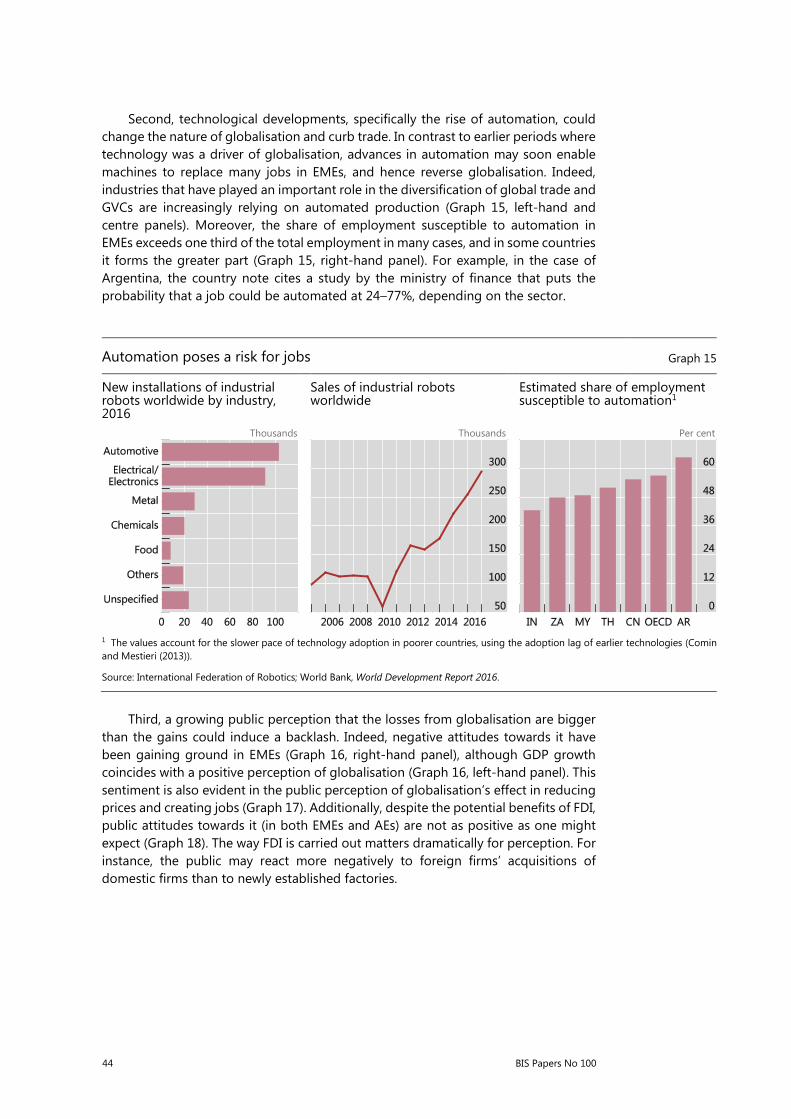
Second, technological developments, specifically the rise of automation, could change the nature of globalisation and curb trade. In contrast to earlier periods where technology was a driver of globalisation, advances in automation may soon enable machines to replace many jobs in EMEs, and hence reverse globalisation. Indeed, industries that have played an important role in the diversification of global trade and GVCs are increasingly relying on automated production (Graph 15, left-hand and centre panels). Moreover, the share of employment susceptible to automation in EMEs exceeds one third of the total employment in many cases, and in some countries it forms the greater part (Graph 15, right-hand panel). For example, in the case of Argentina, the country note cites a study by the ministry of finance that puts the probability that a job could be automated at 24–77%, depending on the sector.
Automation poses a risk for jobs Graph 15
New installations of industrial robots worldwide by industry, 2016
Sales of industrial robots worldwide
Estimated share of employment susceptible to automation1
Thousands Thousands Per cent
1 The values account for the slower pace of technology adoption in poorer countries, using the adoption lag of earlier technologies (Comin and Mestieri (2013)).
Source: International Federation of Robotics; World Bank, World Development Report 2016.
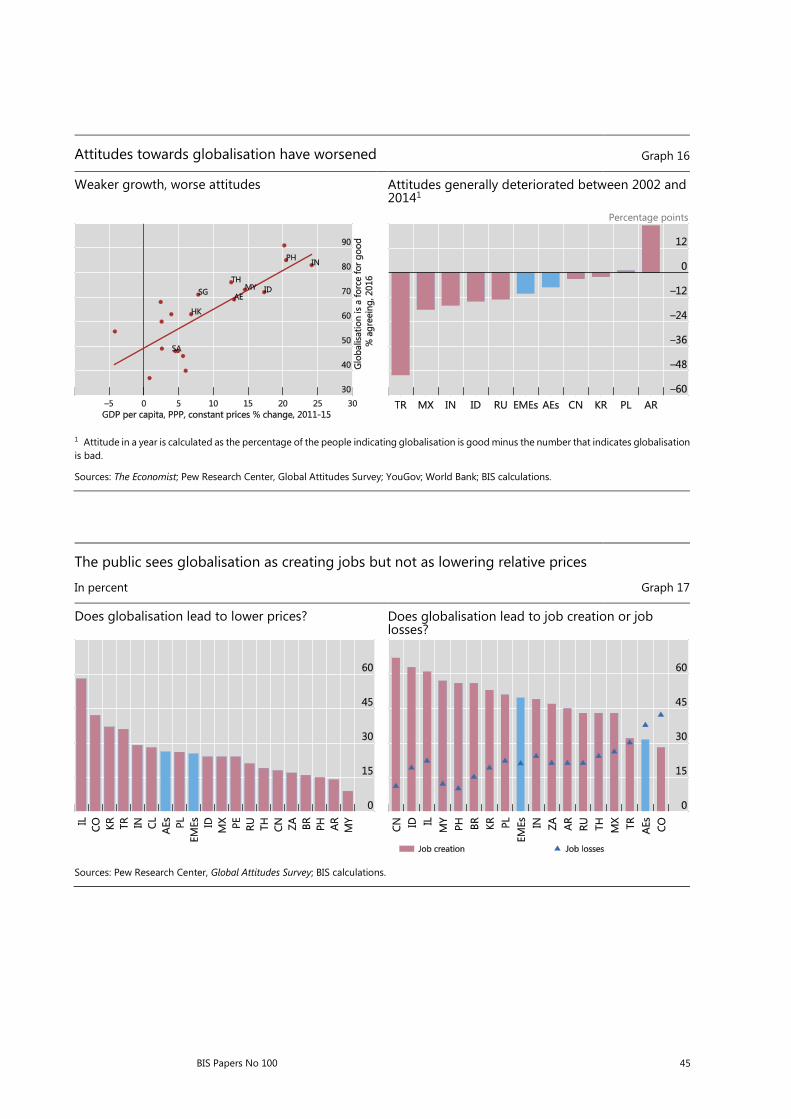
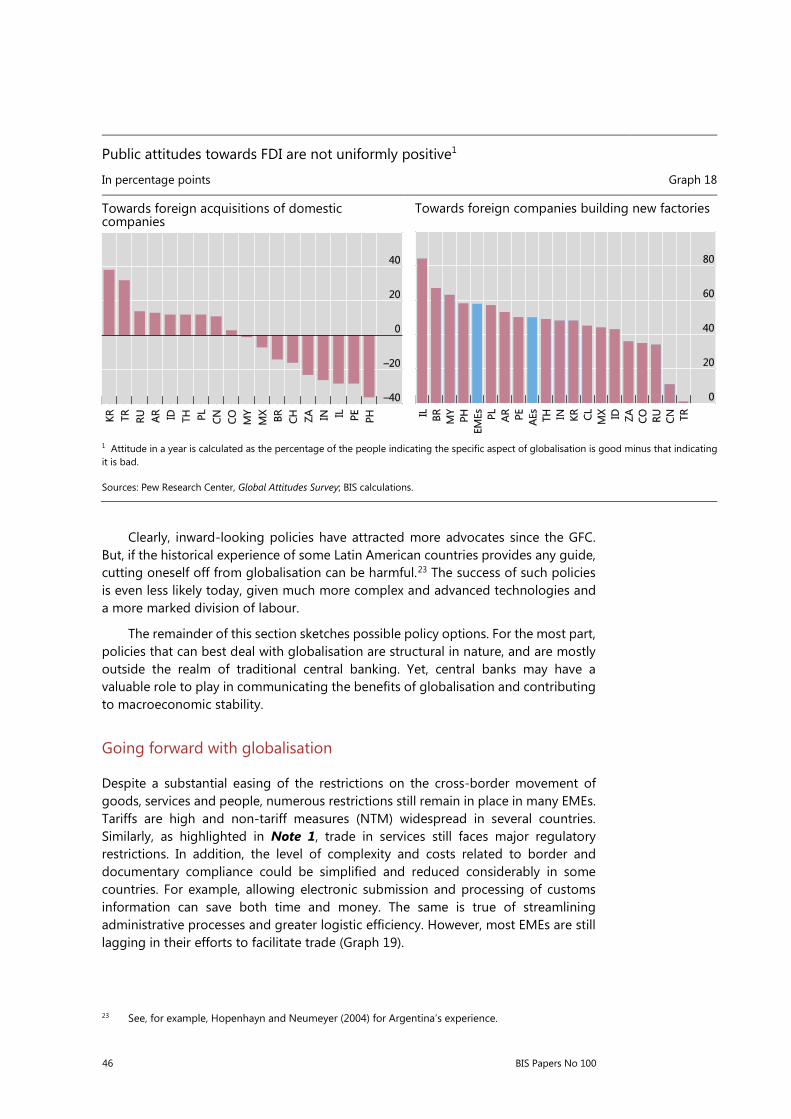
Third, a growing public perception that the losses from globalisation are bigger
than the gains could induce a backlash. Indeed, negative attitudes towards it have been gaining ground in EMEs (Graph 16, right-hand panel), although GDP growth coincides with a positive perception of globalisation (Graph 16, left-hand panel). This sentiment is also evident in the public perception of globalisation’s effect in reducing prices and creating jobs (Graph 17). Additionally, despite the potential benefits of FDI, public attitudes towards it (in both EMEs and AEs) are not as positive as one might expect (Graph 18). The way FDI is carried out matters dramatically for perception. For instance, the public may react more negatively to foreign firms’ acquisitions of domestic firms than to newly established factories.
BIS Papers No 100 45
Attitudes towards globalisation have worsened Graph 16
Weaker growth, worse attitudes Attitudes generally deteriorated between 2002 and 20141
Percentage points
1 Attitude in a year is calculated as the percentage of the people indicating globalisation is good minus the number that indicates globalisation is bad.
Sources: The Economist; Pew Research Center, Global Attitudes Survey; YouGov; World Bank; BIS calculations.
The public sees globalisation as creating jobs but not as lowering relative prices
In percent Graph 17
Does globalisation lead to lower prices? Does globalisation lead to job creation or job losses?
Sources: Pew Research Center, Global Attitudes Survey; BIS calculations.
46 BIS Papers No 100
Public attitudes towards FDI are not uniformly positive1
In percentage points Graph 18
Towards foreign acquisitions of domestic companies
Towards foreign companies building new factories
1 Attitude in a year is calculated as the percentage of the people indicating the specific aspect of globalisation is good minus that indicating it is bad.
Sources: Pew Research Center, Global Attitudes Survey; BIS calculations.
Clearly, inward-looking policies have attracted more advocates since the GFC. But, if the historical experience of some Latin American countries provides any guide, cutting oneself off from globalisation can be harmful.23 The success of such policies is even less likely today, given much more complex and advanced technologies and a more marked division of labour.
The remainder of this section sketches possible policy options. For the most part, policies that can best deal with globalisation are structural in nature, and are mostly outside the realm of traditional central banking. Yet, central banks may have a valuable role to play in communicating the benefits of globalisation and contributing to macroeconomic stability.
Going forward with globalisation
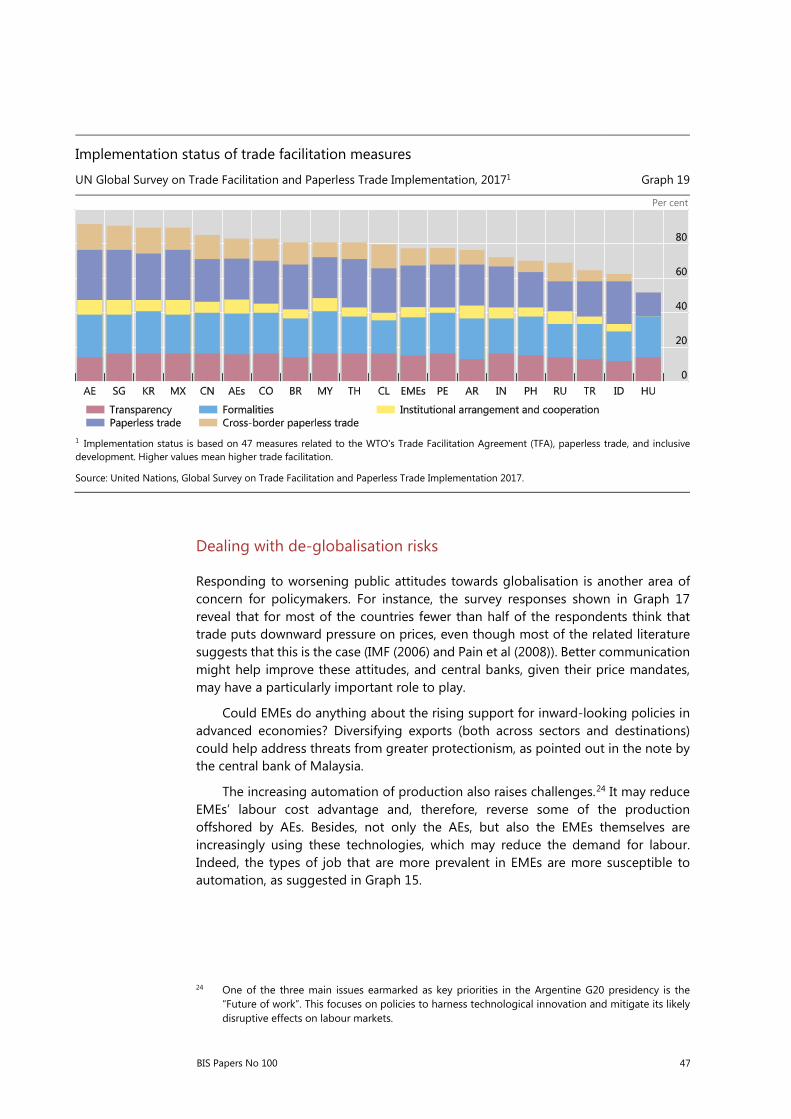
Despite a substantial easing of the restrictions on the cross-border movement of goods, services and people, numerous restrictions still remain in place in many EMEs. Tariffs are high and non-tariff measures (NTM) widespread in several countries. Similarly, as highlighted in Note 1, trade in services still faces major regulatory restrictions. In addition, the level of complexity and costs related to border and documentary compliance could be simplified and reduced considerably in some countries. For example, allowing electronic submission and processing of customs information can save both time and money. The same is true of streamlining administrative processes and greater logistic efficiency. However, most EMEs are still lagging in their efforts to facilitate trade (Graph 19).
23 See, for example, Hopenhayn and Neumeyer (2004) for Argentina’s experience.
BIS Papers No 100 47
Implementation status of trade facilitation measures
UN Global Survey on Trade Facilitation and Paperless Trade Implementation, 20171 Graph 19
Per cent
1 Implementation status is based on 47 measures related to the WTO's Trade Facilitation Agreement (TFA), paperless trade, and inclusive development. Higher values mean higher trade facilitation.
Source: United Nations, Global Survey on Trade Facilitation and Paperless Trade Implementation 2017.
Dealing with de-globalisation risks
Responding to worsening public attitudes towards globalisation is another area of concern for policymakers. For instance, the survey responses shown in Graph 17 reveal that for most of the countries fewer than half of the respondents think that trade puts downward pressure on prices, even though most of the related literature suggests that this is the case (IMF (2006) and Pain et al (2008)). Better communication might help improve these attitudes, and central banks, given their price mandates, may have a particularly important role to play.
Could EMEs do anything about the rising support for inward-looking policies in advanced economies? Diversifying exports (both across sectors and destinations) could help address threats from greater protectionism, as pointed out in the note by the central bank of Malaysia.
The increasing automation of production also raises challenges.24 It may reduce EMEs’ labour cost advantage and, therefore, reverse some of the production offshored by AEs. Besides, not only the AEs, but also the EMEs themselves are increasingly using these technologies, which may reduce the demand for labour. Indeed, the types of job that are more prevalent in EMEs are more susceptible to automation, as suggested in Graph 15.
24 One of the three main issues earmarked as key priorities in the Argentine G20 presidency is the
“Future of work”. This focuses on policies to harness technological innovation and mitigate its likely disruptive effects on labour markets.
48 BIS Papers No 100
Policies to address an uneven distribution of the benefits
While globalisation has probably boosted overall welfare in EMEs, the benefits have typically been unevenly spread. The major challenge for policymakers is therefore how to reduce adjustment costs and narrow the gap between winners and losers.
Policies that facilitate the reallocation of labour and capital across sectors are one option. These would help avoid pockets of unemployment and, over time, facilitate a more productive use of resources. Making the labour and product markets sufficiently flexible, as well as retraining programmes, could play a useful role. In addition, trade agreements could be introduced in a gradual and phased manner to minimise the costs of trade liberalisation.25 A case in point is the Singaporean government’s move to promote job matching and re-skilling of mid-career professionals (see note).
But even if full employment is ensured, income and wealth inequality remain a major challenge. Hence a role for redistributive policies.26 These, in turn, call for adequate social security and welfare systems.27 Relevant policies include unemployment insurance, food subsidies and laws to promote efficient labour mobility and severance payments. One such example, as pointed out by the central bank of Malaysia, is the Malaysia Outplacement Centre (1MOC) established by the government in 2016 to help displaced workers find new jobs. Thus far, the centre has placed 2,400 workers. As the Monetary Authority of Singapore points out, the scope for redistributive policies is not limited to households and individuals. Indeed, the government has provided time-bound investment support as well as targeted relief to firms heavily affected by structural change. Political hurdles aside, the main roadblock for many EMEs is the lack of a sizeable and stable tax base. Hence the role for policies that enhance the tax system’s efficiency and compliance rate.
More generally, the challenge for policymakers is to harness globalisation to support robust and sustainable long-term growth. This raises the question of the appropriate growth model. For instance, manufacturing and commodity exports have been instrumental for many countries in boosting growth. But looking ahead, this growth model may come under pressure from the shift in world demand away from tradable manufactured goods to non-tradable services.
In EMEs, globalisation has gone hand in hand with urbanisation, ageing populations and growing environmental risks. Governments have a menu of policy options here. For instance, they can ease adjustment by devoting adequate resources to urban planning and infrastructure. They may also invest in rural infrastructure to increase productivity there, as the contribution from the People’s Bank of China points out. However, the fact that the benefits materialise only over horizons longer than the typical political cycle complicates the challenge.
Many of these challenges are best addressed at the national level, tailoring policy responses to specific needs. Nevertheless, there are also issues such as climate
25 As pointed out by the country note by Malaysia, the ASEAN free trade agreement (AFTA) is a
prominent example of this approach. It also includes a “Temporary Exclusion List”, a “Sensitive List” and a “General Exception List” to safeguard the interests of individual countries.
26 Naturally, such policies cannot substitute for having a job: subjective well-being depends not only on income, but also on how that income is earned (eg Helliwell et al (2017) and Ohtake (2012)).
27 Several country notes (including those by the Philippines and Brazil) identified strengthening social security systems as an important part of the policy response.
BIS Papers No 100 49
change and cyber-security where the scope for international cooperation is naturally greater.
Although central banks do not have direct responsibility for the policies just discussed, they can have a role to play. One is simply voicing views about the right policies for governments to follow: the consequences for central banks would be of first-order significance. The scope for this will depend on country-specific circumstances and institutional setups. Central banks may also need to consider how far to take into account in their policy decisions some of the distributional consequences of globalisation across sectors or the population. They may need a better understanding of the implications of globalisation for economic performance and inflation. Likewise, the growing importance of the external dimension naturally puts a premium on the potential role of FX regimes and policies that help address external shocks. For instance, not surprisingly, the use of FX intervention has been on the rise in EMEs (Domanski et al (2016)).28 Similarly, several contributions, including the ones from the Bank of Korea, the Hong Kong Monetary Authority and the People’s Bank of China, mention the potential role of macroprudential frameworks and capital flow management measures in helping to insulate the domestic economy from foreign shocks. As pointed out by the country notes of Brazil and the Philippines, central banks in EMEs can also contribute to the efficacy of the overall policy response to globalisation by promoting financial inclusion.
Greater policy challenges lie ahead if protectionism prevails and globalisation reverses. In that case, benefits will likely be reversed: growth may slow, inflation may rise, GVCs may be disrupted and jobs destroyed. While tighter regional integration may be an option to alleviate the costs, it may not be enough.
28 Several country notes, including Malaysia’s, corroborate this view.
50 BIS Papers No 100
References
Acosta, P and L Gasparini (2007): “Capital accumulation, trade liberalization, and rising wage inequality: the case of Argentina”, Economic Development and Cultural Change, vol 55.
Akçelik, F (2016): Income groups and inflation in Turkey, master’s thesis.
Alcalá, F and A Ciccone (2004): “Trade and productivity”, Quarterly Journal of Economics, vol 119, no 2, pp 613–46.
Alvaredo, A (2010): “The rich in Argentina over the twentieth century, 1932–2004”, Top Incomes: A Global Perspective, pp 253–98.
Amiti, M (1999): “Specialization patterns in Europe”, Weltwirtschaftliches Archiv (Review of World Economics), vol 135, no 4, pp 573–93.
Antràs, P, A De Gortari and O Itskhoki (2016): ”Globalization, inequality and welfare”, NBER Working Papers, no 22676.
Auer, R, C Borio and A Filardo (2017): “The globalisation of inflation: the growing importance of global value chains“, BIS Working Papers, no 602.
Baldwin, R (2016): The great convergence, Harvard University Press.
Bank for International Settlements (2017): 87th Annual Report.
Beaton, K, S Cerovic, M Galdamez, M Hadzi-Vaskov, F Loyola, Z Koczan, B Lissovolik, J Martijn, Y Ustyugova and J Wong (2017): “Migration and remittances in Latin America and the Caribbean: engines of growth and macroeconomic stabilizers?”, IMF Working Papers, no 17/144.
Black, S and E Brainerd (2004): “Importing equality? The impact of globalization on gender discrimination”, Industrial and Labor Review, vol 57, no 4.
Brambilla, I, D Lederman and G Porto (2012): “Exports, export destinations and skills,” American Economic Review, vol 102, no 7.
Cavallo, E and J Frankel (2008): “Does openness to trade make countries more vulnerable to sudden stops, or less? Using gravity to establish causality“, Journal of International Money and Finance, vol 27, no 8, pp 1430–52.
Cardona-Sosa, L and C Medina (2006): “Migration as a safety net and effects of remittances on household consumption: the case of Colombia”, Borradores De Economia, Bank of the Republic, Colombia.
Comin, D and M Mestieri (2013): “If technology has arrived everywhere, why has income diverged?”, NBER Working Paper, no 19010.
Constantinescu, C, A Mattoo and M Ruta (2017): “Does vertical specialization increase productivity?”, Policy Research Working Paper, no 7978, World Bank.
Czaika, M and H de Haas (2016): “The effects of visas on migration processes”, International Migration Review, vol 51, no 4, pp 893–926.
Domanski, D, E Kohlscheen, and R Moreno (2016): “Foreign exchange market intervention in EMEs: what has changed?”, BIS Quarterly Review, September.
Dreher, A (2006): “Does globalization affect growth? Evidence from a new index of globalization”, Applied Economics, vol 38, no 10.

BIS Papers No 100 51
ERIA Research Project Report (2013): “Globalization and performance of small and large firms“.
Faijgelbaum, P and A Khandelwal (2016): “Measuring the unequal gains from trade”, Quarterly Journal of Economics, vol 131.
Feenstra, R and G Hanson (1997): “Foreign direct investment and relative wages: evidence from Mexico’s maquiladoras”, Journal of International Economics, vol 42, pp 371–93.
Ferreiro, P and G Facchini (2005): “Trade liberalization and industrial concentration: evidence from Brazil”, the Quarterly Review of Economics and Finance, vol 45.
Frankel, J and A Rose (1998): “The endogeneity of the optimum currency area criteria”, The Economic Journal, vol 108, no 449, pp 1009–25.
Galiani, S and P Sanguinetti (2003): “The impact of trade liberalization on wage inequality: evidence from Argentina”, Journal of Development Economics, vol 72, no 2.
Giordano, P and K Li (2012): “An updated assessment of the trade and poverty nexus in Latin America”, IDB Working Paper Series, IDB-WP-383, Washington DC.
Gopinath, G, S Kalemli-Ozcan, L Karabarbounis and C Villegas-Sanchez (2017): “Capital allocation and productivity in South Europe”, NBER Working Paper, no 21453.
Gutierrez, G and T Philippon (2017): ”Declining competition and investment in the US”, manuscript.
Harrison, A (2005): “Has globalization eroded labor’s share? Some cross-country evidence”, MPRA Paper, no 39649.
Helliwell, J, H Huang and S Wang (2017): “The social foundations of world happiness”, World Happiness Report 2017, Chapter 8.
Hopenhayn, H and P Neumeyer (2004): “Explaining Argentina’s great depression of 1975–1990” in E Fernandez-Arias, R Manuelli and J Blyde (eds), Sources of growth in Latin America. What is missing?, Inter-American Development Bank.
IMF (2006): World Economic Outlook, April.
——— (2008): Food and fuel prices – recent developments, macroeconomic impact, and policy responses, 30 June.
Kose, A, C Otrok and E Prasad (2012): “Global business cycles: Convergence or decoupling”, International Economic Review, vol 53, no 2, pp 511–38.
Krueger, A (2012): “The rise and consequences of inequality in the United States”, speech at the Center for American Progress, Washington DC, 12 January.
Kuznets, S (1971): Prize Lecture: “Modern economic growth: findings and reflections”, Stockholm: The Nobel Prize.
Lakner, C and B Milanovic (2016): “Global income distribution: from the fall of the Berlin wall to the great recession”, World Bank Economic Review, vol 30, no 2.
Lee, J and J Pyun (2008): “Does trade integration contribute to peace”, ADB Working Paper Series on Regional Economic Integration, no 24, December.
Melitz, M (2003): “The impact of trade on intra-industry reallocations and aggregate industry productivity”, Econometrica, vol 71, no 6, pp 1695–725.

52 BIS Papers No 100
Novokmet, F, T Piketty and G Zucman (2017): “From Soviets to oligarchs: Inequality and property in Russia, 1905–2016”, World Income Database, Working Paper Series, no 2017/09.
Ohtake, F (2012): “Unemployment and happiness”, Japan Labor Review, vol 9, no 2, Spring.
Pain, N, I Koske and M Sole (2008): “Globalisation and OECD consumer price inflation”, OECD Economic Studies, no 44.
Park, K (2017): “Education, globalization and income inequality in Asia”, ADBI Working Paper Series, no 732.
Patel, N, Z Wang and S Wei (2017): “Global value chains and effective exchange rates at the country-sector level”, BIS Working Papers, no 637.
Pavnick, N (2002): “Trade liberalization, exit, and productivity improvements: evidence from Chilean plants”, Review of Economic Studies, vol 69, no 1, January, pp 245–76.
Ratha, D and S Mohapatra (2011): “Preliminary estimates of diaspora savings”, Migration and Development Brief, no 14, World Bank.
Rodrik, D (2008): “The disappointments of financial globalization”, in Bank of Thailand, Financial Globalization and Emerging Market Economies, Proceedings of an International Symposium, Bangkok, November.
——— (2017): “Populism and the economics of globalization”, NBER Working Paper, no 23559.
Rutherford, T and D Tarr (2005): “Russia’s WTO accession: what are the macroeconomic, sector, labor market and household effects?”, in G Navaretti (ed), Handbook of Trade Policy and WTO Accession for Development in Russia and the CIS, World Bank.
Saez, E, F Alvaredo, L Chancel and T Piketty (2018): World Inequality Report 2018.
Schwörer, T (2013): “Offshoring and labour market inequalities”, Kiel Working Paper, no 1877, Kiel Institute for the World Economy.
Wang, Z, C Wang and Q Zhang (2015): “Population ageing, urbanization and housing demand”, Journal of Service Science and Management, vol 8, no 4, pp 516–25.
World Bank (2018): Fair Progress?: Educational mobility around the world. Equity and development, Washington DC.
BIS Papers No 100 53
Appendix
A1. Herfindahl index of concentration of employment across sectors: individual country plots
Graph A1 shows the evolution of the Herfindahl index of concentration for employment in the sample period 1995–2011. Countries are split into two groups (high and low) depending on the level of the index.
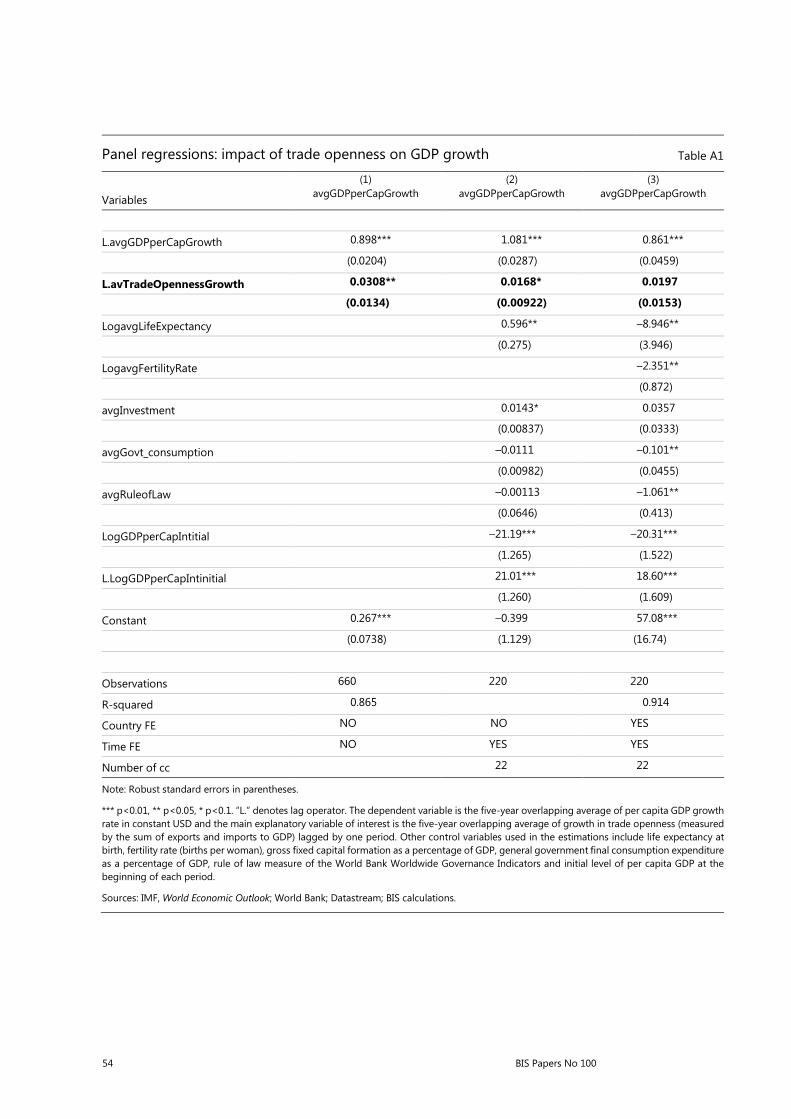
A2. Relationship Between trade and GDP growth
Trade and growth: Evidence from panel regressions
The dynamic panel regressions are based on a sample of 22 EMEs from 1979 to 2019. The dependent variable is the five-year moving average of per capita GDP growth, and the main independent variable of interest is the five-year moving average of growth in trade openness (lagged by one period), for which the corresponding row in the table is highlighted in bold. Column 1 uses a pooled estimator without any additional controls; it shows that trade openness boosts growth, with an elasticity of 0.03. Column 2 adds additional controls, including time fixed effects, and is based on a random-effects estimator. The positive relationship between trade openness and growth still survives, although it is statistically less robust (significant only at the 10% level). Column 3 shows the results using a fixed effects GMM estimator. While still positive, the coefficient is no longer statistically significant.
Overall, these results suggest that there is a positive relationship between growth and trade openness. However, the relationship ceases to be statistically significant once country fixed effects are included, indicating that the cross-country variation in these variables is insufficient to uncover a robust link.
Herfindahl index of concentration in employment across sectors Graph A1
High Herfindahl index Low Herfindahl index
Sources: World Input-Output Database; BIS calculations.
54 BIS Papers No 100
Panel regressions: impact of trade openness on GDP growth Table A1
Variables
(1) avgGDPperCapGrowth
(2) avgGDPperCapGrowth
(3) avgGDPperCapGrowth
L.avgGDPperCapGrowth 0.898*** 1.081*** 0.861***
(0.0204) (0.0287) (0.0459)
L.avTradeOpennessGrowth 0.0308** 0.0168* 0.0197
(0.0134) (0.00922) (0.0153)
LogavgLifeExpectancy 0.596** –8.946**
(0.275) (3.946)
LogavgFertilityRate –2.351**
(0.872)
avgInvestment 0.0143* 0.0357
(0.00837) (0.0333)
avgGovt_consumption –0.0111 –0.101**
(0.00982) (0.0455)
avgRuleofLaw –0.00113 –1.061**
(0.0646) (0.413)
LogGDPperCapIntitial –21.19*** –20.31***
(1.265) (1.522)
L.LogGDPperCapIntinitial 21.01*** 18.60***
(1.260) (1.609)
Constant 0.267*** –0.399 57.08***
(0.0738) (1.129) (16.74)
Observations 660 220 220
R-squared 0.865 0.914
Country FE NO NO YES
Time FE NO YES YES
Number of cc 22 22
Note: Robust standard errors in parentheses.
*** p<0.01, ** p<0.05, * p<0.1. “L.” denotes lag operator. The dependent variable is the five-year overlapping average of per capita GDP growth rate in constant USD and the main explanatory variable of interest is the five-year overlapping average of growth in trade openness (measured by the sum of exports and imports to GDP) lagged by one period. Other control variables used in the estimations include life expectancy at birth, fertility rate (births per woman), gross fixed capital formation as a percentage of GDP, general government final consumption expenditure as a percentage of GDP, rule of law measure of the World Bank Worldwide Governance Indicators and initial level of per capita GDP at the beginning of each period.
Sources: IMF, World Economic Outlook; World Bank; Datastream; BIS calculations.
BIS Papers No 100 55
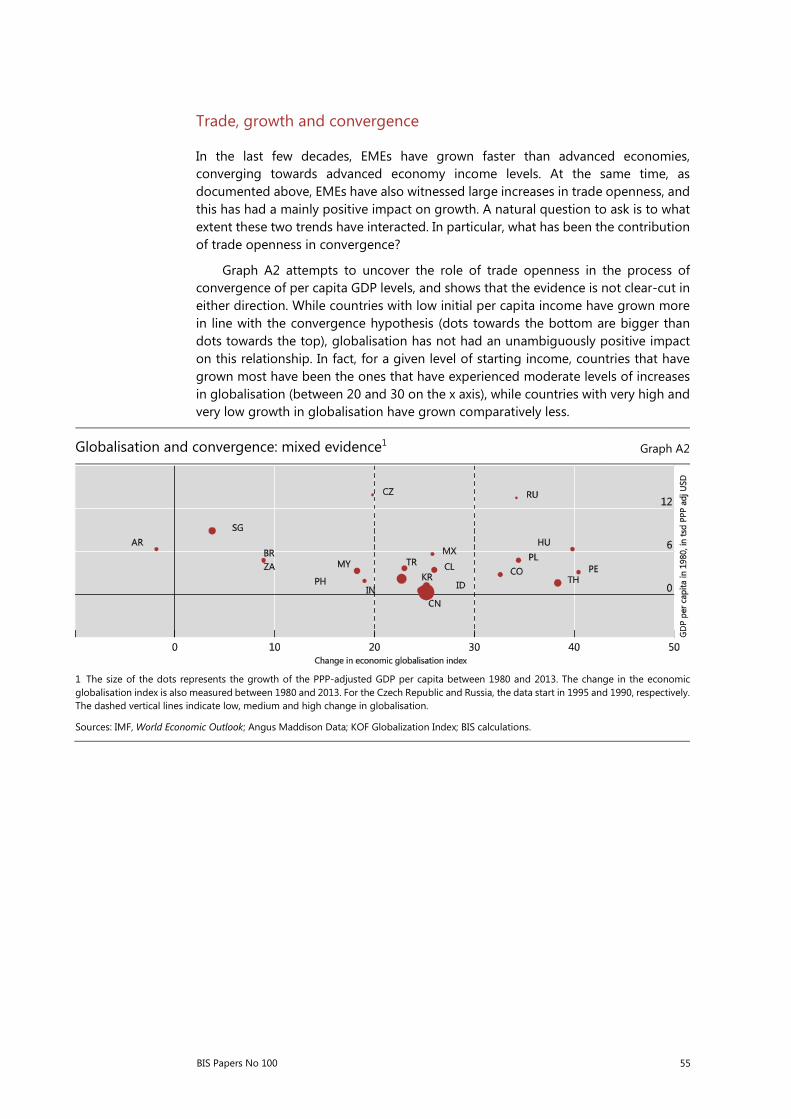
Trade, growth and convergence
In the last few decades, EMEs have grown faster than advanced economies, converging towards advanced economy income levels. At the same time, as documented above, EMEs have also witnessed large increases in trade openness, and this has had a mainly positive impact on growth. A natural question to ask is to what extent these two trends have interacted. In particular, what has been the contribution of trade openness in convergence?
Graph A2 attempts to uncover the role of trade openness in the process of convergence of per capita GDP levels, and shows that the evidence is not clear-cut in either direction. While countries with low initial per capita income have grown more in line with the convergence hypothesis (dots towards the bottom are bigger than dots towards the top), globalisation has not had an unambiguously positive impact on this relationship. In fact, for a given level of starting income, countries that have grown most have been the ones that have experienced moderate levels of increases in globalisation (between 20 and 30 on the x axis), while countries with very high and very low growth in globalisation have grown comparatively less.
Globalisation and convergence: mixed evidence1 Graph A2
1 The size of the dots represents the growth of the PPP-adjusted GDP per capita between 1980 and 2013. The change in the economic globalisation index is also measured between 1980 and 2013. For the Czech Republic and Russia, the data start in 1995 and 1990, respectively. The dashed vertical lines indicate low, medium and high change in globalisation.
Sources: IMF, World Economic Outlook; Angus Maddison Data; KOF Globalization Index; BIS calculations.