HOW DOES STABILITY IN FINANCIAL OPENNESS AFFECT … · HOW DOES STABILITY IN FINANCIAL OPENNESS...
26
Topics in Middle Eastern and African Economies Vol. 14, September 2012 164 HOW DOES STABILITY IN FINANCIAL OPENNESS AFFECT GROWTH? Erhan Aslanoğlu * Marmara University Pınar Deniz † Marmara University Abstract In the growth process, financing is needed to fulfill the potential for growth. If there is an insufficiency, the potential is said to be underutilized. It is suggested that financial openness prevents the congestion when the real side of the economy is in need of finance. Therefore, the relief in accessing finance, in an indirect way, can contribute to economic growth. Recently, there has been a growing literature analyzing whether the financial side has an impact on the real side of the economy. Within the financial side, a special attention is paid to international capital flows and whether they can have impact on economic growth. Some channels are described within the theory originating from financial openness to economic growth. However, there is a controversy for the causal link. Moreover, the link is criticized in the way that financial openness brings about exchange rate instability which further leads to destabilization in the real sector (Dornbusch, 1976). This study attempts to focus on domestically stable financial openness by considering financial openness and exchange rate stability together. Direct and indirect mechanisms are introduced. According to this, a new index is constructed to proxy stable financial openness via including portfolio investment plus exchange rate volatility. The new dataset is employed to analyze whether a domestically stable financial openness is able to affect the real side of the economy positively. Keywords: Exchange Rate Volatility, Financial openness, Capital flows JEL classification: F41, G15 * Marmara University, Turkey, Faculty of Economics and Administrative Sciences, Economics Department, e-mail: [email protected] † Marmara University, Turkey, EU Institute, e-mail: [email protected]
Transcript of HOW DOES STABILITY IN FINANCIAL OPENNESS AFFECT … · HOW DOES STABILITY IN FINANCIAL OPENNESS...
Topics in Middle Eastern and African Economies
Vol. 14, September 2012
164
HOW DOES STABILITY IN FINANCIAL OPENNESS
AFFECT GROWTH?
Erhan Aslanoğlu*
Marmara University
Pınar Deniz†
Marmara University
Abstract
In the growth process, financing is needed to fulfill the potential for growth. If there is an
insufficiency, the potential is said to be underutilized. It is suggested that financial openness
prevents the congestion when the real side of the economy is in need of finance. Therefore,
the relief in accessing finance, in an indirect way, can contribute to economic growth.
Recently, there has been a growing literature analyzing whether the financial side has an
impact on the real side of the economy. Within the financial side, a special attention is paid to
international capital flows and whether they can have impact on economic growth. Some
channels are described within the theory originating from financial openness to economic
growth. However, there is a controversy for the causal link. Moreover, the link is criticized in
the way that financial openness brings about exchange rate instability which further leads to
destabilization in the real sector (Dornbusch, 1976). This study attempts to focus on
domestically stable financial openness by considering financial openness and exchange rate
stability together. Direct and indirect mechanisms are introduced. According to this, a new
index is constructed to proxy stable financial openness via including portfolio investment plus
exchange rate volatility. The new dataset is employed to analyze whether a domestically
stable financial openness is able to affect the real side of the economy positively.
Keywords: Exchange Rate Volatility, Financial openness, Capital flows
JEL classification: F41, G15
*Marmara University, Turkey, Faculty of Economics and Administrative Sciences, Economics Department,
e-mail: [email protected] † Marmara University, Turkey, EU Institute, e-mail: [email protected]
Topics in Middle Eastern and African Economies
Vol. 14, September 2012
165
1. INTRODUCTION
In the growth process, financing is needed to fulfill the potential for growth. If there is a
shortage, the potential is said to be underutilized. It is suggested that financial openness
prevents the congestion when the real side of the economy is in need of finance. Therefore,
the relief in accessing finance can contribute to economic growth.
There is a deep literature on financial openness and its impact on several variables such as
economic growth. Within the financial side, a special attention is paid to international capital
flows and whether they can have impact on economic growth. Financial openness is
frequently presented as beneficial for the economy. Some channels are described within the
theory originating from financial openness to economic growth. However, regarding direction
and magnitude, there is a controversy for the relationship. Together with financial
liberalization, a high level of capital will tend to flow in the economies that are attractive for
the investors. Especially in emerging economies where charming elements are relatively
higher than elsewhere, foreign investors may direct their funds to these countries. Financial
openness may easily lead to some alterations in the domestic system. Likewise, without
external effects, interest rates are determined domestically. However, external conditions will
become effective when the matter is small economies. According to Bacchetta (1992) it is
likely that after financial liberalization, first, capital inflows will be observed. Together with
capital stock increase, domestic investments will be less and less charming as marginal
productivity declines. This decline ends up with capital outflows. He explains that higher
domestic interest rate lets foreign capital in and leads to appreciation first, but this is followed
by capital outflow due to arbitration in foreign and domestic interest rates which further leads
to depreciation of domestic currency.
Quinn and Toyoda (2008) argue that in analyzing the relationship between capital account
liberalization and economic growth, differing time periods and collinearity among
independent variables result in measurement errors. In this line, they employ both time series
and cross sectional analysis and GMM analysis for a long time period of 1955-2004. They
observe a positive relationship with economic growth independent of the country’s economic
development level. There are many other studies advocating the positive impact of financial
openness (mainly using capital inflows dataset) on growth (Ferreira, 2009; Klein and Olivei,

Topics in Middle Eastern and African Economies
Vol. 14, September 2012
166
1999; Tornell et al., 2003; Haber, 1997). Bekaert et al. (2005) also finds that capital account
liberalization contributes to economic growth. However, grounding on some studies (Rodrik,
1999), he states that openness is not completely appropriate for less developed economies
since the domestic institutions and several other internal factors are not totally powerful in
these economies. Yet they conclude that the countries with better conditions reflect relatively
higher growth rates. In a similar manner, Choong et al. (2010), using a large number of
developed and developing countries, observe that FDI reflects a positive effect on growth,
whereas portfolio investment displays a negative impact for all countries in the dataset, but
highlight that there is a specific threshold level for development in stock market above which
can turn this negativity into positivity. Many other studies, as well, pay attention to the
capacity of the host economy (Borensztein et al., 1998; Edwards, 2001; Rajan and Zingales,
1998).
Other than the capacity of the host economy, portfolio inflows may reflect a volatile character
mainly for emerging economies (Ferreira, 2009). This volatility in portfolio investments is
derived from the decisions, risk-return perceptions of the foreign investors. Moreover,
financial openness may theoretically lead to exchange rate volatilities via the mechanism
Bacchetta (1992) explains. There are also some empirical findings approving this claim.
Employing a sample of 82 industrial and developing countries within the period 1975-2005,
Calderon and Kubota (2009) show that financial openness strengthens real exchange rate
(RER) volatility. Sutherland (1996), in a similar manner, observe a correlation between
financial openness and RER volatility. However, exchange rate volatility is a problematic
case for the economies since producers will become unable to see the future of external trade,
whether they will be competitive or not in the international arena. In this manner, Dornbusch
(1976) criticized the positive impact of financial openness on growth since financial openness
brings about exchange rate instability which further leads to destabilization in the real sector.
This study attempts to focus on domestically stable financial openness by considering
financial openness and exchange rate stability together. According to this, a new index is
constructed to proxy stable financial openness via including portfolio investment plus
exchange rate volatility. The new dataset is employed to analyze whether a domestically
stable financial openness is able to affect the real side of the economy positively. The study
analyzes the relationship between stability in openness and growth for emerging economies,
Topics in Middle Eastern and African Economies
Vol. 14, September 2012
167
namely as, China, Brazil, India, Indonesia, Korea, Mexico, Russia, Turkey and South Africa.
Moreover, a developing country, the UK, is selected as a benchmark. The technique for
empirical analysis is a causality investigation which is able to test causality under different
frequencies.
The rest of the paper is organized as follows. Next section of the paper examines the
transmission mechanism in details. Section 3 introduces the methodology and Section 4
presents the data and the dimension index employed. Section 5 discusses the empirical finding
and last section concludes the paper shortly.
2. TRANSMISSION MECHANISM
In this paper, the scope is emerging markets, which are largely in need of finance compared to
developed markets. Domestically insufficient savings leads to demand for foreign savings.
Such high financial need, together with risk premium, keeps interest rates relatively higher.
According to their risk perceptions, foreign investors decide whether to invest on these
markets’ financial instruments. Together with foreign portfolio inflows, emerging economies
will be able reach the resource for investment.
The key point in emerging markets is that they are not saturated in the number of real sector
firms. In other words, there are relatively less firms. Therefore, a small incentive
1 has the capability to create a high motivation for new firms to enter the market. Likewise,
Rajan and Zingales (1998) observes that together with financial development, growth in the
number of new entries is higher in industries dependent on external finance. As mentioned in
the literature part, there are many studies suggesting a positive impact of financial openness
(and also financial development) on economic growth. There is also a theoretical background
for such an impact which suggests that entrance to the market brings about an increase in
growth under the neoclassical assumption of decreasing returns to scale for an individual firm,
but constant returns to scale in the market as a whole.
An increase in portfolio investments may lead to appreciation in exchange rate for the host
economy if the central bank does not carry out active exchange rate policy. Appreciation in
1 The word “incentive” here refers to convenience in accessing resources and/or a decline in the cost of lending.
Topics in Middle Eastern and African Economies
Vol. 14, September 2012
168
exchange rate is an impediment for exports but it facilitates imports which will further work
against economic growth. Secondly, if there is a volatility in exchange rate, portfolio
investment inflows may perceive this as a risk signal and leave the host country which implies
that the economy loses its financing for growth. Moreover, the firms will become unable to
see the prospective international trade conditions which will negatively affect their investment
incentives. Hence, appreciation or volatility seems to work against economic growth. On the
other hand, if there is such an active exchange rate policy focusing on keeping exchange rate
less volatile2, whatever the type of portfolio investments, either corporate security or money
market, etc., direct and indirect mechanisms work which is suggested by this study as a
distinct approach in the literature.
Assume that the central bank conducts exchange rate management policy aiming to keep
exchange rate less volatile in addition to its price stability policy. As with foreign portfolio
inflows, firms will be able to allay their need for financing. Considering the higher resources
for investment3, the motivation of the new firms to enter the market with a little incentive
(since the market is not saturated), and the stability in exchange rate, which enables firms to
enter external trade more self-confidently, there will be a significant potential for growth.
Increase in growth potential due to stability in exchange rate may be referred as a direct
mechanism.
If there is an increase in portfolio investments, in order to prevent appreciation in exchange
rate, central bank will apply open market operations (OMO) or buy foreign currency which
will lead to increase in money supply and decrease in interest rate. As stated earlier, a small
decline in interest rates is a crucial incentive for firms in need of cheaper domestic financing.
With new entries to the real market, there will be an impetus for economic growth. Increase in
growth potential due to decline in interest rates may be referred as indirect mechanism.
Exchange rate stability is also a very crucial determinant of a country’s external trade.
Exchange rate appreciation resulting from foreign inflows leads to decline in economic
2 This may not only be a self-decision of the country. Rather it can be really applicable via the conditions
demanded by EU. Keeping exchange rate within a specified boundary is applied in Maastricht criteria in order to
be able to enter Euro zone (European Monetary Union). 3 Higher resources may somehow imply a kind of development in financial system as the economy is able to get
rid of the limits in domestic financing.
Topics in Middle Eastern and African Economies
Vol. 14, September 2012
169
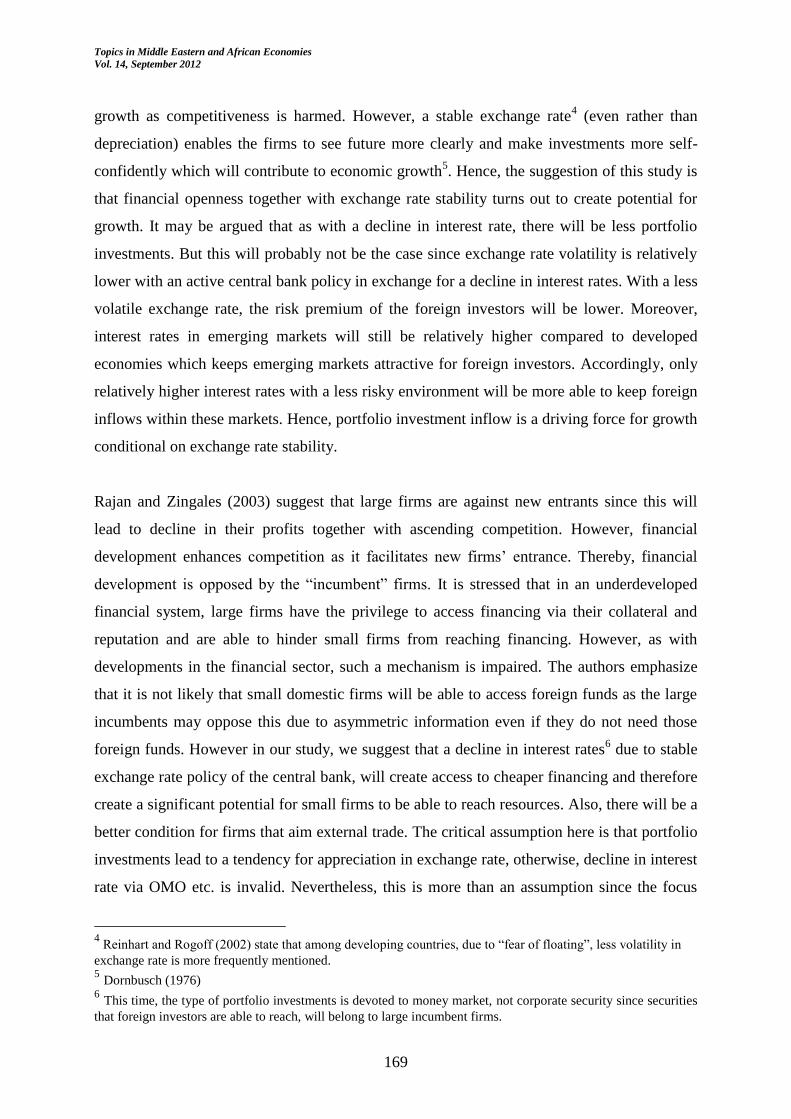
growth as competitiveness is harmed. However, a stable exchange rate4 (even rather than
depreciation) enables the firms to see future more clearly and make investments more self-
confidently which will contribute to economic growth5. Hence, the suggestion of this study is
that financial openness together with exchange rate stability turns out to create potential for
growth. It may be argued that as with a decline in interest rate, there will be less portfolio
investments. But this will probably not be the case since exchange rate volatility is relatively
lower with an active central bank policy in exchange for a decline in interest rates. With a less
volatile exchange rate, the risk premium of the foreign investors will be lower. Moreover,
interest rates in emerging markets will still be relatively higher compared to developed
economies which keeps emerging markets attractive for foreign investors. Accordingly, only
relatively higher interest rates with a less risky environment will be more able to keep foreign
inflows within these markets. Hence, portfolio investment inflow is a driving force for growth
conditional on exchange rate stability.
Rajan and Zingales (2003) suggest that large firms are against new entrants since this will
lead to decline in their profits together with ascending competition. However, financial
development enhances competition as it facilitates new firms’ entrance. Thereby, financial
development is opposed by the “incumbent” firms. It is stressed that in an underdeveloped
financial system, large firms have the privilege to access financing via their collateral and
reputation and are able to hinder small firms from reaching financing. However, as with
developments in the financial sector, such a mechanism is impaired. The authors emphasize
that it is not likely that small domestic firms will be able to access foreign funds as the large
incumbents may oppose this due to asymmetric information even if they do not need those
foreign funds. However in our study, we suggest that a decline in interest rates6 due to stable
exchange rate policy of the central bank, will create access to cheaper financing and therefore
create a significant potential for small firms to be able to reach resources. Also, there will be a
better condition for firms that aim external trade. The critical assumption here is that portfolio
investments lead to a tendency for appreciation in exchange rate, otherwise, decline in interest
rate via OMO etc. is invalid. Nevertheless, this is more than an assumption since the focus
4 Reinhart and Rogoff (2002) state that among developing countries, due to “fear of floating”, less volatility in
exchange rate is more frequently mentioned. 5 Dornbusch (1976)
6 This time, the type of portfolio investments is devoted to money market, not corporate security since securities
that foreign investors are able to reach, will belong to large incumbent firms.

Topics in Middle Eastern and African Economies
Vol. 14, September 2012
170
point is emerging economies which are known to receive very high foreign inflows as the
return for investment7 is generally relatively higher than any other countries. Hence, it is
already observed that the high foreign inflows tend to appreciate host economy’s currency.
The mechanism mentioned in our study suggests an impact on economic growth. The impetus
on growth is conditional on (i) the host economy’s being able to attract foreign funds, and (ii)
central bank of the host economy’s exchange rate stability policy. This is modeled by utilizing
two variables and turning them into a single index, which we refer as stability in openness
index (SIO). SIO is composed of portfolio investment inflows and exchange rate volatility
(monthly standard deviation of daily exchange rate).
3. METHODOLOGY
3.1. Causality Tests in Time and Frequency Domain
The Granger causality tests indicate whether the past changes in x (y) have an impact on
current changes in y (x) over a specified time period. These types of analyses provide
outcomes on causality over all frequencies. On the other hand, Geweke’s linear measure of
feedback from one variable to another at a given frequency provides detailed information
about feedback relationships between two variables over different frequency bands. Even
though frequency decompositions are generally investigated for neurophysiologic studies, it is
important to address how causality changes with frequency. Besides, studies such as Yıldırım
and Taştan (2009) show that the significance and/or direction of the Granger causality tests in
time domain can change after adopting the causality tests in frequency domain.
By using a Fourier transformation to VAR (p) model for x and y series, the Geweke’s
measure of linear feedback from y to x at frequency ω is defined as8:
2
12
2 2
11 11
( )2 ( )( ) log log 1
( ) ( )
i
xy x
i i
efM
e e
(1)
7 The risk is also calculated by the investors.
8 For details of the computation of the measure, see Geweke (1982) and Breitung and Candelon (2006).

Topics in Middle Eastern and African Economies
Vol. 14, September 2012
171
If
2
12 ( )ie
=0, then the Geweke’s measure will be zero, then y will not Granger cause x at
frequency ω. Breitung and Candelon (2006) present this test by reformulating the relationship
between x and y in VAR equation:
1 1 1 1 1....... .......t t p t p t p t p tx x x y y (2)
The null hypothesis tested by Geweke, ( ) 0y xM
, corresponds to the null hypothesis of
0 : ( ) 0H R
where β is the vector of the coefficients of y and
cos( )cos(2 )..........cos( )( )
sin( )sin(2 )............sin( )
pR
p
Breitung and Candelon (2006) simplify Geweke’s null hypothesis so that a usual F-statistics
can be used to test causality in frequency domain. Therefore, this study uses Breitung and
Candelon (2006) version of Geweke (1982).
4. DATA
Monthly data is employed for China, Brazil, India, Indonesia, Korea, Mexico, Russia, Turkey
and South Africa for the period 2000 - 2010. Daily exchange rate (to US dollar) obtained from
FXTOP website9 is used to calculate monthly exchange rate volatility via standard deviation
for each month.
Since taking into account of developing countries’ exchange rate volatility will be misleading,
a benchmark of a developed country is specified in order to incorporate the differentiation
among developed and developing economies. UK is chosen as the benchmark.
Portfolio Investment Liabilities10
and Gross Domestic Product (both in US dollar currency)
are employed from International Financial Statistics (IFS). Ratio of portfolio investment to
GDP is quarterly data and interpolated to monthly data via constant match average. Industrial
9 http://fxtop.com , Accessed: 20 April 2011.
10 Portfolio investment liabilities include transactions with nonresidents in financial securities of any maturity
(such as corporate securities, bonds, notes, and money market instruments) other than those included in direct
investment, exceptional financing, and reserve assets.

Topics in Middle Eastern and African Economies
Vol. 14, September 2012
172
production (IP) index data is monthly obtained from OECD statistics. IP index is seasonally
adjusted.
4.1. DIMENSION INDEX
Ratio of portfolio investment liabilities to Gross Domestic Product is used as a measure for
openness. Exchange rate volatility is used in order to determine whether openness is stable or
not. Hence, an index is created to observe stability in openness (SIO index). If there is
openness, i.e., portfolio investment inflow is high, but there is also high exchange rate
volatility, SIO index will not reveal a significant increase (depending on the magnitude of
these two variables). In the same way, if there is a decline in financial openness but exchange
rate volatility also reflects a decline, SIO index will not reveal a significant decline
(depending on the magnitude of these two variables).
In order to create an index for stability in financial openness (SIO), dimension index
methodology employed in human development index (HDI)11
is utilized:
Dimension index: min value-max value
min value- valueactual
According to the HDI calculation methodology, dimension indices are calculated for each
variable that are included in HDI. Accordingly, if we are to construct an index for stability in
financial openness, we have to construct dimension indices for each variable that takes part in
the index, i.e., ratio of portfolio investment to GDP and exchange rate volatility. As
mentioned in the data section, UK is used as a benchmark, otherwise maximum and minimum
values for emerging economies will be chosen from themselves which will be highly
deceptive. For example, in order to calculate dimension index for portfolio investment, we
find maximum and minimum values among all nine economies (since UK is included) and for
each country and time series data, minimum value is subtracted and then divided by the
difference between maximum and minimum values. Hence, for each country, we obtain a
dimension index for portfolio investment. The same calculation is done for exchange rate
volatility and we obtain a dimension index for exchange rate volatility.
11
http://hdr.undp.org/en/statistics/indices , Accessed: 27 March 2011.
Topics in Middle Eastern and African Economies
Vol. 14, September 2012
173
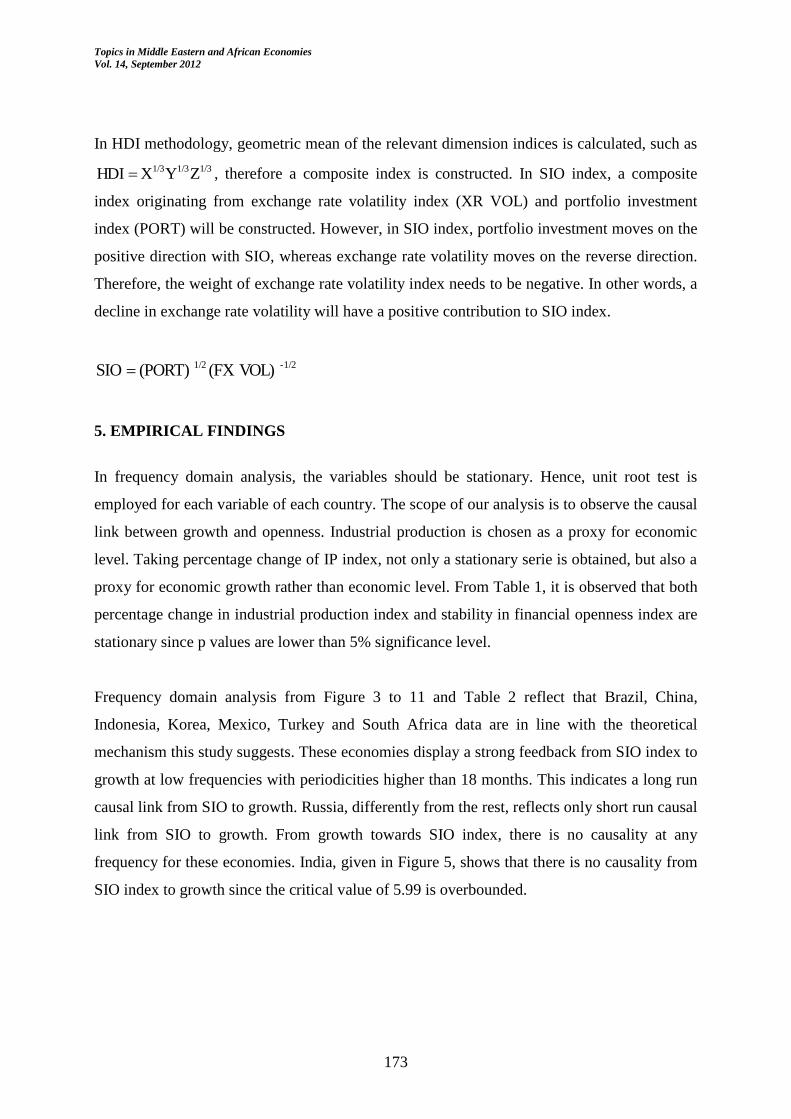
In HDI methodology, geometric mean of the relevant dimension indices is calculated, such as
1/31/31/3 ZYX HDI , therefore a composite index is constructed. In SIO index, a composite
index originating from exchange rate volatility index (XR VOL) and portfolio investment
index (PORT) will be constructed. However, in SIO index, portfolio investment moves on the
positive direction with SIO, whereas exchange rate volatility moves on the reverse direction.
Therefore, the weight of exchange rate volatility index needs to be negative. In other words, a
decline in exchange rate volatility will have a positive contribution to SIO index.
-1/21/2 VOL) (FX(PORT) SIO
5. EMPIRICAL FINDINGS
In frequency domain analysis, the variables should be stationary. Hence, unit root test is
employed for each variable of each country. The scope of our analysis is to observe the causal
link between growth and openness. Industrial production is chosen as a proxy for economic
level. Taking percentage change of IP index, not only a stationary serie is obtained, but also a
proxy for economic growth rather than economic level. From Table 1, it is observed that both
percentage change in industrial production index and stability in financial openness index are
stationary since p values are lower than 5% significance level.
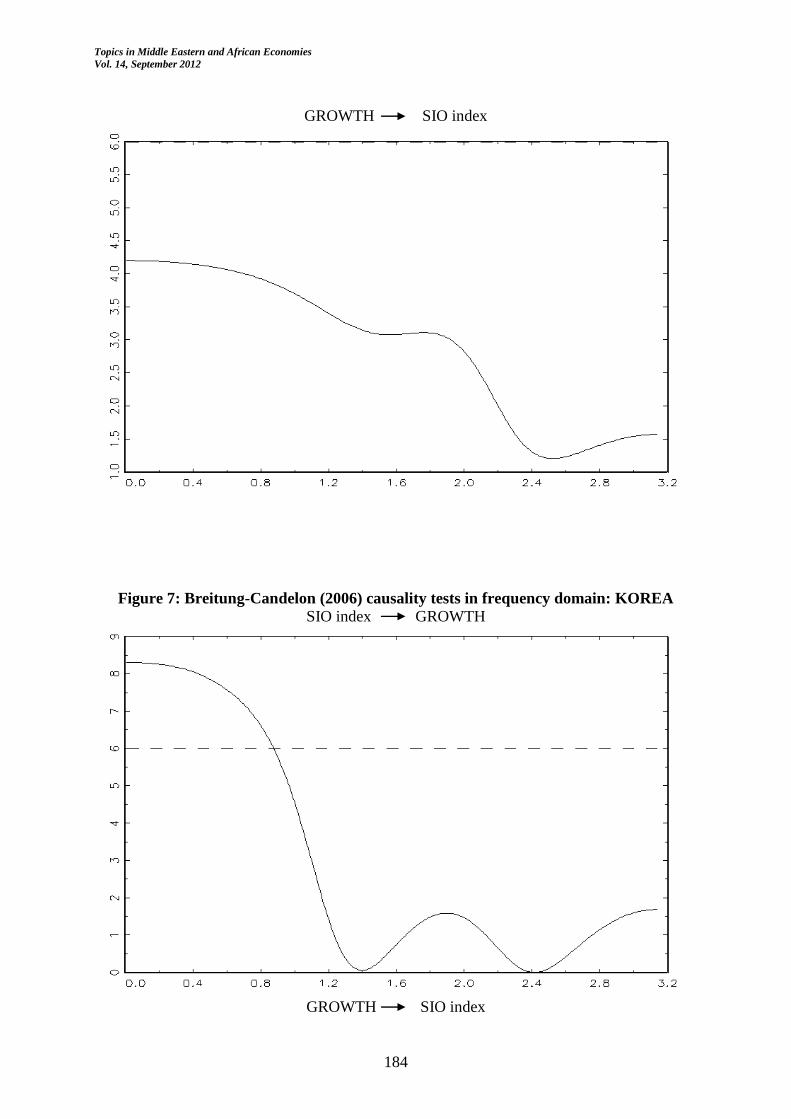
Frequency domain analysis from Figure 3 to 11 and Table 2 reflect that Brazil, China,
Indonesia, Korea, Mexico, Turkey and South Africa data are in line with the theoretical
mechanism this study suggests. These economies display a strong feedback from SIO index to
growth at low frequencies with periodicities higher than 18 months. This indicates a long run
causal link from SIO to growth. Russia, differently from the rest, reflects only short run causal
link from SIO to growth. From growth towards SIO index, there is no causality at any
frequency for these economies. India, given in Figure 5, shows that there is no causality from
SIO index to growth since the critical value of 5.99 is overbounded.

Topics in Middle Eastern and African Economies
Vol. 14, September 2012
174
6. CONCLUSION
This study suggests that stability in openness has a positive impact on economic growth. The
impetus on growth is conditional on economy’s ability attract foreign funds and exchange rate
stability. A new index is constructed using portfolio investment and exchange rate volatility
variables which we refer as stability in openness index (SIO). Empirical findings reflect that
all economies except for India show causality from SIO to growth. Among them, only Russia
reflects a short run relationship; the rest reflects a long run relationship. Existence of a causal
link indicates that financial openness with relatively stable FX contributes to growth. Eight
out of nine emerging countries reflect an expected situation since these economies receive
very large amounts of portfolio investments which create a potential and incentive for growth
if exchange rate reflects a nearly stable movement. China and India stand out from of the
other emerging economies together with their considerably high growth rates. Very high labor
force together with low wages brings about crucial advantage in growth for these economies.
Moreover China reflects another special situation of a very low FX volatility. It may be
argued that low FX volatility and therefore the peaceful export conditions contributes to
growth which shows itself with a long run and short run causal link between SIO and growth.
Concludingly, it may be argued that financial openness together with less volatility in
exchange rate presents the opportunity to grow for emerging economies. As Corden (2002)
highlighted, flexible exchange rate regime turns out to create high oscillations, in addition to
that it is quite probable that fixed or currency board systems may end up with a crisis since
they are very much exposed to external effects. At this point, managed floating exchange rate
system may be a reasonable policy decision for the emerging economies. However, it is up to
the real sector in these economies whether they will grow or not. As a further research, the
number of countries in dimension index will be increased in order to enhance the dataset and
obtain robust results. Pesaran et al. (2001) bounds test statistics may also be added in order to
obtain the relevant magnitudes.

Topics in Middle Eastern and African Economies
Vol. 14, September 2012
175
References
Bacchetta, P., 1992. “Liberalization of Capital Movements and of the Domestic Financial
System”, Economica, New Series, Vol. 59, No. 236, pp. 465-474.
Bekaert, G., Harvey, C.R., and Lundblad, C., 2005. “Does financial liberalization spur
growth?”, Journal of Financial Economics, Vol. 77, pp. 3–55
Borensztein, E., De Gregorio, J., Lee, J.-W., 1998. “How does foreign direct investment
affect economic growth?”, Journal of International Economics, Vol. 45, pp.115–135.
Breitung, J., Candelon, B., 2006. “Testing for Short and Long-run Causality: A Frequency
Domain Approach”, Journal of Econometrics, 132, 363-378.
Calderón, C. And Kubota, M., 2009. ”Does Higher Openness Cause More Real Exchange
Rate Volatility?”, The World Bank Policy Research Working Paper, No. 4896.
Choong, C.-K., Baharumshah, A.Z., Yusop, Z. and Habibulla, M.S., 2010. “Private capital
flows, stock market and economic growth in developed and developing countries: A
comparative analysis”, Japan and the World Economy, Vol. 22, pp. 107–117.
Corden, W. M., 2002. Too Sensational: On the Choice of Exchange Rate Systems, The MIT
Press.
Dickey, D. A., Fuller, W. A., 1979. “Distribution of the Estimators for Autoregressive Time
Series with a Unit Root”, Journal of the American Statistical Association, Vol. 74, pp. 427-
431.
Dickey, D. A., Fuller, W. A., 1981. “The Likelihood Ratio Statistics for Autoregressive Time
Series with a Unit Root”, Econometrica, Vol. 49, pp. 1057-1072.
Dornbusch, R., 1976. “Expectations and Exchange Rate Dynamics” Journal of Political
Economy, Vol. 84, pp. 1161-1176.
Edwards, S., 2001. “Capital mobility and economic performance: are emerging economies
different”. In: Siebert, H. (Ed.), The World’s New Financial Landscape: Challenges for
Economic Policy. Springer, Berlin, pp. 219–244.
Granger, C. W. J., 1981. “Some Properties of Time Series Data and their Use in Econometric
Model Specification”, Journal of Econometrics, Vol. 9, pp. 121-30.
Haber, S., 1997. “Financial markets and industrial development. A comparative study of
government regulation, financial innovation, and industrial structure in Brazil and Mexico”,
1840–1930. In: Haber, S. (Ed.), How Latin America Fell Behind: Essays on the Economic
Histories of Brazil and Mexico. Stanford University Press, Stanford, CA, pp. 1800–1914.
Henry, P.B., 2007. “Capital account liberalization: Theory, evidence and speculation”,
Journal of Economic Literature, Vol. 45, pp. 887-935.

Topics in Middle Eastern and African Economies
Vol. 14, September 2012
176
Klein, M., Olivei, G., 1999. “Capital account liberalization, financial depth and economic
Growth”, Federal Reserve Bank of Boston Working Paper.
Kose, M.A., Prasad, E.S. and Terrones, M.E., 2009. “Does openness to international financial
flows raise productivity growth?”, Journal of International Money and Finance, Vol. 28, pp.
554-580.
Pesaran, M. H., Shin, Y., Smith, R. J., 2001. “Bounds Testing Approaches to the Analysis of
Level Relationships”, Journal of Applied Econometrics, Vol. 16, pp. 289-326.
Quinn, D. P. and Toyoda, A. M. 2008. “Does Capital Account Liberalization Lead to
Growth?”, The Review of Financial Studies, Vol. 21, No. 3, pp. 1403-1449.
Rajan, R., Zingales, L., 1998. “Financial dependence and growth”. The American Economic
Review, Vol. 88, pp. 559–586.
Rodrik, D., 1999. The New Global Economy and Developing Countries: Making Openness
Work, Overseas Development Council, Washington, DC.
Sutherland, A., 1996. “Financial Market Integration and Macroeconomic Volatility”,
Scandinavian Journal of Economics, Vol. 98, No. 4, pp. 521-539.
Tornell, A., Westermann, F. and Martínez, L., 2003. “Liberalization, Growth, and Financial
Crises: Lessons from Mexico and the Developing World”, Brookings Papers on Economic
Activity, Vol. 2003, No. 2, pp. 1-88.
Yıldırım, N., Taştan, H., 2009. “Capital Flows and Economic Growth across Spectral
Frequencies: Evidence from Turkey”, Turkish Economic Association Working Paper Series
No. 2009/2, Ankara.

Topics in Middle Eastern and African Economies
Vol. 14, September 2012
177
APPENDIX
Figure 1: INDUSTRIAL PRODUCTION INDEX (seasonally adjusted)
40
60
80
100
120
140
160
00 01 02 03 04 05 06 07 08 09 10
BRA CHINA INDIA
INDO KOREA MEX
RUSSIA TURKEY ZAF
Figure 2: DAILY EXCHANGE RATE (normalized base to 100 with the initial date)

Topics in Middle Eastern and African Economies
Vol. 14, September 2012
178
0.5
1.0
1.5
2.0
2.5
3.0
3.5
00 01 02 03 04 05 06 07 08 09 10
BRA CHINA INDIA
INDO KOREA MEX
RUSSIA TURKEY ZAF
Table 1: ADF Unit Root Test
COUNTRIES VARIABLES Constant Constant&Trend
t stat p value t stat p value
BRAZIL SIO -5.177688 0.0000 -5.634018 0.0000
IP % change -12.68300 0.0000 -12.63307 0.0000
CHINA SIO -3.866243 0.0030 -7.829851 0.0000
IP % change -8.859375 0.0000 -8.847770 0.0000
INDIA SIO -4.826105 0.0001 -8.402658 0.0000
IP % change -12.81005 0.0000 -13.21371 0.0000
INDONESIA SIO -4.416906 0.0004 -4.672478 0.0012
IP % change -5.902410 0.0000 -5.878906 0.0000
KOREA SIO -6.507343 0.0000 -6.922494 0.0000
IP % change -10.02967 0.0000 -10.04388 0.0000
MEXICO SIO -4.573076 0.0002 -4.529760 0.0020
IP % change -12.40312 0.0000 -12.37070 0.0000
RUSSIA SIO -4.023726 0.0018 -7.429101 0.0000
IP % change -12.99133 0.0000 -12.96435 0.0000
TURKEY SIO -5.212453 0.0000 -5.258634 0.0001

Topics in Middle Eastern and African Economies
Vol. 14, September 2012
179
IP % change -23.67793 0.0000 -23.59197 0.0000
S. AFRICA SIO -4.706892 0.0001 -4.750631 0.0009
IP % change -16.57014 0.0000 -16.60784 0.0000
Table 2: Breitung-Candelon (2006) causality tests in frequency domain
COUNTRIES Frequency:
0<ω<0.35
Period: higher than 18
months
0.35<ω<π
Period: 2 months to 18
months
BRAZIL IP causes SIO NO NO
SIO causes IP YES NO (but yes up to ω=0.9 )
CHINA IP causes SIO NO NO
SIO causes IP YES YES
INDIA IP causes SIO NO NO
SIO causes IP NO NO
INDONESIA IP causes SIO NO NO
SIO causes IP YES NO (but yes up to ω=0.4 )
KOREA
IP causes SIO NO NO
SIO causes IP YES NO (but yes up to ω=0.9 )
MEXICO IP causes SIO NO NO
SIO causes IP YES NO (but yes up to ω=1.2 )
RUSSIA IP causes SIO NO NO
SIO causes IP NO NO (but yes after ω=1.6 )

Topics in Middle Eastern and African Economies
Vol. 14, September 2012
180
TURKEY IP causes SIO NO NO
SIO causes IP YES NO (but yes up to ω=0.8 )
S. AFRICA IP causes SIO NO NO
SIO causes IP YES NO
Lag is taken as 3 or 4 in all country cases. ω denotes frequency. π is the pi number which denotes the maximum
level of frequency.
Figure 3: Breitung-Candelon (2006) causality tests in frequency domain: BRAZIL
SIO index GROWTH
GROWTH SIO index

Topics in Middle Eastern and African Economies
Vol. 14, September 2012
181
Figure 4: Breitung-Candelon (2006) causality tests in frequency domain: CHINA SIO index GROWTH
GROWTH SIO index

Topics in Middle Eastern and African Economies
Vol. 14, September 2012
182
Figure 5: Breitung-Candelon (2006) causality tests in frequency domain: INDIA SIO index GROWTH
GROWTH SIO index

Topics in Middle Eastern and African Economies
Vol. 14, September 2012
183
Figure 6: Breitung-Candelon (2006) causality tests in frequency domain: INDONESIA
SIO index GROWTH
Topics in Middle Eastern and African Economies
Vol. 14, September 2012
184
GROWTH SIO index
Figure 7: Breitung-Candelon (2006) causality tests in frequency domain: KOREA SIO index GROWTH
GROWTH SIO index

Topics in Middle Eastern and African Economies
Vol. 14, September 2012
185
Figure 8: Breitung-Candelon (2006) causality tests in frequency domain: MEXICO SIO index GROWTH
IP index SIO index

Topics in Middle Eastern and African Economies
Vol. 14, September 2012
186
Figure 9: Breitung-Candelon (2006) causality tests in frequency domain: RUSSIA
SIO index GROWTH

Topics in Middle Eastern and African Economies
Vol. 14, September 2012
187
GROWTH SIO index
Figure 10: Breitung-Candelon (2006) causality tests in frequency domain: TURKEY SIO index GROWTH
GROWTH SIO index

Topics in Middle Eastern and African Economies
Vol. 14, September 2012
188
Figure 11: Breitung-Candelon (2006) causality tests in frequency domain: SOUTH
AFRICA SIO index GROWTH

Topics in Middle Eastern and African Economies
Vol. 14, September 2012
189
GROWTH SIO index