How does Product Differentiation Matter When Investing to Reduce
16
1 How does Product Differentiation Matter When Investing to Reduce Consumer Uncertainty? Panos M. Markopoulos Abstract This paper argues that firms should account for their products’ differentiation when investing to reduce consumer uncertainty about product attributes. We build a theoretical model to explain why firms that offer products that cater to a large consumer mass, should be more willing to invest in reducing uncertainty, compared to firms that offer more differentiated products. Furthermore, we show that firms can determine if buyers perceive their product as being differentiated or not, by observing the variance of the reviews that their product receives, making our managerial recommendations practical to follow. We present empirical evidence that is consistent with our findings, based on a large data set of PC-games. In addition to review variances we exploit the multidimensional nature of PC-game ratings and use additional differentiation measures to verify that, indeed, products that are less differentiated invest more to reduce consumer uncertainty. Keywords: information dissemination, product ratings, product review variances, multidimensional product ratings, consumer uncertainty reduction Introduction It is becoming increasingly important for firms to know when to invest in reducing buyer uncertainty about their products and services. Not only do firms have new technological means to invest to reduce uncertainty about their product characteristics and performance, but the importance of product information to buyers’ decision making process is also increasing, as evidenced by the increasing percentage of online and offline consumer purchases that are preceded by online product information search. Traditionally, firms have had a number of options regarding investing in reducing consumer uncertainty about the products that they introduce. Firms can choose to invest in thorough product testing (Farrell 1986) (Mazis et al. 1981), in better organizing and presenting their information so that consumers become better educated about the importance of the product attributes (Jin 2005) (Fishman and Hagerty 2003), in supporting certification intermediaries that act as trusted third parties (Albano and Lizzeri 2001), in providing product samples and free returns, or even in training their sales force so that it better communicates the product’s advantages to consumers (Vance 2011). The investment may even be indirect, by accepting future losses when releasing proprietary information that may allow competitors to undercut future firm profits (Verrecchia 1983) (Dye 1986). In recent years, technology has offered firms new ways with which to improve consumer knowledge about their products. Vendors can now showcase video instructions of product use, introduce interactive applications to help buyers find their perfect product fit and employ technology that allows buyers to sample the experience of owning the actual product (Miller 2011). These technologies make use of rich & interactive media and take advantage of increasing consumer familiarity with the Internet as an information acquisition medium. Even as firms have more investment options than ever before, regarding the dissemination of their product information, these investments are themselves becoming increasingly important. Indeed, a large and continuously growing portion of electronic commerce today, involves active information search on the part of consumers. In 2009, in the USA alone, 10-15% of retail sales that involve the Internet (including Research Online-Purchase Offline – ROPO) were the direct result of a consumer actively engaging in search for product information, and added up to a $57-67 billion market, about evenly split between pure online sales and ROPO (McKinsey Global Institute 2011). The number of consumers who perform such active information searches continues to increase. Accenture reported in 2007 that more
Transcript of How does Product Differentiation Matter When Investing to Reduce

1
How does Product Differentiation Matter When Investing to Reduce Consumer
Uncertainty? Panos M. Markopoulos
Abstract
This paper argues that firms should account for their products’ differentiation when investing to reduce consumer uncertainty about product attributes. We build a theoretical model to explain why firms that offer products that cater to a large consumer mass, should be more willing to invest in reducing uncertainty, compared to firms that offer more differentiated products. Furthermore, we show that firms can determine if buyers perceive their product as being differentiated or not, by observing the variance of the reviews that their product receives, making our managerial recommendations practical to follow. We present empirical evidence that is consistent with our findings, based on a large data set of PC-games. In addition to review variances we exploit the multidimensional nature of PC-game ratings and use additional differentiation measures to verify that, indeed, products that are less differentiated invest more to reduce consumer uncertainty.
Keywords: information dissemination, product ratings, product review variances, multidimensional product ratings, consumer uncertainty reduction
Introduction
It is becoming increasingly important for firms to know when to invest in reducing buyer uncertainty about their products and services. Not only do firms have new technological means to invest to reduce uncertainty about their product characteristics and performance, but the importance of product information to buyers’ decision making process is also increasing, as evidenced by the increasing percentage of online and offline consumer purchases that are preceded by online product information search.
Traditionally, firms have had a number of options regarding investing in reducing consumer uncertainty about the products that they introduce. Firms can choose to invest in thorough product testing (Farrell 1986) (Mazis et al. 1981), in better organizing and presenting their information so that consumers become better educated about the importance of the product attributes (Jin 2005) (Fishman and Hagerty 2003), in supporting certification intermediaries that act as trusted third parties (Albano and Lizzeri 2001), in providing product samples and free returns, or even in training their sales force so that it better communicates the product’s advantages to consumers (Vance 2011). The investment may even be indirect, by accepting future losses when releasing proprietary information that may allow competitors to undercut future firm profits (Verrecchia 1983) (Dye 1986).
In recent years, technology has offered firms new ways with which to improve consumer knowledge about their products. Vendors can now showcase video instructions of product use, introduce interactive applications to help buyers find their perfect product fit and employ technology that allows buyers to sample the experience of owning the actual product (Miller 2011). These technologies make use of rich & interactive media and take advantage of increasing consumer familiarity with the Internet as an information acquisition medium.
Even as firms have more investment options than ever before, regarding the dissemination of their product information, these investments are themselves becoming increasingly important. Indeed, a large and continuously growing portion of electronic commerce today, involves active information search on the part of consumers. In 2009, in the USA alone, 10-15% of retail sales that involve the Internet (including Research Online-Purchase Offline – ROPO) were the direct result of a consumer actively engaging in search for product information, and added up to a $57-67 billion market, about evenly split between pure online sales and ROPO (McKinsey Global Institute 2011). The number of consumers who perform such active information searches continues to increase. Accenture reported in 2007 that more

Differentiation & Information Investments
2 Working paper. Please do not cite.
than two thirds of consumers surveyed, research product features online and cited an increasing trend (Accenture 2007). The e-tailing group (Ε-tailing group 2008) reports that the number of people who appreciate (“important when buying online”) the retailers’ investments to inform consumers, is increasing: the percentage of consumers who think product comparison capabilities as important grew from 67% in 2007 to 70% in 2008, the percentage of those who value guides and how-to information grew from 38% to 42%, and the percentage of those who believe product videos are important grew from 25% to 31%. It is interesting to note that the use of the Internet for information acquisition purposes does not appear to be restricted to specific market segments: a survey by the search provider Google of individuals who earn more than 1 million dollars per year, has shown that 91% of them research luxury products online before purchase (Zmuda 2008). In addition, product information availability is often cited ahead of price and product design, as the most important reason for holding back novel products and services. For example, in the case of Downloadable Content (DLC) – additional, free or for-pay, content that complements existing video-game titles – four of the top ten reasons among consumers who have not tried these products are related to product uncertainty, versus three related to mismatch with consumer preferences, two related to price, and one concerning privacy (EEDAR 2011).
Firms who understand the significance of investing in reducing consumer uncertainty today, must use all the information that is available to them in order to make an optimal investment decision. One important piece of information that firms can use in order to determine their optimal investment in informing consumers is the degree of their product’s differentiation. This article argues that low product differentiation should encourage investment in reducing consumer uncertainty.
Product differentiation, as perceived by consumers, is not only an appropriate determinant of the optimal product information investment, but it is also a piece of information that firms can easily obtain by using a variety of indicators that can help them ascertain their degree of differentiation vis-à-vis their competitors, if it is not already clear to them. These indicators of product differentiation can be obtained by observing consumer and expert product reviews that are increasingly available online. While we define and discuss multiple metrics that can be used to ascertain a product’s differentiation, such as Euclidean and Cosine Distances of products that are reviewed in multiple attribute dimensions, we primarily focus on product reviews variance, as the metric that is most widely observable and available even for products that are simply rated with the popular 1 to 5 star mechanism. Therefore, the key managerial question that this article explores is “How do I account for my product review variance, when deciding to invest in reducing consumer uncertainty”.
It is well accepted that firms must account for their product quality, when deciding whether or not to invest to reduce consumer uncertainty. Jovanovic was the first of many researchers to study how firms undertake costly information investments, taking into account their product quality (Jovanovic 1982). Jovanovic showed that, given the cost of the investment, only firms above a quality threshold should invest in reducing consumer uncertainty. The result was an extension of the quality unraveling argument, first presented in (Grossman and Hart 1980) and in (Milgrom 1981), which states that rational buyers should discount the quality of firms who do not try to demonstrate their quality. When quality demonstration is costly, the Jovanovic threshold applies. Therefore, as long as the average consumer review is an indicator of how the product’s quality is being perceived by consumers, a high average consumer review should encourage firms to invest in further reducing consumer uncertainty.
However, the relationship between a high average product review and investing in reducing consumer uncertainty has only been indirectly demonstrated empirically. Usually, the relationship that is being directly explored is between average product review and subsequent sales. For example, for movies (Dellarocas, Zhang, and Awad 2007) and books (Chevalier and Mayzlin 2006) average product review has been associated with higher future sales. Since consumer uncertainty about a product reduces with time, as consumers become more familiar with the product’s characteristics, what these articles show is that, as consumers learn more about high rating products, their sales rise. It stands to reason that high rating firms should invest in reducing consumer uncertainty in order to speed up the process. Indeed, Duan, Gu, and Whinston (Duan, Gu, and Whinston 2008) were careful to account for products being heterogeneous in quality, which reflects upon their average product review. Considering this heterogeneity, the authors carefully show that high product reviews do not influence future sales, but rather predict them, merely because high reviews are the result of higher quality.

Differentiation & Information Investments
Working paper. Please do not cite. 3
Recently, researchers have tried to extract more information from consumer reviews by looking at product review variance. Clemons, Gao, and Hitt (Clemons, Gao, and Hitt 2006) were the first to use product review variance and they showed that high product review variance in the craft beer market is subsequently associated with higher product market share growth. Sun (Sun 2012) found the same to be true for books, but only if the average product review is sufficiently low. Both articles connect review variance with the degree of differentiation, an approach that is also adopted here. The relationship between product differentiation and investing in reducing consumer uncertainty was directly explored in (Brynjolfsson, Hu, and Simester 2011), where the authors have shown that long-tail products asymmetrically benefit by the introduction of technologies that facilitate the consumers’ information acquisition process. Table 1 summarizes and codified the features of the key relevant literature.
The contribution of the present article is twofold: first it shows that product review variance can inform firms’ investments in reducing consumer uncertainty. More specifically, the mathematical model employed explains that products that cater to the mass-market, and thus associated with lower review variance, should invest more in reducing consumer uncertainty. Second, to the best of the author’s knowledge, it is the first article to offer direct evidence of the correlation between product review variances and product information investments. More specifically, analyzing a unique data set of 2,196 PC-games in the software entertainment market, it is shown that products with lower review variances invest more in the costly development of a playable game demo version that helps reduce consumer product uncertainty.
The rest of the paper is organized as follows: The mathematical model is developed next, and the main result, that mass-market – low variance – products should be associated with higher information investments, is demonstrated. In the empirical analysis of the PC-game market that follows, product review variance and alternative product differentiation metrics, are shown to predict higher product information investments. The managerial implications and conclusions are presented last.
How do firms account for product quality or differentiation when deciding to invest to reduce consumer uncertainty?
Article Explores Managerial Implication Empirical Evidence
Jovanovic 1982 Quality Higher quality products should invest more –
Chevalier & Mayzlin 2006 Quality (avg. review) Higher quality products should invest more Indirect
Dellarocas et al. 2007 Quality (avg. review) Higher quality products should invest more Indirect
Duan et al. 2008 Quality (avg. review) Higher quality products should invest more Indirect
Clemons et al. 2006
Differentiation (review variance)
Hyperdifferentiated products should invest more Indirect
Brynjolfsson 2011 Long-tail (sales rank) Long-tail products should invest more Direct
Sun 2012 Differentiation (review variance)
High variance products should invest more iff their quality is low Indirect
Current article Differentiation (review variance & other measures)
Low variance products invest more Direct
Table 1: Key relevant literature

Differentiation & Information Investments
4 Working paper. Please do not cite.
Mathematical Model
Before we proceed with the definition of the mathematical model, it will be helpful to discuss the intuition behind the model and the market mechanism that it tries to simulate. This will help motivate the model’s development, justify the model’s assumptions, and provide insight into the model’s results.
Model Intuition
It would first be useful to consider the reason why consumer uncertainty about a product’s characteristics can lead to lower sales. We would like to be able to do so without assuming consumer risk aversion. If we establish that there are alternative reasons for uncertainty to reduce product sales, and that these reasons differ predictably for different products, then these differences should be observable regardless of whether or not consumers are risk averse.
Different buyers have different preferences regarding their ideal product or service. Most buyers agree that for product parameters that are quality related, such as the memory capacity of a tablet, or the amount of playable content included in a PC-game, more is better (within reason). But buyers in general do not agree on product parameters that are taste/type-related, such as the position of the task bar in a desktop operating system, or the sleeve size of a dress shirt. Buyers even disagree on bundles of quality parameters. For example, even if both graphics and audio & sound effects in a PC-game are quality related parameters, for a given development cost, one buyer may prefer the game that has chosen to equally develop the two dimensions, while another buyer may prefer a game that has given precedence to graphics over sound & audio. The final value of a product to a consumer will depend on both the quality and taste-related product characteristics, as well as on the consumer’s idiosyncratic preferences.
There is an important difference in the case of a buyer considering purchasing a product likely to be her ideal and the case of a buyer considering purchasing a product that is known to not be her ideal. A buyer may only imperfectly observe product characteristics, but may still observe enough to be able to conclude that the product does not match her ideal preference and is in fact some distance away from whatever she considers to be ideal. However, this does not imply that the buyer will not purchase the product. The buyer may incur a disutility cost for a product that is not her ideal, but for the right price, the product may still be desirable. In fact, when buying a product that is known to not be ideal, uncertainty may not necessarily reduce the product’s desirability: in light of more information that updates the buyers’ knowledge of the product attributes, the product may actually turn out to be better than originally anticipated. In other words, if the buyer knows the product not to be ideal, uncertainty does not necessarily reduce the product’s expected value. This contrasts with the case where the buyer observes enough of the product to conclude that the product is likely to be her ideal preference. In this case, information that updates the buyer’s knowledge of the product attributes can make the product appear further away than the buyer’s ideal, or, in the best case scenario, can leave the buyer’s prior, that the product is ideal, unchanged. This leads us to the conclusion that uncertainty about a product’s characteristics reduces the willingness-to-pay of buyers whose ideal preference is close to the product, much more than it reduces the willingness-to-pay of buyers whose ideal preference is some distance away from the product. Clemons mathematically demonstrates this fact in (Clemons 2008), and the result is also directly observable in our mathematical model.
Consider then a mass-market (low differentiation) product about which consumers are uncertain. It is very likely that this product has been positioned in a part of the product space that a large concentration of consumers considers to be attractive, or even ideal, as most buyers do not favor highly differentiated (niche) varieties. Example of such products can include a popular ice cream taste (e.g., vanilla ice cream), or a popular “balanced” trade-off between a game’s graphics and responsiveness & playability. Since this mass-market product is situated in a part of the product space with a high concentration of potential buyers, uncertainty about this product is likely to reduce the product value to great many consumers. On the contrary, a more differentiated product is likely located in a part of the product space where the concentration of buyers is lower and thus uncertainty about a more differentiated product will not

Differentiation & Information Investments
Working paper. Please do not cite. 5
reduce the product value to as many buyers1. This leads us to the conclusion that, other things equal, a mass market product will be willing to invest more than a differentiated product, in order to reduce consumer uncertainty about its characteristics.
Today, firms have readily available indicators of how differentiated their products are perceived to be by consumers. One indicator is the variance of its online reviews, as has been first noted in (Clemons, Gao, and Hitt 2006) and subsequently in (Sun 2012), an approach that is also followed in this article. The intuition is that any sufficiently differentiated product is likely to attract more buyers whose ideal is closer to the center of the market, than it is to attract buyers whose ideal is even further out in the product space, due to the higher concentration of buyers in middle market segments. This asymmetry is observable as higher review variance, as the next sections show. An alternative indicator of differentiation, that this article is the first to employ, is a product’s proximity to other products in the multi-attribute product space. The implicit assumption is that there are more products catering to mass-market tastes than there are products catering to differentiated preferences. Consequently, a product with many close alternatives in the product space is likely to denote a product in a region with a relatively large concentration of buyer preferences.
Model Definition
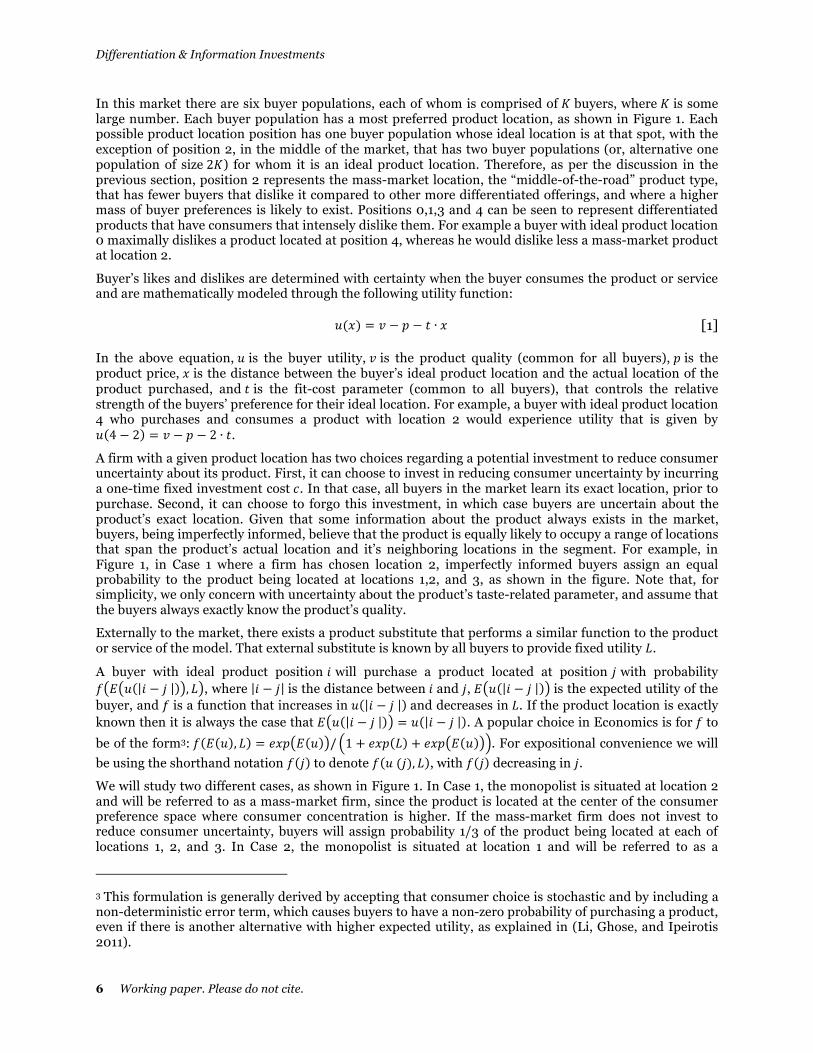
A monopolist offers a product composed of one taste-related and one quality-related characteristic in a market that is modeled after a quantized Hotelling segment, with a size of four units (see Figure 1). The value of the product’s quality attribute is denoted by 𝑣𝑣. The firm chooses its taste-related attribute by deciding exactly where on the line segment to position its product. There are five different options that are possible, numbered in Figure 1 from 0 to 4, and this is common knowledge among consumers. Thus, in this quantized version of the Hotelling segment, a firm can only chose a finite number of positions. Indeed, it is often the case that due to technological and practical considerations, the design options of a firm are restricted to a non-continuous space2. The results do not depend on the assumption that positions are quantized; it is merely a modeling convenience. The product production cost is normalized to zero.
1 Clemons & Gao have argued convincingly (Clemons and Gao 2008) that, if a highly differentiated product is much more expensive to make, e.g., due to lack of economies of scale, only buyers who truly love the product will be willing to pay its higher price. In that case, uncertainty may be truly unacceptable for the niche product. 2 Examples obviously include finite choices such as the default font choice in an e-reader device and the location of the task bar in an operating system, but also include choices that are by nature continuous, such as the neck size of a dress shirt: even though theoretically fabric size is a continuous variable, in practice only a finite number of standard sizes are offered.
Figure 1: Our model of a differentiated market
Differentiation & Information Investments
6 Working paper. Please do not cite.
In this market there are six buyer populations, each of whom is comprised of 𝐾𝐾 buyers, where 𝐾𝐾 is some large number. Each buyer population has a most preferred product location, as shown in Figure 1. Each possible product location position has one buyer population whose ideal location is at that spot, with the exception of position 2, in the middle of the market, that has two buyer populations (or, alternative one population of size 2𝐾𝐾) for whom it is an ideal product location. Therefore, as per the discussion in the previous section, position 2 represents the mass-market location, the “middle-of-the-road” product type, that has fewer buyers that dislike it compared to other more differentiated offerings, and where a higher mass of buyer preferences is likely to exist. Positions 0,1,3 and 4 can be seen to represent differentiated products that have consumers that intensely dislike them. For example a buyer with ideal product location 0 maximally dislikes a product located at position 4, whereas he would dislike less a mass-market product at location 2.
Buyer’s likes and dislikes are determined with certainty when the buyer consumes the product or service and are mathematically modeled through the following utility function:
𝑢𝑢(𝑥𝑥) = 𝑣𝑣 − 𝑝𝑝 − 𝑡𝑡 ∙ 𝑥𝑥 [1]
In the above equation, 𝑢𝑢 is the buyer utility, 𝑣𝑣 is the product quality (common for all buyers), 𝑝𝑝 is the product price, 𝑥𝑥 is the distance between the buyer’s ideal product location and the actual location of the product purchased, and 𝑡𝑡 is the fit-cost parameter (common to all buyers), that controls the relative strength of the buyers’ preference for their ideal location. For example, a buyer with ideal product location 4 who purchases and consumes a product with location 2 would experience utility that is given by 𝑢𝑢 4 − 2 = 𝑣𝑣 − 𝑝𝑝 − 2 ∙ 𝑡𝑡.
A firm with a given product location has two choices regarding a potential investment to reduce consumer uncertainty about its product. First, it can choose to invest in reducing consumer uncertainty by incurring a one-time fixed investment cost 𝑐𝑐. In that case, all buyers in the market learn its exact location, prior to purchase. Second, it can choose to forgo this investment, in which case buyers are uncertain about the product’s exact location. Given that some information about the product always exists in the market, buyers, being imperfectly informed, believe that the product is equally likely to occupy a range of locations that span the product’s actual location and it’s neighboring locations in the segment. For example, in Figure 1, in Case 1 where a firm has chosen location 2, imperfectly informed buyers assign an equal probability to the product being located at locations 1,2, and 3, as shown in the figure. Note that, for simplicity, we only concern with uncertainty about the product’s taste-related parameter, and assume that the buyers always exactly know the product’s quality.
Externally to the market, there exists a product substitute that performs a similar function to the product or service of the model. That external substitute is known by all buyers to provide fixed utility 𝐿𝐿.
A buyer with ideal product position 𝑖𝑖 will purchase a product located at position 𝑗𝑗 with probability 𝑓𝑓 𝐸𝐸 𝑢𝑢 𝑖𝑖 − 𝑗𝑗 , 𝐿𝐿 , where 𝑖𝑖 − 𝑗𝑗 is the distance between 𝑖𝑖 and 𝑗𝑗, 𝐸𝐸 𝑢𝑢 𝑖𝑖 − 𝑗𝑗 is the expected utility of the buyer, and 𝑓𝑓 is a function that increases in 𝑢𝑢 𝑖𝑖 − 𝑗𝑗 and decreases in 𝐿𝐿. If the product location is exactly known then it is always the case that 𝐸𝐸 𝑢𝑢 𝑖𝑖 − 𝑗𝑗 = 𝑢𝑢 𝑖𝑖 − 𝑗𝑗 . A popular choice in Economics is for 𝑓𝑓 to
be of the form3: 𝑓𝑓 𝐸𝐸 𝑢𝑢 , 𝐿𝐿 = 𝑒𝑒𝑒𝑒𝑒𝑒 𝐸𝐸 𝑢𝑢 / 1 + 𝑒𝑒𝑒𝑒𝑒𝑒 𝐿𝐿 + 𝑒𝑒𝑒𝑒𝑒𝑒 𝐸𝐸 𝑢𝑢 . For expositional convenience we will be using the shorthand notation 𝑓𝑓 𝑗𝑗 to denote 𝑓𝑓 𝑢𝑢 (𝑗𝑗), 𝐿𝐿 , with 𝑓𝑓 𝑗𝑗 decreasing in 𝑗𝑗.
We will study two different cases, as shown in Figure 1. In Case 1, the monopolist is situated at location 2 and will be referred to as a mass-market firm, since the product is located at the center of the consumer preference space where consumer concentration is higher. If the mass-market firm does not invest to reduce consumer uncertainty, buyers will assign probability 1/3 of the product being located at each of locations 1, 2, and 3. In Case 2, the monopolist is situated at location 1 and will be referred to as a
3 This formulation is generally derived by accepting that consumer choice is stochastic and by including a non-deterministic error term, which causes buyers to have a non-zero probability of purchasing a product, even if there is another alternative with higher expected utility, as explained in (Li, Ghose, and Ipeirotis 2011).

Differentiation & Information Investments
Working paper. Please do not cite. 7
differentiated firm, since the product is located further away from the center of consumer preferences. If the differentiated firm does not invest to reduce consumer uncertainty, buyers will assign probability 1/3 of the product being located at each of locations 0,1, and 2.
In both cases 𝑣𝑣 and 𝑝𝑝 will be the same and the only decision that firms are asked to make is whether or not to invest 𝑐𝑐 and eliminate consumer uncertainty. One interpretation is of a Path Dependency where firms have chosen their quality investments and pricing in the past, before the distribution of consumer preferences became known, causing some firms to correctly predict the center of consumer preferences and other firms to locate their product some distance away from it. Additionally, there are popular consumer markets, such as online music and films, where the firms have little or no control of their products’ price, which is determined by the distributors. The important matter is that this simplification is used to maintain the “all else equal” hypothesis and allows us to focus only on how the firms’ location impacts its information investment decision.
We also assume that all buyers in the market have positive utility for the two products, and since the largest fit distance in the model is 3 (buyers that prefer location 4, purchasing from the differentiated firm located at position 1), this translates to 𝑣𝑣 > 𝑝𝑝 − 3𝑡𝑡.
Finally, when a buyer purchases the product, the actual fit with her ideal product location becomes known to her, if it was not already known, and the buyer posts an online review, rating the product at:
𝑅𝑅 𝑥𝑥 = 𝑣𝑣 − 𝑥𝑥 ∙ 𝑡𝑡 [2]
This assumes that consumers rate the non-price portion of the utility objectively; they exclude price considerations and do not punish (or reward) products that turn out to be worse (or better) than they expected prior to purchase.
Model Results & Hypothesis Formulation
We are going to calculate the information investment cost 𝑐𝑐 for which the firms in both cases would be willing to invest and reduce consumer uncertainty, by making use of Table 2. For each of the five product positions allowed in our model, Table 2 shows the number of buyers in that location and the demand that the firm draws from that location for each of the two cases and for the two different options of investing and not investing in reducing consumer uncertainty.
For most locations, the demand that buyers in that location generate is the same regardless of whether the firm invests in reducing their uncertainty, or not. For example, in location 0, the buyers’ expected utility
What is the consumer demand difference between investing and not investing in reducing consumer uncertainty for a mass-market and a differentiated firm?
Case 1: mass-market demand Case 2: differentiated demand
Location # of buyers No investment Investment No investment Investment
0 K K · ƒ (2) K · ƒ (2) K · ƒ (1) K · ƒ (1)
1 K K · ƒ (1) K · ƒ (1) K · ƒ (2/3) K · ƒ (0)
2 2K 2K · ƒ (2/3) 2K · ƒ (0) 2K · ƒ (1) 2K · ƒ (1)
3 K K · ƒ (1) K · ƒ (1) K · ƒ (2) K · ƒ (2)
4 K K · ƒ (2) K · ƒ (2) K · ƒ (3) K · ƒ (3)
Table 2: Reducing consumer uncertainty for the mass-market vs. the differentiated firm

Differentiation & Information Investments
8 Working paper. Please do not cite.
in the case of non-investment by the mass-market monopolist is given by: + + =𝑣𝑣 − 𝑝𝑝 − 2𝑡𝑡 . The demand that the firm draws from these buyers is thus given by 𝐾𝐾 ∙ 𝑓𝑓 𝑢𝑢 2 , 𝐿𝐿 ≡ 𝐾𝐾 ∙ 𝑓𝑓 (2).
This equals the demand that buyers at location 0 generate for a product that is known to be located at 2 (the firm has invested in eliminating their uncertainty). The same buyers have utility for the non-investing differentiated firm given by: + + = 𝑣𝑣 − 𝑝𝑝 − 𝑡𝑡 and generate demand of 𝐾𝐾 ∙ 𝑓𝑓 (1) for the firm. This equals the demand that these buyers generate for the differentiated firm that has invested to reduce their uncertainty.
However, buyers whose ideal location is on the exact spot where the firm is situated do generate different demand, depending on whether the firm invests in reducing their uncertainty, or not. This is essentially the quantized form of the argument put forward in (Clemons 2008). For example, in location 1, the buyers’ expected utility in the case of non-investment by the differentiated monopolist is given by:
+ + = 𝑣𝑣 − 𝑝𝑝 − 2𝑡𝑡/3 . The demand that the firm draws from these buyers is thus given by 𝐾𝐾 ∙ 𝑓𝑓 𝑢𝑢 2/3 , 𝐿𝐿 ≡ 𝐾𝐾 ∙ 𝑓𝑓 (2/3), which differs from the demand that buyers at location 1 generate for a product that is known to be located at 1, which is simply given by 𝐾𝐾 ∙ 𝑓𝑓 (0). The same is true for buyers whose ideal product location is at position 2, in the case of the mass-market monopolist, only now the number of these buyers is twice as large.
Based on the above analysis, the mass market monopolist who invests in reducing consumer uncertainty, would expect to increase revenue by 2𝑝𝑝𝑝𝑝 𝑓𝑓 (0) − 𝑓𝑓 (2/3) , whereas the differentiated monopolists who invests to reduce uncertainty would increase revenue by 𝑝𝑝𝑝𝑝 𝑓𝑓 (0) − 𝑓𝑓 (2/3) . Consequently, the mass-market monopolist would invest as long as the investment cost 𝑐𝑐 is lower than 2𝑝𝑝𝑝𝑝 𝑓𝑓 (0) − 𝑓𝑓 (2/3) , whereas the differentiated monopolist would require half the investment cost to justify reducing consumer uncertainty. In other words, the mass-market firm has a stronger incentive to invest to reduce consumer uncertainty, than the differentiated firm.
We now turn our attention to the means and variances of the reviews that the two firms receive by the buyer population. In the case where the firms invested to reduce consumer uncertainty, the mean 𝑚𝑚 of the reviews received by the mass market firm, and the mean 𝑚𝑚 of the reviews received by the differentiated firm, after simplifying for 𝐾𝐾, are given by:4
𝑚𝑚 =2𝑓𝑓 0 𝑅𝑅(0) + 2𝑓𝑓 1 𝑅𝑅(1) + 2𝑓𝑓(2)𝑅𝑅(2)
2𝑓𝑓 0 + 2𝑓𝑓 1 + 2𝑓𝑓(2)𝑚𝑚 =
𝑓𝑓 0 𝑅𝑅(0) + 3𝑓𝑓 1 𝑅𝑅(1) + 𝑓𝑓(2)𝑅𝑅(2) + 𝑓𝑓(3)𝑅𝑅(3)𝑓𝑓 0 + 3𝑓𝑓 1 + 𝑓𝑓(2) + 𝑓𝑓(3)
[3]
The review variance 𝑣𝑣𝑣𝑣𝑣𝑣 for the mass-market firm would be:
𝑣𝑣𝑣𝑣𝑣𝑣 =
2𝑓𝑓 0 𝑅𝑅 0 −𝑚𝑚 + 2𝑓𝑓 1 𝑅𝑅 1 −𝑚𝑚 + 2𝑓𝑓 2 𝑅𝑅 2 −𝑚𝑚2𝑓𝑓 0 + 2𝑓𝑓 1 + 2𝑓𝑓(2)
[4]
The review variance 𝑣𝑣𝑣𝑣𝑣𝑣 for the differentiated firm would be:
𝑣𝑣𝑣𝑣𝑣𝑣 =
𝑓𝑓 0 𝑅𝑅 0 −𝑚𝑚 + 3𝑓𝑓 1 𝑅𝑅 1 −𝑚𝑚 + 𝑓𝑓 2 𝑅𝑅 2 −𝑚𝑚 + 𝑓𝑓 3 𝑅𝑅 3 −𝑚𝑚𝑓𝑓 0 + 3𝑓𝑓 1 + 𝑓𝑓(2) + 𝑓𝑓(3)
[5]
It is well established in the literature, and it is not the focus of the present article, that firms should account for their product quality, reflected in the mean of the reviews that they receive, when investing to inform consumers about product or service attributes. Researchers, begin to understand that firms should also account for the variance of the reviews that they receive, as the variance is related to differentiation, which in turn influences their information investment decisions. Thus, the model findings are particularly useful for managers who are not certain whether or not their product is viewed as differentiated by consumers, so that they can decide to make investments that reduce consumer uncertainty. 4 The means and variances of product reviews, when the firms have not invested in reducing consumer uncertainty are similar, with 𝑓𝑓 2/3 substituted for 𝑓𝑓 0 .

Differentiation & Information Investments
Working paper. Please do not cite. 9
In the emerging literature that studies the distribution of product ratings, a standard deviation (or variance) of product reviews is usually associated with more differentiated products, as is the case in (Clemons, Gao, and Hitt 2006) and in (Sun 2012). However, it is not the case that the review variance should always be higher for the more differentiated product, independent of the form of the demand function 𝑓𝑓. A simple numerical counterexample is obtained by using a linear 𝑓𝑓 of the form 𝑓𝑓 𝐸𝐸 𝑢𝑢 , 𝐿𝐿 =𝐸𝐸 𝑢𝑢 /4𝐿𝐿, with 𝐸𝐸 𝑢𝑢 < 4𝐿𝐿. The form of 𝑓𝑓 was chosen so that no buyer would buy from the firm if it offers zero utility, and all buyers would buy from it, if it offers four times the utility 𝐿𝐿 of the external substitute. In this case, for 𝑝𝑝 = 1, 𝑡𝑡 = 1, 𝐿𝐿 = 1, for any 𝑣𝑣 lower than ≈ 4.9 it is the case that 𝑣𝑣𝑣𝑣𝑣𝑣 < 𝑣𝑣𝑣𝑣𝑣𝑣 , contrary to what previous literature generally assumes. In fact it is easy to show (proof omitted) that for a linear demand, as above, the product quality 𝑣𝑣 has to be above a certain threshold for the expected result, that higher review variance is associated with more differentiated products, to hold.
The managerial implication is that firms should not take for granted that higher review variances in their market are associated with more differentiated products, but they should rather first test this assumption, before using review variances to help them decide on investments that reduce consumer uncertainty. One recommendation is for managers to obtain review variances for products that are widely regarded as mass-market or as differentiated, and use them to decide whether review variances in their market increase or decrease with product differentiation. Another recommendation, and one that we employ in the next section, is to also estimate product differentiation by an alternative methodology (for example using distances in the multi-dimensional product space) and observe how variances behave. However, this second option assumes that such a methodology is available, in which case it would very well be used in addition to product review variances to inform firms investment decisions.
Based on the theoretical framework above, we formulate the following hypothesis.
Hypothesis 1: In markets where the mass-market products are associated with lower product review variance, a low review variance should be associated with investments designed to reduce consumer uncertainty about product characteristics
Empirical Evidence
Choosing the data set with which to test the stated hypothesis, three features are of particular importance. First, the products must come from an established market with a large number of product reviews. Second, firms’ investments in reducing consumer uncertainty must be observable and unambiguous. Third, it is highly desirable for the data to include additional information that can help us verify that higher review variances are associated with more differentiated products, as most current literature argues.
An excellent candidate is the PC-game market, with thousands of products that are being thoroughly reviewed online since the mid-1990s. In the PC-game market, game developers have a 0-1 choice when investing to reduce consumer uncertainty about their product attributes: they either release a playable demo version of the game, or not. This binary choice allows us to unambiguously assess whether an investment has been made. Also, releasing a demo version of a game is a non-trivial investment decision on the part of game developers: the firms must repackage games to smaller sizes for Internet distribution, they must include enough content for potential buyers to experience what the game is like, but not enough content so that the demo becomes a substitute for the game, and they must employ the original development team rather than immediately releasing them to the next project, as firms are pressed to do in a market where labor utilization is known to be very high (Stross 2004). Indeed, as we observe, in more than 40% of the cases in our large data sample, the game developer chose not to develop a playable demo version of the game, reinforcing our argument that decision makers are behaving strategically when releasing a demo version. Finally, unlike the case of books, films and music, which are usually employed in studies of product reviews, PC-games, even within their specific genres, have distinct and widely understood attributes, such as graphics, sounds, gameplay, and game longevity, which allow us construct similarity measures and identify parts of the product space where games are more concentrated and parts of the product space where games are more differentiated. This allows us to verify that higher review variances are associated with product differentiation, before employing variances in our regressions.

Differentiation & Information Investments
10 Working paper. Please do not cite.
Data Description
Data was obtained from GameSpot, a leading video gaming website, now part of CBS Interactive, that since 1996 has been providing news, reviews, downloads, and other information on thousands of PC-games. GameSpot employs professional reviewers to review all games that it covers and includes meta-reviews, by aggregating review scores from other websites. Further, it collects additional downloadable content that the game developer has published, such as playable game demos, and links to them directly from the product review page. GameSpot classifies each game in one out of eight different genres, such as Adventure, Strategy, etc. The professional reviewer rates each game from a score ranging from 0 to 10, and, prior to 2007, also rated the game according to five attributes: “Gameplay” – interface, control and how “fun” the game is to play – “Graphics”, “Sound”, “Value” – the game's longevity, i.e., the total amount of playable content – and “Reviewer's Tilt”, which, according to GameSpot’s description, allows the reviewers to subjectively influence a game’s total score, when they feel that the other four attributes do not add up to a score that does justice to how much they enjoyed the game overall. In June 2007, GameSpot discontinued this practice, and from then on, it would only give a final 0-10 score to each game. Since the game attribute information is very useful for the construction of game similarity (differentiation) measures, we focused on PC-games before its discontinuation. Further, at about 2005, with the launch of the popular Xbox 360 platform the relative importance of PC-games began to diminish, just as video sites, such at YouTube, witnessed the popularity of video game channels explode. These channels offer comprehensive video footage and commentary on video game walkthroughs, radically changing the role that playable game demos perform, as methods that reduce consumer product uncertainty.
We collected data through the Internet Archive (www.archive.org), the non-profit digital library, which maintains older versions of the GameSpot website from as far back as 1996. We obtained complete data on 2,196 PC-games from 1996 to mid-20055. For each game we collected the game title, the game genre, the developing company, the game’s release date, the GameSpot’s reviewer total score, as well as its score on the five attributes, we noted whether or not the game released a playable demo version, and finally, we collected the list of the game ratings that the game received from reviewers in other websites, normalized for comparisons. In calculating game review variances, we included only games that received at least 4 reviews, leaving n=1,441 PC-games for the model that uses review variances, and verified that the results are robust to including games with at least 3 or at least 5 reviews. Finally, we excluded the “Reviewer’s Tilt” parameter from the calculation of similarity measures, since it is not an objective product attribute and it’s primary purpose is to construct the game’s total score, which is already captured.
In addition to review variances, we constructed two additional measures of product similarity, in order to estimate how differentiated a given game is (see Figure 2). The first measure is the Euclidean Distance, between two games, which simply measures the distance between two games in an n-dimensional product
5 We are currently working to enrich the dataset with all games up to June 2007.
Figure 2: Euclidean Distances & Cosine Similarities, as product differentiation measures

Differentiation & Information Investments
Working paper. Please do not cite. 11
space, where n is the number of product attributes. For example, in Figure 2, Product A and Product B have Euclidean distance 𝑑𝑑 and appear to be closer together, than either of them is to Product C. The Euclidean Distance between any two games 𝐺𝐺 and 𝐺𝐺 , rated on n attributes, is given by:
𝐸𝐸 𝐺𝐺 ,𝐺𝐺 = 𝐺𝐺 − 𝐺𝐺 [6]
where 𝐺𝐺 is game 𝑗𝑗’s rating on attribute 𝑖𝑖. The assumption is that, if a game’s average Euclidean Distance from all other games in the product space is low, then it means that the game is close to other games in the product space and thus not differentiated. If on the other hand, the average Euclidean Distance is high, it means that the game occupies a part of the product space that is far away from other games and thus it is differentiated.
The problem with that approach is that, as can be seen in Figure 2, Product A really is different than Product B, as the product manufacturer chose to use more of Attribute 2 and less of Attribute 1 in its construction. Product B however is in a sense much more similar to Product C, since in both cases the manufacturers made the same trade-offs between the two parameters, choosing to utilize Attribute 1, about four times as much as Attribute 2. For example Product B and Product C may correspond to two strategy games that have chosen to pay more attention to the game’s playability (Attribute 1) than its graphics (Attribute 2), with the difference being that Product C invested more overall in both attributes. In that case Product A corresponds to a strategy game that has chosen to focus primarily on game graphics. Thus, after correcting for a game’s total score (its quality) Product B and Product C should appear nearly identical in terms of their Horizontal Differentiation, that focuses solely on their taste-related parameters, i.e., how they have chosen to trade-off between their quality attributes.
Using the intuition that after correcting for game quality the angular distance between two products may be a better way to capture differences than the Euclidean Distance, we employ the Cosine Distance measure, which is widely used in the Information Retrieval literature to measure similarities between documents. The Cosine Distance between any two games 𝐺𝐺 and 𝐺𝐺 , viewed as vectors of n attributes, is given by:
𝐶𝐶𝐶𝐶𝐶𝐶𝐶𝐶𝐶𝐶𝐶𝐶𝐶𝐶 𝐺𝐺 ,𝐺𝐺 = 1 − 𝐺𝐺 ×𝐺𝐺 𝐺𝐺 × 𝐺𝐺 [7]
where 𝐺𝐺 is game 𝑗𝑗’s rating on attribute 𝑖𝑖. This is simply one minus the cosine of the angle between the two vectors. For example, in Figure 2, the Cosine Distance between Product B and Product C is 0. The Cosine Distance between Product A and Product B is one minus the cosine of 𝜑𝜑 − 𝜃𝜃. The Cosine Distance would be 1 for two products that would be maximally differentiated. In Figure 2 this would happen for two products if the first only had a non-zero rating in Attribute 1, while the other had a non-zero rating only in Attribute 2.
For both Euclidean and Cosine Distance, we calculated for each game the average distance from all other games in the genre, including all games that were published up to one year before the game. The assumption is that games compete primarily with other games within their genre and that they mostly compete with games that were published up to 12 months before their own release. We have verified that the results are robust to calculating distances based on games released up to 24 months before a game’s given release.
The correlation coefficients between distances and variances are all positive: for games that received at least 4 reviews the correlation coefficient between variances and Euclidean Distances is 0.16, between variances and Cosine Distances is 0.24 and between Euclidean and Cosine Distances is 0.63. Thus, we can be reasonable certain that, as expected, review variances are higher for more differentiated games.
The summary statistics for the PC-games for which variances were used are shown in Table 3, organized by game genre. We can see that the percentage of games where the developer invested in releasing a playable demo version of the game ranges from 41% and 43% for Puzzle and Adventure games,

Differentiation & Information Investments
12 Working paper. Please do not cite.
respectively, to a high of 65% and 68% for Strategy and Action games, respectively. Simulation games tend to score the highest review scores, while Adventure games tend to score the lowest. Also, reviewers from different websites tend to agree more on the quality of Role-Playing games, while they most often disagree on the quality of Puzzle games. We can see systematic differences on how game quality might influence demo development decisions between genres. For example, Puzzle and Action games tend to score similar quality scores and yet display large differences in the frequency of game demos.
The summary statistics for the PC-games for which Euclidean and Cosine Distances were used are shown in Table 4. The only difference between the two tables is the inclusion in Table 4 of games that received less than 4 outside reviews. One interesting observation is that both the average game score and the percentage of games with demos are lower in Table 4, which means that reviewers in different websites review higher quality games more often, and that moreover, these higher quality games tend to furnish playable game demos more often than lower quality games, already signaling that quality is an important parameter in demo version availability.
Results & Managerial Implications
The underlying data generating process is assumed to be described by the following simple model:
𝐿𝐿𝐿𝐿𝐿𝐿𝐿𝐿𝐿𝐿 𝐷𝐷𝐷𝐷𝐷𝐷𝐷𝐷 = 𝛃𝛃 xx + 𝑢𝑢 + 𝜀𝜀 [8]
where 𝐷𝐷𝐷𝐷𝐷𝐷𝐷𝐷 is zero if game 𝑗𝑗 in genre 𝑖𝑖 has not provided a demo version and one otherwise, 𝑢𝑢 is the genre-level random intercept, xx is the vector of our explanatory variables, and ε are normally distributed random errors . We have included dummies for the game’s year of release as well as dummies for game developers that have released more than 10 games in our dataset. There are 15 game developer dummies in the model that uses variances, and 33 developer dummies in the model that uses Euclidean
Table 3: Summary statistics for games were review variance is used
Table 4: Summary statistics for games were Euclidean & Cosine distances are used

Differentiation & Information Investments
Working paper. Please do not cite. 13
and Cosine Distances. Including developer dummies for developers with fewer than 10 games introduced collinearity concerns that we wished to avoid.
Since the most important explanatory variable within each genre is expected to be game quality, we also specified an alternative model by giving quality a random coefficient within each genre, to control for systematic differences within each genre, in the way that quality impacts the probability that a game developer released a demo version. The alternative model was specified as: 𝐿𝐿𝐿𝐿𝐿𝐿𝐿𝐿𝐿𝐿 𝐷𝐷𝐷𝐷𝐷𝐷𝐷𝐷 = 𝛃𝛃 xx + 𝑢𝑢 +𝑢𝑢 𝑠𝑠 + 𝜀𝜀 , where 𝑢𝑢 is the genre-specific random intercept and 𝑢𝑢 is the genre-specific random coefficient of the score 𝑠𝑠 of game 𝑗𝑗 in genre 𝑖𝑖. The results were robust to this alternative model definition.
Our estimation results are presented in Table 5. Specifications 1 and 2 directly test Hypothesis 1, that game variances are negatively correlated with the probability of a game demo release. Specifications 2,3 and 4 test alternative differentiation measures, in order to verify that, indeed, the impact of reviewer variance on demo availability is likely to be caused by the fact that variance indicates game differentiation, as our analytical model has claimed.
In all specifications game quality is a good predictor of game developers investing to reduce consumer uncertainty. In Specification 1 quality is used without the reviewer variance information, which is added in Specification 2 and shown to be highly statistically significant with a negative coefficient as expected by Hypothesis 1.
Specification 3 is the quality-only model of the larger dataset used to measure the impact of Euclidean & Cosine Distances. The addition of Euclidean Distances as a differentiation measure in Specification 4, has the expected coefficient but is not statistically significant, which appears to reinforce the view expressed in the previous section, that once corrected for quality, Euclidean Distances are not particularly meaningful as a differentiation measure. Finally, in Specification 5, the inclusion of Cosine Distances is statistically significant, with the expected sign, indicating that, indeed, it is the impact of product differentiation that we are observing in this dataset.
Managerial Implications & Concluding Remarks
Before discussing managerial implications, it is important to attempt to reconcile the results that we obtained, with those of related articles that have shown higher review variances to be associated with subsequent increases in product market share. For example, in (Sun 2012), the author recommends that
Table 5: Summary statistics for games were Euclidean & Cosine distances are used
Differentiation & Information Investments
14 Working paper. Please do not cite.
firms with higher variance products “should therefore make sure that consumers can easily observe the high variance of ratings and provide detailed product information that further facilitates the matching between consumers and the product”. We, instead directly observe that lower – not higher – variance products invest more to reduce consumer uncertainty.
One possibility is that high review variances of certain products in previous reports, were partly due to the effects of product differentiation, and partly due to higher consumer uncertainty about these products. If this is true, then a high variance product may not always be a product that is far from market “sweet spots”. High variance may indicate that a lot of people are buying the product that should not have bought it, had they known that it is not a good fit for their needs and tastes; their subsequent low product reviews lead to high observable review variance. But if this is true, then there could be an even greater number of people that are refraining from purchasing the product, because of the same uncertainty that led the previous group to buy it and regret it. As people become better informed with time, perhaps by reading other buyers’ reviews, these products’ market share is likely to improve, and review variance likely to decline.
Due to the use of professionally generated product reviews in our dataset, high review variance is reasonably expected to be the result of high product differentiation. Indeed, in contrast to consumers that choose products based on what they think fits their taste, video gaming websites try to review as many games as possible, and not just games that their reviewers feel that they are going to like.
The managerial implication would then be that a firm facing high product review variance should first determine the reason behind the divergence of opinions. It is perhaps impossible to do so, without also studying what consumers or reviewers are actually saying about their product, rather than relying on numerical ratings, a point that has convincingly been made in (Pavlou and Dimoka 2006). Comments that indicate that consumers had misunderstood how well the product would fit their tastes, prior to purchase, could indicate high consumer uncertainty about the product and provide strong signals that the firm must invest to reduce buyer uncertainty. These investments should be specifically designed to explain to different buyer types how the product might fit their own idiosyncratic needs and tastes.
Similarly, a firm facing low review variance would do well to verify if the low variance indicates that the product is perfectly situated on top of a high concentration of consumer preferences (i.e., is a good fit for a large mass of consumers). Again, reading what reviewers are saying about the product may be enlightening. If reviewers are uniformly content with the product but also indicate a degree of surprise with some of the product characteristics that they were not aware of prior to purchase, then this too may be a strong signal that the firm must invest to reduce consumer uncertainty and facilitate adoption among this consumer mass. However, the firm’s investments should be customized to explain how the product fits the needs and tastes of this particular consumer segment, rather than attempt to explain the product to a wider market.
We believe that the line of research that uses higher moments of the ratings distribution to improve managerial decisions will prove to be highly fruitful. We are only beginning to understand what information these higher moments reveal about product differentiation, consumer uncertainty, purchase intent, and the existence of different market segments, among others. The increasing availability of ratings information, combined with the increased importance of the kind of managerial decisions that ratings information can potentially support, virtually guarantee that these questions will continue to attract interest in our community.
Bibliography
Ε-tailing group. 2008. “Mindset of the Multi-Channel Shopper Holiday Survey.” Web-based survey, Ε-tailing group.
Accenture. 2007. “U.S. Consumers Increasingly Going Online And Calling Stores To Research Product, Availability And Price.” Web-based survey, Accenture.
Albano, Gian L. and Alessandro Lizzeri. 2001. “Strategic Certification and the Provision of Quality.” International Economics Review 42(1):267-283.
Differentiation & Information Investments
Working paper. Please do not cite. 15
Brynjolfsson, Erik, Yu Hu, and Duncan Simester. 2011. “Goodbye Pareto Principle, Hello Long Tail: The Effect of Search Costs on the Concentration of Product Sales.” Management Science 57(8):1373-1386.
Chevalier, Judith A. and Dina Mayzlin. 2006. “The Effect of Word of Mouth on Sales: Online Book Reviews.” Journal of Marketing Research 43(3):345–354.
Clemons, Eric K. 2008. “How Information Changes Consumer Behavior and How Consumer Behavior Determines Corporate Strategy.” Journal of Management Information Systems 25(2):13-40.
Clemons, Eric K. and Guodong Gao. 2008. “Consumer informedness and diverse consumer purchasing behaviors: Traditional mass-market, trading down, and trading out into the long tail.” Electronic Commerce Research and Applications 7(1):3-17.
Clemons, Eric K., Guodong Gao, and Lorin M. Hitt. 2006. “When Online Reviews Meet Hyperdifferentiation: A Study of the Craft Beer Industry.” Journal of Management Information Systems 23(2):149-171.
Dellarocas, Chrysanthos, Xiaoquan Zhang, and Neveen F. Awad. 2007. “Exploring the value of online product reviews in forecasting sales: The case of motion pictures.” Journal of Interactive Marketing 21(4):23-45.
Duan, Wenjing, Bin Gu, and Andrew B. Whinston. 2008. “Do online reviews matter? — An empirical investigation of panel data.” Decision Support Systems 45(4):1007-1016.
Dye, Ronald A. 1986. “Proprietary and Nonproprietary Disclosures.” Journal of Business 59(2):331-366.
EEDAR. 2011. “Deconstructing Downloadable Content.” Research Report, Electronic Entertainment Design and Research.
Farrell, Joseph 1986. “Voluntary Disclosure: Robustness of the Unraveling Result, and Comments on Its Importance.” Pp. 91-103 in Antitrust and Regulation, edited by R. Grieson. Lexington Books.
Fishman, Michael J. and Kathleen M. Hagerty. 2003. “Mandatory Vs Voluntary Disclosure in Markets with Informed and Uninformed Customers.” The Journal of Law, Economics, & Organization 19:45-63.
Grossman, S. J. and O. D. Hart. 1980. “Disclosure Laws and Takeover Bids.” The Journal of Finance 35(2):323-334.
Jin, Ginger Z. 2005. “Competition and disclosure incentives: an empirical study of HMOs.” RAND Journal of Economics 36(1):93-112.
Jovanovic, Boyan. 1982. “Truthful Disclosure of Information.” Bell Journal of Economics 13:36-44.
Li, Beibei, Anindya Ghose, and Panagiotis G. Ipeirotis 2011. “Towards a Theory Model for Product Search.” in Proceedings of the 20th International World-Wide Web Conference (WWW 2011).
Mazis, Michael B., Richard Staelin, Howard Beales, and Steven Salop. 1981. “A Framework for Evaluating Consumer Information Regulation.” Journal of Marketing 45:11-21.
McKinsey Global Institute. 2011. “The impact of Internet technologies: Search.” Study, High Tech Practice, McKinsey & Company.
Milgrom, P. 1981. “Good News and Bad News: Representation Theorems and Applications.” Bell Journal of Economics 12:380-391.
Miller, Claire C. 2011. “Defying Conventional Wisdom to Sell Glasses Online.” The New York Times, Jan. 16.
Pavlou, Paul A. and Angelika Dimoka. 2006. “The Nature and Role of Feedback Text Comments in Online Marketplaces: Implications for Trust Building, Price Premiums, and Seller Differentiation.” Information Systems Research 17(4):392-414.
Stross, Randall. 2004. “When a video game stops being fun.” The New York Times, November 21.
Sun, Monic. 2012. “How Does Variance of Product Ratings Matter?” Management Science 58(4):696-707.

Differentiation & Information Investments
16 Working paper. Please do not cite.
Vance, Ashlee. 2011. “"Graphics Ability Is the New Goal for Chip Makers".” The New York Times, Jan. 4.
Verrecchia, Robert E. 1983. “Discretionary Disclosure.” Journal of Accounting and Economics 5:179-194.
Zmuda, Natalie. 2008. “Time Is Money: Wealthy Drop Dollars Online.” Advertising Age, October 20.