
How does increased vegetable varietal choice influence...
99
TROPICAL AGRICULTURAL RESEARCH AND HIGHER EDUCATION CENTER Education Division Graduate School How does increased vegetable varietal choice influence coffee farmers’ on-farm diversification strategies in the face of changing climate conditions? Lindsey Allison Hethcote Thesis submitted to the Graduate School as a requirement to qualify for the degree of Master of Science in Agroforestry and Sustainable Agriculture Turrialba, Costa Rica 2016
Transcript of How does increased vegetable varietal choice influence...

I
TROPICAL AGRICULTURAL RESEARCH
AND HIGHER EDUCATION CENTER
Education Division
Graduate School
How does increased vegetable varietal choice influence coffee
farmers’ on-farm diversification strategies in the face of changing
climate conditions?
Lindsey Allison Hethcote
Thesis submitted to the Graduate School as a requirement to qualify for the degree of
Master of Science in Agroforestry and Sustainable Agriculture
Turrialba, Costa Rica
2016

II

III
Dedication
To smallholder farmers in Central American seeking strategies to diversify their farms and to
scientists working toward a more sustainable use of agrobiodiversity. May this work
contribute to the livelihoods of the farmers and the advancements of the scientific community.

IV

V
Thank you to Bioversity International, CATIE, Hivos International and AVRDC for their
extensive support, logistically and financially, for the fieldwork involved with this master’s
thesis project.

VI

VII
Acknowledgments
I would like to acknowledge the people and institutions that have contributed to my work
toward this Master of Science degree and to offer my profound thanks for their support.
Maarten van Zonneveld of Bioversity International and William Solano of CATIE for their
continued support throughout this project, as not only co-directors but also team members
The other members of the committee, Nelly Vasquez and Ernesto Mendez, for their guidance
and recommendations
AVRDC, the World Vegetable Center, for its extensive support for my fieldwork
Hivos International for the support provided for fieldwork necessary for my thesis
Organization of American States (OAS), whose scholarship made my studies as a master’s
student possible
My mom, dad, stepmom, grandmas, grandpas, aunt, uncle and other family members for their
moral support and constant encouragement throughout my two years at CATIE
My wonderful friends at CATIE who have filled me with joy and laughter when I most
needed it
My wonderful friends in the States who were with me every step of the way
A very special person who appeared in my life unexpectedly at CATIE and who has shown
me unconditional support and friendship when I have most needed it
Those who helped me tirelessly with my fieldwork (Manrique Gonzalez, Dagoberto Arroyo,
Alexander Salas, Jairo Mendez, Jose Brenes and Erlindo Navarro)
The CATIE Biostatistics Unit (Fernando Casanoves, Sergio Vilchez and Alejandra Ospina)
for assistance with processing and data analysis
All of the staff of CATIE’s Graduate School (Jeannette Solano, Ariadne Jimenez, Aranjid
Valverde, Cynthia Mora, Alfonso Marin, Marta Gonzalez and Noily Navarro)
All of the professors of CATIE Graduate School for their expertise and patience
The Ministry of Agriculture and Livestock (MAG) of Costa Rica for logistical support with
my fieldwork
Irene Garcias for her guidance and expertise
All of the coffee farmers involved in the project for their dedication and enthusiasm

VIII

IX
Contents
Dedication ................................................................................................................................. III
Acknowledgments .................................................................................................................. VII
List of Figures ........................................................................................................................... XI
List of Tables .......................................................................................................................... XII
List of Acronyms ................................................................................................................... XIII
Abstract .................................................................................................................................. XIV
Resumen ................................................................................................................................. XV
1. Chapter 1: Introduction and general summary of thesis ......................................................... 1
1.1 Justification and importance ............................................................................................. 1
1.2 Objectives ......................................................................................................................... 3
1.2.1 Main objective ............................................................................................................ 3
1.2.2 Specific objectives...................................................................................................... 3
1.3 Literature review ............................................................................................................... 4
1.3.1 Current state of coffee farmers in Central America and diversification as a solution
to the crisis .......................................................................................................................... 4
1.3.2 Diversification with intraspecific variation ................................................................ 8
1.3.3 Participatory use of genetic resources according to farmers’ needs and preferences 9
1.3.4 Farmers’ access to important genebank material ..................................................... 11
1.4 Main results ..................................................................................................................... 13
1.5 Main conclusions ............................................................................................................ 15
1.6 References ....................................................................................................................... 17
2. Chapter II. Article I: How does increased vegetable varietal choice influence coffee
farmers’ on-farm diversification strategies in the face of changing climate conditions? ......... 21
Abstract ................................................................................................................................. 21
2.1 Introduction ..................................................................................................................... 22
2.2 Materials and methods .................................................................................................... 23
2.2.1 Study area ................................................................................................................. 23
2.2.2 Experimental design ................................................................................................. 23
2.2.3 Crop selection ........................................................................................................... 24
2.2.4 Farmer profile ........................................................................................................... 24
2.2.5 Variety and accession selection ................................................................................ 25
2.2.6 Seedling development .............................................................................................. 26
2.2.7 Transplant ................................................................................................................. 26

X
2.2.8 Climate sensors ........................................................................................................ 27
2.2.9 Farmer management ................................................................................................. 27
2.2.10 Participatory evaluation.......................................................................................... 27
2.2.11 Morphological characterization.............................................................................. 28
2.2.12 Participatory evaluation versus morphological characterization ........................... 29
2.2.13 Final interviews ...................................................................................................... 29
2.3 Results ............................................................................................................................. 30
2.3.1 Farmer crop selection and farmer-preferred characteristics ..................................... 30
2.3.2 Climate information ................................................................................................. 31
2.3.3 Farmers’ experience with vegetable crop management ........................................... 32
2.3.4 Farmers’ preferences with increased varietal supply ............................................... 33
2.3.5 Farmers’ preferences in different altitudes and under different types of management
........................................................................................................................................... 37
2.3.6 Morphological characterization and the effects of altitude and type of management
on varietal performance ..................................................................................................... 38
2.3.7 Comparison of farmers’ scores and characterization ............................................... 45
2.3.8 Farmers’ engagement and perspective on PVS for diversification .......................... 47
2.4 Discussion ....................................................................................................................... 49
2.5 Conclusion ...................................................................................................................... 54
2.6 References ....................................................................................................................... 55
3. Chapter III. Article II: Improving access to vegetable seeds for diverse and resilient farms:
Lessons learned from coffee farmers in Turrialba, Costa Rica ................................................ 59
3.1 Why mix coffee production with tomato and sweet pepper crops? ................................ 59
3.2 How did farmers conduct the experiment? ..................................................................... 60
3.3 Farmers’ preferences ....................................................................................................... 60
3.4 What lessons can be drawn from this study? .................................................................. 61
3.5 Farmer-based experimentation ....................................................................................... 62
4. Appendix .............................................................................................................................. 63

XI
Figures
Figure 1. Seasonal food security experienced by coffee-producing households in El Salvador 6
Figure 2. Role of the farmer and the scientist in different types of breeding systems ............. 10
Figure 3. Bar graph of average farmer-management scores. .................................................... 32
Figure 4. Bar graph of average farmer-management scores under both types of management 33
Figure 5. Correspondence analysis of tomato varieties and accessions and farmers’ scores by
farmer-preferred traits............................................................................................................... 34
Figure 6. Correspondence analysis of sweet pepper varieties and accessions and farmers’
scores by farmer-preferred traits............................................................................................... 35
Figure 7. Dot plot of farmers’ preferences for tomato varieties and accessions ..................... 36
Figure 8. Dot plot of farmers’ preferences for sweet pepper varieties and accessions ............ 37
Figure 9. Correspondence analysis demonstrating farmer-preferred sweet pepper varieties and
accessions at both altitudes and under both types of management........................................... 38

XII
Tables
Table 1. Current optimal and absolute conditions for Arabica and Robusta coffee ................... 5
Table 2. Summary of food insecurity in coffee-growing regions............................................... 5
Table 3. Classification of selection system for current study ................................................... 10
Table 4. Basic information on the eight farms included in the study ....................................... 24
Table 5. General information and passport data for the varieties and accessions used in the
current study ............................................................................................................................. 25
Table 6. Number of farmers interested in planting each crop offered ...................................... 30
Table 7. Priority and weights assigned to each farmer-preferred characteristic and
morphological descriptor used in the study .............................................................................. 30
Table 8. Climate information collected from iButtons for each farm in the current study ...... 31
Table 9. Identification of interactions between variety, altitude and type of management
considering farmers’ overall scores for sweet pepper varieties and accessions ....................... 37
Table 10. Identification of most successful tomato and sweet pepper varieties according to
morphological characterization and evaluation data for each farmer-preferred trait ............... 39
Table 11. Identification of interactions among variety, altitude and type of management
considering tomato and sweet pepper characterization and evaluation data ............................ 40
Table 12. Best tomato and sweet pepper varieties for each preferred trait under both types of
management and at each altitude according to morphological characterization and evaluation
.................................................................................................................................................. 41
Table 13. Most successful tomato and sweet pepper variety groups according to
morphological characterization and evaluation data for each farmer-preferred trait ............... 42
Table 14. Identification of interactions among group, altitude and type of management
considering tomato and sweet pepper characterization data .................................................... 44
Table 15. Most successful tomato and sweet pepper groups under both types of management
and at each altitude according to morphological characterization and evaluation ................... 45
Table 16. Comparison of most successful varieties and accessions of tomato and sweet pepper
according to farmers’ preferences and scientific characterization and evaluation ................... 46

XIII
Acronyms
AVRDC The World Vegetable Center
CATIE Tropical Agricultural Research and Higher Education Center (Centro
Agronómico Tropical de Investigación e Enseñanza)
ICAFE Costa Rican Coffee Institute
IPCC Intergovernmental Panel on Climate Change
IPGRI International Plant Genetic Resources Institute (Bioversity International since
2006)
ITPGRFA International Treaty on Plant Genetic Resources for Food and Agriculture
MTA Material Transfer Agreement
PPB Participatory plant breeding
PVS Participatory varietal selection
SAPM Strategic Action Plan to Strengthen the Conservation and Use of
Mesoamerican Plant Genetic Resources in Adapting Agriculture to Climate
Change
SMTA Standard Material Transfer Agreement

XIV
Abstract
Crop diversification strategies are considered promising for Central American coffee
farmers who are looking for solutions to confront rapidly changing climate conditions.
Vegetable crops hold potential for diversification of coffee and other production systems
because of their high potential for income and nutrition security. However, limited seed
choice may lead to poor adaptation and eventually be a constraint to introducing these crops.
We anticipate that with an increase in varietal choice of vegetable crops, farmers can make
better choices when diversifying their farms, taking into consideration environmental and
management conditions that lead toward more sustainable and intensified production. This
study employs participatory evaluation with eight coffee farmers in Turrialba, Costa Rica, at
two altitudes and under two different types of management (conventional and organic) as well
as morphological characterization and evaluation of a diverse array of tomato and sweet
pepper accessions and varieties (AVRDC varieties, CATIE accessions and commercial
varieties) to determine whether increased varietal choice improves on-farm diversification
strategies in the face of climate change. These accessions and varieties came from the CATIE
genebank and the AVRDC breeding program, and their performance was compared to a few
commercial varieties currently available in Costa Rica. Farmers’ scores from the participatory
evaluation demonstrate that farmers identify a wide range of successful AVRDC varieties and
CATIE accessions that score better for farmer-preferred traits compared with the standard
commercial varieties. Both altitude and type of management influence farmers’ varietal
preferences, illustrating the importance of increased varietal choice for coffee farmers
growing in diverse environments. Characterization and evaluation data also shows a
significant interactions between variety, altitude and type of management. A comparison of
the most successful varieties defined by farmers and the most successful varieties according to
characterization and evaluation data demonstrates that farmers often indicate varieties having
the most potential to diversify farms that vary from those indicated in the agronomic
evaluation. Without using participatory methods to include farmers’ preferences in varietal
selection, varieties may be promoted that appear more satisfactory but are actually not
preferred by farmers themselves. Farmers’ opinions in the present study illustrate that the
current participatory evaluation of increased varieties was an effective tool to help identify
several new varieties that have high potential for diversifying farms.

XV
Resumen
Las estrategias para la diversificación de cultivos son prometedoras para los agricultores
de café en América Central, quienes buscan soluciones para enfrentar las condiciones del
clima que están en constante cambio. Los cultivos de hortalizas son promisorios para la
diversificación de sistemas de café y otros sistemas por su alto potencial para generar ingresos
y combatir la inseguridad alimentaria de los agricultores. Sin embargo, una selección limitada
de variedades puede contribuir a una adaptación débil y eventualmente una restricción para
introducir estos cultivos. Se prevee que con un aumento en la disponibilidad de variedades de
hortalizas, específicamente tomate y chile dulce, los agricultores pueden mejorar sus
decisiones a la hora de diversificar sus fincas, tomando en cuenta las condiciones ambientales
y de manejo. Este estudio emplea una evaluación participativa con ocho agricultores de café
en Turrialba, Costa Rica en dos alturas y bajo dos tipos de manejo diferentes (convencional y
orgánico), así como la caracterización y evaluación morfológica de una gama de diversas
variedades de tomate y chile dulce (AVRDC, CATIE, y variedades comerciales), para
determinar si un aumento en la selección de variedades disponibles mejora las estrategias de
diversificación agrícola ante el cambio climático. Estas variedades se seleccionaron del banco
de germoplasma de CATIE y del programa de mejoramiento de AVRDC; su desempeño se
comparó con las variedades comerciales disponibles en Costa Rica. Tanto la evaluación
participativa como la caracterización y evaluación morfológica, las variedades comerciales
mostraron características buscadas en el mercado comercial, mientras que las variedades de
CATIE y AVRDC mostraron otras características preferidas por los agricultores. Tanto la
altitud como el tipo de manejo influencian las preferencias de variedades de los agricultores,
ilustrando la importancia de una selección más amplia de variedades para los agricultores de
café que siembran en diversos entornos. Los datos de caracterización y evaluación muestran
una interacción significativa entre la variedad y la altitud, así como la variedad y tipo de
manejo. Una comparación de las variedades más exitosas definidas por los agricultores y las
variedades de acuerdo a los datos de caracterización y evaluación, demuestra que los
agricultores indican frecuentemente diferentes variedades como las que tienen mayor
potencial para diversificar la finca. Sin el uso de métodos, como la evaluación participativa,
para incluir las preferencias de los agricultores en una selección de variedades, muchas veces
pueden ser promovidas algunas variedades que aparecen más satisfactorias, pero en realidad
no son preferidas por el agricultor. Las opiniones de los agricultores en el presente estudio,
muestran que la evaluación participativa de variedades utilizadas ha sido una herramienta
eficaz para ayudar a identificar diferentes variedades que tienen un alto potencial para
diversificar la finca.

1
1. Chapter 1: Introduction and general summary of thesis
1.1 Justification and importance
Latin America has a long history of perennial mono-cropping, including palm oil,
cacao, coffee and rubber. Although there are many benefits to these systems, such as high
economic returns, there are also consequences, mainly increased economic and
environmental risks due to their homogeneity (Alvim 1980).
In Central America, the effects of climate change on perennial systems will be most
severely felt by smallholder farmers throughout the coffee sector. The extreme climate
changes predicted by the Intergovernmental Panel on Climate Change (IPCC) will
drastically alter the regions in which coffee can be successfully produced. The organization
predicts that temperatures in Central America will increase between 1 and 2 degrees
Celsius and precipitation will decrease by as much as 30% by the end of the 21st century
(Davis et al. 2012). Nicaragua, for example, is supposed to see a mean annual temperature
increase of 2.3 degrees Celsius and a 5% decrease in precipitation by 2050. (Baca et al.
2014).
Arabica coffee production is expected to be negatively affected at low altitudes where
temperatures are expected to increase the most. Changes in temperature and precipitation
will continue to displace coffee farmers. Central America in general will see a shift in
optimal coffee-growing elevation from 1,200 meters to 1,600 meters by 2050 (Baca et al.
2014).
Central American coffee farms that lack diversity will be more vulnerable,
environmentally and economically, to these climate changes than diverse systems. The less
functional diversity that an agroecosystem has, the more vulnerable the biotic
characteristics of the system are to biotic and abiotic changes (Lin 2011;Ebert 2014). In
addition to changing climates, Central American coffee farms face increasing threats from
pests and disease. Oftentimes, the narrow genetic base of a homogenous coffee system
raises the probability of absolute crop failure, leading to food insecurity and sometimes
debt (Di Falco and Perrings 2003;Caswell et al. 2014).
Apart from the environmental risks associated with coffee systems, economic risks are
also apparent. Both large and small producers often face issues with low economic income
during the initial phases of a coffee system, as well as sporadic income throughout the
year. Studies have shown that because coffee farmers only receive income two or three
times a year from their coffee crops, those who do not also have other crops for
consumption and sale suffer food insecurity between peak coffee harvests (Morris et al.
2013;Bacon et al. 2014;Caswell et al. 2014). Caswell et al (2014) found that seasonal
hunger may be prevalent from one and eight months per year for coffee farmers who lack
diversity on their farms.
In recent years, researchers working with coffee producers in Central America have
begun to explore how diversification can lead to more stable and sustainable livelihoods

2
for rural farmers (Flores 2002;Caswell et al. 2012;Morris et al. 2013;Baca et al.
2014;Bacon et al. 2014;Caswell et al. 2014). Sustainable livelihood refers to “the resilience
of households to environmental, economic, and social stresses and shocks” (Morris et al.
2013).
Diversified systems are more sustainable because they provide diverse sources of
income, a variety of food for consumption and enhanced functional diversity that allows a
system to be more resilient against climate and human-induced changes (Eakin et al.
2006;Lin 2011;Caswell et al. 2014). Species diversification is often recommended to
stabilize production and income, but little research is being done on the identification and
potential of under-researched seed material of different crops for diversification
(Zonneveld et al. 2014)
Intraspecific diversity provides overlaps in the functional capacity of different
varieties (Lin 2011;Ebert 2014). Greater diversity within a system creates spatial and
temporal heterogeneity, which in turn enhances resilience to stresses impressed on the
system, both environmental and economic. Successful pest and disease suppression is often
found in more diverse systems due to the decrease in crop-specific pests and disease that
can lower production or devastate crops. Diversity also creates a buffer against other
effects of climate variability (Di Falco and Perrings 2003;Ebert 2014;Bioversity
International 2014). Intraspecific diversification can open up new or unknown niche
markets for farmers lacking economic sustainability (Zonneveld et al. 2014).
Genebanks hold many accessions containing a range of genetic and phenotypic
variability that have the potential to be interesting and useful for crop diversification across
different environments and for different farmers’ interests. It can be expected that some of
these accessions have high nutritional values, while others have developed advanced
tolerances to abiotic and biotic stresses or are recognized for their yield stability (Eagles
and Lothrop 1994;Hammer and Diederichsen 2009;Ciancaleoni et al. 2014;Ebert 2014).
This diversity is a valuable source for breeding but could also have great potential for
direct selection of promising materials.
Information regarding biotic and abiotic factors of systems coupled with selection by
farmers of successful genotypes and participatory characterization of varieties in different
environments has the potential to help discover varieties with interesting characteristics
and values not yet exploited (Friis-Hansen and Sthapit 2000;Halewood et al.
2007;Ciancaleoni et al. 2014;Bioversity International 2014).
There have been many success stories about using participatory variety selection
(PVS) and participatory plant breeding (PPB) of diverse genetic material for a better use of
genetic material on farms (Witcombe et al. 1996;Almekinders et al. 2007). There is also
evidence showing that PVS can be challenging. Oftentimes, researchers and farmers have
different motives in mind, making it difficult to agree on project details and outcomes. A
wide range of aspects affecting a PVS, such as various social and economic aspects, may
not be taken into account and may negatively affect the project’s outcomes (Bacon et al.
2005).

3
It would be useful to include PVS in the selection of genebank material for the
diversification of farms. By including farmers, their opinions, traditional knowledge and
site-specific information for their farms, choices on accession selection can be made that
are more effective than conventional variety selection.
One particular challenge to the enhanced used of genebank material is the successful
development of mechanisms that facilitate farmers’ access to genebank material that
matches their interests (Witcombe et al. 1996;Friis-Hansen and Sthapit 2000;Almekinders
et al. 2007;Ceccarelli and Grando 2007;Halewood et al. 2007;Bioversity International
2014). Currently, farmers lack crucial knowledge about how and where to access genebank
material and information, making it extremely difficult for them to effectively use diverse
varieties and accessions. Lack of collaboration between national, international, local,
governmental and nongovernmental organizations makes it hard to diffuse the genetic
material (Almekinders et al. 2007).
Access to genebanks, along with the phenotypic information associated with each
accession, is pertinent to farmers (Ebert 2014). The genebank at CATIE (Tropical
Agricultural Research and Higher Education Center) holds more than 5,704 accessions of
187 species, making it a very valuable resource both nationally and internationally (Engels
et al. 2006). Although CATIE’s resources are recognized at the institutional level, many
local actors do not take advantage of this material (Vasquez and Solano 2014).
The International Treaty on Plant Genetic Resources for Food and Agriculture
(ITPGRFA), Plant Treaty for short, aims to enhance the access to and use of accessions
from genebank collections. This is especially important under changing climates scenarios
where it is essential that farmers and breeders have access to varieties that can make their
agricultural systems more resilient to climate change (FAO 2009). The Plant Treaty
includes a list of crops from which parties have agreed to share materials, following a
Standard Transfer Material Agreement (STMA). Tomatoes and peppers are not included
on this list, but a few genebanks, including those of CATIE and AVRDC (the World
Vegetable Center), have put their collections of these crops under FAO’s Multilateral
System, which facilitates access via an STMA.
This study proposes the participatory use and evaluation, according to specific farmer
preferences, of genebank accessions and improved varieties to diversify coffee farms in
Costa Rica in order to enhance economic and environmental resilience to effects of varying
climate conditions.
1.2 Objectives
1.2.1 Main objective
Understand the role of increased varietal choice and participatory varietal selection in
motivating producers to adopt new crops for diversification activities on their farms.
1.2.2 Specific objectives
Identify which crops are of most interest to farmers for on-farm diversification
activities
Identify the key traits farmers look for when selecting vegetable varieties

4
Understand how under-researched genebank material can correspond to specific
farmer interests in different environmental conditions compared with improved
varieties and available commercial varieties
Evaluate the performance of the selected materials in different environments
Consider the role of participatory evaluation in helping farmers identify more
interesting crop varieties for farm diversification
1.3 Literature review
1.3.1 Current state of coffee farmers in Central America and diversification as a solution to
the crisis
Concentration on the coffee sector in Central America in the latter half of the 20th
century brought about national subsidy support that encouraged producers to turn to coffee
mono-cropping. However, due to historically low prices in the international coffee market
since the coffee crisis in 2000, coffee producers in Central America have been left with
lower incomes and therefore very vulnerable production systems that have lower resistance
to fluctuations in economic and environmental changes (Eakin et al. 2006).
A recent survey of 500 smallholder coffee farmers in four countries in Central
America showed that 63% of the interviewed producers struggled to meet basic food needs
during at least one period of each year. The vulnerability of small-scale coffee farms is
attributed to multiple market factors, including market deregulation resulting from the fall
of the International Coffee Agreement in 1989, oversupply of coffee in the international
market and monopolistic control by multinational coffee companies that have forced coffee
prices to a historical low. From 2000 to 2001, the “green bean” crisis forced revenues for
Central American coffee farms to drop 44%, and most of the producers affected by this are
still struggling to recover (Morris et al. 2013).
Since the collapse of the international coffee market, countries dominated by
smallholder coffee production have continued to see negative effects. Apart from the rapid
fall in prices, changing environmental conditions have continued to put even more pressure
on smallholder production systems. Decreased rainfall and increased temperatures have
augmented the incidence of pests and diseases. Lower incomes have also made it harder for
smallholders to buy the fertilizers and pesticides needed to properly manage their coffee,
also increasing pest and disease incidence. Studies done by the Costa Rican Coffee
Institute (ICAFE) have shown the impacts of climate changes on different coffee
production regions of the country (ICAFE 2014).
The incidence of the coffee borer beetle and coffee rust has increased in Costa Rica
due to changing climate conditions. In 2013, it was found that more than 95% of the area
dedicated to coffee production in the country was negatively affected by the coffee-berry
borer. The coffee harvest in 2013 in Costa Rica decreased by 69.8% and then again in 2014
by 18.6 % due to the increased incidence of coffee rust (ICAFE 2014).
According to IPCC climate predictions, temperature increases and as much as a 30%
reduction in precipitation by 2050 will continue to limit the areas suitable for Arabica and
Robusta coffee production. The changes will put many current coffee-growing regions out
of the optimal and absolute ranges for coffee production (ICAFE 2014).

5
Table 1. Current optimal and absolute conditions for Arabica and Robusta coffee
Arabica Robusta
Optimal Absolute Optimal Absolute
Min Max Min Max Min Max Min Max
Temperature (°C) 14 28 10 34 20 30 12 36
Rainfall (mm/year) 1,400 2,400 750 4,200 1,700 3,000 900 4,000
Soil pH 5.5 7 4.3 8.4 5 6.3 4 8
Source: (ICAFE 2014)
As coffee production by smallholder farmers dependent on the crop continues to
decrease due to climate change and international prices remain low due to market factors,
livelihoods will become more vulnerable due to decreased economic income and food
security. This vulnerability in Latin America has received much attention since the global
coffee crisis in 2000 (Bacon 2005;Morris et al. 2013).
Table 2. Summary of food insecurity in coffee-growing regions
Region Study size Study
type/research date
% experiencing
food insecurity Reference
Nicaragua,
Guatemala El
Salvador,
Mexico
469
households
Stratified survey,
2004—2005
63% struggling to
meet basic food
needs
Méndez, VE
et al, 2010
Northern
Nicaragua
177
households
Participatory Action
Research (focus
groups, surveys and
long-term case
study), 2006
69% unable to meet
basic food needs at
some point
Bacon, CM et
al, 2008
Nicaragua,
Mexico,
Guatemala
179
households
Household level
surveys and
interviews
(unpublished),
2006–2007
31% in Mexico, 44%
in Nicaragua and
61% in Guatemala
unable to meet food
needs at some point
in the year
Fujisaka, S
(CIAT), 2007
Western
El Salvador
29
households
Semi structured
interviews, 2008
97% unable to meet
basic food needs at
some point
Morris, K,
forthcoming
Northern
Nicaragua
256
households
Stratified survey
and household
interviews, focus
groups,
anthropometric
measures
(unpublished),
2009-2010
82% unable to meet
basic food needs at
some point
Bacon, CM
et al,
unpublished
Northern
Nicaragua
87
households
Household surveys
and interviews
stratified by
participation in a
food security
initiative, 2009
100% unable to meet
food needs at some
point during the year;
average of 3 months
of food
insecurity/year
Pino, M,
unpublished

6
Pico Duarte
region,
Dominican
Republic
41
households
Participatory Action
Research, 2011
82.9% have trouble
covering basic food
necessities
Gross, L,
2011
Source: (Caswell et al. 2012)
International organizations and academics continuously search for solutions for
smallholder coffee farmers in Central America; among the solutions, diversification is
often suggested as a way to mitigate the vulnerability of the systems (Flores 2002;Eakin et
al. 2006;Caswell et al. 2012;Morris et al. 2013;Baca et al. 2014;Caswell et al. 2014).
Diversification of coffee farms has already started, but present-day commercial
varieties of vegetable crops are often used. Morris et al. (2013) showed in a study in 2008
with a group of coffee farmers in El Salvador, that of the 29 farms surveyed, all had
planted maize and beans as subsistence crops, and 34% of producers had planted other
vegetables for sale and occasional consumption. All of the producers surveyed had planted
conventional varieties of maize, beans and other vegetables and were applying chemical
fertilizers and pesticides to increase yield; yet they were having difficulties affording these
expensive chemicals (Morris et al. 2013).
Food plots within the coffee farms provided on average 54% of the household food
throughout the year. Because the farmers were so dependent on their staple vegetable crops
for their own consumption, most explained that the risk of trying new crops or growing
crops without chemical inputs was too high, and that if the system failed or produced less,
their families would experience even more hunger (Morris et al. 2013).
Other studies with coffee farmers throughout Central America have shown that, on
average, 40–70% of food consumed by the household comes from crops produced within
the farm. However, the more diversity found on a farm, both within trees species and
vegetable species, the less food insecure the family reported itself to be throughout the
year. (Caswell et al. 2012;Morris et al. 2013;Caswell et al. 2014).
Source: (Morris et al. 2013)
Figure 1. Seasonal food security experienced by coffee-producing households in El
Salvador

7
Figure 1 shows that directly following harvest of the food crop (December–February),
the producers growing only coffee and staple crops of maize and beans were still food
insecure due to lack of extra income to buy other foods such as rice, chicken, eggs, sugar,
vegetables and cooking oils. The seven households that grew a variety of vegetables in
their food plots, including tomatoes, peppers and cabbage, in addition to their maize and
bean crops, reported that they were not food insecure during January or February (Morris
et al. 2013).
This study, as well as other similar studies, has concluded that to improve the
livelihoods of small-scale coffee farmers, the role of household food production should be
emphasized, both for consumption as well as sale. (Caswell et al. 2012;Morris et al.
2013;Caswell et al. 2014).
Mendez (2010) showed that coffee farmers interviewed throughout Central America
who reported having more sources of income were also those who were able to meet their
food needs. Households that did not report food shortages reported an average of 2.5
income sources, while those that did have food shortages reported 2.2 sources of income,
on average.
However, diversification with commercial varieties may not be the solution for coffee
farmers. During interviews with three coffee producers in Turrialba, Costa Rica, in 2014,
the same issues were reported that Morris found in 2008 when Central American coffee
farmers tried to diversify their farms with food crops. These producers in Turrialba
reported that they had tried to plant commercial varieties of food crops such as tomato and
sweet pepper but that the success of the crop required high chemical inputs that were too
expensive to justify continued planting. The producers said they were losing money on the
food crops; they found it better just to stick with their coffee plants (Hethcote 10 Nov
2014).
One producer in particular, from Alto Varas, Turrialba, Costa Rica, said that 25 years
ago, everyone in his town was planting tomato and pepper crops. He said the climate used
to be perfect for the crops, and many producers had much success with them. Now that the
climate has changed and the community experiences longer periods of drought, no one is
planting tomatoes or peppers. He said the present-day commercial varieties the producers
are using require so much pesticide, due to an increase in pest incidence related to
increased temperatures, that most producers choose not to plant them, either for economic
reasons due to high prices of inputs or because of the negative effect of the chemicals on
the environment (Hethcote 10 Nov 2014).
This same farmer now plants only landrace varieties of food crops such as tomatoes
and peppers for consumption, claiming that their natural resistance allows him to produce a
small amount of fruit with no chemical inputs (Hethcote 10 Nov 2014).

8
These interesting, if anecdotal, observations bring up several questions for further
research on the potential of increased varietal choice, more specifically using landraces that
are currently stored in genebanks, to help farmers sustain their production.
1.3.2 Diversification with intraspecific variation
Crop diversification can be implemented in a variety of forms and at a variety of
scales. However, by choosing intraspecific varieties appropriate for certain environments
and allowing farmers to make decisions about management and variety selection,
adaptation techniques are more likely to be adopted for the long run (Zhu et al. 2000).
Selection based on site-specific characteristics and farmer preferences are in sync with
traditional knowledge and local crop management techniques (Lin 2011).
For successful diversification, genotype and environmental interactions of different
varieties must be taken into consideration. Different results come from the use of genetic
material in different locations. The behavior of a variety is dependent not only on the
genetics of the seed but also on the environmental conditions of the site where it is planted.
For example, a study with Capsicum species showed that different varieties performed
better in different environmental conditions: in general, C. chinense varieties are confined
to lowland areas, where as C. pubescence are only found in highlands, and C. annuum are
found in a wide range of altitudes (De Swart et al. 2006).
Oftentimes, genetic material researched in a controlled environment is applied at the
farm level without taking into account the local farmers’ preferences or the environmental
X genotype interactions. The genetic material that appears to be the most successful in a
research station is not always the most successful on the farm. This type of off-site
selection process overlooks useful genetic material (Ceccarelli and Grando 2007).
A study done in Syria with different barley varieties showed that locally adapted
material found in farmers’ fields out yielded the local commercial variety 27–30% when
measured in the field. However, when the same locally adapted material was measured in
the research station, it showed a significant yield disadvantage to the local commercial
variety (Ceccarelli and Grando 2007).
Commercial varieties are created to be successful under certain conditions and
therefore often require manipulation of the local environment for the success of the seed.
Because commercial seeds require homogenous or manipulated environments, they are
often not suitable for farmers living in extreme conditions or for resource-poor farmers
who cannot afford inputs to control the environment (Ceccarelli and Grando
2007;Halewood et al. 2007;Bonham 2011).
Targeted selection of intraspecific varieties with specific adaptation characteristics can
diversify a farm much more sustainably, without the need for strong manipulation of the
local site (Ceccarelli and Grando 2007). The genetic diversity held in genebank collections

9
will have individuals that will thrive and others that will naturally fail without the use of
external inputs to control the population. Intraspecifically diverse systems will also have
better resistance to crop- and site-specific pests and diseases. (Bonham 2011;Ebert 2014).
Knowledge and correct use of this intraspecific variation can lead to diversified farms
whose varieties are appropriate for the local environment and provide income and
increased food security to farmers throughout the year (Bioversity International 2014).
Apart from the enhanced environmental adaptability of intraspecific varieties,
economic benefits also exist. A recent study of Capsicum diversity found high potential for
diversification of smallholder farms with high value, under-researched crop varieties, such
as rarely found and almost unknown varieties of hot peppers. The study explored the
interest in under-recognized Capsicum varieties and found huge use potential for many
varieties. The study predicts that varieties of other New World crops such as squash and
tomatoes may also have great potential for diversifying systems within their native
distribution range, providing alternative economic options to small-scale farmers
(Zonneveld et al. 2014).
1.3.3 Participatory use of genetic resources according to farmers’ needs and preferences
Most diversification projects have only considered the use of conventionally selected
seeds that trickle down from research institutions and seed companies to farmers
(Ceccarelli and Grando 2007). However it has been shown in various studies that the use of
intraspecific material selected by the farmer can be more successful for a long-term
sustainable diversification project (Witcombe et al. 1996;Almekinders et al.
2007;Ceccarelli and Grando 2007). In fact, most farmers in developing countries rely on
landrace varieties, showing that farmers have long known the adaptability of these varieties
(Mercer and Perales 2010).
The conventional approach to seed improvement and selection does not take into
consideration important traditional knowledge and selection criteria that farmers have
developed over time through intimate interaction with their land (Almekinders et al.
2007;Ceccarelli and Grando 2007). Today, more value is being placed on this traditional
knowledge and the importance of farmers’ preferences to be able to select varieties that can
be sustainably successful in different geographic areas (Friis-Hansen and Sthapit
2000;Ceccarelli and Grando 2007). This concept is commonly known as participatory
varietal selection (PVS) (Witcombe et al. 1996).
PVS and participatory plant breeding (PPB) programs that are carried out collectively
by both farmers and researchers or plant breeders can be a new way in which important
genetic material can be used for crop diversification (Halewood et al. 2007;Bioversity
International 2014). When breeders and researches collaborate with farmers, they can take
advantage of the farmers’ selection capacity to better understand selection criteria that
farmers use every day when selectively breeding on their own farms.

10
Figure 2 shows the role of the farmer and the scientist in different types of breeding
activities for different types of breeding systems.
Source: (Halewood et al. 2007)
Figure 2. Role of the farmer and the scientist in different types of breeding systems
After many successful studies of PPB programs, the importance of farmers’
preferences has been extensively demonstrated (Witcombe et al. 1996;Friis-Hansen and
Sthapit 2012;Scheldeman et al. 2001;Almekinders et al. 2007;Ceccarelli and Grando
2007;Danial et al. 2007;Ciancaleoni et al. 2014). With locally sourced information, more
efficient and selective varieties can be chosen for use. (Danial et al. 2007). This type of
breeding often takes into account socioeconomic factors as well, and these can have a huge
impact on the varieties of seeds used in a community (Ceccarelli and Grando 2007).
The same concept applied in these PPB projects can be applied to selection of material
from genebanks (Hethcote 25 August 2014). Farmers know their land and they know what
characteristics they want to see in their crops. Often, however, due to lack of access to
diverse genetic material, little variety is introduced regularly into their systems. (Witcombe
et al. 1996).
Table 3 shows the same scheme described above utilized to classify the type of
selection system used in the current study.
Table 3. Classification of selection system for current study
Farmer Scientist
Selection of source germplasm X X
Trait development
Cultivar development
Varietal selection X X

11
Researchers and breeders can work with farmers to collect information on their
preferences, and then they can suggest genebank material with corresponding
characteristics to producers (Almekinders et al. 2007).
After conducting a survey to gather a farmer’s preferences, one can use germplasm
selection tools, such as Explora, created by Bioversity International (formerly the
International Plant Genetic Resources Institute, IPGRI), to aid in the selection of materials
from a genebank. When individual varieties, or accessions, are entered into the database of
a genebank, characteristics of the specific site where they were collected should be
recorded, as well as phenotypic information that was recorded with the seed.
However, a main issue with genebank material in general is that many accessions lack
essential passport and phenotypic information that would be useful when selecting them
for use on farms. Throughout the 70s and 80s, a large amount of genetic material was put
into genebanks for conservation, often without this crucial information organized
appropriately. In order to effectively use all the material being stored in genebanks today, it
must be taken out of the genebank, planted in the field and the characteristics of each
accession must be appropriately recorded (Vasquez and Solano 2014)
During this process, farmers’ preferences and characterization criteria can be taken
into consideration and recorded alongside the basic agronomical descriptors defined for
each species. By recording the necessary agro morphological data required by scientists, as
well as information from the farmers, the genebank material will be much more useful in
the future for collaborative use by both researchers and producers (Halewood et al. 2007).
There is a dire need for further research on how phenotypic characteristics of
genebank accessions respond to differing environmental conditions and different farmer
preferences (Bioversity International 2014). By working alongside farmers and using their
preferences to select varieties, farmers will better understand what science can offer them
and feel more empowered to make future decisions about accessing diverse genetic
material and incorporating it into their farms (Halewood et al. 2007).
1.3.4 Farmers’ access to important genebank material
The demand for new genetic material with specific adaptive characteristics has already
been discussed here; producers are looking for varieties with better ability to change along
with the environment. However, farmers’ access to genetic material and technical
assistance needs to be improved so that germplasm projects involve farmers more in the
process of seed selection and breeding (Hethcote 10 Nov 2014).
Another topic of discussion involves producers’ direct access to genebank material.
Presently, though farmers are technically supposed to have access to genebank material
under the ITPGRFA, most do not even know that the genebanks exist. Those who do know
about formal genebanks do not have the skills or instruments necessary to access the
12
information. By creating projects where technicians introduce genebank material to
producers and explain access to the material, bonds will be created directly between the
genebank and producer, with hopes that the producer will continue to explore diverse
material from the genebanks in the future (Bonham 2011).
The Strategic Action Plan to Strengthen the Conservation and Use of Mesoamerican
Plant Genetic Resources in Adapting Agriculture to Climate Change (SAPM) is a 10-year
plan created by Bioversity International. The purpose of the document is to strengthen the
conservation, access and use of plant genetic materials in Mesoamerica in an effort to
increase both food security and resilience of production systems in the face of varying
climates (Bioversity International 2014).
SAPM suggests that a more direct link between genebank material and producers can
encourage better use of genetic material. In conventional breeding systems, both improved
seeds and traditional accessions are first planted at experimental stations or as part of a
research project, and then the select material is offered to the farmers. A more efficient use
of genebank material may be possible if the germoplasm is turned over directly to the
farmers for evaluation and improvement. Although the process would still involve
collaboration between the researcher and the producer, a direct connection between the
material and the producer will allow for improvements that are more site-specific,
increasing the potential of the genetic material.
There are other working groups and documents intending to enhance access and use of
genebank material. These include the ITPGRFA as well as the Nagoya Protocol that
focuses on access to genetic resources and the fair and equitable sharing of benefits arising
from their utilization (Buck and Hamilton 2011). These groups and plans include initiatives
to include farmers’ preferences and traditional knowledge to a greater extent in agronomic
diversification projects, aiming to increase their interaction with and access to the genetic
material (Bioversity International 2014).
Under-researched genetic material can be used most efficiently if it is put back on the
farm and managed by producers. Local seed systems in many developing countries are
weak and disorganized, lack funding or simply do not exist. In these instances, commercial
seeds sometimes are found to be more accessible to smallholder farmers (Bioversity
International 2014). However, other studies have found that in developing countries, 90%
of the seed used comes from farmers’ own selective breeding, not from seed acquired from
seed companies. This may mean that the most efficient and useful seed systems are
currently taking place at a local scale. In either case, many rural farmers are not aware of
their access to germplasm from genebanks, and local systems could benefit greatly from
the introduction of intraspecific varieties (Ceccarelli and Grando 2007).

13
1.4 Main results
When seeds from four horticulture crops—tomato, sweet pepper, squash and hot
pepper—were offered to 14 farmers in Turrialba, most expressed interest in tomato (11
farmers) and sweet pepper (eight farmers).
The traits for tomato identified as most important by farmers were high pest and
disease resistance, medium to large fruit size, dark red fruit pulp, sweet fruit, high yield,
juicy fruit, meaty fruit, firm fruit, fruit that lasts longer after harvest, tall plant size and a
fruit well fit for the market.
The traits identified as most important by farmers for sweet pepper were large fruit
size, high pest and disease resistance, thick fruit skin, meaty fruit flesh, sweet fruit, high
yield, firm fruit, fruit that lasts longer after harvest, long fruit, resistance to rain, square
fruit form and yellow or red fruit color.
Farmer management was evaluated pertaining to specific management indicators
defined as most important for the study. The indicators that showed the most variation
were management by the farmer as well as several cultural practices required for successful
tomato and sweet pepper development. In general, organic farmers had more refined
management practices than conventional farmers.
Significant difference in overall farmer scores between tomato accessions and varieties
was found (f = 1.94, p = 0.05, extended and mixed linear models). Overall, farmers’ scores
among sweet pepper varieties demonstrated that there was also a significant difference
between sweet pepper accessions and varieties (f = 4.51, p = 0.0001, extended and mixed
linear models).
The commercial tomato variety (Commercial1) was scored highest by farmers for fruit
size as well as good fit for the market. Some CATIE accessions and AVRDC varieties
were scored high for pest and disease resistance. Other CATIE accessions scored very high
for fruit juiciness, good flavor, sweet fruit and red fruit pulp according to farmers. A
CATIE accession (CATIE select5) was scored higher by farmers for yield than the
commercial variety (Commercial1). Though common characteristics of commercial
varieties include larger fruit size and higher yield, in this study farmers scored a CATIE
accession as having better yield.
Sweet pepper varieties illustrated the same phenomenon that was found for tomato
varieties. While the improved varieties (Commercial1 and AVRDC2) were most directly
related to larger fruit size, CATIE accessions and AVRDC varieties were scored higher in
other preferred traits. For example, CATIE accessions (CATIE select1, CATIE random2
and CATIE random3) were scored high for traits such as fruit firmness, fruit color and
good fruit flavor. Again, it was found that CATIE accessions and AVRDC varieties scored

14
higher with respect to yield, and in the case of sweet pepper, for resistance to rain as well
as pests and diseases.
Three different types of scores were used to evaluate farmers’ preferences: 1) overall
score per variety, 2) score per variety taking into consideration the farmers’ scores for each
preferred characterstic and 3) score per variety taking into consideration the farmers’
scores for each weighted characterstic. Results show that different accessions or varieties
were scored as most successful according to the type of score used.
Using the overall score, results demonstrated that farmers’ preferences for tomato
varieties remained similar across altitudes and under both types of management. Among
sweet pepper varieties, farmers’ preferences measured by the overall score changed with
different altitudes and under different types of management (H scores of 36.48 and 38.21,
respectively; nonparametric, Kruskal-Wallis).
According to characterization and evaluation data, extended and mixed linear models
showed that there were significant interactions among variety, altitude and type of
management in the majority of the descriptor categories of interest. There were also
significant interactions found in both crops among variety group, altitude and type of
management. Characterization and evaluation data shows that various varieties and
accessions, as well as variety and accession groups, performed better according to the
specific preferred traits under both types of management and in each altitude.
According to characterization data, the AVRDC2 tomato variety had the highest
resistance to both Phytophthora and Alternaria. However, when comparing resistance
across tomato groups, the CATIE random group of accessions had the highest resistance to
Phytophthora and Alternaria.
The CATIE random group for tomato showed the highest resistance to pests and
diseases in general, in both altitudes and under both types of management, as well as to
Phytophthora in low altitudes and under conventional management. The CATIE select
group showed the highest resistance to Phytophthora at high altitudes under organic
management and to Alternaria at high altitudes and under conventional management. The
CATIE random group was the most resistant to Alternaria for low altitudes and under
organic management, while the CATIE select group was most resistant to Alternaria under
conventional management at high altitudes.
For sweet pepper varieties, characterization and evaluation data revealed that CATIE
select varieties had the highest resistance to pests and diseases in general (CATIE select3),
as well as to Cercospora (CATIE select4), while commercial varieties had the highest
resistance to Psedomonas (Commercial1), one of the most detrimental diseases for sweet
pepper.

15
The CATIE random group had the highest resistance in general in low altitudes, and
the commercial variety groups had the highest resistance under conventional management.
The CATIE select group showed the highest resistance to Cercospora at high altitudes and
under organic management, while the CATIE random accession group showed the highest
resistance for low altitudes and under conventional management. The AVRDC variety
group demonstrated the highest resistance to Pseudomonas at low altitudes and under
organic management, while the commercial variety group had more resistance at high
altitudes and under conventional management.
There were notable differences between the accessions and varieties that farmers
scored as most successful per trait and the varieties that were most successful per
descriptor according to characterization and evaluation data.
All of the farmers in the study said that during their participation in the participatory
evaluation, they learned new things and found new varieties with high potential for
diversifying their farms. All eight farmers said that they enjoyed the opportunity to work in
a diverse team because they felt they could learn more this way. All of the farmers in the
study identified tomato and sweet pepper varieties new to them and that they would like to
continue growing in their farms. All of the farmers indicated that the current project
motivated them to either start or continue diversifying their farm with new crops and new
varieties. They said that they had lost motivation for finding adapted varieties because the
limited selection of available varieties did not give them many options; however, with the
wide range of varieties presented in the current project, they felt more enthusiastic about
finding varieties suitable for their environments.
The eight farmers in the study indicated dissatisfaction with the current seed system
and that they desire increased access to genetic material. None of the farmers demonstrated
an efficient way to properly save seeds on- farm because they have lost the traditional
customs of saving seeds and because most of the commercial seeds that they buy are
hybrids and cannot be reproduced. All of the farmers said that they would prefer not to be
so dependent on the commercial seed system and would benefit from improved access to a
greater supply of varieties and accessions that can be saved and reproduced every year on
the farm.
Although all of the farmers said participation in this participatory evaluation was
worthwhile, they also all gave suggestions for how to improve similar projects. All farmers
said that the project should have been planned better and with more time in advance. They
all claimed that if they had had more time to prepare the land before the project, the
varieties would have developed better.
1.5 Main conclusions
It is not easy to say whether the improved varieties or the genebank accessions are
most useful for diversification. Rather, it is important to encourage the use of improved

16
varieties as well as the direct use of genebank accessions. Increased varietal choice allows
coffee farmers in Costa Rica to diversify their farms more effectively than when they only
have access to current commercial varieties. This wider varietal choice allows farmers to
find those that fit their specific needs and farm conditions, motivating them to diversify
both with new varieties and new crops.
According to farmers’ preference and characterization data, commercial varieties
dominated in standard market characteristics such as fruit weight. However, in all other
farmer-preferred traits, CATIE and AVRDC varieties did just as well or better than
commercial varieties. Not all farmers were searching for the varieties with the best
commercial market characteristics. Therefore, taking into consideration farmer motives
allows a more focused varietal selection.
Weighted farmer scores should be taken into consideration in future participatory
evaluation projects. As this project shows, applying weighted values is very important
since preferred varieties can change drastically based on the weights assigned to each
farmer-preferred trait.
Significant interactions among variety, altitude and type of management illustrated by
an analysis of the characterization and evaluation data showed that increased varietal
choice enables farmers to choose varieties best suited to their environments and type of
management. This again highlights the importance of allowing farmers to choose the
varieties that do best on their farms. Using homogenous varietal options in heterogeneous
environmental conditions is not the most effective way to diversify farms and will not
motivate farmers to diversify with new crops.
New and improved vegetable varieties are often created using genes from traditional
varieties that have specific characteristics, such as increased pest and disease resistance
(Ebert 2014). In this study, we see that both improved AVRDC varieties and traditional
CATIE accessions of tomato and sweet pepper demonstrated equal if not higher resistance
to pests and diseases than the tested commercial varieties.
For a more efficient use of germoplasm material, farmers should be connected directly
to genebanks. Genebanks should offer seeds and/or seedlings of a diverse selection of
promising material directly to farmers or local greenhouses for on-farm use and
distribution among local seed systems. Access to genebank material must be made easy
and understandable to make this direct link between farmers and the genebank possible.
Apart from this direct link, nongovernmental and governmental organizations should
also be connected to the diverse genetic resources of genebanks. This will allow them to
offer a wider variety selection to farmers during capacity-building activities or other
initiatives. Government subsidies would help encourage on-farm diversification. By
offering subsidies to farmers who are willing to experiment with diversification, the

17
farmers’ risk decreases and they will feel more motivated and secure in trying new
diversification activities, such as planting lesser-known varieties.
As Van Bueren et al. (2005) demonstrated, this study highlights the importance of
participatory research and evaluation with farmers when choosing varieties that are better
adapted to specific enviornmental and management conditions. Coffee farmers in Turrialba
enjoy participatory evaluation projects because it gives them the chance to learn more as
well as discover new tomato and sweet pepper varieties that they consider not to be easily
available.
More participatory evaluation projects should be undertaken in order to collect
information on promising varieties for diversification. In order to effectively use the wide
range of genetic material found in genebanks, further on-farm trials must be carried out
that allow phenotypic information to be generated for specific varieties in different
environments.
However, while participatory evaluation brings many benefits to farmers, it is a time-
consuming and resource-intense process. Various improvements can be suggested for the
improvement of participatory evaluation, such as an increase in the number of varieties
tested and a decrease in the number of producers involved in the study. Also, the selection
of producers to be involved in the participatory evaluation should be more selective,
making sure that all farmers selected have a high level of commitment.
For the participatory evaluation process to be sustainable, local and on-farm seed
systems must be improved. This will allow farmers to save and reproduce seeds of
preferred varieties on the farm, so that they are not dependent on buying commercial seeds
of commercially available varieties each year.
1.6 References
Almekinders, CJ ; Thiele, G y Danial, DL. 2007. Can cultivars from participatory plant
breeding improve seed provision to small-scale farmers? Euphytica 1533:363-372.
Alvim, PdT. 1980. Aperspective appraisal of perennial crops in the Amazon Basin.
Colombia, CIAT.
Baca, M ; Läderach, P ; Haggar, J ; Schroth, G y Ovalle, O. 2014. An integrated
framework for assessing vulnerability to climate change and developing adaptation
strategies for coffee growing families in Mesoamerica. PloS one 92:e88463.
Available at
http://www.plosone.org/article/info%3Adoi%2F10.1371%2Fjournal.pone.0088463
#pone-0088463-g007
Bacon, C. 2005. Confronting the coffee crisis: can fair trade, organic, and specialty coffees
reduce small-scale farmer vulnerability in northern Nicaragua? World Development
333:497-511.

18
Bacon, C ; Mendez, E y Brown, M. 2005. Participatory action research and support for
community development and conservation: examples from shade coffee landscapes
in Nicaragua and El Salvador. Center for Agroecology & Sustainable Food
Systems:
Bacon, CM ; Sundstrom, WA ; Flores Gómez, ME ; Ernesto Méndez, V ; Santos, R ;
Goldoftas, B y Dougherty, I. 2014. Explaining the ‘hungry farmer paradox’:
Smallholders and fair trade cooperatives navigate seasonality and change in
Nicaragua's corn and coffee markets. Global Environmental Change 25:133-149.
Bioversity International. (2014, Cambridge. United Kingdom). 2014. International
Conference on Enhanced genepool Utilization - Capturing wild relative and
landrace diversity for crop improvement. Rome, Italy, 143 p. Consultado 27 Nov
2014.
Bioversity International. 2014. Strategic action plan to strengthen conservation and use of
Mesoamerican plant genetic resources in adapting agriculture to climate change
(SAPM) 2014-2024. Cali, Colombia, Bioversity International. Consulted 25 Oct
2014.
Bonham, C. 2011. Improving food security by linking G=genebanks to farmers through the
direct release of targeted landace varieties.13. Consulted 7 Nov 2014.
Buck, M y Hamilton, C. 2011. The Nagoya Protocol on access to genetic resources and the
fair and equitable sharing of benefits arising from their utilization to the
Convention on Biological Diversity. Review of European Community &
International Environmental Law 201:47-61.
Caswell, M ; Méndez, VE y Bacon, CM. 2012. Food security and smallholder coffee
production: current issues and future directions.
Caswell, M ; Méndez, VE ; Baca, M ; Läderach, P ; Liebig, T ; Castro-Tanzi, S y
Fernández, M. 2014. Revisiting the “thin months”–A follow-up study on the
livelihoods of Mesoamerican coffee farmers.
Ceccarelli, S y Grando, S. 2007. Decentralized-participatory plant breeding: an example of
demand driven research. Euphytica 1553:349-360.
Ciancaleoni, S ; Raggi, L y Negri, V. 2014. Genetic outcomes from a farmer-assisted
landrace selection programme to develop a synthetic variety of broccoli. Plant
Genetic Resources:1-4.
Danial, D ; Parlevliet, J ; Almekinders, C y Thiele, G. 2007. Farmers’ participation and
breeding for durable disease resistance in the Andean region. Euphytica 1533:385-
396.
Davis, AP ; Gole, TW ; Baena, S y Moat, J. 2012. The impact of climate change on
indigenous arabica coffee (Coffea arabica): predicting future trends and identifying
priorities. PloS one 711:e47981.
De Swart, EA ; Marcelis, LF y Voorrips, RE. 2006. Variation in relative growth rate and
growth traits in wild and cultivated Capsicum accessions grown under different
temperatures. Journal of Horticultural Science and Biotechnology 816:1029-1037.

19
Di Falco, S y Perrings, C. 2003. Crop genetic diversity, productivity and stability of
agroecosystems. A theoretical and empirical investigation. Scottish Journal of
Political Economy 502:207-216.
Eagles, H y Lothrop, J. 1994. Highland maize from Central Mexico—its origin,
characteristics, and use in breeding programs. Crop Science 341:11-19.
Eakin, H ; Tucker, C y Castellanos, E. 2006. Responding to the coffee crisis: a pilot study
of farmers’ adaptations in Mexico, Guatemala and Honduras. The Geographical
Journal 1722:156-171.
Ebert, AW. 2014. Potential of underutilized traditional vegetables and legume crops to
contribute to food and nutritional security, income and more sustainable production
systems. Sustainability 61:319-335.
Engels, J ; Ebert, A ; Thormann, I y De Vicente, M. 2006. Centres of crop diversity and/or
origin, genetically modified crops and implications for plant genetic resources
conservation. Genetic Resources and Crop Evolution 538:1675-1688.
FAO. 2009. International Treaty on Plant Genetic Resources for Food and Agriculture.
Trad. Fao. Rome, Italy, 68 p. Consultado 30 Oct 2014.
Flores, M. 2002. Centroamérica: El impacto de la caída de los precios del café. United
Nations Publications. Available at
http://books.google.co.cr/books?hl=en&lr=&id=lxJ4gFQocEgC&oi=fnd&pg=PA1
0&dq=+Centroam%C3%A9rica:+El+Impacto+de+la+Ca%C3%ADda+de+los+Pre
cios+del+Caf%C3%A9+en+el+2001&ots=WYy8jEC37Z&sig=2WxsJhWBNSkSo
pgDJ6VQwqWGKj0&redir_esc=y#v=onepage&q=Centroam%C3%A9rica%3A%2
0El%20Impacto%20de%20la%20Ca%C3%ADda%20de%20los%20Precios%20del
%20Caf%C3%A9%20en%20el%202001&f=false
Friis-Hansen, E y Sthapit, B. 2000. Participatory approaches to the conservation and use of
plant genetic resources. Bioversity International.
Halewood, M ; Deupmann, P ; Sthapit, B ; Vernoy, R y Ceccarelli, S. 2007. Participatory
plant breeding to promote farmer's rights. Bioversity International.
Hammer, K y Diederichsen, A. 2009. Evolution, status and perspectives for landraces in
Europe. European landraces on-farm conservation, management and use. Bioversity
Technical Bulletin 15:23-44.
Hethcote, L. 10 Nov 2014. Preguntas claves con productores de cafe en San Juan Norte y
Alto Varas, Cartago, Costa Rica Turrialba, Costa Rica, CATIE.
ICAFE. 2014. http://www.ICAFE.go.cr/.
Lin, BB. 2011. Resilience in agriculture through crop diversification: adaptive
management for environmental change. Bioscience 613:183-193.
Mendez, VE ; Bacon, CM ; Olson, M ; Morris, KS y Shattuck, A. 2010. Agrobiodiversity
and shade coffee smallholder livelihoods: A review and synthesis of ten years of
research in Central America*. The Professional Geographer 623:357-376.

20
Mercer, KL y Perales, HR. 2010. Evolutionary response of landraces to climate change in
centers of crop diversity. Evolutionary Applications 35-6:480-493.
Morris, KS ; Mendez, VE y Olson, MB. 2013. ‘Los meses flacos’: seasonal food insecurity
in a Salvadoran organic coffee cooperative. The Journal of Peasant Studies
402:423-446.
Scheldeman, X ; Van Damme, P ; Urena Alvarez, J y Romero Motoche, J. 2001.
Horticultural potential of Andean fruit crops exploring their centre of origin. In. p.
97-102.
Sthapit, B y Padulosi, S. 2012. On-farm conservation of neglected and underutilized crops
in the face of climate change. In. p. 31.
Van Bueren, EL ; Van Soest, L ; De Groot, E ; Boukema, I y Osman, A. 2005. Broadening
the genetic base of onion to develop better-adapted varieties for organic farming
systems. Euphytica 1461-2:125-132.
Vasquez, N ; Solano, W. Reunion sobre los Recursos geneticos de plantas para la
alimentacion y agricultura (2014, San Jose, Costa Rica). 2014. Eds. N Vasquez; W
Solano.
Witcombe, J ; Joshi, A ; Joshi, K y Sthapit, B. 1996. Farmer participatory crop
improvement. I. Varietal selection and breeding methods and their impact on
biodiversity. Experimental Agriculture 3204:445-460.
Witcombe, J ; Joshi, K ; Gyawali, S ; Musa, A ; Johansen, C ; Virk, D y Sthapit, B. 2005.
Participatory plant breeding is better described as highly client-oriented plant
breeding. I. Four indicators of client-orientation in plant breeding. Experimental
Agriculture 413:299-320.
Witcombe, JR. 2003. Impacts of participatory varietal selection and participatory plant
breeding on crop diversity. Conservation and Sustainable Use of Agricultural
Biodiversity Strengthening Local Management of Agricultural DiversityII:322-
330.
Zhu, Y ; Chen, H ; Fan, J ; Wang, Y ; Li, Y ; Chen, J ; Fan, J ; Yang, S ; Hu, L y Leung, H.
2000. Genetic diversity and disease control in rice. Nature 4066797:718-722.
Zonneveld, MV. Conversation with Maarten Von Zonneveld CATIE, Turrialba, Costa
Rica.

21
2. Chapter II. Article I: How does increased vegetable varietal choice
influence coffee farmers’ on-farm diversification strategies in the face
of changing climate conditions? To be submitted to the journal, “Agronomy for Sustainable Development”
Abstract
Crop diversification strategies are thought to be promising for Central American
coffee farmers looking for solutions to confront rapidly changing climate conditions.
Vegetable crops hold potential for diversification of coffee and other production systems
because of their high potential for income and nutrition security. However, limited seed
choice may lead to poor adaptation and eventually become a constraint for introducing
these crops. We anticipate that with an increase in varietal choice of vegetable crops,
farmers can make better choices when diversifying their farms, taking into consideration
environmental and management conditions that lead toward more sustainable and
intensified production. This study employs participatory evaluation with eight coffee
farmers in Turrialba, Costa Rica, at two altitudes and under two different types of
management (conventional and organic), as well as morphological characterization and
farmer evaluation of a diverse array of tomato and sweet pepper accessions and varieties
(AVRDC varieties, CATIE accessions and commercial varieties) to determine whether
increased varietal choice improves on-farm diversification strategies in the face of climate
change. These accessions and varieties came from the CATIE genebank and the AVRDC
breeding program, and their performance was compared to available commercial varieties.
Farmers’ scores from the participatory evaluation demonstrate that farmers identify a wide
range of successful AVRDC varieties and CATIE accessions that score better for farmer-
preferred traits when compared with the standard commercial varieties. Both altitude and
type of management influence farmers’ varietal preferences, illustrating the importance of
increased varietal choice for coffee farmers growing in diverse environments.
Characterization data also shows significant interactions between variety, altitude and type
of management. A comparison of the most successful varieties defined by farmers and the
most successful varieties according to characterization data demonstrates that farmers often
indicate different varieties that are different from those indicated in agronomic evaluation
studies as having the most potential to diversify farms. Without using participatory
methods to include farmers’ preferences in varietal selection, varieties may be promoted
that appear more satisfactory but are actually not preferred by the farmers themselves.
Farmers’ opinions of the present study illustrate that the current participatory evaluation of
increased varieties was an effective tool to help identify several new varieties that have
high potential for diversifying farms.
Key words: agrobiodiversity, tomato, Solanum, sweet pepper, Capsicum, increased
varietal choice, coffee, climate change, diversification, genetic diversity, genebank
accession, improved variety

22
2.1 Introduction
With constantly unstable and changing climate conditions, relying on a range of crops
as opposed to just one or a few crops allows farmers to stabilize income and maintain a
reliable food supply (Tshewang et al. 2003;Almekinders et al. 2007;Lin 2011;Jacobsen et
al. 2015). Therefore, crop diversification has been identified as a vital component in
adaptation of agricultural systems to climate change (Wood and Lenne 1997;Zhu et al.
2000;Kirschenmann 2007;Mercer and Perales 2010;Lin 2011;Thomas et al. 2015). In
Central America, diversification has become a crucial component for adapting coffee
systems and reducing the reliance of farm-family income and food security only on selling
coffee beans (Bacon 2005;Caswell et al. 2012;Morris et al. 2013). Introducing new crops
to coffee farms, such as vegetable crops, increases the functional diversity of the system
and therefore broadens the environmental niche so that multiple crops can perform well
within the same system (Ebert 2014). It also offers opportunities to reduce market risks by
having alternative cash crops when coffee prices are low.
Considering these benefits, many diversification projects have started in coffee-based
systems as well as other production systems in Central America (Caswell et al. 2012).
However, seed is often acquired without considering varietal diversity that would enable
selecting materials adapted to specific conditions. We anticipated that limited seed choices
could lead to poor adaptation on some farms and eventually discourage farmers from
diversifying. This happens when available varieties do not produce well under a wide
range of specific management or environmental conditions, such as, for example, in
mountainous areas.
Genebank collections contain a broad diversity of potentially interesting materials for
crop diversification. This diversity is a valuable source for breeding varieties that can be
offered to farmers. These materials could also be provided directly to farmers for
evaluation to reduce time from genebank to farmer and to make a better use of the diversity
maintained in these collections that could respond to farmers’ preferences for specific traits
and materials (Bioversity International 2014).
Farmers and farmer organizations are increasingly interested in exploring the full
potential of these varieties for income and food and nutrition security. Specific
mechanisms have been successfully created to facilitate farmers’ use and evaluation of
diverse plant genetic material, including participatory varietal selection (PVS) (Witcombe
et al. 1996;Friis-Hansen and Sthapit 2000;Scheldeman et al. 2001;Almekinders et al.
2007;Ceccarelli and Grando 2007;Danial et al. 2007;Ciancaleoni et al. 2014). Evaluation
and characterization data on modern varieties and traditional genebank varieties collected
from on-farm PVS trials allows farmers and researchers to make a targeted selection of
diverse genetic material tailored to local conditions (Witcombe 2003;Lin 2011).

23
The aim of this study is to understand the role of increased varietal choice and PVS in
motivating producers to adopt new crops for diversification activities on their farms. The
following specific research questions will be addressed:
To what extent are coffee producers interested in improved varieties and genebank
accessions for diversification of their farms?
How do farmers’ preferences for varieties related to their desired traits change at
different altitudes or under different types of management (organic versus
conventional)?
How does increased varietal supply increase crop performance according to traits of
interest at different altitudes or under different types of management (organic versus
conventional)?
What is the role of participatory evaluation and participatory varietal selection in
helping farmers identify more interesting varieties for crop diversification?
We tested our questions through PVS of sweet pepper and tomato accessions and
varieties with four conventional and four organic coffee farmers in Turrialba, Costa Rica,
at two different altitudes.
2.2 Materials and methods
2.2.1 Study area
The farms in the study are located in the canton of Turrialba in the province of
Cartago, Costa Rica. The altitude of Turrialba varies between 600 and 1,400 meters above
sea level. Turrialba covers 1,642 square kilometers and is located 45 kilometers southeast
of San Jose. The average precipitation of the canton is 2,600 millimeters per year, with an
average temperature of 21.5 degrees Celsius (ICAFE 2014).
In recent years, variable climate conditions and other factors have negatively
influenced coffee production in Turrialba. Coffee producers in Turrialba are located
between 600 and 1,400 meters above sea level; however, the optimal altitude for coffee
production has shifted from 1,200 to 1,600 meters (Baca et al. 2014). Climate changes
have meant an increase in pest and disease incidence: in 2014, 100% of the coffee
production area in Turrialba was affected by coffee rust, drastically affecting productivity
in the region (ICAFE 2014). Due to these changing factors, coffee producers are searching
for alternative crop options that will allow them to adapt to current and future changes.
2.2.2 Experimental design
Accessions and varieties of tomato and sweet pepper were planted during on-farm
varietal trials conducted with eight farmers, out of the 14 initially interviewed. The trials
were established as an unbalanced randomized block experiment, with altitude as the

24
primary block. Four farms were located above 1,000 meters (high altitude), while four
were located below 1,000 meters (low altitude). Farmer type was the secondary block.
Four farmers used conventional management and four organic. Each farm represented a
repetition and therefore there were no repetitions within the farms (see Table 4).
Table 4. Basic information on the eight farms included in the study
Producer Farm location Type of
management*
Altitude
(meters) Latitude Longitude
Carlos Alto de Humo C 1,000 9.79892 -80.73017236359613
Enrique San Juan Sur C 1,000 9.87341 -80.69169494176563
Daniel San Juan
Norte O 1,120
9.896679 -80.6986603118575
Jorge San Juan Sur O 1,022 9.873113 -80.69277147539046
Benedicto Pejibaye C 675 9.813302 -80.69392105670536
Celso Javillos C 697 9.921817 -80.62121779216601
Rosa Pejibaye O 690 9.806132 -80.70649360440605
Edgar Chitaria O 760 9.927043 -80.58904680787752
Note: C = conventional management, O = organic management
2.2.3 Crop selection
Fourteen initial producers—seven conventional and seven organic—from 37 contacted
current and ex coffee producers in Turrialba, Costa Rica, participated in initial interviews
to select preferred crops for diversification from four horticultural crop options: squash,
sweet pepper, hot pepper and tomato. These four crops were selected as options because
CATIE’s regional genebank maintains highly diverse collections of these crops, which are
openly accessible under the Multilateral System (MLS) established through FAO’s
International Treaty on Plant Genetic Resources for Food and Agriculture (ITPGRAFA).
These same farmers were also asked to define the most preferred traits for both tomato and
sweet pepper.
2.2.4 Farmer profile
All farms in the study are between three and seven hectares. Six of the farmers are still
primarily coffee farmers, while the other two have recently stopped producing coffee. The
farmers that still have coffee are dedicated mostly to coffee, as it is the most time- and
resource-consuming crop on the farms. All of the producers in the study are farmers
looking for diversification alternatives due to the drastically low coffee prices and
uncertainty associated with the crop.
All of the producers agree that diversification within the farm increases the economic
and environmental resistance of the system. Every farm has already been diversified from
coffee monocrops, principally with bananas, vegetables, aromatic herbs, legumes and
activities such as animal husbandry and tourism. However, in most cases, the farmers that
have diversified with vegetable crops have access only to commercially available hybrid

25
varieties. Use of open-pollinated or heirloom varieties for diversification was of interest to
every farmer in the study because these varieties are not regularly available, so any
opportunity to work with them is attractive to the farmers. While most organic farmers
expressed interest in using these types of varieties due to their positive effects on
agrobiodiversity on the farm, both conventional and organic farmers expressed interest in
using these materials to save and reproduce seed, which is not possible with the hybrid
commercial varieties, leaving them dependent on local greenhouses each year.
2.2.5 Variety and accession selection
Improved, open-pollinated tomato and sweet pepper varieties from the World
Vegetable Center (AVRDC) in Taiwan, heirloom variety accessions from the Tropical
Agricultural and Higher Education Center (CATIE) genebank in Costa Rica and common
commercial varieties available in the region were planted on each farm.
For tomato, the initial varieties selected included two AVRDC improved varieties, one
commercial variety (JR) and eight accessions from CATIE’s genebank. Many of CATIE’s
genebank collections consist largely of landrace and heirloom varieties. For sweet pepper,
the initial varieties selected included two AVRDC varieties, 1 commercial variety (Natalie)
and seven accessions from the CATIE genebank. Later on, two more sweet pepper
varieties were planted, one commercial variety (4212) and one AVRDC improved variety.
The commercial varieties selected were the most commonly used commercial varieties of
tomato and sweet pepper in Turrialba, Costa Rica, at the time of the study.
Table 5. General information and passport data for the varieties and accessions
used in the current study
Crop Accession Identifier Genus Species Date
introduced Origin
Tom. 5515 CATIE select1 Solanum lycopersicum 2/10/1976 Peru
Tom. 5640 CATIE select2 Solanum lycopersicum 2/10/1976 Peru
Tom. 10596 CATIE select3 Solanum lycopersicum 26/12/1979 Guatemala
Tom. 20485 CATIE select4 Solanum lycopersicum 14/02/1995 Costa
Rica
Tom. 20547 CATIE select5 Solanum lycopersicum 14/02/1995 Costa
Rica
Tom. 20553 CATIE
random1 Solanum lycopersicum 14/02/1995
Costa
Rica
Tom. 17358 CATIE
random2 Solanum lycopersicum 14/07/1986
United
States
Tom. 17330 CATIE
random3 Solanum lycopersicum 07/06/1986 Panama
Tom. 1426 AVRDC1 Solanum lycopersicum N/A Taiwan
Tom. 1424 AVRDC2 Solanum lycopersicum N/A Taiwan
Tom. JR Commercial1 Solanum lycopersicum N/A N/A
Pepper 18757 CATIE select1 Capsicum annuum 30/01/1990 Costa
Rica

26
Pepper 15661 CATIE select2 Capsicum annuum 1/12/1983 Guatemala
Pepper 17268 CATIE Select3 Capsicum baccatum 3/3/1986 Guatemala
Pepper 9777 CATIE select4 Capsicum frutescens 28/07/1979 Costa
Rica
Pepper 17151 CATIE
random1 Capsicum annuum 19/12/1985
United
States
Pepper 18660 CATIE
random2 Capsicum annuum 22/09/1989 Spain
Pepper 19259 CATIE
random3 Capsicum annuum 21/01/1992 Russia
Pepper 032170 AVRDC1 Capsicum annuum N/A Taiwan
Pepper 1247 AVRDC2 Capsicum annuum N/A Taiwan
Pepper 9814 AVRDC3 Capsicum annuum N/A Taiwan
Pepper Natalie Commercial1 Capsicum N/A N/A N/A
Pepper 4212 Commercial2 Capsicum N/A N/A N/A
Accessions from CATIE’s genebank were selected based on previously identified
farmer-preferred traits. Preferred traits defined by the producers were translated into
scientific descriptors so that the accessions could be filtered based on genebank
descriptions. Explora used a weighted sum model to create a subset from which the final
genebank accessions were selected. The initial subset was defined by weight (tomatoes
with a weight of 250 grams or more), width of endocarp, number of days to flowering and
color of pulp (in order from most important to least important). Five CATIE accessions
were selected based on seed availability from the initial subset of 15 accessions generated
by Explora. Additionally, three accessions were randomly selected as reference material
from a randomly generated set of 100,000 genebank accessions. We were able to select
three sweet pepper accessions manually because the CATIE genebank only maintains nine
sweet pepper accessions. Four other accessions were selected at random as a reference.
2.2.6 Seedling development
Seeds of the CATIE accessions and AVRDC improved varieties were ordered using
the Standard Material Transfer Agreement (SMTA) developed by the ITPGRFA. The
commercial varieties were ordered from a local commercial nursery. Initially, the AVRDC
variety and CATIE accession seedlings were germinated in a greenhouse at CATIE
beginning in February 2015. Due to low survival rates, a second batch was germinated and
developed by a commercial greenhouse in Cervantes, Costa Rica, in March 2015.
2.2.7 Transplant
Varieties were transplanted beginning in April 2015. Tomato and sweet pepper
varieties were planted under roofs made of plastic bands put in place by the study. On each
farm and for both crops, a buffer border row was planted on both sides of the study plot.
The seedlings were planted with 40 cm between each seedling and 1 meter between each
row. In each plot, fertilizer was applied at the time of planting. On conventional farms, a
fungicide was also applied directly following the transplant.

27
2.2.8 Climate sensors
Climate sensors, iButtons, were installed at each farm at the beginning of the study.
The iButtons measured temperature in degrees Celsius as well as relative humidity. Each
sensor was placed in an apparatus made according to an instruction manual written by
Bioversity International (Mittra et al. 2013).
2.2.9 Farmer management
Farmer management was homogenized among conventional farms as well as organic
farms through development of a common management and fertilization guide for each of
the two management types (Appendix 1). All conventional farmers received the same
conventional inputs and all organic farmers, the same organic inputs. After the initial
inputs were given to the farmers, other inputs were ordered and given as-needed to combat
farm-specific issues that occurred during the study (Appendix 2). All farmers applied the
same cultural practices to the study plants (Appendix 3).
Management indicators were developed, taking into consideration the most important
management aspects defined by the study, to score the management of each farmer, using a
Likert scale. These management aspects included: weed management, plant support,
independent management by farmer, application of provided inputs, water drainage,
trimming, removal of infected plant parts from plant, removal of infected plant parts from
study area and row height of planting rows (Appendix 4). Average scores for each
management indicator of interest in general, as well as pertaining to both types of
management, were compared in bar graphs.
2.2.10 Participatory evaluation
Participatory evaluations with each producer were carried out following methods
outlined by Coe (2012) (Appendix 5). The characteristics evaluated were the farmer-
preferred traits defined at the beginning of the study. Aside from the scores per farmer-
preferred trait that farmers assigned, they also assigned an overall score to each tomato and
sweet pepper variety. Farmer-preferred traits and farmer-varietal scores were used to
determine whether farmers identify more interesting varieties for crop diversification when
they have increased varietal choice as opposed to when they have access only to current
commercial seed supply.
Correspondence analyses of farmers’ scores per trait were used to determine which
varieties were most preferred by farmers for each farmer-preferred trait.
Dot plots were used to understand which varieties were most preferred by farmers
according to three different methods. It was assumed that the overall score assigned to each
variety by farmers was biased because the farmers assumed the commercial variety was the

28
best, without taking into consideration each preferred trait that they indicated at the
beginning of the study. In order to test this assumption, a comparison was done of overall
farmers’ scores; farmers’ scores per variety taking into consideration scores for each
characteristic of interest; and farmers’ score per variety taking into considerating each
weighted characteristic of interest. A weight was assigned to each farmer-preferred trait
based on the number of farmers who indicated each trait as important at the beginning of
the study. The higher the precentage of farmers who mentioned the characteristic as
important, the higher the weight assigned (Appendix 2).
Data from the participatory evaluations was used to explore how farmers’ preferences
differ according to altitudes (above 1,000 meters and below 1,000 meters) and under
different types of management (conventional and organic). Extended and mixed linear
models and correspondence analyses were carried out to explore these differences.
2.2.11 Morphological characterization
Minimum characterization and evaluation descriptors defined by IPGRI/CATIE
(IPGRI 1995;IPGRI 1996), as well as additional descriptors that responded to farmer-
preferred characteristics were taken into account. The additional descriptors for tomato
include plant width, branching habit, fruit wall thickness and seed surface texture. The
original minimum descriptor “weight of 1,000 seeds” was replaced by “weight of 100
seeds.” The only minimum descriptors for tomato that were excluded were fruit size and
pedicel scar width. Fruit weight, length and width already represent fruit size. Pedicel scar
width was not of great importance in this study. Additional descriptors for sweet pepper
included plant canopy width, leaf density and fruit wall thickness. Minimum descriptor for
sweet pepper that were excluded included life cycle, male sterility and number of seeds per
fruit because they were not relevant to purposes of the current study.
Extended and mixed linear models and correspondence analyses were used to
determine which varieties perform better according to the farmer-preferred traits of
interest.
Extended and mixed linear models and Nonparametric Kruskal-Wallis tests were used
to determine significant interactions among the variables of interest.
The materials that perform best in different altitudes and under different types of
management were defined using extended and mixed linear models and correspondence
analyses.
Incidence of important pests and diseases for each crop was measured according to the
IPGRI descriptors (IPGRI et al. 1995;IPGRI 1996). Tomato pests and diseases evaluated
included Phytophthora, Alternaria, Pseudomonas, bacterial infection and Aleyrodidae.
Sweet pepper pests and diseases evaluated included Cercospora, Pseudomonas,

29
Podosphaera, bacterial infection, virus, Aphidoidea. Nutrient deficiency was also included
in the analysis. These were evaluated because they are the most important pests and
diseases in tomato and sweet pepper crops in the tropics. Furthermore, Phytophthora and
Alternaria for tomato and Cercospora and Pseudomonas for sweet pepper were considered
in more detail because they are the most important diseases of the two crops. Incidence
was evaluated at four different intervals of the plant cycle: 1) between 45 and 90 days after
planting, 2) between 91 and 120 days after planting, 3) between 121 and 150 days after
planting and 4) between 151 and 180 days after planting.
In some cases, extended and mixed linear models and Nonparametric Kruskal-Wallis
tests showed that there were no significant differences among varieties. In these cases, the
most successful variety was determined by the highest mean for each farmer-preferred trait
of interest.
2.2.12 Participatory evaluation versus morphological characterization
Results from the farmers’ participatory evaluation and morphological characterization
and evaluation were used to determine whether farmers prefer the same varieties that were
shown as most successful by characterization for each farmer-preferred trait. The farmer-
preferred traits were matched with characterization descriptors to make the comparison.
There were additional farmer-preferred traits that were evaluated in this study that were not
included in the IPGRI descriptors, including: for tomatoes—good flavor, sweet fruit, fruit
lasts longer after harvest and fruit fit for market; for sweet peppers—fruit firmness.
Correspondence analyses were used to determine the variety most preferred by farmers
according to each farmer-preferred trait. Extended and mixed linear models of the
characterization data were used to determine the most successful varieties according to
each quantitative farmer-preferred trait. Correspondence analyses using characterization
data were used to determine the most successful varieties according to each qualitative
farmer-preferred trait.
For the traits that did not show a significant difference among varieties, in terms of
morphological characterization, the most successful variety was determined by the highest
mean for each trait of interest.
2.2.13 Final interviews
Final, semi structured interviews regarding farmer opinions on the participatory
evaluation process, genebank access and general opinions about the current project were
carried out at the end of the study (Appendix 6).
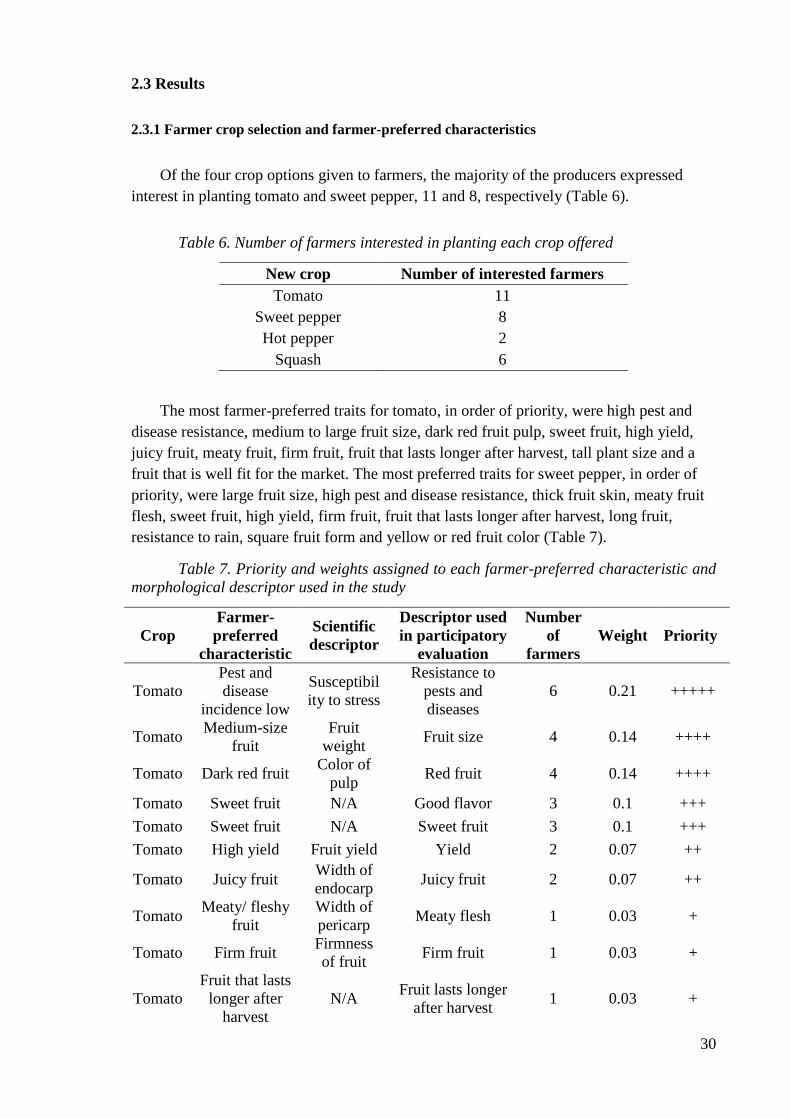
30
2.3 Results
2.3.1 Farmer crop selection and farmer-preferred characteristics
Of the four crop options given to farmers, the majority of the producers expressed
interest in planting tomato and sweet pepper, 11 and 8, respectively (Table 6).
Table 6. Number of farmers interested in planting each crop offered
New crop Number of interested farmers
Tomato 11
Sweet pepper 8
Hot pepper 2
Squash 6
The most farmer-preferred traits for tomato, in order of priority, were high pest and
disease resistance, medium to large fruit size, dark red fruit pulp, sweet fruit, high yield,
juicy fruit, meaty fruit, firm fruit, fruit that lasts longer after harvest, tall plant size and a
fruit that is well fit for the market. The most preferred traits for sweet pepper, in order of
priority, were large fruit size, high pest and disease resistance, thick fruit skin, meaty fruit
flesh, sweet fruit, high yield, firm fruit, fruit that lasts longer after harvest, long fruit,
resistance to rain, square fruit form and yellow or red fruit color (Table 7).
Table 7. Priority and weights assigned to each farmer-preferred characteristic and
morphological descriptor used in the study
Crop
Farmer-
preferred
characteristic
Scientific
descriptor
Descriptor used
in participatory
evaluation
Number
of
farmers
Weight Priority
Tomato
Pest and
disease
incidence low
Susceptibil
ity to stress
Resistance to
pests and
diseases
6 0.21 +++++
Tomato Medium-size
fruit
Fruit
weight Fruit size 4 0.14 ++++
Tomato Dark red fruit Color of
pulp Red fruit 4 0.14 ++++
Tomato Sweet fruit N/A Good flavor 3 0.1 +++
Tomato Sweet fruit N/A Sweet fruit 3 0.1 +++
Tomato High yield Fruit yield Yield 2 0.07 ++
Tomato Juicy fruit Width of
endocarp Juicy fruit 2 0.07 ++
Tomato Meaty/ fleshy
fruit
Width of
pericarp Meaty flesh 1 0.03 +
Tomato Firm fruit Firmness
of fruit Firm fruit 1 0.03 +
Tomato
Fruit that lasts
longer after
harvest
N/A Fruit lasts longer
after harvest 1 0.03 +

31
Tomato Tall plant size Height of
plant
Preferable plant
height 1 0.03 +
Tomato
Pre-
established
niche market
N/A Fit for market 1 0.03 +
Pepper Fruit size Fruit
weight Fruit size 6 0.207 ++++
Pepper Fruit size Fruit width Fruit size 6 0.207 ++++
Pepper
Pest and
disease
resistance
Pest and
disease
resistance
Pest and disease
resistance 4 0.138 +++
Pepper Thick skin Width of
fruit wall Thick skin 2 0.069 ++
Pepper Meaty fruit
flesh
Width of
fruit wall Meaty flesh 2 0.069 ++
Pepper Sweet fruit N/A Good flavor 1 0.034 +
Pepper High yield Fruit yield Yield 1 0.034 +
Pepper Firm fruit N/A Firm fruit 1 0.034 +
Pepper
Fruit that lasts
longer after
harvest
N/A Fruit lasts longer
after harvest 1 0.034 +
Pepper Long fruit Fruit
length Long fruit 1 0.034 +
Pepper Resistance to
rain N/A Resistance to rain 1 0.034 +
Pepper Square shaped Fruit shape N/A 1 0.034 +
Pepper Yellow
colored Fruit color
Preferable fruit
color 1 0.034 +
Pepper Red colored Fruit color Preferable fruit
color 1 0.034 +
2.3.2 Climate information
The farms above 1,000 meters had an average temperature of 21.4°C, maximum
temperature of 33.5°C, minimum temperature of 14.4°C, average humidity of 95.4%,
maximum humidity of 104% and minimum humidity of 43.7%. The farms below 1,000
meters had an average temperature of 22.3°C, maximum temperature of 34.4°C, minimum
temperature of 15.8°C, average humidity of 96%, maximum humidity of 104.4% and
minimum humidity of 45.7% (Table 8).
Table 8. Climate information collected from iButtons for each farm in the current
study
Producer
Avg
temp
(°C)
Max
temp
(°C)
Min
temp
(°C)
Avg
humidity
(%)
Max
humidity
(%)
Min
humidity
(%)
Daniel 21.5 33.5 13.7 95.1 103.4 45.1
Jorge 21.0 33.3 15.2 96.0 103.1 43.4
Enrique 21.4 32.8 14.6 95.4 104.1 43.2

32
Carlos 21.6 34.4 14.1 95.2 105.6 42.8
Avg high altitude 21.4 33.5 14.4 95.4 104.0 43.7
Benedicto 22.0 33.3 16.4 99.9 106.7 50.2
Celso 21.4 34.1 15.5 96.2 103.8 47.3
Rosa 23.0 36.0 15.8 94.3 103.4 41.3
Edgar 22.8 34.0 15.4 93.7 103.7 43.9
Avg low altitude 22.3 34.4 15.8 96.0 104.4 45.7
2.3.3 Farmers’ experience with vegetable crop management
Farmers excelled in weed management, providing plant support (tying up tomato and
sweet pepper plants to support the branches and fruit), farmer-led management and timely
application of provided inputs. Management by farmers was lacking with respect to water
drainage, plant trimming and pruning, removal of infected plant parts from the plant and
the plot, and proper preparation of row height for the rows where the plants were planted
(Fig. 3). In general, organic farmers had more refined management practices than the
conventional farmers (Fig. 4).
Figure 3. Bar graph of average farmer-management scores.

33
Figure 4. Bar graph of average farmer-management scores under both types of
management
Note: left = conventional, right = organic
2.3.4 Farmers’ preferences with increased varietal supply
Extended and mixed linear models showed that the farmers’ overall preferences varied
among the tomato and sweet pepper varieties. A significant difference in the farmers’
overall score per variety was found for both crops: tomato f = 1.94, p = 0.05; sweet pepper
f = 4.51, p =0.0001 (extended and mixed linear models). Significant difference in the
farmers’ score for each variety taking into consideration scores per trait was also found:
tomato f = 2.88, p = 0.004; sweet pepper f = 7.64, p = 0.0001 (extended and mixed linear
models). Comparing the farmers’ score for each variety taking into consideration weighted
scores per trait also illustrated differences among varieties: tomato f = 3.03, p = 0.003;
sweet pepper f = 8.59, p = 0.0001, (extended and mixed linear models).
Figure 5 shows that among tomato varieties, the Commercial1 variety was scored
highest by farmers for fruit size as well as good fit for the market. However apart from
these two farmer-preferred traits, CATIE accessions and AVRDC varieties were scored
higher for other preferred traits. CATIE random2 was scored highest for pest and disease
resistance, while CATIE select1, CATIE select3, CATIE select4 and CATIE random3 all
scored very high for red fruit pulp, good flavor, sweet fruit and fruit juiciness according to
farmers. CATIE select 5 was scored highest for yield. CATIE select2 and AVRDC1 were
scored highest for fruit firmness and meaty flesh. According to farmers, CATIE random1
had the most preferable plant height.

34
Figure 5. Correspondence analysis of tomato varieties and accessions and farmers’
scores by farmer-preferred traits
Note: triangle = fruit characteristic, circle = variety or accession
Figure 6 shows that for sweet pepper varieties, while Commercial1, Commercial2 and
AVRDC2 were most directly related to larger fruit size, CATIE accessions and AVRDC
varieties were scored higher in other preferred traits. CATIE select1, CATIE random2 and
CATIE random3 were scored high for traits such as fruit lasts longer after harvest, good
flavor, fruit firmness and desirable fruit color. CATIE select2 and AVRDC2 were scored
best for fruit skin thickness and meaty flesh. CATIE select3 and AVRDC3 were scored
highest for pest and disease resistance and resistance to rain. Commercial2 and AVRDC3
were scored highest for yield.

35
Figure 6. Correspondence analysis of sweet pepper varieties and accessions and
farmers’ scores by farmer-preferred traits
Note: triangle = fruit characteristic, circle = variety or accession
Figure 7 and Figure 8 show that the varieties were scored differently when the three
different scoring methods mentioned above (average overall variety score, score per
variety taking into consideration farmers’ preferred traits and score per variety taking into
consideration weighted farmer-preferred traits) were applied to tomato and sweet pepper
varieties. The dot plot in figure 7 shows that farmers’ peferences changed when comparing
average overall score and average score of all farmer-preferred traits for tomato varieties.
For example, among tomato varieties, Commercial1 was scored as more preferred
according to the overall score and score per variety taking into consideration farmer-
preferred traits, however CATIE random2 was the most preferred according to score per
variety taking into consideration weighted farmer-preferred traits. This shows the
assumption may be true that the average overall varietal scores are not very representative
of actual farmers’ preferences because the farmers did not take into consideration
accurately all preferred traits at the time of assigning an overall score.
When using the farmers’ average overall varietal score and score per variety taking
into consideration farmer-preferred traits to compare tomato varieties, farmers preferred
the Commercial1 variety. However, when the score per variety taking into consideration
weighted farmer-preferred traits was used, CATIE random2 was shown to be the most
preferred (Fig 7).

36
Figure 7. Dot plot of farmers’ preferences for tomato varieties and accessions
Note: circle = farmers’ average overall score, square = score per variety taking into
consideration farmer-preferred traits, triangle = score per variety taking into consideration
weighted farmer-preferred traits
Figure 8 shows that preferences changed when comparing farmers’ average overall
varietal score and score per variety taking into consideration farmer-preferred traits for
sweet pepper varieties. For example, Commercial2 was scored as more preferred than
AVRDC1 when comparing farmers’ average overall varietal score. However, when the
farmers’ score per variety taking into consideration farmer-preferred traits was compared,
AVRDC1 was more preferred than Commercial2.
For sweet pepper varieties, Commercia1 was the most preferred using all three
methods of scoring. This shows that even with the weights assigned to each preferred trait,
Commercial1 was still the most preferred variety. The second most preferred sweet pepper
variety when comparing the farmer’s overall varietal score was accession CATIE select3.
However, when comparing the score per variety taking into consideration weighted farmer-
preferred traits, AVRDC2 was the second most preferred variety (Fig. 8).
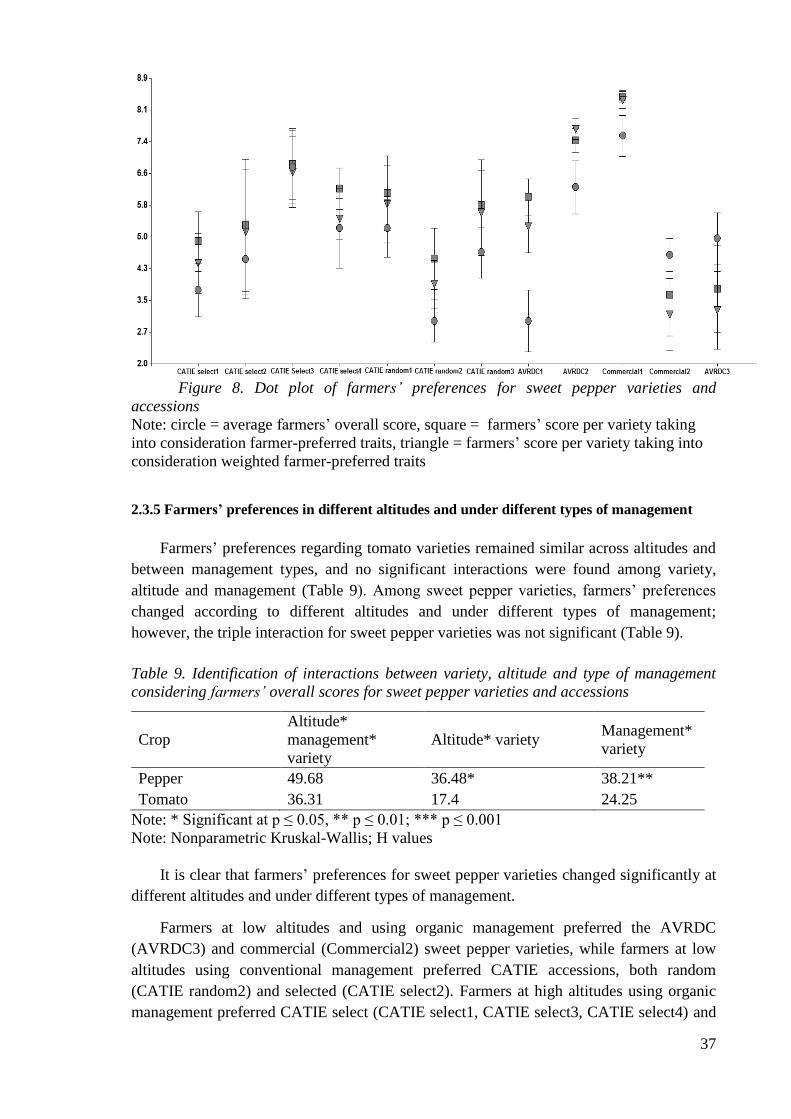
37
Figure 8. Dot plot of farmers’ preferences for sweet pepper varieties and
accessions
Note: circle = average farmers’ overall score, square = farmers’ score per variety taking
into consideration farmer-preferred traits, triangle = farmers’ score per variety taking into
consideration weighted farmer-preferred traits
2.3.5 Farmers’ preferences in different altitudes and under different types of management
Farmers’ preferences regarding tomato varieties remained similar across altitudes and
between management types, and no significant interactions were found among variety,
altitude and management (Table 9). Among sweet pepper varieties, farmers’ preferences
changed according to different altitudes and under different types of management;
however, the triple interaction for sweet pepper varieties was not significant (Table 9).
Table 9. Identification of interactions between variety, altitude and type of management
considering farmers’ overall scores for sweet pepper varieties and accessions
Crop
Altitude*
management*
variety
Altitude* variety Management*
variety
Pepper 49.68 36.48* 38.21**
Tomato 36.31 17.4 24.25
Note: * Significant at p ≤ 0.05, ** p ≤ 0.01; *** p ≤ 0.001
Note: Nonparametric Kruskal-Wallis; H values
It is clear that farmers’ preferences for sweet pepper varieties changed significantly at
different altitudes and under different types of management.
Farmers at low altitudes and using organic management preferred the AVRDC
(AVRDC3) and commercial (Commercial2) sweet pepper varieties, while farmers at low
altitudes using conventional management preferred CATIE accessions, both random
(CATIE random2) and selected (CATIE select2). Farmers at high altitudes using organic
management preferred CATIE select (CATIE select1, CATIE select3, CATIE select4) and

38
CATIE random (CATIE random1) varieties and farmers at high altitudes using
conventional management scored CATIE random (CATIE random3) accessions and
AVRDC (AVRDC1) varieties highest. These differences may be due to diverse farmer-
preferred traits at different altitudes or under different types of management. They also
may be due to better performance, measured by scientific descriptors, of certain accessions
or varieties at different altitudes or under different types of management (Fig. 9).
Figure 9. Correspondence analysis demonstrating farmer-preferred sweet pepper
varieties and accessions at both altitudes and under both types of management
Note: diamond = altitude, type of management; circle = variety or accession
2.3.6 Morphological characterization and the effects of altitude and type of management on
varietal performance
2.3.6.1 Variety comparison
According to extended and mixed linear models and correspondence analyses, the
commercial tomato variety had the highest fruit weight. However, apart from fruit weight,
CATIE accessions and improved AVRDC varieties dominated other preferred traits.
AVRDC2 had the highest resistance to pest and disease in general, as well as to
Phytopthora and Alternaria. For the other traits of interest, CATIE select accessions,
CATIE random accessions and AVRDC varieties all showed the best results (Table 10).
For sweet pepper varieties, the commercial and improved AVRDC varieties
dominated fruit size (fruit weight, fruit width and fruit length) as well as width of fruit wall
and resistance to Pseudomonas. CATIE select3 had the highest resistance to pests and
diseases in general and CATIE select 4 had the highest resistance to Cercospora (Table
10).

39
Table 10. Identification of most successful tomato and sweet pepper varieties
according to morphological characterization and evaluation data for each farmer-
preferred trait
Crop Descriptor Best variety or
accession
Tomato Pest and disease
resistance AVRDC2
Tomato Phytophthora AVRDC2 Tomato Alternaria AVRDC2 Tomato Fruit weight Commercial1 Tomato Color of pulp CATIE select2 Tomato Endocarp width CATIE random1 Tomato Pericarp width AVRDC1 Tomato Fruit firmness AVRDC2, CATIE select1 Tomato Plant height AVRDC1 Pepper Fruit weight AVRDC2 Pepper Fruit width AVRDC2
Pepper Pest and disease
resistance CATIE select3
Pepper Cercospora CATIE select4 Pepper Pseudomonas Commercial1 Pepper Width of fruit wall AVRDC2 Pepper Fruit length Commercial2 Pepper Fruit form Commercial1, AVRDC2
Pepper Fruit color CATIE random1,
AVRDC2
Note: Extended and mixed linear models and correspondence analyses
For most of the quantitative and qualitative morphological characterization descriptors
of interest, significant differences between tomato and sweet pepper varieties were found.
The effects of altitude and management on tomato and sweet pepper on their own were not
significant; however, the interactions between altitude and variety and between
management and variety were very significant for both crops (Table 11).
Looking more closely at specific pest and disease resistances among tomato and sweet
pepper varieties, characterization data illustrated that there were significant interactions
between tomato variety, altitude and management, variety and management and variety
and altitude when comparing resistance in general and, more specifically, to Phytophthora
and Alternaria. Sweet pepper varieties, however, only revealed a significant interaction
between management and variety when comparing resistances of the varieties to
Cercospora. There were no significant interactions found when comparing the resistance
of sweet pepper varieties to pest and disease in general nor to Pseudomonas (Table 11).
For tomato varieties, AVRDC2 had the highest resistance to all pests and disease
under organic management and at low altitudes. Under conventional management, CATIE

40
random2 had the highest resistance to pests and diseases in general as well as to
Phytophthora, while CATIE select5 had the highest resistance to Alternaria. At high
altitudes, CATIE select 5 had the highest resistance to pests and disease in general and to
Phytophthora, while AVRDC2 demonstrated the highest resistance to Alternaria (Table
12).
For sweet pepper varieties under organic management, CATIE select3 had the highest
resistance to pests and disease in general as well as to Pseudomonas, while CATIE select1
had the highest resistance to Cercospora. Under conventional management, Commercial1
variety showed the highest resistance to pests and disease in general, while CATIE select4
had the highest resistance to Cercospora. At low altitudes, CATIE select3 revealed the
highest resistance to pests and disease in general, CATIE random2 to Cercospora and
AVRDC3 to Pseudomonas. At high altitudes, CATIE select3 had the highest resistance to
both pests and disease in general as well as to Cercospora, while CATIE random3 had the
highest resistance to Pseudomonas (Table 12).
Table 11. Identification of interactions among variety, altitude and type of management
considering tomato and sweet pepper characterization and evaluation data
Crop Attribute Altitude
(A)
Management
(M)
Variety
(V) A*V M*V A*M*V
Tomato Pest and disease
resistance 1.96 0.09 10.05*** 4.91*** 4.92*** 2.68***
Tomato Phytophthora 2.4 0.04 3.78*** 2.42** 2.74*** 2.02**
Tomato Alternaria 0.02 0.09 19.2*** 8.66*** 10.33*** 4.95***
Tomato Fruit weight 0.34 2.23 12.19*** 5.10*** 6.12*** 2.97**
Tomato Color of pulp 0.04 0.39 12.59 22.49 12.84 33.81
Tomato Endocarp width 0.01 1.15 14.93*** 7.8*** 7.23*** 5.18***
Tomato Pericarp width 0.04 7.96* 4.5*** 2.24** 2.82** 1.67
Tomato Fruit firmness 0.07 0.01 8.9 12.35 -0.67 21.65
Tomato Plant height 0.08 0.18 5.22*** 3.34*** 2.97** 2.5**
Pepper Fruit weight 0.35 0.16 9.69*** 3.98*** 5.36*** 2.55**
Pepper Fruit width 0.26 0.03 19.49*** 10.85*** 8.61*** 5.3***
Pepper Pest and disease
resistance 0.61 0.16 1.14 1.06 1 1.03
Pepper Cercospora 0.9 2.05 2.83** 1.62 2.63** 1.71
Pepper Pseudomonas 1.38 3.41 1.75 1.21 1.3 1.5

41
Pepper Width of fruit wall 0.23 0.08 10.2*** 5.94*** 5.34*** 2.49*
Pepper Fruit length 0.39 0.73 14.0*** 7.14*** 7.56*** 3.6**
Pepper Fruit form 0.01 1.10E-03 44.2*** 46.58*** 45.82*** 51.33*
Pepper Color of mature
fruit 0.04 0.07 37.82*** 46.33*** 44.30*** 53.44*
Note: * Significant at p ≤ 0.05, ** p ≤ 0.01; *** p ≤ 0.001
Note: Extended and mixed linear models to compare quantitative descriptors; values per
trait and interaction are expressed as F values. Nonparametric Kruskall-Wallis to compare
qualitative descriptors; values per trait and interaction expressed as H values.
Note: Pest and disease resistance for tomato includes resistance to Phytophthora,
Alternaria, Pseudomonas, fruit bacteria and Aleyrodidae.
Note: Pest and disease resistance for sweet pepper includes resistance to Cercospora,
Pseudomonas, fruit bacteria, Virus, Aphidoidea and nutrient deficiency.
Table 12. Best tomato and sweet pepper varieties for each preferred trait under
both types of management and at each altitude according to morphological
characterization and evaluation
Crop Trait Organic Conventional Low High
Tomato Pest and disease
resistance AVRDC2 CATIE random2 AVRDC2 CATIE select5
Tomato Phytophthora AVRDC2 CATIE random2 AVRDC2 CATIE select5 Tomato Alternaria AVRDC2 CATIE select5 AVRDC2 AVRDC2 Tomato Fruit weight Commercial1 CATIE select2 CATIE Select2 Commercial1
Tomato Color of pulp AVRDC1, AVRDC2
AVRDC1, AVRDC2
AVRDC1, AVRDC2
AVRDC1, AVRDC2
Tomato Endocarp
width CATIE select2 CATIE random1 CATIE select5 Commercial1
Tomato Pericarp
width AVRDC1 AVRDC1 AVRDC1 AVRDC1
Tomato Fruit firmness
CATIE select1, CATIE
select4, AVRDC2
CATIE select1, CATIE select4,
AVRDC2
CATIE select1, CATIE
select4, AVRDC2
CATIE select1, CATIE
select4, AVRDC2
Tomato Plant height AVRDC1 AVRDC1 CATIE
random2 AVRDC1
Pepper Fruit weight Commercial2 AVRDC1 Commercial2 AVRDC2
Pepper Fruit width AVRDC2 AVRDC2 AVRDC2 AVRDC2
Pepper Pest and disease
resistance CATIE select3 Commercial1 CATIE Select3 CATIE select3
Pepper Cercospora CATIE select1 CATIE select4 CATIE
random2 CATIE select3
Pepper Pseudomonas CATIE select3 Commercial1 AVRDC3 CATIE

42
random3
Pepper Width of fruit
wall AVRDC3 AVRDC2 AVRDC3 AVRDC2
Pepper Fruit length AVRDC3 Commercial2 CATIE select2 Commercial2
Pepper Fruit form Commercial1,
AVRDC1, AVRDC3
Commercial1, AVRDC1, AVRDC3
Commercial1, AVRDC1, AVRDC3
Commercial1, AVRDC1, AVRDC3
Pepper Fruit color
CATIE random1,
CATIE, random2
CATIE Select1, AVRDC1, AVRDC2
CATIE random1,
CATIE, random2 CATIE
select1, AVRDC1, AVRDC2
CATIE random1,
CATIE, random2
CATIE select1,
AVRDC1, AVRDC2
CATIE random1,
CATIE, random2
CATIE select1,
AVRDC1, AVRDC2
Note: Extended and linear mixed models and nonparametric Kruskal-Wallis.
2.3.6.2 Group comparisons
Extended and mixed linear models and correspondence analyses showed that different
groups of tomato and sweet pepper varieties were most successful according to specific
farmer-preferred traits (Table 13).
When comparing morphological data per trait across tomato variety groups, the
commercial variety group demonstrated the largest fruit-size results (fruit weight, endocarp
width, pericarp width) as well as best plant height. The CATIE random accession group
showed the highest resistance to pests and diseases in general as well as more specifically
to Phytophthora and Alternaria. The AVRDC groups appeared to have the best pulp color,
while the CATIE select group had the best fruit firmness (Table 13).
Morphological data for sweet pepper groups showed that the commercial variety
group and improved AVRDC variety group were the most successful in fruit size (fruit
weight, fruit width and fruit length). The commercial group had the highest resistance to
Pseudomonas; however, the CATIE select group had the highest resistance to pests and
diseases in general as well as to Cercospora. The commercial variety group had the most
preferable fruit form. The AVRDC group was most successful in width of the fruit wall
and fruit color (Table 13).
Table 13. Most successful tomato and sweet pepper variety groups according to
morphological characterization and evaluation data for each farmer-preferred trait
Crop Descriptor Best variety group or accession group
Tomato Pest and disease resistance CATIE random Tomato Phytophthora CATIE random Tomato Alternaria CATIE random Tomato Fruit weight Commercial Tomato Color of pulp AVRDC

43
Tomato Endocarp width Commercial Tomato Pericarp width Commercial
Tomato Fruit firmness CATIE select Tomato Plant height Commercial Pepper Fruit weight Commercial Pepper Fruit width AVRDC Pepper Pest and disease resistance CATIE select Pepper Cercospora CATIE select Pepper Pseudomonas Commercial Pepper Width of fruit wall AVRDC Pepper Fruit length Commercial Pepper Fruit form Commercial
Pepper Fruit color AVRDC,
Commercial Note: Extended and mixed linear models and correspondence analyses
There were significant interactions between altitude and group; management and
group and altitude; management and group among sweet pepper groups; and a few
significant interactions among tomato variety groups (Table 14).
For tomato varieties under organic management, commercial and CATIE random
groups were most frequently regarded as the best. Under conventional, management,
commercial, CATIE select and CATIE random most frequently appeared to be the best. At
low altitudes, commercial and CATIE random groups were most frequently displayed as
best according to preferred characteristics. At high altitudes, commercial and CATIE select
groups were most frequently displayed as best according to preferred characteristics (Table
15).
For sweet pepper varieties, commercial and AVRDC groups were most frequently the
best under both types of management and both altitudes (Table 15).
Looking at pest and disease resistance more closely, it is noted that tomato resistance
to pests and diseases in general and to Alternaria was significantly different among groups.
There was also a significant interaction between management and variety group when
comparing resistance to Alternaria. No significant interactions appeared when comparing
resistance to Phytophthora among tomato groups. For sweet pepper, no significant
interactions among groups appeared when looking at resistance to pests and diseases in
general. However, when comparing resistance to Cercospora, there was a significant
interaction between altitude and group, management and group as well as the triple
interaction between altitude, management and group. Resistance to Pseudomonas revealed
a significant interaction only when looking at the triple interaction between altitude,
management and group (Table 14).
The CATIE random group for tomato had the highest resistance to pests and diseases
in general at both altitudes and under both types of management as well as to Phytophthora
at low altitudes and under conventional management. The CATIE select group showed the
highest resistance, more specifically to Phytophthora at high altitudes under organic
management and to Alternaria at high altitudes and under conventional management. The

44
CATIE random group was the most resistant to Alternaria at low altitudes and under
organic management, while the CATIE select group was most resistant to Alternaria under
conventional management at high altitudes (Table 15).
For sweet pepper varieties, CATIE select accessions had the highest resistance to pests
and disease in general at high altitudes and under organic management. The CATIE
random group showed the highest resistance in general at low altitudes, and the
commercial variety group showed the highest resistance under conventional management.
The CATIE select accession group showed highest resistance to Cercospora at high
altitudes and under organic management, while CATIE random group demonstrated the
highest resistance at low altitudes and under conventional management. The AVRDC
variety group had the highest resistance to Pseudomonas at low altitudes and under organic
management, while the commercial variety group had more resistance at high altitudes and
under conventional management (Table 15).
Table 14. Identification of interactions among group, altitude and type of management
considering tomato and sweet pepper characterization data
Crop Trait Altitude
(A) Management
(M) Group
(G) A*G M*G A*M*G
Tom. Pest and disease
resistance 1.96 0.09 3.55** 1.82 1.54 1.17
Tom. Phytophthora 2.4 0.04 1.83 1.17 1.02 0.77 Tom. Alternaria 0.02 0.09 4.87** 2.02 2.07* 1.7 Tom. Fruit weight 0.1 1.46 3.34* 1.14* 1.7 1.61 Tom. Color of pulp 0.04 0.39 1.99 3.85 6.2 8.95
Tom. Endocarp
width 0.01 1.15 3.38* 1.84 1.75 1.59
Tom. Pericarp
width 0.04 7.96* 3.73** 1.57 3.19** 1.64
Tom. Fruit firmness 0.07 0.01 2.43 2.75 5.15 7.32 Tom. Plant height 0.02 0.13 1.3 1.13 1.01 0.92 Pepp. Fruit weight 0.36 0.16 32.65*** 16.35*** 13.79*** 7.39*** Pepp. Fruit width 0.26 0.03 27.67*** 12.75*** 11.62*** 5.9***
Pepp. Pest and disease
resistance 0.61 0.16 0.35 0.57 0.63 0.67
Pepp. Cercospora 0.9 2.05 5.2** 2.39* 3.75*** 2.26** Pepp. Pseudomonas 1.38 3.41 2.34 1.42 1.81 2.04*
Pepp. Width of fruit
wall 0.23 0.08 31.44*** 13.07*** 13.05*** 5.69***
Pepp. Fruit length 0.39 0.73 23.44*** 9.61*** 10.14*** 4.53*** Pepp. Fruit form 0.01 1.10E-03 23.5*** 23.99*** 23.98*** 25.67*
Pepp. Color of
mature fruit 0.04 0.07 9.83** 11.77 11.48 14.19
Note: * Significant at p ≤ 0.05, ** p ≤ 0.01; *** p ≤ 0.001

45
Note: Extended and mixed linear models to compare quantitative descriptors; values per
trait and interaction expressed as F values. Nonparametric Kruskall-Wallis used to
compare qualitative descriptors; values per trait and interaction expressed as H values.
Table 15. Most successful tomato and sweet pepper groups under both types of
management and at each altitude according to morphological characterization and
evaluation
Crop Trait Organic Conventional Low High
Tomato Pest and disease
resistance CATIE
random CATIE random
CATIE random
CATIE random
Tomato Phytophthora CATIE select CATIE random CATIE
random CATIE select
Tomato Alternaria CATIE
random CATIE select
CATIE random
CATIE select
Tomato fruit weight Commercial Commercial Commercial Commercial
Tomato Color of pulp Commercial CATIE select CATIE select,
Commercial
Commercial, CATIE random
Tomato Endocarp width Commercial Commercial Commercial Commercial Tomato Pericarp width Commercial AVRDC Commercial AVRDC Tomato Fruit firmness AVRDC CATIE select AVRDC CATIE select Tomato Plant height Commercial Commercial Commercial Commercial Pepper Fruit weight AVRDC Commercial Commercial AVRDC Pepper Fruit width AVRDC AVRDC AVRDC AVRDC
Pepper Pest and disease
resistance CATIE select Commercial
CATIE random
CATIE select
Pepper Cercospora CATIE select CATIE random CATIE
random CATIE select
Pepper Pseudomonas AVRDC Commercial AVRDC Commercial
Pepper Width of fruit
wall AVRDC AVRDC Commercial AVRDC
Pepper Fruit length Commercial Commercial Commercial Commercial
Pepper Fruit form AVRDC,
Commercial AVRDC,
Commercial AVRDC,
Commercial AVRDC,
Commercial
Pepper Fruit color AVRDC,
Commercial AVRDC,
Commercial AVRDC,
Commercial AVRDC,
Commercial Note: Extended and mixed linear models and nonparametric Kruskal-Wallis.
2.3.7 Comparison of farmers’ scores and characterization
There were notable differences between the varieties that the farmers scored as most
successful per trait and the varieties that were most successful per descriptor according to
characterization and evaluation data. Farmer-preferred traits could be easily paired with
scientific descriptors: farmers were often searching for characteristics similar to those
usually assessed in a scientific characterization.

46
Improved varieties, commercial and AVRDC of both tomato and sweet pepper crops
tended to dominate the fruit weight descriptor category for tomato and sweet pepper as
observed by farmers as well as in the morphological characterization. However, apart from
fruit weight, CATIE accessions and AVRDC varieties of both tomato and sweet pepper
tended to be the most favorable with respect to each trait according to farmers’ preferences
and scientific characterization. Farmers’ preferences were dominated by CATIE select and
CATIE random accessions, while scientific characterization identified CATIE select
accessions and improved AVRDC varieties as most frequently successful (Table 16).
Table 16. Comparison of most successful varieties and accessions of tomato and sweet
pepper according to farmers’ preferences and scientific characterization and evaluation
Crop Farmer-
preferred characteristic
Scientific descriptor
Descriptor used in participatory
evaluation
Farmer preferences
Scientific characterization
Tomato Pest and disease
incidence low
Susceptibility to stress
Resistance to pests and diseases
CATIE random2
AVRDC2
Tomato Medium size
fruit Fruit
weight Fruit size Commercial1 Commercial1
Tomato Dark red fruit Color of
pulp Red fruit CATIE select4 CATIE select2
Tomato Sweet fruit N/A Good flavor CATIE select3 N/A Tomato Sweet fruit N/A Sweet fruit CATIE select4 N/A
Tomato Juicy fruit Width of endocarp
Juicy fruit CATIE
select3, CATIE select1
CATIE random1
Tomato Meaty/fleshy
fruit Width of pericarp
Meaty flesh CATIE select2 AVRDC1
Tomato Firm fruit Firmness of fruit
Firm fruit AVRDC1 AVRDC2, CATIE
select1
Tomato Fruit that lasts
longer after harvest
N/A Fruit that lasts
longer after harvest
CATIE random1
N/A
Tomato Tall plant size Height of
plant Preferable plant
height CATIE
random1 AVRDC1
Tomato Fit for market N/A Fit for market Commercial1 N/A
Pepper Fruit size fruit
weight Fruit size AVRDC2 AVRDC2
Pepper Fruit size Fruit width fruit size AVRDC2 AVRDC2
Pepper Pest and disease
resistance
Pest and disease
resistance
Resistance to pest and disease
CATIE select3 CATIE select3
Pepper Skin thickness Width of fruit wall
Thick skin CATIE select2 AVRDC2
Pepper Meaty flesh Width of fruit wall
Meaty flesh CATIE
select2, AVRDC2
AVRDC2
Pepper Fruit firmness N/A Firm fruit CATIE select1 N/A

47
Pepper Fruit lasts after
harvest N/A
Fruit that lasts longer after
harvest CATIE select1 N/A
Pepper Resistance to
rain N/A
Resistance to rain
AVRDC3 N/A
Pepper Fruit length Fruit
length Long fruit AVRDC2 Commercial2
Pepper Square shaped Fruit form N/A N/A Commercial1,
AVRDC2
Pepper Yellow colored Fruit color Preferable fruit
color CATIE select1
CATIE random1, AVRDC2
Pepper Red colored Fruit color Preferable fruit
color CATIE select1
CATIE random1, AVRDC2
Note: Extended and mixed linear models and correspondence analyses
2.3.8 Farmers’ engagement and perspective on PVS for diversification
2.3.8.1 Participatory evaluation
All eight farmers said that during the study they discovered new varieties that
demonstrated high resistance and were of high quality. The conventional farmers tended to
seek varieties of both tomato and sweet pepper that had larger fruit size and higher yield,
whereas the organic farmers tended to be more open to diversifying with varieties that
produced smaller fruit and may not have had as high of a yield but had other important
traits.
All of the farmers commented that the new varieties motivated them to either start or
continue diversifying their farms with new crops as well as new varieties. They explained
that because of drastically changing climate conditions, every year it is harder to find
varieties adapted to their farms with sufficient resistance to pests and diseases. Many
farmers had lost motivation for planting new crops because the currently available varieties
are not adapted to new conditions, and oftentimes they revert back to focusing on the
coffee plants.
2.3.8.2 Seeds
All eight farmers indicated that they do not like being dependent on seed companies or
commercial nurseries to buy seeds or plants; they prefer to have their own seeds from
open-pollinated varieties and accessions. Seven of the eight farmers, three organic and four
conventional, had begun saving seeds from this project. The AVRDC varieties and CATIE
accessions are not hybrids, therefore the farmers can continue to reproduce their own high-
quality seeds and be less dependent on outside sources. However, none of the farmers in
the study had either adequate resources or knowledge for appropriate seed saving.

48
The majority of the farmers also expressed dissatisfaction with the currently available
commercial varieties, saying that they would like to have a broader range of varieties to
choose from. All farmers claimed that they would benefit from enhanced access to
genebanks, such as the one at CATIE; however, they all feel that the process to access the
material in the genebank needs to be made easier and more understandable for all users.
One organic farmer at the higher altitude mentioned that he would like to see CATIE
offer trays of seedlings of the traditional varieties in the genebank as an alternative to the
commercially available trays found in local greenhouses.
2.3.8.3 Perceptions about the project
Every farmer, both organic and conventional, involved in the project said that the
study was a valuable learning experience. All were interested in learning about and trying
new open pollinated varieties and accessions to find crops and varieties that do best on
their farms; however, all of them mentioned that they lack the support and proper access to
varietal material to be able to do so on their own. Six farmers indicated that they like
working in group projects such as this participatory evaluation because they learn more
than when working alone.
All eight farmers mentioned that other projects, either supported by the government or
private entities, often fail because there is not continued support and accompaniment
throughout the project. Six of the farmers said that one thing they liked most about this
participatory evaluation was that we visited the farms very often and they felt that they had
a lot of technical and moral support.
All eight farmers in the study suggested that the project should have been planned
more in advance and with better preparation, together with the farmer. The tomato and
sweet pepper plants were planted during the rainiest part of the year due to project time
constraints. This greatly affected the results of the study because many of the young plants
experienced extreme climate conditions. All farmers also commented that they would have
liked to have had more time to prepare the land before planting. Due to miscommunication,
one organic farmer at the higher altitude removed some of the tomato plants before the
study was finished. This farmer said that the confusion was due to miscommunication
about how long the project would last and suggested that better explanations be given to
the farmer at the beginning of the study.
One organic farmer at the higher altitude suggested that the project should have first
planted the varieties and accessions that were selected for the project in a trial plot to make
sure that each variety had market potential and preferable characteristics.

49
2.4 Discussion
Tomato and sweet pepper crops were most preferred by farmers for diversification
according to the results of initial farmer interviews. Tomato is a high value, major
commercial crop and has the potential to diversify farms and be a significant source of
income for small-scale farmers (De La Peña and Hughes 2007;Oluoch et al. 2009;Gautam
et al. 2013). Sweet pepper is another crop that has great potential for diversification
because of the diversity that exists within the crop, most of which is still unexplored
(Zonneveld et al. 2014). Vegetable crops in general have high commercial value and
nutritional benefits that make them important for the diversification of any small-scale
farming system (Ebert 2014).
Although all eight farmers initially expressed sincere interest in diversification with
tomato and sweet pepper, not all of the farmers showed the same commitment throughout
the project. The commitment to farmer-led management and various cultural practices of
each farmer varied greatly. It can be assumed that this variation, although blocked due to
the experimental design, affected the results of the study. For example, one of the organic
farmers at a high altitude was scored significantly lower than the others in farmer-led
management and, as a consequence, the plants performed poorly on this farm. On the other
end of the spectrum, an organic farmer at a low altitude displayed very advanced
management practices; on this farm, plants developed quickly and grew to be very large
and productive.
Farmer management has an impact on the likelihood that the farmer will adopt new
varieties. The higher the level of farmer interest and participation in a PVS project, the
more likely the farmer is to adopt new crops. When farmers lack motivation or the
knowledge to properly manage crops, the true potential of new varieties cannot be
recognized and therefore may not be appreciated (Joshi and Witcombe 1996).
Results from this study showed that increased varietal choice gave individual coffee
farmers in Costa Rica more possibilities to increase the productivity of their farms more
than when they had access only to current commercial varieties. Different varieties had
different farmer-preferred traits that are useful in different situations. The most successful
varieties, according to farmers as well as to morphological characterization and evaluation
data, changed in different environments and under different types of management. This
illustrates that if homogenous solutions are offered to farmers, such as one particular
tomato or sweet pepper variety being offered to multiple farmers in different environments
and with different motives, the performance of the crop may be low and thereby may
discourage farmers from diversifying their farms. Without a wide range of varieties to
choose from, farmers lack opportunity to see the true potential of vegetable diversification
within the farm (Jäger et al. ;Ceccarelli 1994).
Many studies report the utility of using PVS in on-farm trials for selecting varieties
that perform well in diverse environments and meet farmer criteria (Witcombe et al.

50
1996;Friis-Hansen and Sthapit 2000;Atlin et al. 2001;Araya-Villalobos and Hernández-
Fonseca 2006;Oluoch et al. 2009;Gautam et al. 2013;Ciancaleoni et al. 2014) We applied
participatory evaluation and PVS in the current study to allow farmers to choose specific
tomato and sweet pepper varieties that have more preferred traits and that have the
potential to maximize crop performance.
The use of weighted farmer scores to compare varieties demonstrated that applying
weighted values is highly important in participatory evaluation because preferences can
change drastically based on the weights assigned to each farmer-preferred trait. By
comparing the weighted farmer scores to the farmers’ overall scores for each variety, it was
seen that the original assumption may be true: when farmers are evaluating varieties
overall, they are not taking into consideration the weighted importance of each trait they
identified as being important prior to the evaluation.
This study revealed that while both farmers’ scores and characterization data identified
the commercial tomato variety as most successful with respect to traits sought out by the
commercial market, CATIE accessions and AVRDC varieties were most successful for all
other farmer=preferred tomato traits.
According to farmers’ scores for tomato varieties, the improved commercial variety
scored highest for traits such as fruit weight and good fit for market. Characterization data
demonstrated again that the commercial tomato variety had the highest fruit weight.
CATIE accessions and AVRDC improved varieties dominated all other farmer-preferred
traits according to both farmer scores and characterization data. For example, AVRDC2
had the highest resistance to all pest and disease categories for tomatoes according to
characterization data, and CATIE random2 to all tomato pests and diseases according to
farmer scores. CATIE random and CATIE select accessions were repeatedly scored as the
most preferred varieties by farmers due to their favorable traits pertaining to fruit color,
flavor, fruit sweetness, fruit juiciness, high yield, meaty flesh, fruit firmness and plant
height.
The same phenomenon seen in tomatoes held true for sweet peppers. Farmers scored
improved varieties, Commercial 1 and AVRDC2 as having the best fruit size and fruit
length. Characterization data again demonstrated that the improved varieties, both
commercial and AVRDC, dominated fruit size categories: fruit weight, fruit width and fruit
length. However, CATIE select and CATIE random accessions were scored highest by
farmers for traits such as fruit that lasts longer after harvest, good flavor, fruit firmness and
desirable fruit color. Characterization data showed that CATIE select varieties had the
highest resistance to pests and diseases in general (CATIE select3) as well as to
Cercospora (CATIE select4), while commercial varieties had the highest resistance to
Psedomonas (Commercial1), one of the most detrimental diseases for sweet pepper crops.
Although the improved varieties, both commercial and AVRDC, performed better
with regard to commercially valued traits, CATIE accessions and some AVRDC varieties

51
performed and were scored high by farmers for other traits of interest. Not all farmers were
interested in varieties that displayed the best results for commercial characteristics. Some
farmers, especially organic, were searching for characteristics apart from these commercial
characteristics, in varieties that can be used for other purposes, such as value-added
products.
Phytophthora is one of the most detrimental diseases for tomato crops. The disease
can cause significant reduction in yields as well as severe damage to the foliar and fruit
part of the plant (Oluoch et al. 2009;Quesada-Ocampo and Hausbeck 2010). According to
characterization data, AVRDC2 had the highest resistance to both Phytophthora and
Alternaria. However, when comparing resistance across groups, the CATIE random group
of accessions had the highest resistance to Phytophthora and Alternaria.
This result displayed the importance of environmentally specific variety selection.
When comparing results among groups (CATIE select accessions, CATIE random
accessions, AVRDC varieties and commercial varieties), we got one result, and when we
compared among specific varieties, we got another result. This is why on-farm variety
analysis is so important: generalized varietal selection may not always be appropriate for
every environment and may leave out interesting and highly useful results (Ceccarelli
1994).
As climates continue to change, especially in the tropics, new varieties having higher
resistances will be needed. Both Phytophthora and Pseudomonas, for example, develop
more quickly and more severely in wet climates in tomato and sweet pepper crops,
respectively. Often, new and improved vegetable varieties are created using genes from
traditional varieties that have specific characteristics, such as increased pest and disease
resistance (Ebert 2014). Moreover, results from this study and many others demonstrated
the potential of characterized and promising accessions from genebank collections in
tropical heterogeneous environments because they often are more preferred by farmers
than available commercial varieties and display better performance in many farmer-
preferred trait categories. (Mulatu and Zelleke 2002;Quesada-Ocampo and Hausbeck
2010;Carvalho et al. 2013;Gautam et al. 2013;Ebert 2014).
Significant interactions between variety and altitude as well as between variety and
type of management were found in farmer scores. Farmers at different altitudes and using
different types of management preferred different sweet pepper varieties. These preference
differences may have been due to diverse farmer-preferred traits at different altitudes or
under different types of management. They may also have been attributed to better
performance, measured by scientific descriptors, of certain accessions or varieties at
different altitudes or under different types of management. Regardless, these difference
again highlight the importance of considering genotype-environment interactions to find
the most appropriate improved varieties or traditional accessions for diverse environments.
Other studies have found similar results (Ceccarelli 1994;Atlin et al. 2001;Mulatu and
Zelleke 2002;Bertero et al. 2004;De Swart et al. 2006).

52
Characterization data also illustrated how altitude and type of management influenced
which varieties were most successful. The varieties that were most resistant to the different
pests and disease changed with altitude and under both types of management. For example,
the AVRDC2 tomato variety appeared to be the most resistant to tomato pests and diseases
in general when a general analysis was done, without considering altitude and
management. However, when these two variables were considered, CATIE random2 was
the most resistant to pests and diseases in general under conventional management, and
CATIE select5 was most resistant to pests and disease in general at high altitudes.
There are differences between which varieties were preferred by farmers and which
demonstrated the most potential according to characterization and evaluation data. Farmer
preferences were dominated by CATIE select and CATIE random accessions, while
scientific characterization identified most frequently improved AVRDC varieties as
successful. Although it was observed that scientists and farmers were searching for the
same characteristics in varieties, the differences in results may have been because farmers
and scientists have distinct criteria for scoring varieties. Oftentimes, farmer motives and
scientific motives are different, explaining why the two techniques to evaluate varieties
yielded differing results. These differences highlight the importance of including farmers’
preferences in varietal evaluation. Other studies have also found that farmers’ preferences
are very useful when selecting varieties for further use and improvement (Witcombe et al.
1996;Bacon et al. 2005;Witcombe et al. 2005;Ceccarelli y Grando 2007;Halewood et al.
2007).
In general, it was difficult to say whether improved varieties (AVRDC and
commercial varieties) or genebank accessions (CATIE accessions) had more potential for
farm diversification. Both improved varieties and genebank accessions were useful for
diversification, and their potential was dependent on site-specific biotic and abiotic factors.
Increased varietal choice allows farmers to choose for themselves whether they want to
plant improved varieties or genebank accessions. When farmers have access to a wider
range of intraspecific diversity, it is more likely that they will find varieties that fit their
specific motives and environmental conditions. This can lead to a more extensive interest
and use of interspecific diversification, bringing the many benefits of both types of
diversification to the farm (Van Bueren et al. 2005;Lin 2011).
Although field studies in areas with specific conditions can be carried out to determine
the varieties or variety groups best to recommend, this type of generalization can greatly
decrease the effectiveness of on-farm diversification and neglect specific genebank
accessions of high potential. It is recommended that individual farmers be given access to
packets of options that contain different types of varieties and accessions, so each can
choose for himself or herself what varieties are best for the farm.
The study revealed that the coffee farmers enjoyed this participatory evaluation and
PVS because it gave them the chance to learn in an interactive environment and to discover
new tomato and sweet pepper varieties of high quality and great potential that are not

53
available in today’s commercial marketplace. All of the farmers explained that it is
currently very hard to find unique varieties with characteristics adapted to changing
climate conditions; for example, many mentioned that it is nearly impossible to find tomato
and sweet pepper varieties with sufficient pest and disease resistance to confront the pests
and diseases that exist today. All of the farmers said that with the new varietal selection
choices from the current project, they felt more motivated to continue seeking new
diversification options for the farm.
Participatory evaluation has many benefits as well as specific drawbacks. Lack of
access or knowledge of access to a diverse selection of vegetable varieties negatively
affects farmers’ efforts to diversify their farms (Carvalho et al. 2013;Bioversity
International 2014). All farmers in the current study confirmed this finding through their
frustration with their current access to a narrow range of commercial varieties.
Participatory evaluation is a way to bring diverse material to farms so that the farmers have
access to a wide range of varietal options to find those varieties that perform best for their
specific conditions. When farmers have the resources they need for intraspecific
diversification, interspecific diversification becomes more appealing (Lin 2011). After the
current study concluded, most of the farmers felt more motivated to contact CATIE for
new varieties in the future.
On the other hand, participatory evaluation is a time- and resource-intensive process.
As seen in this study, the level of experience in vegetable crop management most likely
influences study results. Participatory evaluation with farmers who are not motivated or
who lack sufficent knowledge to carry out the evaluation adequately is inefficient (Araya-
Villalobos and Hernández-Fonseca 2006). One suggestiont to improve the effectiveness of
participatory evaluation is to plant a larger number of new varieties and accessions with a
smaller group of farmers that have more experience. A larger group of farmers can be
invited to the study plots to participate in the evaluation at the end of the study to capture
the farmers preferences. This could reduce costs and focus efforts on finding a wider range
of promising varieties while working with dedicated farmers who will develop the plants to
their full potential.
Another aspect of participatory evaluation that should be considered is the end motive
of each farmer for diversification. While half of the farmers in the current study were
interested in new varieties for a wide range of activities, such as value-added products and
home cooking, the other half were only interested in new varieties that would be accepted
by the commercial market. It could be useful to collect information regarding motives
before starting a participatory evaluation and include different study groups that represent
the different types of producers (Jäger et al.).
Participatory evaluation is an important tool for bringing diverse genetic matieral
directly to farms. Generally, germoplasm material is first sown and improved at research
stations and then given to farmers to plant on their farms. However, if genebank material is
given directly to the farmers, farmers can improve the material themselves according to

54
specific farmer criteria as well as contribute to the distribution of genetic diversity within
local seed systems (Jäger et al. ;Carvalho et al. 2013;Bioversity International 2014).
In this study, genebank material from tomato and sweet pepper collections from
CATIE was given directly to the farmers. These genebank collections included landraces
and heirloom varieties, some of which showed good performance for the farmer-preferred
traits defined in the study and allowed farmers to see the potential of genebank materials in
their own farm environments and under their specific management techniques. Each
individual was able to choose specific varieties better adapted to that specific farm, using
the genetic material more efficiently.
However, in order for this direct use of genebank material to be sustainable, the
structure and efficiency of local seed systems need to be considered. In this study, seven of
the eight farmers were saving seeds from the new varieties by the end of the study.
However, none of the farmers had adequate systems for saving seeds because they have
become accustomed to buying commercially available seed year after year. Without
appropriate seed saving, the introduction of new genetic material to farms will not be a
sustainable effort. Capacity building is necessary so that farmers can not only recapture the
importance of seed saving but also learn easy on-farm techniques for saving seeds
appropriately.
2.5 Conclusion
Increased varietal selection for farmers is useful because it gives farmers with different
motives a wider range of options, increasing the probability that they will find varieties and
accessions that fit their specific needs and specific environments. Oftentimes, generalized
variety selection for generalized environmental scenarios can leave out important varieties
and accessions of high potential. By taking into consideration altitude and type of
management, along with other farm-specific factors, successful tomato and sweet pepper
varieties can be selected more effectively.
It is not easy to say whether improved varieties or genebank accessions are most
useful for farm diversification. Rather, it is important to encourage the use of improved
varieties as well as the direct use of genebank accessions in order to determine the most
successful varieties at the farm level.
For a more efficient use of accessions, farmers should be connected directly to
genebanks. Apart from this direct link, nongovernmental and governmental organizations
that are able to multiply seed materials should also be connected to the diverse genetic
resources in genebanks. This will allow them to offer a wider selection of varieties to
farmers during capacity-building activities or other initiatives.
Government subsidies would also help encourage on-farm diversification. By offering
subsidies to farmers willing to experiment with diversification, the farmers’ risk decreases

55
and they will feel more motivated and secure in trying new diversification activities, such
as planting lesser known varieties.
By using participatory evaluation and morphological characterization to evaluate a
diverse array of varieties and accessions, more specific varietal recommendations can be
made taking into consideration genotype X environment interactions. Although farmer-
preferred traits are similar to the traits being characterized by scientists, farmers often have
different criteria that result in the identification of different varieties as most successful.
For this reason, participatory varietal selection is not successful without the combined
effort of scientists and farmers (Almekinders et al. 2007).
2.6 References
Almekinders, CJ ; Thiele, G y Danial, DL. 2007. Can cultivars from participatory plant
breeding improve seed provision to small-scale farmers? Euphytica 1533:363-372.
Araya-Villalobos, R y Hernández-Fonseca, JC. 2006. Participative breeding of the local
bean variety "Sacapobres" in Costa Rica. Agronomía Mesoamericana 173:347-
355. Reimpreso de: Author affiliation: Estación experimental fabio baudrit moreno,
Universidad de Costa Rica, Apartado postal 2645-3000, Heredia, Costa Rica.
Author Email: [email protected]
Atlin, G ; Cooper, M y Bjørnstad, Å. 2001. A comparison of formal and participatory
breeding approaches using selection theory. Euphytica 1223:463-475.
Baca, M ; Läderach, P ; Haggar, J ; Schroth, G y Ovalle, O. 2014. An integrated
framework for assessing vulnerability to climate change and developing adaptation
strategies for coffee growing families in Mesoamerica. PloS one 92:e88463.
Available at
http://www.plosone.org/article/info%3Adoi%2F10.1371%2Fjournal.pone.0088463
#pone-0088463-g007
Bacon, C. 2005. Confronting the coffee crisis: can fair trade, organic, and specialty coffees
reduce small-scale farmer vulnerability in northern Nicaragua? World Development
333:497-511.
Bacon, C ; Mendez, E y Brown, M. 2005. Participatory action research and support for
community development and conservation: examples from shade coffee landscapes
in Nicaragua and El Salvador. Center for Agroecology & Sustainable Food
Systems.
Bacon, CM ; Sundstrom, WA ; Flores Gómez, ME ; Ernesto Méndez, V ; Santos, R ;
Goldoftas, B y Dougherty, I. 2014. Explaining the ‘hungry farmer paradox’:
Smallholders and fair trade cooperatives navigate seasonality and change in
Nicaragua's corn and coffee markets. Global Environmental Change 25:133-149.
Bertero, H ; De la Vega, A ; Correa, G ; Jacobsen, S y Mujica, A. 2004. Genotype and
genotype-by-environment interaction effects for grain yield and grain size of
quinoa (Chenopodium quinoa Willd.) as revealed by pattern analysis of
international multi-environment trials. Field Crops Research 892:299-318.

56
Bioversity International. (2014, Cambridge. United Kingdom). 2014. International
conference on enhanced genepool utilization - Capturing wild relative and landrace
diversity for crop improvement. Rome, Italy, 143 p. Consulted 27 Nov 2014.
Bioversity International. 2014. Strategic action plan to strengthen conservation and use of
Mesoamerican plant genetic resources in adapting agriculture to climate change
(SAPM) 2014-2024. Cali, Colombia, Bioversity International. Consultado 25 Oct
2014.
Carvalho, MAAPd ; Bebeli, PJ ; Bettencourt, E ; Costa, G ; Dias, S ; Santos, TMMd y
Slaski, JJ. 2013. Cereal landraces genetic resources in worldwide GeneBanks. A
review. Agronomy for Sustainable Development 331:177-203. Reimpreso de:
Author Affiliation: ISOPlexis Germplasm Bank, University of Madeira, Campus da
Penteada, 9000-390, Funchal, Portugal. Author Email:
Caswell, M ; Méndez, VE y Bacon, CM. 2012. Food security and smallholder coffee
production: current issues and future directions.
Caswell, M ; Méndez, VE ; Baca, M ; Läderach, P ; Liebig, T ; Castro-Tanzi, S y
Fernández, M. 2014. Revisiting the “thin months”–a follow-up study on the
livelihoods of Mesoamerican coffee farmers.
Ceccarelli, S y Grando, S. 2007. Decentralized-participatory plant breeding: an example of
demand driven research. Euphytica 1553:349-360.
Ciancaleoni, S ; Raggi, L y Negri, V. 2014. Genetic outcomes from a farmer-assisted
landrace selection programme to develop a synthetic variety of broccoli. Plant
Genetic Resources:1-4.
Danial, D ; Parlevliet, J ; Almekinders, C y Thiele, G. 2007. Farmers’ participation and
breeding for durable disease resistance in the Andean region. Euphytica 1533:385-
396.
De la Peña, R y Hughes, J. 2007. Improving vegetable productivity in a variable and
changing climate. Journal of SAT Agricultural Research 41:1-22.
De Swart, EA ; Marcelis, LF y Voorrips, RE. 2006. Variation in relative growth rate and
growth traits in wild and cultivated Capsicum accessions grown under different
temperatures. Journal of Horticultural Science and Biotechnology 816:1029-1037.
Ebert, AW. 2014. Potential of underutilized traditional vegetables and legume crops to
contribute to food and nutritional security, income and more sustainable production
systems. Sustainability 61:319-335.
FAO. 2009. International treaty on plant genetic resources for food and agriculture. Trad.
Fao. Rome, Italy, 68 p. Consulted 30 Oct 2014.
Friis-Hansen, E y Sthapit, B. 2000. Participatory approaches to the conservation and use of
plant genetic resources. Bioversity International.
Gautam, U ; Negi, R ; Singh, R ; Kaushik, S y Singh, A. 2013. Participatory evaluation of
tomato varieties for commercial cultivation during rainy season under Kaymore

57
Plateau and Satpura Hills–Agro-climatic zone of Madhya Pradesh. Journal of
Agricultural Science 54:p238.
Halewood, M ; Deupmann, P ; Sthapit, B ; Vernoy, R y Ceccarelli, S. 2007. Participatory
plant breeding to promote farmer's rights. Bioversity International.
ICAFE. 2014. http://www.ICAFE.go.cr/.
IPGRI ; AVRDC y CATIE. 1995. Descriptors for Capsicum (Capsicum spp.). Rome, Italy,
Consultado 25 Nov 2014.
IPGRI. 1996. Descriptors for tomato (Lycopersicon spp.). Rome, Italy, Consulted 25 Oct
2014.
Jacobsen, S-E ; Sørensen, M ; Pedersen, SM y Weiner, J. 2015. Using our
agrobiodiversity: plant-based solutions to feed the world. Agronomy for
Sustainable Development:1-19.
Jäger, M ; van Zonneveld, M ; Ramirez, M y Amaya, K. Linking genebanks and farmers
to urban markets-native chili peppers in Peru and Bolivia.
Joshi, A y Witcombe, JR. 1996. Farmer participatory crop improvement. II. Participatory
varietal selection, a case study in India. Experimental Agriculture 3204:461-477.
Kirschenmann, FL. 2007. Potential for a new generation of biodiversity in agroecosystems
of the future. Agronomy Journal 992:373-376.
Lin, BB. 2011. Resilience in agriculture through crop diversification: adaptive
management for environmental change. Bioscience 613:183-193.
Mercer, KL y Perales, HR. 2010. Evolutionary response of landraces to climate change in
centers of crop diversity. Evolutionary Applications 35-6:480-493.
Mittra, S ; van Etten, J y Franco, T. 2013. Collecting weather data in the field with high
spatial and temporal resolution using iButtons.
Morris, KS ; Mendez, VE y Olson, MB. 2013. ‘Los meses flacos’: seasonal food insecurity
in a Salvadoran organic coffee cooperative. The Journal of Peasant Studies
402:423-446.
Mulatu, E y Zelleke, H. 2002. Farmers' highland maize (Zea mays L.) selection criteria:
Implication for maize breeding for the Hararghe highlands of eastern Ethiopia.
Euphytica 1271:11-30.
Oluoch, M ; Silué, D ; Nono-Womdim, R ; Hanson, P ; Black, L ; Wang, T ; Ojiewo, C y
Swai, I. 2009. Participatory cultivar evaluation, selection, and release of Late Blight
resistant romato cultivars in Tanzania. In. p. 199-206.
Quesada-Ocampo, L y Hausbeck, M. 2010. Resistance in tomato and wild relatives to
crown and root rot caused by Phytophthora capsici. Phytopathology 1006:619-627.
Scheldeman, X ; Van Damme, P ; Urena Alvarez, J y Romero Motoche, J. 2001.
Horticultural potential of Andean fruit crops exploring their centre of origin. In. p.
97-102.

58
Thomas, M ; Verzelen, N ; Barbillon, P ; Coomes, OT ; Caillon, S ; McKey, D ; Elias, M ;
Garine, E ; Raimond, C y Dounias, E. 2015. A network-based method to detect
patterns of local crop biodiversity: validation at the species and infra-species levels.
Advances in Ecological Research.
Tshewang, U ; Hardon, JJ y Tamang, A. 2003. Integrating in situ and ex situ conservation
with on-farm use. Conservation and Sustainable use of Agricultural Biodiversity
Strengthening Local Management of Agricultural DiversityII:368-375.
Van Bueren, EL ; Van Soest, L ; De Groot, E ; Boukema, I y Osman, A. 2005. Broadening
the genetic base of onion to develop better-adapted varieties for organic farming
systems. Euphytica 1461-2:125-132.
Witcombe, J ; Joshi, A ; Joshi, K y Sthapit, B. 1996. Farmer participatory crop
improvement. I. Varietal selection and breeding methods and their impact on
biodiversity. Experimental Agriculture 3204:445-460.
Witcombe, J ; Joshi, K ; Gyawali, S ; Musa, A ; Johansen, C ; Virk, D y Sthapit, B. 2005.
Participatory plant breeding is better described as highly client-oriented plant
breeding. I. Four indicators of client-orientation in plant breeding. Experimental
Agriculture 413:299-320.
Witcombe, JR. 2003. Impacts of participatory varietal selection and participatory plant
breeding on crop diversity. Conservation and Sustainable Use of Agricultural
Biodiversity: Strengthening Local Management of Agricultural DiversityII:322-
330.
Wood, D y Lenne, JM. 1997. The conservation of agrobiodiversity on-farm: questioning
the emerging paradigm. Biodiversity & Conservation 61:109-129.
Zhu, Y ; Chen, H ; Fan, J ; Wang, Y ; Li, Y ; Chen, J ; Fan, J ; Yang, S ; Hu, L y Leung, H.
2000. Genetic diversity and disease control in rice. Nature 4066797:718-722.
Zonneveld. 25 August 2014. Conversation with Maarten Von Zonneveld CATIE,
Turrialba, Costa Rica.

59
3. Chapter III. Article II: Improving access to vegetable seeds for diverse
and resilient farms: Lessons learned from coffee farmers in Turrialba,
Costa Rica Submitted to “Farming Matters” journal
A group of coffee farmers in Turrialba, Costa Rica, is successfully exploring
diversification options with horticultural food crops. This is being done in collaboration
with two vegetable genebanks that allow farmers to use varieties freely under the
MultiLateral System of FAO´s International Treaty on Plant Genetic Resources for Food
and Agriculture.
Experiments with tomato and sweet pepper varieties were successful and show
promise for helping farmers gain access to genetic resources of horticultural crops. The
resulting diversity could be the basis for diversified farming systems that are more resilient
in progressive climate change and price volatility, while providing nutritious food crops at
the same time. This case study therefore calls for the inclusion of more horticultural crops
in the Annex 1 list of species covered by the Multilateral System (MLS, Annex 1, p. 46–
47), such as tomato and sweet pepper.
3.1 Why mix coffee production with tomato and sweet pepper crops?
In Turrialba, Costa Rica, climate change and low coffee prices motivated small-scale
coffee farmers to spread risk and diversify their farms by integrating new crops. Eight
small-scale coffee farmers in Turrialba chose to participate in an experiment with tomato
and sweet pepper led by CATIE. These crops were chosen for the experiment for the
following reasons:
1) These horticultural crops are of great interest to farmers in this region as alternative
cash crops that are complementary with coffee, as well as for domestic consumption
2) The genebanks of the Tropical Agricultural Research and Higher Education Center
CATIE and The World Vegetable Center (AVRDC) maintain highly diverse collections of
these two crops, providing the necessary variety for selection of interesting materials. They
are also openly accessible under the Multilateral System (MLS) established by FAO´s
International Treaty on Plant Genetic Resources for Food and Agriculture (ITPGRFA).
The experiment’s premise is that diversified farming systems are often ecologically
and economically more resilient than those with less components. Diversified systems
provide farmers with a range of resources, including stabilization of income and production
and diverse food for consumption. This diversity has been shown to result in systems
becoming more resilient to climate change and price volatility.
However, farmers often do not have access to appropriate seed material to diversify
their systems with food and/or cash crops compatible with their interests. In this project,

60
we explore how access to diverse genetic material can improve a farmer’s ability to
effectively diversify his or her farm in a way that makes it resilient and sustainable.
3.2 How did farmers conduct the experiment?
Eight farmers, four organic and four conventional, were invited to participate in the
study based on their interest in diversification and willingness to participate. The farmers
evaluated three types of tomato and sweet pepper seeds. These included 1) popular
commercial varieties, 2) traditional varieties from CATIE’s genebank in Costa Rica that
were selected according to farmers’ preferences indicated in initial interviews and 3) new
varieties that were developed by breeders from AVRDC in Taiwan to respond to specific
biotic and abiotic conditions in Central America.
Seeds from CATIE’s genebank were ordered using the Standard Material Transfer
Agreement (SMTA) developed by ITPGRFA. Seeds of the AVRDC varieties were
obtained by CATIE after signing a Material Transfer Agreement (MTA) to test them in
Central America. In addition, the most common commercial varieties of tomato and sweet
pepper were ordered from a local greenhouse.
After the seedlings were transplanted on each farm, plastic bands were installed as
protective roofs above each variety. Conventional and organic seedlings were given to each
producer, along with a management guide that was used to ensure the same management
approaches were used on all farms.
Each farm was visited once a week from the time the transplant began, April 2015,
until the end of the field experiments, November 2015. During the visits, the following
data were taken: 1) morphological and evaluation data of each variety; 2) site
characterization of each farm; 3) management evaluation of each producer; 4) climate data;
5) yield data; 6) participatory evaluations with the producers and 6) individual interviews
with the producers about their preferences.
3.3 Farmers’ preferences
Many factors affected variety preferences of each farmer, including the type of
management used on the farm, local market factors and local biotic factors. Although many
farmers appreciated the commercial varieties because of their pest and disease resistance
and high yields, several CATIE accessions as well as a few AVRDC varieties were ranked
as equally or even more preferred.
Most producers involved in this project expressed satisfaction with the new varieties
brought to their farms, which they had never seen. Rosa Hernández Céspedes, a coffee
farmer who has been trying to diversify her 7-hectare farm for the past eight years, is very
excited.

61
“These new varieties also give us something new to sell,” she said.“ The local people
want new kinds of vegetables, new options, but I never knew where to find the seeds. So I
have started saving the seeds from the new varieties and I can now sow my own seedlings
and produce these great vegetables again.”
What started out as strictly a coffee plantation had already been converted by Rosa
into a diverse, organic farm that includes a vegetable greenhouse, a restaurant and a
nursery of tree species. Yet, before her involvement in this project, Rosa had little success
in diversifying with vegetables, as expressed in the following statement:
“I always planted the same commercial varieties of vegetables, including commercial
varieties of tomato and sweet pepper. But with this project, I have discovered many
traditional varieties of great quality, some of which are more resistant to the increase in
rain we have had this year. It’s great to have all of these new options on the farm.”
For farmers like Rosa who are searching for diverse products with unique
characteristics, the traditional CATIE accessions were of most interest. Many of the
traditional varieties tested in the study showed characteristics that were appealing to these
farmers, such as high resistance to pests and diseases as well as fruit forms that were
uncommon but often preferred. The commercial varieties were often most preferred by
producers selling strictly to the conventional market.
3.4 What lessons can be drawn from this study?
This study shows the importance of facilitating farmers’ and breeders´ access to the
genetic resources of horticultural crops and the key role that accessible collections could
fill, such as those of CATIE and AVRDC. Tomato and sweet peppers, as well as other
important vegetable crops such as cucurbits, are not yet part of the list of crops covered
directly by the Multilateral System. This means that having access to improved varieties to
these crops is very hard for small-scale family farmers because of the bureaucracy, cost
and intellectual property rights involved.
Although the resources contained within genebank collections are important, without
proper access to particular information by farmers, breeders and agronomists, the material
cannot be used efficiently. In this study, for example, morphological data of genebank
accessions was used to select the varieties according to farmers’ preferences and their on-
farm potential was evaluated under different conditions. It is important that such
morphological characterization and evaluation data is made accessible by genebanks to
enhance its use by different actors.

62
On the basis of this study, we propose six measures to improve access to growers and
breeders once the crops are included in the MLS:
1. A clear documentation system with relevant information on agronomic and other
commercial properties of the crops covered by the MLS collection is made
available in accessible language and media
2. An online system to directly request seeds, which also includes contact information
for farmers in case of questions
3. Active assistance to farmers in negotiating an SMTA
4. Establishment of straightforward payment systems that cover the costs for
regeneration of the material by the genebank, which should remain economically
accessible to farmers and other breeders
5. Distribution of hardcopy catalogues that include the most promising materials and
contact information for farmers and relevant organizations
6. Increase in the number of on-farm participatory varietal-validation research projects
with farmers
When farmers have better access to information and seed material that is currently
available in genebanks, they can broaden the genetic base of their crops. Our research
shows that this is of interest to individual farmers and organizations who seek to diversify
their farms in response to climatic or economic shocks and to strengthen their management
of crop varieties by developing participatory evaluation and breeding programs.
3.5 Farmer-based experimentation
Farmers like Rosa are motivated to seek out new varieties and new markets to enhance
their adaptive capacity. However, many producers have lost essential knowledge about
ecosystem resilience and the way that diverse, traditional seed systems contribute to this
resilience. Therefore, knowledge sharing must also be enhanced in addition to improved
access to genebank material under multilateral seed systems if the material is going to be
used effectively.
However, bringing this genetic material to farms cannot depend solely on outside
intermediaries. Rather, we have seen that knowledge sharing works best when innovative
smallholder farmers like Rosa encourage other producers to seek out new material and
multiply and breed diverse varieties. Such horizontal learning and farmer-based
experimentation should be at the center of knowledge-sharing processes, in which other
parties (scientists, NGOs) can play a supportive role. This will contribute to the effective
use of genetic resources for more resilient and sustainable farming communities.

63
4. Appendix
Appendix 1. Fertilization guide for organic and conventional farmers
Guía de Fertilización Orgánica
Los elementos más importantes en la fertilización del tomate y chile son el nitrógeno,
fósforo, potasio, calcio, magnesio, boro y zinc.
Esquema General de fertilización
Epoca Nutriente Finalidad
Siembra nitrogeno,
fosforo, potasio Enraizar
Antes de floración hasta
cuajada (30-80 días
después de transplante)
Magnesio
Participa de manera directa en el proceso de la
fotosíntesis, balanceando eficientemente las
relaciones de bases y por ende una mejor síntesis de
proteínas.
floración al cuajado (50-
70 días después de
transplante)
Nitrato de Potasio
Interviene en la fotosíntesis, síntesis de clorofila;
como activador de las enzimas e interviene en el
balance hídrico de la planta.
floración al cuajado (50-
70 días después de
transplante)
Nitrato de Calcio Participa en la formación y el fortalecimiento de las
paredes y membranas celulares.
floración al cuajado (50-
70 días después de
transplante)
Boro Mejora la absorción y el transporte de azúcares.
floración al cuajado (50-
70 días después de
transplante)
Zinc Participa como activador enzimático y desempeña
un importante papel en la síntesis de las proteínas.
cuajado a cosecha (60-
120 días después del
transplante)
Nitrato de Calcio Participa en la formación y el fortalecimiento de las
paredes y membranas celulares.
cuajado a cosecha (60-
120 días después del
transplante)
Nitrato de Potasio
Interviene en la fotosíntesis, síntesis de clorofila;
como activador de las enzimas e interviene en el
balance hídrico de la planta.
Plan específico de fertilización orgánica para este proyecto
Epoca fecha Producto Orgánico
Siembra Roca fosforica y gallinaza
5-7 dais despues Sulfato de Potasio y Sulfato de
Magnesio
Durante todo el ciclo de vida
donde es necesario,
especialmente antes de floración
Calcio
Durante todo el ciclo de vida
donde es necesario,
especialmente antes de floración
Boro
Durante todo el ciclo de vida
donde es necesario,
especialmente antes de floración
Zinc
Durante todo el ciclo de vida Biofertilizantes y bioestimulantes
completos

64
Identificación de Deficiencias en tomate

65
Identificación de Deficiencias en chile

66
Guía de Fertilización Convencional
Los elementos más importantes en la fertilización del tomate y chile son el nitrógeno,
fósforo, potasio, calcio, magnesio, boro y zinc.
Esquema General de fertilización
Epoca Nutriente Finalidad
Siembra nitrogeno,
fosforo, potasio Enraizar
Antes de floración hasta
cuajada (30-80 días
después de transplante)
Magnesio
Participa de manera directa en el proceso de la
fotosíntesis, balanceando eficientemente las
relaciones de bases y por ende una mejor síntesis
de proteínas.
floración al cuajado (50-
70 días después de
transplante)
Nitrato de
Potasio
Interviene en la fotosíntesis, síntesis de clorofila;
como activador de las enzimas e interviene en el
balance hídrico de la planta.
floración al cuajado (50-
70 días después de
transplante)
Nitrato de Calcio
Participa en la formación y el fortalecimiento de
las
paredes y membranas celulares.
floración al cuajado (50-
70 días después de
transplante)
Boro Mejora la absorción y el transporte de azúcares.
floración al cuajado (50-
70 días después de
transplante)
Zinc
Participa como activador enzimático y
desempeña un importante papel en la síntesis de
las proteínas.
cuajado a cosecha (60-
120 días después del
transplante)
Nitrato de Calcio
Participa en la formación y el fortalecimiento de
las
paredes y membranas celulares.
cuajado a cosecha (60-
120 días después del
transplante)
Nitrato de
Potasio
Interviene en la fotosíntesis, síntesis de clorofila;
como activador de las enzimas e interviene en el
balance hídrico de la planta.
Plan específico de fertilización convencional para este proyecto
Época Fecha Producto Convencional
Siembra 10-30-10
15-22 días después del
transplante 18-5-15
10 días después Formula Multimineral y magnesio
si es necesario
15 días después Mezcla Física (Hidrocomplex) y
magnesio si es necesario
15 días después Kmag y magnesio si es necesario
Floración a cosecha
Rotación de Fertilizantes 18-5-15,
Formula Multimineral
Hidrocomplex y Kmag
Floración a cuajado
Nitrato de Potasio, Nitrato de
Calcio, Boro, Zinc, Magnesio

67
Identificación de Deficiencias en tomate

68
Identificación de Deficiencias en chile

69
Appendix 2. Calendar of conventional and organic inputs turned in to farmers
Producer
CONVENTIONAL
Date Carlos Enrique Benedicto Celso
April 23 2015 Agriful, Agriver,
Safsan
Agriful, Agriver,
Safsan
Agriful, Agriver,
Safsan
Agriful,
Agriver, Safsan
May 22 2015
Calcio, formula
multimineral, 18-
05-15,
Hidrocomplex,
Kmag, Confidor,
Carbendozim,
Silvacur,
mancozeb,
Curzate, Agry-
gent, Serenade,
Oxicloruro de
Cobre
Calcio, formula
multimineral, 18-
05-15,
Hidrocomplex,
Kmag, Confidor,
Carbendozim,
Silvacur,
mancozeb,
Curzate, Agry-
gent, Serenade,
Oxicloruro de
Cobre
Calcio, formula
multimineral,
18-05-15,
Hidrocomplex,
Kmag, Confidor,
Carbendozim,
Silvacur,
mancozeb,
Curzate, Agry-
gent, Serenade,
Oxicloruro de
Cobre
Calcio, formula
multicismineral,
18-05-15,
Hidrocomplex,
Kmag,
Confidor,
Carbendozim,
Silvacur,
mancozeb,
Curzate, Agry-
gent, Serenade,
Oxicloruro de
Cobre
June 1 2015 Ridomil
July 2 2015 Regent, Ridomil Ridomil
August 7 2015 Spintor
ORGANIC
Daniel Rosa Edgar Jorge
April 23 2015 Bokashi Bokashi Bokashi Bokashi
May 15 2015
Trichoderma 2
bolsas, chili
picante, Biofeed
Start 1 litro,
Biofeed Calidad
1 litro, Fructiplus
1 litro
Trichoderma 2
bolsas, chili
picante, Biofeed
Start 1 litro,
Biofeed Calidad 1
litro, Fructiplus 1
litro
Trichoderma 2
bolsas, chili
picante, Biofeed
Start 1 litro,
Biofeed Calidad
1 litro, Fructiplus
1 litro
Trichoderma 2
bolsas, chili
picante, Biofeed
Start 1 litro,
Biofeed Calidad
1 litro,
Fructiplus 1
litro
May 21 2015
Bacillus
Thurigencis,
plastico para
techo
Bacillus
Thurigencis,
plastico para
techo
Bacillus
Thurigencis,
plastico para
techo
Bacillus
Thurigencis,
Plastico para
techo
June 1 2015 Trichoderma 2
bolsas, gallinaza
Trichoderma 2
bolsas, gallinaza
Trichoderma 2
bolsas, gallinaza
Trichoderma 2
bolsas, gallinaza
June 12 2015 PSD, Sulfocalcio PSD, Sulfocalcio PSD, Sulfocalcio PSD,
Sulfocalcio
June 17 2015
Sulfato de
Magnesio,
Sulfato de
Potasio, Mezcla
zinc/boro, calcio
Sulfato de
Magnesio, Sulfato
de Potasio,
Mezcla zinc/boro,
calcio
Sulfato de
Magnesio,
Sulfato de
Potasio, Mezcla
zinc/boro, calcio
Sulfato de
Magnesio,
Sulfato de
Potasio, Mezcla
zinc/boro,
calcio

70
July 23 2015
BT, Bokashi,
Fertilizante
Organica,
trichoderma
BT, Bokashi,
Fertilizante
Organica,
trichoderma
BT, Bokashi,
Fertilizante
Organica,
trichoderma
BT, Bokashi,
Fertilizante
Organica,
trichoderma
August 7 2015 SulfoCalcio, PSD SulfoCalcio, PSD SulfoCalcio,
PSD
SulfoCalcio,
PSD
September 16
2015
SulfoCalcio,
PSD, chili
picante
SulfoCalcio, PSD,
chili picante
SulfoCalcio,
PSD, chili
picante
SulfoCalcio,
PSD, chile
picante
September 30
2015
Trichoderma,
Sulfocalcio, PSD
Trichoderma,
Sulfocalcio, PSD
Trichoderma,
Sulfocalcio, PSD
Trichoderma,
Sulfocalcio,
PSD
October 13
2015
Trichoderma,
Sulfocalcio, PSD
Trichoderma,
Sulfocalcio, PSD
Trichoderma,
Sulfocalcio, PSD
Trichoderma,
Sulfocalcio,
PSD
October 28
2015
Trichoderma,
Sulfocalcio, PSD
Trichoderma,
Sulfocalcio, PSD
Trichoderma,
Sulfocalcio, PSD
Trichoderma,
Sulfocalcio,
PSD

71
Appendix 3. Management guidelines for tomato and sweet pepper crops
Buenas Prácticas para el manejo de Chile y Tomate
Proyecto de siembra de tomate y chile dulce con CATIE
Indicaciones generales para prevenir plagas y enfermedades
- Se debe realizar un muestreo al menos 2 veces por semana para detectar plagas y
enfermedades siempre y cuando sea necesario. En los casos donde una plaga o
enfermedad tenga probabilidades de aparecer, según la historia de la finca es
probable que debamos implementar control preventivo. Cada caso va a ser
controlado por separado.
- Para llevar ese control es muy importante muestrear 2 veces por semana para ver la
posible presencia de plagas y enfermedades tanto en cultivos de interés como en los
cultivos y plantas alrededor de las parcelas del ensayo.
- El personal que elimine las plantas con síntomas de virosis, debe lavarse las manos
antes de realizar otra tarea para evitar posibles contagios.
- Si fuma cuando está en la finca, es muy importante que se lave las manos antes de
examinar las plantas.
- Evite provocar heridas y rasguños a las plantas y sus raíces.
- Si se va a usar control biológico, debe hacerlo 10 días antes o después de la
aplicación de cualquier producto químico.
- Control biológico y la aplicación de material orgánica generalmente está permitido
en agricultura orgánica hasta un cierto nivel. En este ensayo cada caso será
determinado por separado.
CHILE DULCE
Condiciones de los suelos:
- Para el cultivo del chile se recomiendan suelos livianos, de textura areno-arcillosos,
un buen drenaje y moderado contenido de materia orgánica.
- En el caso de suelos arcillosos deben tener buen drenaje y estar bien preparados
antes de la siembra para evitar acúmulos de agua que favorecen la incidencia de
enfermedades en la raíz.
Riego:
- Para obtener rendimientos elevados, se necesita un suministro adecuado de agua y
suelos relativamente húmedos durante todo el período vegetativo.
- Antes de la floración y al inicio de los primeros brotes florales de la plantación, el
cultivo es más sensible a la falta o exceso de agua. La deficiencia de agua en el
suelo reduce el crecimiento y desarrollo de la planta; en cambio el exceso reduce la
tasa de absorción.
Poda
- Algunos cultivos de chile dulce, casi no requieren poda, limitándose ésta a la
supresión de los brotes que nacen desde el nivel del suelo hasta la primera
bifurcación. El aclareo de frutos consiste en suprimir los que presentan algún
defecto que los inutiliza para la comercialización.
- Una poda muy poco utilizada pero de excelentes resultado en la producción de
mayor cantidad de frutos por planta consiste en eliminar la primera flor cuajada de
la planta. Esta práctica no solo estimula la floración sino que también el número y
el peso de los frutos por planta aumentan notoriamente.

72
Amarre:
- Durante la siembra y el amarre de las plantas, todas las herramientas deberán estar
desinfectadas para evitar la propagación de enfermedades.
- Se puede usar postes de bambú, madera u otro material, separados 2.5 a 3 metros
entre sí.
- El primer hilo de alambre se coloca entre 60 a 80 cm de altura y en él se amarra el
tallo principal de la planta; el segundo hilo está a una altura entre 1 y 1,20 m, y
sirve para amarrar todas las ramas y evitar que se quiebren.
TOMATE
Condiciones de los suelos:
- De preferencia suelos francos con buen contenido de materia orgánica pero produce
muy bien en suelos pesados hasta suelos arenosos con materia orgánica baja.
Riego:
- Existen diversos sistemas de riego (gravedad, aspersión y goteo) y su uso depende
de la disponibilidad de recursos, pendiente del terreno, textura de suelo,
abastecimiento y de agua. Con cualquiera de los sistemas seleccionados, se debe
evitar someter el cultivo a deficiencias o excesos de agua. Es importante la buena
distribución del riego durante todo el ciclo del cultivo, principalmente antes de la
formación de frutos.
- En cuanto al manejo del riego, es necesario considerar el desarrollo del cultivo, es
decir que el tiempo de riego diario dependerá del tamaño de la planta,
necesitándose regar muy poco tiempo recién trasplantado el cultivo e ir aumentando
el tiempo de riego según sea el crecimiento de la planta.
Amarre:
- Durante la siembra y amarre, todas las herramientas deberán estar desinfectadas
para evitar la propagación de enfermedades.
- El primer amarre se coloca a los quince días después del trasplante mientras que los
subsiguientes cada 10 días uno de otro hasta 10 diez días antes de cosecha.
- Los postes pueden ser de caña de bambú o del material que más se disponga en la
zona
- Las estacas se deben de colocar cada 1.0 metros (3.3’) a 1.2 metro (4’) de distancia
entre estacas siendo la distancia más corta donde tenemos plantas más grandes y
rendimientos más altos.
- La altura de la estaca depende de la variedad usada y van desde 1.2 mts (4’) a 2 mts
(6.5’)
- El amarre suele realizarse con hilo de polipropileno (rafia) sujeto de un extremo a
la zona basal de la planta (liado, anudado o sujeto mediante anillas) y de otro a un
alambre situado a determinada altura por encima de la planta (1,8-2,4 m sobre el
suelo). Conforme la planta va creciendo se va sujetando al hilo tutor mediante
anillos, hasta que la planta alcance el alambre.
Destallado:
- La poda inicial es efectuada cuando la planta tiene cerca de 40 cm de altura e inicia
la emisión de brotes laterales. En esta poda se seleccionan los mejores dos o tres
tallos de la planta y se elimina el resto, a la vez que se hace una deshoja para
eliminar las hojas enfermas que se encuentran en contacto con el suelo.
- Consiste en la eliminación de brotes axilares para mejorar el desarrollo del tallo
principal. Debe realizarse con la mayor frecuencia posible (semanalmente en

73
verano-otoño y cada 10-15 días en invierno) para evitar la pérdida de biomasa
fotosintéticamente activa y la realización de heridas. Los cortes deben ser limpios
para evitar la posible entrada de enfermedades. En épocas de riesgo es aconsejable
realizar un tratamiento fitosanitario con algún fungicida-bactericida cicatrizante,
como pueden ser los derivados del cobre.
Deshojado:
- Es recomendable tanto en las hojas más viejas, con objeto de facilitar la aireación y
mejorar el color de los frutos, como en hojas enfermas, que deben sacarse
inmediatamente eliminando así la fuente de inóculo.
Desbrote:
- El desbrote o deshija consiste en el corte sistemático y frecuente de los numerosos
brotes laterales que surgen en las axilas de las hojas, por debajo de la primera
horqueta.
- Tal operación se efectúa una o dos veces por semana, empujando y quebrando los
brotes, tan pronto alcancen un tamaño suficiente para ser agarrados. No es
conveniente el uso de instrumentos cortantes ni de las uñas, pues se propagan
enfermedades con mayor facilidad.

74
Appendix 4. Score sheet for farmer management aspects of interest
Evaluación de Manejo en los lotes del estudio
Nombre del productor ________________________Fecha de
evaluación________________
La clasificación se usa para describir la calidad de manejo que cada productor está dando al
lote del estudio. Se usa la siguiente clasificación:
1- Muy mal
3- Mal
5- Intermedio
7- Bueno
9- Muy Bueno
Manejo de malezas ( )
Calidad del techo ( )
Altura del lomillo ( )
Aplicación oportuna de los insumos entregados ( )
Manejo de plagas y enfermedades por su propia cuenta ( )
Deshijar ( )
Amarrar ( )
Quitar hojas y frutos enfermos de la planta ( )
Quitar partes enfermas de la planta del área del estudio ( )
Drenaje de aguas ( )
Cosecha oportuna de los frutos ( )
Observaciones o comentarios:

75
Appendix 5. Participatory evaluation of tomato and sweet pepper varieties
Clasificación de variedades de Chile
Los productores ordenar cada variedad entre menos deseables y más deseables. Para
empezar identificar la variedad más deseable y menos deseable para usar como referencias.
Tomar foto del orden de cada productor.
Clasificar cada variedad individualmente:
1=muy mal
3= mal
5= intermedio
7=bueno
9= muy bueno
Chile Clasificación
(1, 3, 5, 7, 9)
Características
mas preferidas
Carácterísticas
menos
preferidas
Sembrará
de nuevo?
(Si o No)
Por qué?
(Oportunidad
en el mercado,
auto-
consumo…)
18757
15661
17268
9777
17151
18660
19259
032170
1247
Natalie
4212
9814

76
Clasificar cada variedad individualmente por características preferidas:
1=muy mal
3= mal
5= intermedio
7= bueno
9= muy bueno
4. Clasificar cada variedad individualmente por incidencia de plagas y enfermedades:
1= Muy bajo
3= Bajo
5= Medio
7= Alto
9= Muy alto

77
Clasificación de variedades de Tomate
Los productores ordenar cada variedad entre menos deseables y más deseables. Para
empezar identificar la variedad más deseable y menos deseable para usar como referencias.
Tomar foto del orden de cada productor.
Clasificar cada variedad individualmente:
1=muy mal
3= mal
5= intermedio
7=bueno
9= muy bueno
Tomate Clasificación
(1, 3, 5, 7, 9)
Características
mas preferidas
Características
menos
preferidas
Sembrará
de
nuevo?
(Si o No)
Porque?
(Oportunidad
en el mercado,
auto-
consumo…)
5515
5640
10596
20485
20547
20553
17358
17330
1426
1424
JR

78
4. Clasificar cada variedad individualmente por características preferidas:
1=muy mal
3= mal
5= intermedio
7=bueno
9= muy bueno
5. Clasificar cada variedad individualmente entre 1-9 por incidencia de plagas y
enfermedades:
1= Muy bajo
3= Bajo
5= Intermedio
7= Alto
9= Muy alto

79
Appendix 6. Final farmer interview
Fecha_______________________
1. Datos personales
a. Nombre del productor _______________________________
b. Usted es parte de una asociación/grupo de productores?
c. Qué grupo?
d. Cómo funciona el grupo (ej: diferentes productores producen diferentes cultivos o
todos pueden producir lo que sea?)
e. Cuál es su papel en la finca?
f. Cuál es el cultivo principal de la finca?
g. Que porcentaje de tiempo usa usted trabajando en este cultivo por semana?
h. En caso que café no es cultivo principal; cual él es rol de café en la finca, y que
porcentaje de tiempo usa usted trabajando en café por semana?
i. Cuál es su fuente principal de ingresos?
j. Cuáles son sus mayores gastos?
k. Hay otras personas ayudando con mano de obra en la finca?
2. Información sobre la finca
a. Cuál es el tamaño de su finca?
b. Qué experiencia ha tenido usted con el manejo de hortalizas?
c. Por cuánto tiempo?
d. Qué retos tiene en la finca actualmente? (demasiada lluvia, menos lluvia, retos
económicos, acceso al mercado, rendimiento, alta o baja producción, problemas
con el suelo, etc.) Y cuales ha tenido en los últimos 5 años?
3. Diversificación general
a. Cuales son las razones principales para diversificar o no diversificar la finca, con
cultivos nuevos, además del café?
b. Que herramientas, como tecnologías, capacitaciones, talleres, etc) le ayudarían a
diversificar la finca con nuevos cultivos?
c. Que otros incentivos le ayudarían a diversificar la finca con nuevos cultivos?
d. Cree que participar en proyectos como esto de evaluación participativa de
diferentes cultivos y variedades le motiva a usted a diversificar con nuevos
cultivos? Porque?
4. Evaluación participativa de las hortalizas evaluadas
a. Porque decidió Usted participar en este proyecto?
b. Cuál es su interés en tomate y chile dulce? O porque estabas interesado en sembrar
tomate y chile?
c. Que son sus percepciones generales de las variedades evaluadas?
d. Su experiencia con este proyecto va a influenciar sus decisiones en el futuro de
diversificar o no diversificar la finca con nuevas variedades? Como?
e. Desea seguir cultivando alguna variedad evaluada el siguiente año? En caso que sí,
cual(es)?

80
5. Semillas
a. Como consigue Usted normalmente semillas de hortalizas?
b. Como cree usted que se podría mejorar la oferta de variedades en general? Como
en su comunidad o en Turrialba en general?
c. Qué opina usted del banco de semillas de CATIE para conseguir semillas?
6. Percepciones del proyecto
a. Cuales cosas le ha gustado y no le ha gustado de este proyecto? Porque?
b. Que beneficios obtuvo usted del proyecto?
c. Que costos incurrió usted para participar en este proyecto?
d. Los beneficios fueron más que los costos?
e. Usted participaría en otro proyecto similar?
f. Como se puede mejorar el proceso de este proyecto?
g. Usted tiene algunos comentarios finales sobre el proyecto?

81
Appendix 7. Correspondence analyses of relationships between tomato and sweet pepper
varieties and qualitative descriptors of importance
a. Tomato varieties and color of fruit pulp
b. Tomato varieties and fruit firmness

82
c. Sweet pepper varieties and color of mature fruit
d. Sweet pepper varieties and fruit form of mature fruit

83
Appendix 8. Correspondence analyses between tomato and sweet pepper groups and
qualitative traits of interest
a. Tomato groups and fruit pulp color
b. Tomato groups and fruit firmness

84
c. Pepper groups and fruit color:
d. Pepper groups and fruit form


