How Do You Tell a Blackbird from a Crow? - Thomas Bergthomasberg.org/papers/diffs-iccv13.pdf · How...
8
How Do You Tell a Blackbird from a Crow? Thomas Berg and Peter N. Belhumeur Columbia University {tberg,belhumeur}@cs.columbia.edu Abstract How do you tell a blackbird from a crow? There has been great progress toward automatic methods for visual recog- nition, including fine-grained visual categorization in which the classes to be distinguished are very similar. In a task such as bird species recognition, automatic recognition sys- tems can now exceed the performance of non-experts – most people are challenged to name a couple dozen bird species, let alone identify them. This leads us to the question, “Can a recognition system show humans what to look for when identifying classes (in this case birds)?” In the context of fine-grained visual categorization, we show that we can au- tomatically determine which classes are most visually sim- ilar, discover what visual features distinguish very similar classes, and illustrate the key features in a way meaning- ful to humans. Running these methods on a dataset of bird images, we can generate a visual field guide to birds which includes a tree of similarity that displays the similarity re- lations between all species, pages for each species showing the most similar other species, and pages for each pair of similar species illustrating their differences. 1. Introduction How do you tell a blackbird from a crow? To answer this question, we may consult a guidebook (e.g., [22, 23]). The best of these guides, products of great expertise and effort, include multiple drawings or paintings (in different poses and plumages) of each species, text descriptions of key features, and notes on behavior, range, and voice. From a computer vision standpoint, this is in the domain of fine-grained visual categorization, in which we must rec- ognize a set of similar classes and distinguish them from each other. To contrast this with general object recognition, we must distinguish blackbirds from crows rather than birds from bicycles. There is good, recent progress on this prob- lem, including work on bird species identification in partic- ular (e.g., [1, 29]). These methods learn classifiers which can (to some standard of accuracy) recognize bird species but do not explicitly tell us what to look for to recognize This work was supported by NSF award 1116631, ONR award N00014- 08-1-0638, and Gordon and Betty Moore Foundation grant 2987. Species similar to the Red-winged Blackbird (Agelaius phoeniceus) (a) (b) Distinguishing the Red-winged Blackbird from the American Crow (Corvus brachyrhynchos) The shape of the beak is di erent in the Red-winged Blackbird and the American Crow. The pattern around the wing is di erent in the Red-winged Blackbird and the American Crow. shiny cowbird bronzed cowbird brewer blackbird common raven American crow Figure 1. (a) For any bird species (here the red-winged blackbird, at center), we display the other species with most similar appear- ance. More similar species are shown with wider spokes. (b) For each similar species (here the American crow), we generate a “visual field guide” page highlighting differences between the species. 1
Transcript of How Do You Tell a Blackbird from a Crow? - Thomas Bergthomasberg.org/papers/diffs-iccv13.pdf · How...

How Do You Tell a Blackbird from a Crow?
Thomas Berg and Peter N. Belhumeur
Columbia University
{tberg,belhumeur}@cs.columbia.edu
Abstract
How do you tell a blackbird from a crow? There has been
great progress toward automatic methods for visual recog-
nition, including fine-grained visual categorization in which
the classes to be distinguished are very similar. In a task
such as bird species recognition, automatic recognition sys-
tems can now exceed the performance of non-experts – most
people are challenged to name a couple dozen bird species,
let alone identify them. This leads us to the question, “Can
a recognition system show humans what to look for when
identifying classes (in this case birds)?” In the context of
fine-grained visual categorization, we show that we can au-
tomatically determine which classes are most visually sim-
ilar, discover what visual features distinguish very similar
classes, and illustrate the key features in a way meaning-
ful to humans. Running these methods on a dataset of bird
images, we can generate a visual field guide to birds which
includes a tree of similarity that displays the similarity re-
lations between all species, pages for each species showing
the most similar other species, and pages for each pair of
similar species illustrating their differences.
1. IntroductionHow do you tell a blackbird from a crow? To answer
this question, we may consult a guidebook (e.g., [22, 23]).
The best of these guides, products of great expertise and
effort, include multiple drawings or paintings (in different
poses and plumages) of each species, text descriptions of
key features, and notes on behavior, range, and voice.
From a computer vision standpoint, this is in the domain
of fine-grained visual categorization, in which we must rec-
ognize a set of similar classes and distinguish them from
each other. To contrast this with general object recognition,
we must distinguish blackbirds from crows rather than birds
from bicycles. There is good, recent progress on this prob-
lem, including work on bird species identification in partic-
ular (e.g., [1, 29]). These methods learn classifiers which
can (to some standard of accuracy) recognize bird species
but do not explicitly tell us what to look for to recognize
This work was supported by NSF award 1116631, ONR award N00014-
08-1-0638, and Gordon and Betty Moore Foundation grant 2987.
Species similar to the Red-winged
Blackbird (Agelaius phoeniceus)
(a)
(b)
Distinguishing the Red-winged Blackbird from
the American Crow (Corvus brachyrhynchos)
The shape of the beak is di�erent in the Red-winged Blackbird and the American Crow.
The pattern around the wing is di�erent in the Red-winged Blackbird and the American Crow.
shiny cowbird
bronzed cowbird
brewer blackbirdcommon raven
American crow
Figure 1. (a) For any bird species (here the red-winged blackbird,
at center), we display the other species with most similar appear-
ance. More similar species are shown with wider spokes. (b)
For each similar species (here the American crow), we generate
a “visual field guide” page highlighting differences between the
species.
1

Bay breasted Warbler
Green Jay
Mourning Warbler
Baltimore OrioleHooded Oriole
Scott OrioleOrchard OrioleAmerican RedstartBlack throated Blue Warbler
Kentucky WarblerCanada Warbler
Yellow breasted Chat
Nashville Warbler
Common Yellowthroat
Magnolia Warbler
Orange crowned Warbler
Pine Warbler
Prairie Warbler
Yellow Warbler
Wilson W
arbler
Yellow throated Vireo
Prothonotary Warbler
Blue winged Warbler
Hooded Warbler
Cape May Warbler
American Goldfinch
Yellow headed Blackbird
Black capped V
ireo
Blue headed V
ireo
White eyed Vireo
Yellow bellied F
lycatcher
Acadian F
lycatcher
Least Flycatcher
Red eyed Vireo
Warbling Vireo
Tennessee Warbler
Palm W
arbler
Philadelphia Vireo
Yellow billed C
uckoo
Black billed C
uckoo
Mangrove C
uckoo
Gray K
ingbird
Tropical Kingbird
Scissor tailed Flycatcher
Loggerhead Shrike
Great G
rey Shrike
Tree SwallowFlorida Jay
Blue Jay
Clark Nutcracker
Red h
eaded W
oodpecke
r
Red b
ellie
d W
oodpecker
North
ern
Flicke
r
Rin
ged K
ingfis
her
Belte
d K
ingfis
her
Gre
en K
ingfis
her
Pie
d K
ingfis
her
White
bre
aste
d K
ingfis
her
Geococcyx
Bra
ndt C
orm
ora
nt
Pela
gic
Corm
ora
nt
Red faced C
orm
ora
nt
Pile
ate
d W
oodpecke
r
Hooded M
erg
anser
Red b
reast
ed M
erg
anse
r
Paci
fic L
oon
West
ern
Gre
be
Bro
wn P
elic
an
White
Pelic
an
Eare
d G
rebe
Horn
ed G
rebe
Malla
rdG
adw
all
Pig
eo
n G
uill
em
ot
Long
taile
d Ja
eger
Pom
arin
e Ja
eger
Fors
ters
Ter
n
Com
mon
Ter
n
Cas
pian
Ter
n
Artic
Tern
Ele
gant
Ter
n
Leas
t Ter
n
California Gull
Western GullHerring Gull
Glaucous winged Gull
Slaty backed Gull
Heermann G
ull
Laysan Albatro
ss
Northern
Fulm
ar
Ivory
Gull
Ring b
illed G
ull
Red legged K
ittiw
ake
Bla
ck T
ern
Frigate
bird
Bla
ck fo
oted
Alb
atro
ss
Sooty
Alb
atrossPie
d b
illed G
reb
ePara
keet A
ukle
t Cre
ste
d A
ukle
t
Rhin
oce
ros A
ukle
t
Horn
ed P
uffin
Least A
ukle
t
Anna H
um
min
gbird
Ruby th
roate
d H
um
min
gbird
Rufo
us H
um
min
gbird
Gre
en V
iole
tear
Red cockaded W
oodpecker
Am
erica
n T
hre
e to
ed W
oodpecke
r
Dow
ny Woodpecker
Fish Crow
American CrowCommon Raven
White necked Raven
Boat tailed Grackle
Cape Glossy StarlingBronzed Cowbird
Brewer BlackbirdShiny Cowbird
Red winged BlackbirdBobolinkGroove billed AniRusty Blackbird
Nighthawk
Whip poor Will
Chuck will WidowHorned Lark
Barn SwallowCliff Swallow
Cedar Waxwing
Bohemian Waxwing
Great Crested FlycatcherWestern Wood Pewee
Sayornis
Olive sided Flycatcher
Bank Swallow
MockingbirdGray Catbird
Cerulean Warbler
Winter Wren
Marsh WrenCarolina WrenBewick Wren
Cactus Wren
House Wren
Rock Wren
Brown Creeper
White
breasted N
uthatch
Weste
rn M
eadowlark
Swai
nson
War
bler
Worm
eatin
g Warb
ler
Northern
Wate
rthru
sh
Louisiana W
aterth
rush
Sag
e Thr
ashe
r
Brown
Thras
her
Am
erican
Pip
it
Ove
nbird
Bla
ck a
nd w
hite
War
bler
Nelso
n S
harp
taile
d S
parro
w
Seasid
e S
parro
wG
reen ta
iled To
whee
Gra
y c
row
ned R
osy F
inch
Bla
ck thro
ate
d S
parr
ow
Spotted C
atb
ird
Dark
eyed J
unco
Easte
rn T
ow
hee
Blu
e G
rosbeak
Indig
o B
untin
gLazuli
Bunting
Pain
ted B
unting
Eve
nin
g G
rosb
eak
Rose
bre
ast
ed G
rosb
eak
Euro
pean G
old
finch
Purp
le F
inch
Pin
e G
rosb
eak
Sca
rlet T
anag
er
Sum
mer
Tan
ager
Ver
milion
Fly
catc
her
Car
dina
l
Le C
onte
Sparro
w
Henslo
w S
parro
wVesper
Sparr
ow
Bair
d S
parr
ow
Cla
y c
olo
red S
pa
rrow
Bre
wer
Sparr
ow
Lin
coln
Sparro
w
Savann
ah S
parro
w
Song S
parro
w
Gra
sshopper S
parro
wF
ield
Sparro
w
White
thro
ate
d S
parro
w
White
cro
wned S
parro
wTre
e S
parro
wH
arris
Sparro
wF
ox S
parro
wH
ouse
Sparro
w
Chip
pin
g S
parro
w
Myrtle
Warb
ler
Golden w
inged Warbler
Chestn
ut sid
ed W
arb
ler
Brewer
Blackbird
Bronzed
Cowbird
Red-winged
Blackbird
Shiny
Cowbird
Canada
Warbler
Common
Yellowthroat
Kentucky
Warbler
Nashville
Warbler
Orange-
crowned
Warbler
American
crow
Common
Raven
Yellow-
breasted
Chat
Figure 2. A similarity tree of bird species, built from our visual similarity matrix using the neighbor-joining method of [20]. Species
visually similar to the red-winged blackbird (see Figure 1) are in blue, and those similar to the Kentucky warbler (see Figure 4) are in red.
bird species on our own.
In this paper, we consider the problem not of performing
fine-grained categorization by computer, but of using com-
puter vision techniques to show a human how to perform
the categorization. We do this by learning which classes
appear similar, discovering features that discriminate be-
tween similar classes, and illustrating these features with a
series of carefully chosen sample images annotated to indi-
cate the relevant features. We can assemble these visualiza-
tions into an automatically-generated digital field guide to
birds, showing which species are similar and what a birder
should look for to tell them apart. Example figures from a
page we have generated for such a guide are shown in Fig-
ure 1.
In addition to the visualizations in these figures, we bor-
row a technique from phylogenetics, the study of the evo-
lutionary relations between species, to generate a tree of
visual similarity. Arranged in a wheel, as shown in Fig-
ure 2, this tree is suitable as a browsing interface for the field
guide, allowing a user to quickly see each species and all
the species similar to it. We compare our similarity-based
tree with the phylogenetic “tree of life,” which describes the
evolutionary relations between bird species. Places where
the trees are not in agreement – pairs of species that are
close in the similarity tree but far in the evolutionary tree –
are of special interest, as these may be examples of conver-
gent evolution [11], where similar traits arise independently
in species that are not closely related.
We base our similarity calculations on the “part-based
one-vs-one features” (POOFs) of [1], for two reasons. First
is the POOFs’ strong performance on fine-grained catego-
rization; in particular they have done well on bird species
recognition. Second is their part-based nature. Fine-
grained classification encourages part-based approaches be-
cause the classes under consideration have many of the
same parts (for birds, every species has a beak, wings, legs,
and eyes) so it is possible to distinguish classes by the ap-
pearance of corresponding parts. Experiments by Tversky
and Hemenway [24] suggest that people also use proper-
ties of parts to distinguish similar classes, and bird guides
often describe species in terms of their parts, as shown in
Figure 3. All this suggests that part-based features may be
the best way to show humans the key features. POOFs have
the additional advantage of being easy to illustrate; each is
associated with a learned support region that can be high-
lighted in our visualizations.
This paper makes the following contributions:
1. We propose and explore a new problem: using com-
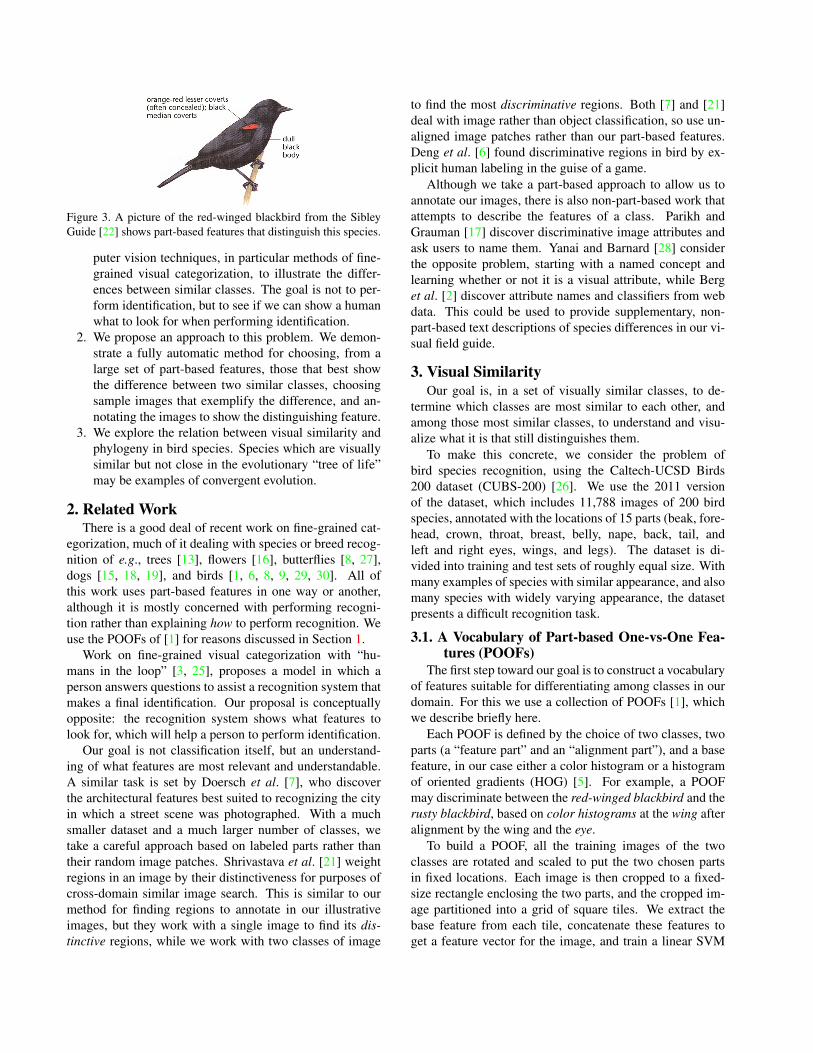
Figure 3. A picture of the red-winged blackbird from the Sibley
Guide [22] shows part-based features that distinguish this species.
puter vision techniques, in particular methods of fine-
grained visual categorization, to illustrate the differ-
ences between similar classes. The goal is not to per-
form identification, but to see if we can show a human
what to look for when performing identification.
2. We propose an approach to this problem. We demon-
strate a fully automatic method for choosing, from a
large set of part-based features, those that best show
the difference between two similar classes, choosing
sample images that exemplify the difference, and an-
notating the images to show the distinguishing feature.
3. We explore the relation between visual similarity and
phylogeny in bird species. Species which are visually
similar but not close in the evolutionary “tree of life”
may be examples of convergent evolution.
2. Related WorkThere is a good deal of recent work on fine-grained cat-
egorization, much of it dealing with species or breed recog-
nition of e.g., trees [13], flowers [16], butterflies [8, 27],
dogs [15, 18, 19], and birds [1, 6, 8, 9, 29, 30]. All of
this work uses part-based features in one way or another,
although it is mostly concerned with performing recogni-
tion rather than explaining how to perform recognition. We
use the POOFs of [1] for reasons discussed in Section 1.
Work on fine-grained visual categorization with “hu-
mans in the loop” [3, 25], proposes a model in which a
person answers questions to assist a recognition system that
makes a final identification. Our proposal is conceptually
opposite: the recognition system shows what features to
look for, which will help a person to perform identification.
Our goal is not classification itself, but an understand-
ing of what features are most relevant and understandable.
A similar task is set by Doersch et al. [7], who discover
the architectural features best suited to recognizing the city
in which a street scene was photographed. With a much
smaller dataset and a much larger number of classes, we
take a careful approach based on labeled parts rather than
their random image patches. Shrivastava et al. [21] weight
regions in an image by their distinctiveness for purposes of
cross-domain similar image search. This is similar to our
method for finding regions to annotate in our illustrative
images, but they work with a single image to find its dis-
tinctive regions, while we work with two classes of image
to find the most discriminative regions. Both [7] and [21]
deal with image rather than object classification, so use un-
aligned image patches rather than our part-based features.
Deng et al. [6] found discriminative regions in bird by ex-
plicit human labeling in the guise of a game.
Although we take a part-based approach to allow us to
annotate our images, there is also non-part-based work that
attempts to describe the features of a class. Parikh and
Grauman [17] discover discriminative image attributes and
ask users to name them. Yanai and Barnard [28] consider
the opposite problem, starting with a named concept and
learning whether or not it is a visual attribute, while Berg
et al. [2] discover attribute names and classifiers from web
data. This could be used to provide supplementary, non-
part-based text descriptions of species differences in our vi-
sual field guide.
3. Visual Similarity
Our goal is, in a set of visually similar classes, to de-
termine which classes are most similar to each other, and
among those most similar classes, to understand and visu-
alize what it is that still distinguishes them.
To make this concrete, we consider the problem of
bird species recognition, using the Caltech-UCSD Birds
200 dataset (CUBS-200) [26]. We use the 2011 version
of the dataset, which includes 11,788 images of 200 bird
species, annotated with the locations of 15 parts (beak, fore-
head, crown, throat, breast, belly, nape, back, tail, and
left and right eyes, wings, and legs). The dataset is di-
vided into training and test sets of roughly equal size. With
many examples of species with similar appearance, and also
many species with widely varying appearance, the dataset
presents a difficult recognition task.
3.1. A Vocabulary of Partbased OnevsOne Features (POOFs)
The first step toward our goal is to construct a vocabulary
of features suitable for differentiating among classes in our
domain. For this we use a collection of POOFs [1], which
we describe briefly here.
Each POOF is defined by the choice of two classes, two
parts (a “feature part” and an “alignment part”), and a base
feature, in our case either a color histogram or a histogram
of oriented gradients (HOG) [5]. For example, a POOF
may discriminate between the red-winged blackbird and the
rusty blackbird, based on color histograms at the wing after
alignment by the wing and the eye.
To build a POOF, all the training images of the two
classes are rotated and scaled to put the two chosen parts
in fixed locations. Each image is then cropped to a fixed-
size rectangle enclosing the two parts, and the cropped im-
age partitioned into a grid of square tiles. We extract the
base feature from each tile, concatenate these features to
get a feature vector for the image, and train a linear SVM

to distinguish the two classes. Tiles with low SVM weights
are discarded, and a connected component of the remaining
tiles about the feature part is taken as the support region for
the POOF. The SVM is retrained using the base feature on
just this region to get the final classifier. We use the parame-
ter settings from [1] unaltered: images are aligned to put the
two parts on a horizontal line with 64 pixels between them,
the crop is 128 pixels wide and 64 pixels tall, and we use
two grids, of 8 x 8 and 16 x 16 pixel tiles. The output of the
POOF is the signed distance from the decision boundary of
the classifier, and while each POOF is trained on just two
classes, [1] show that a collection of these POOF outputs
is an effective feature vector for distinguishing other sub-
classes of the same basic class (e.g., other species of birds).
With 200 classes, fifteen parts, and two base features, we
can train millions of POOFs, although in practice we will
always use a subset.
POOFs are suited to our task for two reasons. First of
all, they have been shown to be effective at fine-grained
categorization. Second, and of special importance to us,
POOFs are relatively easy to interpret. If we discover that
two bird species are well-separated by a color histogram-
based POOF aligned by the beak and the back, and the SVM
weights are large at the grid cells around the beak, we can
interpret this as “These two species are differentiated by the
color of the beak.” This kind of understanding is our goal.
3.2. Finding Similar Classes
Few would confuse a cardinal and a pelican. It would
be difficult and not useful to describe the particular features
that distinguish them; any feature you care to look at will
suffice. The interesting problem is to find what details dis-
tinguish classes of similar appearance. To do this we must
first determine which classes are similar to each other.
Our starting point is our vocabulary of POOFs. For ef-
ficiency we take a subset of 5000 POOFs, so each image
is describe by the 5000-dimensional vector of their outputs.
An L1 or L2 distance-based similarity in this space is ap-
pealing for its simplicity, but considers all features to be
equally important, which is unlikely to be a good idea. The
POOFs are based on random classes and parts. Some of
these choices will be good, looking at two species that differ
in a clear way at the parts being considered. Others will look
at parts that are not informative about those two classes. We
wish to downweight features that are not discriminative, and
emphasize those that are. A standard tool for this is linear
discriminant analysis (LDA) [10], which, from a labeled set
of samples with n classes, learns a projection to an n − 1dimensional space that minimizes the ratio of within-class
variance to between-class variance. We apply LDA, and use
the negative L1 distance in the resulting 199-dimensional
space as a similarity measure.
By applying this image similarity measure to mean fea-
ture vectors over all the images in a class, we obtain a sim-
ilarity measure between classes, with which we can deter-
mine the most similar class to any given class. The red-
winged blackbird and its five most similar species are shown
at the top of Figure 1.
3.3. Choosing Discriminative Features
Given a pair of very similar classes, we are now inter-
ested in discovering what features can be used to tell them
apart. We consider as candidates all the features from our
vocabulary that are based on this pair of classes. With the
birds dataset, with twelve parts and two low-level features,
there are 264 candidate features. We rank the features by
their discriminativeness, defining the discriminativeness of
feature f as
df =(µ2 − µ1)
2
σ1σ2
, (1)
where µ1 and µ2 are the mean feature values for the two
classes, and σ1 and σ2 are the corresponding standard devi-
ations. Maximizing discriminativeness is similar in spirit to
the optimization performed by LDA, which maximizes in-
terclass variation and minimizes intraclass variation. Here
we seek a individual score for each feature rather than a
projection of the feature space, as it allows us to report par-
ticular features as “most discriminative.”
3.4. Visualizing the Features
Once we have determined which features are most useful
to distinguish between a pair of classes, we would like to
present this information in a format that will help a viewer
understand what he should look for. We present each feature
as a pair of illustrative images, one from each species, with
the region of interest indicated in the two images.
The first step is to choose the illustrative images. In do-
ing this, we have several goals:
1. The images should exemplify the difference they are
intended to illustrate. If the feature is beak color,
where one class has a yellow beak and the other gray,
then the images must have the beak clearly visible,
with the beak distinctly yellow in one and gray in the
other.
2. The images should minimize differences other than
the one they are intended to illustrate. If the yel-
low and gray-beaked species above can both be either
brown or black, it is misleading to show one brown
and one black, as this difference does not distinguish
the classes.
3. To facilitate direct comparison of the feature, the two
samples should have their parts in similar configura-
tions, i.e., the birds should be in the same pose.
We translate these three goals directly into three objec-
tive expressions to be minimized. For the first, we take the
view that the images should be somewhat farther from the
decision boundary than average for their class, but not too

far. This corresponds to the feature being somewhat ex-
aggerated, but avoids extreme values from the POOF which
may be outliers or particularly unusual in some way. Taking
c1 and c2 as the classes associated with positive and nega-
tive feature values respectively, let b1 be the 75th percentile
of feature values on c1, and let b2 be the 25th percentile of
feature values on c2. We take these exaggerated, but not
extreme feature values as “best,” and attempt to minimize
F (I1, I2) = (1 + |f(I1)− b1|) (1 + |f(I2)− b2|) , (2)
where I1 and I2 are the candidate illustrative images from
classes c1 and c2, and f() is the feature to be illustrated.
To achieve the second goal, we consider an additional set
of features, based on POOFs trained on classes other than
c1 and c2. We use the 5000 POOFs used to determine in-
terclass similarity in Section 3.2, less those with the same
feature part as the POOF to be illustrated, and attempt to
minimize the L1 distance between the resulting “other fea-
ture” vectors g(I1) and g(I2).
G(I1, I2) = ||g(I1)− g(I2)||1 (3)
To achieve the third goal, we consider the part locations
in the two images. We resize the images so that in each,
the mean squared distance between parts is 1, then find the
best fit similarity transformation from the scaled locations
x1 in image I1 to the scaled locations x2 in image I2. We
minimize the squared error of the transformation, which we
denote H(I1, I2). Overall, we choose the image pair that
minimizes
kFF (I1, I2) + kGG(I1, I2) + kHH(I1, I2), (4)
where coefficients kF , kG, and kH determine the impor-
tance of each objective. To make them equally important,
we set each to the multiplicative inverse of the standard de-
viation of its term, i.e., kF = 1
σF, kG = 1
σG, and kH = 1
σH.
The second step in visualizing the features is annotating
the chosen images to indicate the feature in question. Recall
that the feature is the output of a POOF, which at its core is
a vector of weights to be applied to a base feature extracted
over a spatial grid. By taking the norm of the sub-vector of
weights corresponding to each grid cell, we obtain a mea-
sure of the importance of each cell. An ellipse fit to the grid
cells with weight above a small threshold then illustrates the
feature.
4. A Visual Field Guide to Birds
As a direct application of the techniques in Section 3, we
can construct a visual field guide to birds. While this guide
will not have the notes on habitat and behavior of a tradi-
tional guide, it will have a couple advantages. First, it is
automatically generated, and so could easily be built for an-
other domain where guides may not be available. Second,
it can be in some sense more comprehensive. While a tra-
ditional, hand-assembled guide will have an entry for each
mill
ion
s o
f ye
ars
of
co
mm
on
evo
lutio
n
0
10
20
30
40
50
60
70
80
90
100
(a) (b)Figure 6. Similarity matrices. (a) Visual similarity. (b) Phyloge-
netic similarity. In both, rows/columns are in order of a depth-
first traversal of the evolutionary tree, ensuring a clear structure in
(b). The large dashed black box corresponds to the passerine birds
(“perching birds,” mostly songbirds), while the small solid black
box holds similarities between crows and ravens on the y-axis and
blackbirds and cowbirds on the x-axis.
species, it is not combinatorially feasible to produce an en-
try on the differences between every pair of species. For an
automatically-generated, digital guide, this is not an issue.
We envision our field guide with a main entry for each
species. Examples are shown in Figures 1 (a) and 4 (a). The
main entry shows the species in question, and the top k most
similar other species (we use k = 5) as determined by the
method of Section 3.2. Selecting one of the similar species
will lead to a pair entry illustrating the differences between
the two species as described in Sections 3.3 and 3.4. Fig-
ures 1 (b) and 4 (b) and (c) show examples of pair entries.
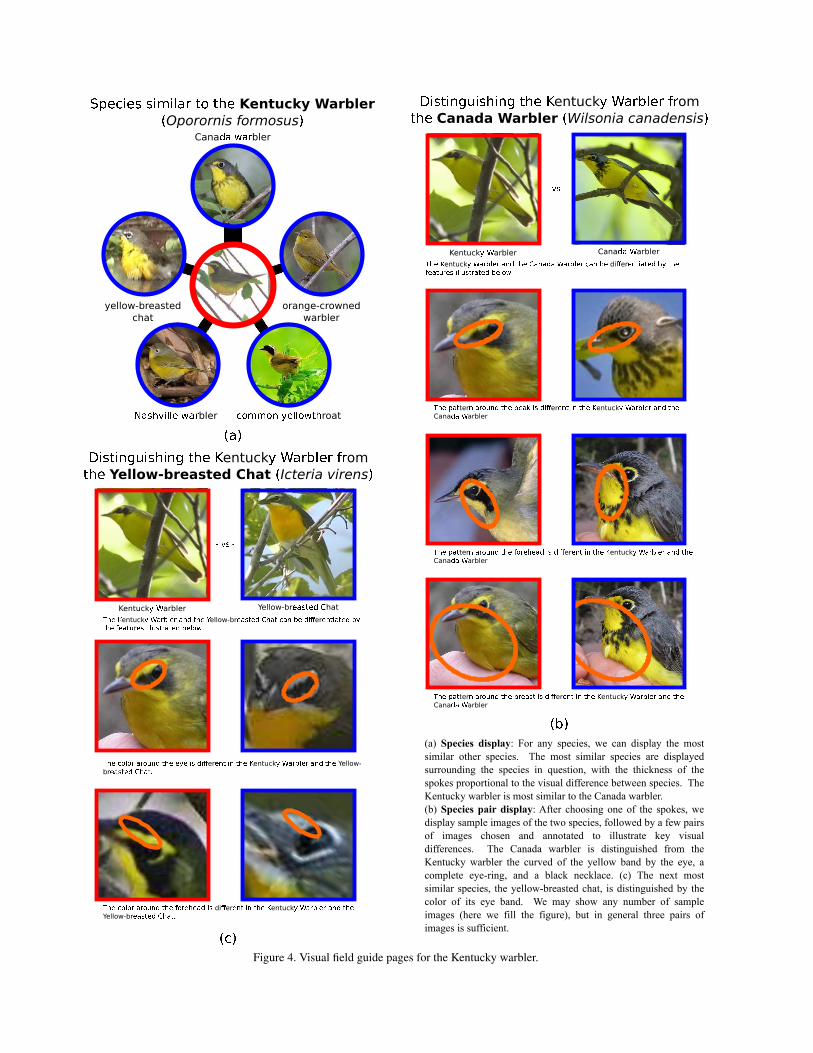
We find that many of the highlighted features, including the
dark auriculars (feather below and behind the eye) of the
Kentucky warbler, the black “necklace” of the Canada war-
bler, and the white “spectacles” of the yellow-breasted chat
(all shown in Figure 4), correspond to features mentioned
in bird guides (all included in the Sibley Guide [22]).
4.1. A Tree of Visual Similarity
Visual similarity as estimated from the POOFs is the ba-
sis for our visual field guide. In similarity estimation, unlike
straight classification, there is no obvious ground truth. If
we say a blackbird is more like a crow than like a raven,
who can say we are wrong? One way to get a ground truth
for similarity is to consider the evolutionary “tree of life,”
the tree with a root representing the origin of life, a leaf for
every extant species or evolutionary dead end, and a branch
for every speciation event, with edge lengths representing
time between speciations. Species close to each other in the
tree of life are in a sense “more similar” than species that
are not close, although this will not necessarily correspond
to visual similarity.
The scientific community has not reached consensus on
the complete structure of the tree of life, or even the sub-
tree containing just the birds in CUBS-200. However there
is progress in that direction. Recently Jetz et al. [12] pro-
posed the first complete tree of life for all 9993 extant bird
Kentucky Warbler
Oporornis formosus
entuck om
Canada Warbler Wilsonia canadensis
Kentucky �arbler Canad� �arbler
- �� -
T�� �entuck� a��� a � ��� ea a�a a��� �a �� di�er� ��a��� �� ���
f�a���� ������a��� ���t�.
T�� �a�ter at� � ��� ��ah �� ���er� � � ��� �entuck� a��� a � ���
Cana�a arbler.
T�� �a�ter at� � ��� ��a�� �� ���er� � � ��� �entuck� a��� a � ���
Cana�a arbler.
T�� �a�ter at� � ��� ft���a� �� ���er� � � ��� �entuck� a��� a � ���
Cana�a arbler.
(a) Species display: For any species, we can display the most
similar other species. The most similar species are displayed
surrounding the species in question, with the thickness of the
spokes proportional to the visual difference between species. The
Kentucky warbler is most similar to the Canada warbler.
(b) Species pair display: After choosing one of the spokes, we
display sample images of the two species, followed by a few pairs
of images chosen and annotated to illustrate key visual
differences. The Canada warbler is distinguished from the
Kentucky warbler the curved of the yellow band by the eye, a
complete eye-ring, and a black necklace. (c) The next most
similar species, the yellow-breasted chat, is distinguished by the
color of its eye band. We may show any number of sample
images (here we fill the figure), but in general three pairs of
images is sufficient.
entuck om
Yellow-breasted Chat Icteria virens
T�� �entuck� a��� a � ��� �ellow-br�a���� e�a� �a �� ���er� ��a��� ��
��� f�a��r�� ������a��� ���t�.
Kentucky �arbler Yellow-br�����d �hat
T�� �t�t at� � ��� ��� �� ���er� � � ��� �entuck� a��� a � ��� Yellow-
br�a���� e�a�.
T�� �t�t at� � ��� ft���a� �� di�er� � � ��� �entuck� a��� a � ���
Yellow-br�a���� e�a�.
- �� -
Cana bler
yellow-breasted
chat
bler roat
orange-crowned
warbler
Figure 4. Visual field guide pages for the Kentucky warbler.
Gadw
all
Malla
rd
Hooded M
erg
anser
Red b
reaste
d M
erg
anser
Bro
wn P
elic
an
White
Pelic
an
Pacific
Loon
North
ern
Fulm
ar
Sooty
Alb
atro
ss
Bla
ck fo
ote
d A
lba
tross
Laysan A
lbatro
ss
Frig
ate
bird
Bra
ndt C
orm
ora
nt
Pela
gic
Corm
ora
nt
Red faced C
orm
ora
nt
Pie
d b
illed G
rebe
Weste
rn G
rebe
Eare
d G
rebe
Horn
ed G
rebe
Long taile
d J
aeger
Pom
arine J
aeger
Pig
eon G
uill
em
ot
Horn
ed P
uffin
Rhin
ocero
s A
ukle
t
Cre
sted A
ukl
et
Least
Aukl
et
Para
keet A
ukl
et
Least
Tern
Casp
ian T
ern
Bla
ck T
ern
Fors
ters
Tern
Ele
gant
Ter
n
Artic
Ter
n
Com
mon
Ter
n
Ivor
y G
ull
Red
legg
ed K
ittiw
ake
Hee
rman
n G
ull
Rin
g bi
lled
Gul
l
Wes
tern
Gul
l
Her
ring
Gul
l
Californ
ia G
ull
Gla
ucous
winged G
ull
Slaty back
ed Gull
Geococc
yx
Groove bille
d Ani
Black billed C
uckoo
Mangrove Cuckoo
Yellow bille
d Cuckoo
Green Violetear
Ruby throated Hummingbird
Anna Hummingbird
Rufous HummingbirdNighthawkChuck will W
idowWhip poor Will
White breasted KingfisherBelted KingfisherRinged KingfisherGreen KingfisherPied KingfisherNorthern Flicker
Pileated WoodpeckerRed bellied Woodpecker
Red headed Woodpecker
American Three toed Woodpecker
Downy Woodpecker
Red cockaded Woodpecker
Great Crested Flycatcher
Scissor tailed Flycatcher
Gray Kingbird
Tropical Kingbird
Vermilion Flycatcher
Sayornis
Olive sided Flycatcher
Western Wood Pewee
Acadian Flycatcher
Least Flycatcher
Yellow bellied Flycatcher
Spotted Catbird
Red eyed Vireo
Philadelphia Vireo
Warbling Vireo
Black capped Vireo
White eyed Vireo
Blue headed Vireo
Yellow throated Vireo
Great G
rey Shrike
Loggerhead Shrike
Green Jay
Blue Jay
Florida Jay
Clark N
utcracker
Fish C
row
Am
erican Crow
Com
mon R
aven
White necked R
aven
Horn
ed L
ark
Bank S
wallo
w
Tre
e S
wallo
w
Barn
Sw
allo
wC
liff Sw
allo
w
Bohem
ian W
axw
ing
Cedar W
axw
ing
Cape G
lossy S
tarlin
gG
ray C
atb
irdB
row
n T
hra
sher
Mockin
gbird
Sage T
hra
sher
White
bre
aste
d N
uth
atc
hB
row
n C
reeper
Rock W
ren
Cactu
s W
ren
Bew
ick W
ren
Caro
lina W
ren
Mars
h W
ren
House W
ren
Win
ter
Wre
nA
meri
can P
ipit
House S
parr
ow
Evenin
g G
rosbeak
Am
erican G
old
finch
Euro
pean G
old
finch
Pin
e G
rosbeak
Gra
y c
row
ned R
osy F
inch
Purp
le F
inch
Rose b
reaste
d G
rosbeak
Card
inal
Sca
rlet Ta
nager
Sum
mer Ta
nager
Indig
o B
untin
g
Pain
ted B
untin
g
Blu
e G
rosb
eak
Lazu
li B
untin
g
Western Meadowlark
Bobolink
Yellow headed BlackbirdBaltimore OrioleScott OrioleHooded OrioleOrchard OrioleBoat tailed GrackleBrewer BlackbirdRusty BlackbirdRed winged Blackbird
Bronzed CowbirdShiny Cowbird
Grasshopper Sparrow
Black throated Sparrow
Brewer Sparrow
Field Sparrow
Chipping Sparrow
Clay colored Sparrow
Fox Sparrow
Tree Sparrow
Dark eyed Junco
White crowned Sparrow
Harris Sparrow
White throated Sparrow
Eastern Towhee
Green tailed Tow
hee
Vesper Sparrow
Le Conte S
parrow
Nelson S
harp tailed Sparrow
Seaside S
parrow
Savannah S
parrow
Baird S
parrow
Henslow
Sparrow
Lincoln Sparrow
Song S
parro
w
Yello
w b
reast
ed C
hat
Ove
nbird
Wor
m e
atin
g W
arbl
er
Pro
thon
otar
y W
arbl
er
Sw
ains
on W
arbl
er
Bla
ck a
nd w
hite
War
bler
Loui
sian
a W
ater
thru
sh
Nor
ther
n W
ater
thru
sh
Com
mon
Yel
lowth
roat
Kentu
cky
War
bler
Mourn
ing W
arble
r
Blue w
inged W
arble
r
Golden win
ged Warb
ler
Tenness
ee Warb
ler
Nashville W
arbler
Orange crowned Warbler
Canada Warbler
Wilson Warbler
Hooded Warbler
Magnolia Warbler
Cerulean Warbler
Cape May Warbler
Bay breasted Warbler
Chestnut sided Warbler
Yellow Warbler
American Redstart
Black throated Blue Warbler
Prairie Warbler
Palm Warbler
Myrtle Warbler
Pine Warbler
B�ewer
B���� !�d
B�onzed
Cowbird
Red-winged
B���� !�d
Shiny
Cowbird
Common
Yellowthroat
Kentucky
Warbler
Nashville
Warbler
Orange-
crowned
Warbler
American
crow
Common
Raven
Yellow-
breasted
Chat
Canada
Warbler
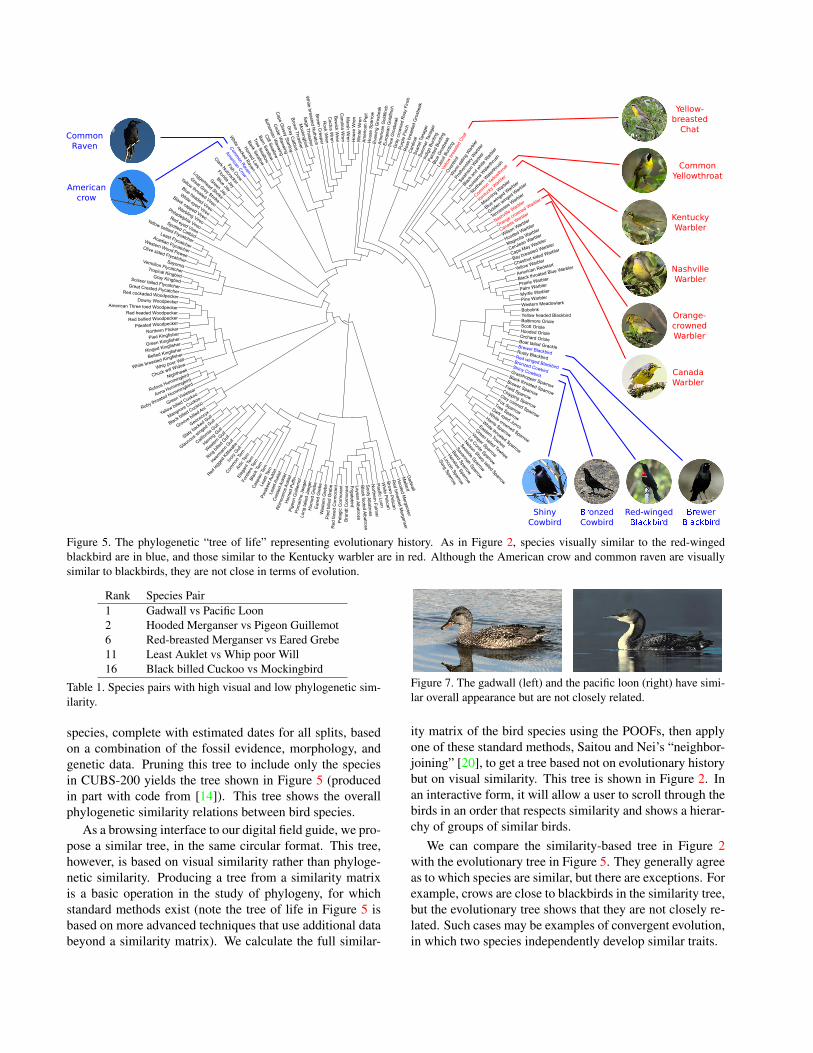
Figure 5. The phylogenetic “tree of life” representing evolutionary history. As in Figure 2, species visually similar to the red-winged
blackbird are in blue, and those similar to the Kentucky warbler are in red. Although the American crow and common raven are visually
similar to blackbirds, they are not close in terms of evolution.
Rank Species Pair
1 Gadwall vs Pacific Loon
2 Hooded Merganser vs Pigeon Guillemot
6 Red-breasted Merganser vs Eared Grebe
11 Least Auklet vs Whip poor Will
16 Black billed Cuckoo vs Mockingbird
Table 1. Species pairs with high visual and low phylogenetic sim-
ilarity.
species, complete with estimated dates for all splits, based
on a combination of the fossil evidence, morphology, and
genetic data. Pruning this tree to include only the species
in CUBS-200 yields the tree shown in Figure 5 (produced
in part with code from [14]). This tree shows the overall
phylogenetic similarity relations between bird species.
As a browsing interface to our digital field guide, we pro-
pose a similar tree, in the same circular format. This tree,
however, is based on visual similarity rather than phyloge-
netic similarity. Producing a tree from a similarity matrix
is a basic operation in the study of phylogeny, for which
standard methods exist (note the tree of life in Figure 5 is
based on more advanced techniques that use additional data
beyond a similarity matrix). We calculate the full similar-
Figure 7. The gadwall (left) and the pacific loon (right) have simi-
lar overall appearance but are not closely related.
ity matrix of the bird species using the POOFs, then apply
one of these standard methods, Saitou and Nei’s “neighbor-
joining” [20], to get a tree based not on evolutionary history
but on visual similarity. This tree is shown in Figure 2. In
an interactive form, it will allow a user to scroll through the
birds in an order that respects similarity and shows a hierar-
chy of groups of similar birds.
We can compare the similarity-based tree in Figure 2
with the evolutionary tree in Figure 5. They generally agree
as to which species are similar, but there are exceptions. For
example, crows are close to blackbirds in the similarity tree,
but the evolutionary tree shows that they are not closely re-
lated. Such cases may be examples of convergent evolution,
in which two species independently develop similar traits.

We can find such species pairs, with high visual simi-
larity and low phylogenetic similarity, in a systematic way.
The phylogenetic similarity between two species can be
quantified as the length of shared evolutionary history, i.e.,
the path length, in years, from the root of the evolution-
ary tree to the species’ most recent common ancestor (tech-
niques such as the neighbor-joining algorithm [20] also use
this as a similarity measure). Figure 6 (a) shows a similar-
ity matrix calculated in this way for the 200 bird species,
with the corresponding matrix based on visual similarity as
Figure 6 (b). Potential examples of convergent evolution
correspond to high values in (a) and relatively low values in
(b). The blackbirds-crows region is marked as an example.
We rank all(
200
2
)
species pairs by visual similarity (most
similar first) and by phylogenetic difference (least similar
first). We then list all species pairs in order of the sum of
these ranks.Table 1 shows the top five pairs, excluding pairs
where one of the species has already appeared on the list to
avoid excessive repetition (as the pacific loon scores highly
when paired with the gadwall, it will also score highly with
all near relatives of the gadwall). The top ranked pair is a
duck and a loon, two species the author had mistakenly as-
sumed were closely related based on their visual similarity.
Figure 7 shows samples of these two species. Space pre-
cludes including images of the other pairs in Table 1, but
images can be viewed on Cornell’s All About Birds site [4].
5. ConclusionsRecognition techniques, in particular methods of esti-
mating visual similarity, can be used for more than just iden-
tification and image search. Here we exploit a setting in
which computers can do better than typical humans – fine-
grained categorization in a specialized domain – to show
how progress in computer vision can be turned to helping
humans understand the relations between the categories.
References[1] T. Berg and P. N. Belhumeur. POOF: Part-based One-vs-One
Features for fine-grained categorization, face verification, andattribute estimation. In Proc. CVPR, 2013. 1, 2, 3, 4
[2] T. L. Berg, A. C. Berg, and J. Shih. Automatic attribute dis-covery and characterization from noisy web data. In Proc.ECCV, 2010. 3
[3] S. Branson, C. Wah, B. Babenko, F. Schroff, P. Welinder,P. Perona, and S. Belongie. Visual recognition with humansin the loop. In Proc. ECCV, 2010. 3
[4] Cornell Lab of Ornithhology. allaboutbirds.org, 2011. 8
[5] N. Dalal and B. Triggs. Histograms of oriented gradients forhuman detection. In Proc. CVPR, 2005. 3
[6] J. Deng, J. Krause, and L. Fei-Fei. Fine-grained crowdsourc-ing for fine-grained recognition. In Proc. CVPR, 2013. 3
[7] C. Doersch, S. Singh, A. Gupta, J. Sivic, and A. A. Efros.What makes paris look like paris? ACM Trans. Graphics,31(4), 2012. 3
[8] K. Duan, D. Parikh, D. Crandall, and K. Grauman. Discover-ing localized attributes for fine-grained recognition. In Proc.CVPR, 2012. 3
[9] R. Farrell, O. Oza, N. Zhang, V. I. Morariu, T. Darrell, andL. S. Davis. Birdlets: Subordinate categorization using volu-metric primitives and pose-normalized appearance. In Proc.ICCV, 2011. 3
[10] R. A. Fisher. The use of multiple measurements in taxonomicproblems. Ann. Eugenics, 7(2), 1936. 4
[11] D. J. Futuyma. Evolutionary Biology, page 763. SinauerAssociates, 1997. 2
[12] W. Jetz, G. H. Thomas, J. B. Joy, K. Hartmann, and A. O.Mooers. The global diversity of birds in space and time.Nature, 491(7424), 2012. 5
[13] N. Kumar, P. N. Belhumeur, A. Biswas, D. W. Jacobs, W. J.Kress, I. Lopez, and J. V. B. Soares. Leafsnap: A computervision system for automatic plant species identification. InProc. ECCV, 2012. 3
[14] I. Letunic and P. Bork. Interactive tree of life (itol): An onlinetool for phylogenetic tree display and annotation. Bioinfor-matics, 23(1), 2007. 7
[15] J. Liu, A. Kanazawa, D. Jacobs, and P. Belhumeur. Dog breedclassification using part localization. In ECCV, 2012. 3
[16] M.-E. Nilsback and A. Zisserman. Automated flower clas-sification over a large number of classes. In Indian Conf.Computer Vision Graphics and Image Processing, 2008. 3
[17] D. Parikh and K. Grauman. Interactively building a discrim-inative vocabulary of nameable attributes. In Proc. CVPR,2011. 3
[18] O. M. Parkhi, A. Vedaldi, A. Zisserman, and C. V. Jawahar.Cats and dogs. In Proc. CVPR, 2012. 3
[19] P. Prasong and K. Chamnongthai. Face-Recognition-Baseddog-Breed classification using size and position of each lo-cal part, and pca. In Proc. Int. Conf. Electrical Engineer-ing/Electronics, Computer, Telecommunications and Infor-mation Technology, 2012. 3
[20] N. Saitou and M. Nei. The neighbor-joining method: A newmethod for reconstructing phylogenetic trees. Molecular Bi-ology and Evolution, 4(4), 1987. 2, 7, 8
[21] A. Shrivastava, T. Malisiewicz, A. Gupta, and A. A. Efros.Data-driven visual similarity for cross-domain image match-ing. ACM Trans. Graphics, 30(6), 2011. 3
[22] D. A. Sibley. The Sibley Guide to Birds. Knopf, 2000. 1, 3, 5
[23] L. Svensson, K. Mullarney, and D. Zetterstrom. Collins BirdGuide. Collins, 2011. 1
[24] B. Tversky and K. Hemenway. Objects, parts, and categories.J. Experimental Psychology: General, 113(2), 1984. 2
[25] C. Wah, S. Branson, P. Perona, and S. Belongie. Multiclassrecognition and part localization with humans in the loop. InProc. ICCV, 2011. 3
[26] C. Wah, S. Branson, P. Welinder, P. Perona, and S. Belongie.The Caltech-UCSD Birds-200-2011 Dataset. Technical Re-port CNS-TR-2011-001, California Institute of Technology,2011. 3
[27] J. Wang, K. Markert, and M. Everingham. Learning modelsfor object recognition from natural language descriptions. InProc. British Machine Vision Conf., 2009. 3
[28] K. Yanai and K. Barnard. Image region entropy: A measureof “visualness” of web images associated with one concept.In ACM Int. Conf. Multimedia, 2005. 3
[29] B. Yao, G. Bradski, and L. Fei-Fei. A codebook-free andannotation-free approach for fine-grained image categoriza-tion. In Proc. CVPR, 2012. 1, 3
[30] N. Zhang, R. Farrell, and T. Darrell. Pose pooling kernels forsub-category recognition. In Proc. CVPR, 2012. 3
![How Do You Tell a Blackbird from a Crow?...Figure 3. A picture of the red-winged blackbird from the Sibley Guide [22] shows part-based features that distinguish this species. puter](https://static.fdocuments.net/doc/165x107/613e497459df642846166ea6/how-do-you-tell-a-blackbird-from-a-crow-figure-3-a-picture-of-the-red-winged.jpg)

![How Do You Tell a Blackbird from a Crow?openaccess.thecvf.com/content_iccv_2013/papers/... · Figure 3. A picture of the red-winged blackbird from the Sibley Guide [22] shows part-based](https://static.fdocuments.net/doc/165x107/5ec51c6d09545453c279dc85/how-do-you-tell-a-blackbird-from-a-crow-figure-3-a-picture-of-the-red-winged-blackbird.jpg)