How Do the Japanese and the Mongolians View Each Other?
27
(Ritsumeikan University, Kyoto, Japan) HOW DO THE JAPANESE AND THE MONGOLIANS VIEW EACH OTHER? A Discussion from the Analyses of Nationwide Survey Data Kunio Minato
-
Upload
kunio-minato -
Category
Presentations & Public Speaking
-
view
140 -
download
0
Transcript of How Do the Japanese and the Mongolians View Each Other?

(Ritsumeikan
University, Kyoto,
Japan)
HOW DO THE JAPANESE ANDTHE MONGOLIANS VIEW EACH OTHER?
A Discussion from the Analyses of Nationwide Survey Data
Kunio Minato
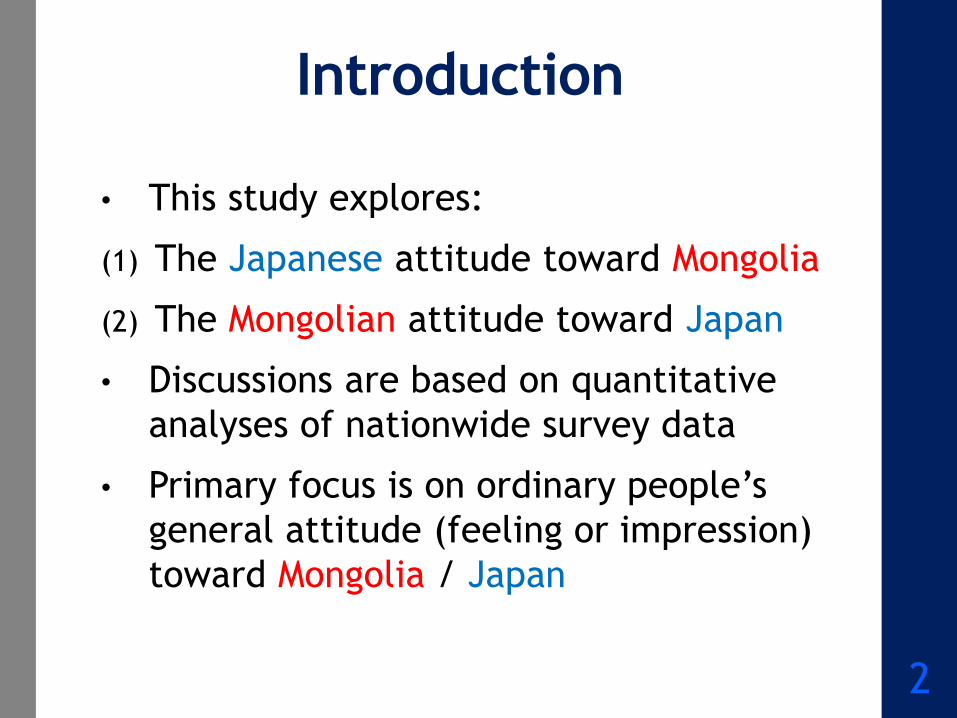
Introduction
• This study explores:
(1) The Japanese attitude toward Mongolia
(2) The Mongolian attitude toward Japan
• Discussions are based on quantitative
analyses of nationwide survey data
• Primary focus is on ordinary people’s
general attitude (feeling or impression)
toward Mongolia / Japan
2

Issues to Be Examined
• [Japanese] What the attitude toward
Mongolia is like?
• [Mongolians] Does “legacy” of former
rivalry remain in the attitude toward
Japan?
• Is the attitude more / less favorable,
compared with that toward other
countries (esp. East and Southeast Asian
countries)?
• What are factors affecting the attitude?
3

Data to Be Analyzed
• [Japanese Mongolia] JGSS-2006 data
(2006 data of the Japanese General Social
Surveys)
• [Mongolians Japan] ABS2 data (the
Second Wave of the Asian Barometer
Survey); The Third Wave Data of ABS
(ABS3) is also used for additional analysis
• All the three data were collected with
nationwide coverage through multi-stage
random sampling
4

The Japanese Attitude toward Mongolia 5

Question in Focus (JGSS-2006)
6
More favorable Less favorable
A South Korea +3 +2 +1 0 -1 -2 -3B North Korea +3 +2 +1 0 -1 -2 -3C China +3 +2 +1 0 -1 -2 -3D Mongolia +3 +2 +1 0 -1 -2 -3E Taiwan +3 +2 +1 0 -1 -2 -3
F The Philippines +3 +2 +1 0 -1 -2 -3G Thailand +3 +2 +1 0 -1 -2 -3H Indonesia +3 +2 +1 0 -1 -2 -3I India +3 +2 +1 0 -1 -2 -3J Russia +3 +2 +1 0 -1 -2 -3K USA +3 +2 +1 0 -1 -2 -3
Self-administered questionnaire A, Q22 How do you feel
about the following countries and regions? For each country
and region, please choose one of the numbers. If you don’t
have any specific feeling to a country or region, choose "0".

Distribution of Answers
7
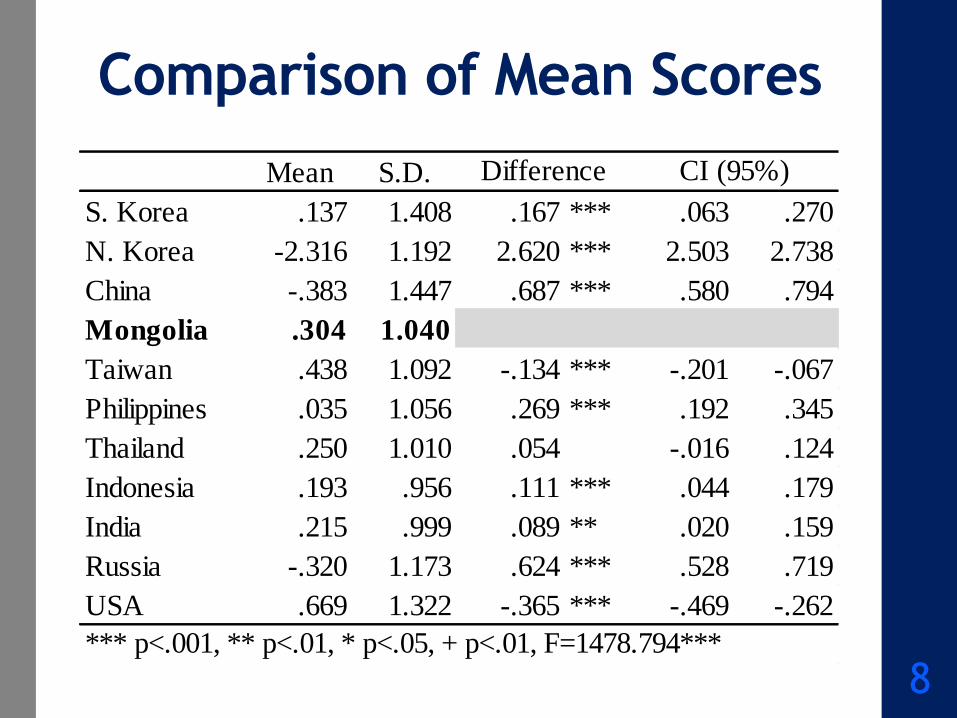
Comparison of Mean Scores
8
Mean S.D.
S. Korea .137 1.408 .167 *** .063 .270
N. Korea -2.316 1.192 2.620 *** 2.503 2.738
China -.383 1.447 .687 *** .580 .794
Mongolia .304 1.040
Taiwan .438 1.092 -.134 *** -.201 -.067
Philippines .035 1.056 .269 *** .192 .345
Thailand .250 1.010 .054 -.016 .124
Indonesia .193 .956 .111 *** .044 .179
India .215 .999 .089 ** .020 .159
Russia -.320 1.173 .624 *** .528 .719
USA .669 1.322 -.365 *** -.469 -.262
CI (95%)Difference
*** p<.001, ** p<.01, * p<.05, + p<.01, F=1478.794***

Regression Analysis
9
B S.E. β B S.E. β B S.E. β
Intercept -.672 ** .214 -.808 * .320 -.264 .303
Gender .162 ** .051 .078
Age -.004 + .002 -.058 -.004 .003 -.054 -.005 + .003 -.086
Area block: Hokkaido .076 .127 .015 .046 .197 .009 .106 .165 .024
Tohoku .139 .111 .034 .277 .170 .063 .026 .147 .007
Kanto .275 *** .080 .122 .205 + .120 .088 .329 ** .108 .153
Hokuriku .015 .119 .003 -.127 .167 -.030 .196 .172 .041
Tozan .060 .127 .012 .011 .188 .002 .113 .172 .024
Tokai .126 .098 .039 .205 .148 .059 .064 .129 .021
Kinki .065 .091 .022 -.002 .136 .000 .155 .121 .054
Chugoku .051 .113 .012 .052 .168 .012 .056 .153 .014
Shikoku .237 + .132 .045 .119 .198 .022 .337 + .177 .067
Education: Higher secondary .046 .072 .022 -.025 .105 -.011 .095 .101 .048
Non-university .051 .096 .023 .033 .157 .015 .098 .127 .046
University -.110 .087 -.044 -.181 .145 -.078 -.108 .119 -.036
Occupation: Upper-white .062 .083 .020 .029 .131 .010 .063 .112 .020
Lower-white .003 .066 .001 .039 .113 .016 -.049 .081 -.022
Blue-collar -.006 .070 -.002 -.048 .111 -.021 .014 .097 .005
Agriculture, forestry and fishery -.002 .146 .000 .105 .186 .020 -.155 .263 -.019
Subjective social stratification .000 .036 .000 -.033 .053 -.026 .023 .048 .018
Income level .014 .033 .012 .082 + .047 .071 -.061 .046 -.051
Sense of trust .061 *** .018 .079 .045 + .026 .058 .086 *** .025 .111
Political attitude .003 .027 .002 .026 .036 .024 -.043 .041 -.034
Religion: Buddhist .128 .086 .053 .194 .126 .080 .069 .119 .029
Christian -.074 .254 -.007 .182 .463 .013 -.142 .302 -.017
Others .213 .132 .049 .432 * .211 .088 .078 .167 .020
Religiosity .038 .053 .028 .004 .082 .003 .041 .070 .033
Hours of watching TV per day .006 .011 .012 .006 .017 .012 .004 .015 .010
Frequency of reading a newspaper .028 .021 .032 -.048 .031 -.054 .101 *** .030 .116
Amount of reading books per month .012 .022 .014 .038 .038 .036 -.004 .026 -.005
Frequency of seeing foreigners .041 .026 .039 .044 .039 .041 .044 .035 .043
For or against an increase of foreigners .260 *** .049 .124 .249 *** .072 .114 .254 *** .067 .128
Occasions of using English -.002 .030 -.002 -.057 .043 -.058 .049 .044 .048
Self-rated English proficiency .014 .021 .021 .077 ** .030 .122 -.049 .031 -.078
Willingness of learning English .007 .028 .007 .056 .044 .051 -.020 .038 -.021
Foreign language of interest exc. English .223 *** .065 .086 .170 + .096 .062 .269 ** .089 .110
F-value 4.580 *** .027 .002 2.514 *** 3.380 ***
adjusted R2 .061 .052 .077
*** p<.001, ** p<.01, * p<.05, + p<.01
All (N=1913) Male (N=947) Female (N=966)
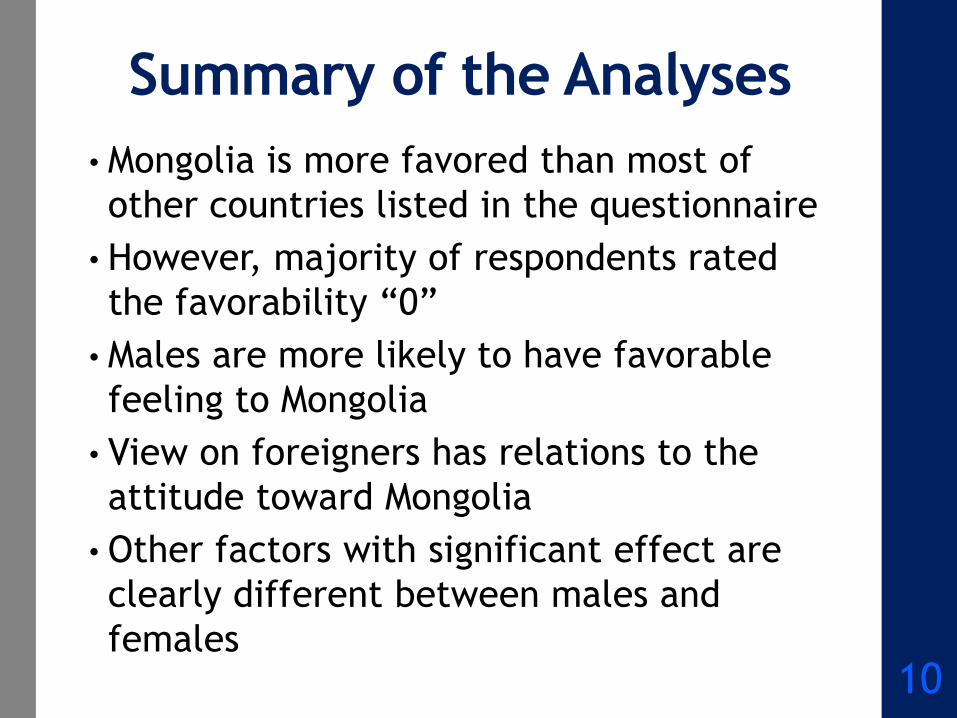
Summary of the Analyses
• Mongolia is more favored than most of
other countries listed in the questionnaire
• However, majority of respondents rated
the favorability “0”
• Males are more likely to have favorable
feeling to Mongolia
• View on foreigners has relations to the
attitude toward Mongolia
• Other factors with significant effect are
clearly different between males and
females10
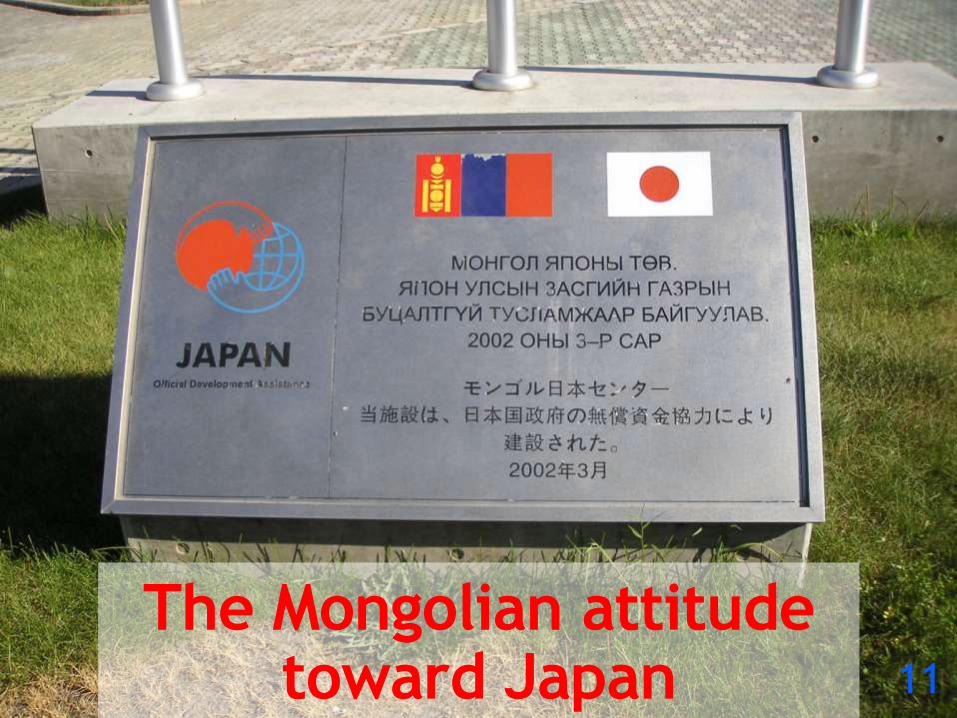
The Mongolian attitude toward Japan 11

Question in Focus (ABS2)
“Please let us know about your impressions of the following countries. Give it a grade from 1 to 10, being 1 very bad and 10 very good.”
12
Grade Do not
understandthe question
Can’t choose Decline
165. United States ___ 97 98 99
166. China [optional for China] ___ 97 98 99167. Japan [optional for Japan] ___ 97 98 99
Very
Bad
1 2 3 4 5 6 7 8 9 10
Very
Good

Question Examined (ABS2)
“For each aware of, please let us know about your impression of the following organizations. Here is a scale: 1 means very bad and 10 means very good. . Give it a grade from 1 to 10, being 1 very bad and 10 very good.”
13
Grade Do not
understandthe question
Can’t choose Decline
161. The European Community or European Union
___ 97 98 99
162. The United Nations or UN ___ 97 98 99163. International Monetary Fund or IMF
___ 97 98 99
164. World Bank ___ 97 98 99
Very
Bad
1 2 3 4 5 6 7 8 9 10
Very
Good

Distribution of Answers
14
GUS = Generation under Socialism
GAD = Generation after Democratization

Cross-national Comparison
15

Comparison of Mean Score (1)
16
N Mean S.D.
GUS 669 6.810 2.070
GAD 481 7.087 2.054
Difference CI (95%)
.277 * .035 .519
*** p<.001, ** p<.01, * p<.05, + p<.1
N=1121 Mean S.D.
Japan 6.935 2.057
USA 7.310 2.218 1.401 *** 1.247 1.556
China 5.533 2.354 -.375 *** -.539 -.211
Difference CI (95%)
*** p<.001, ** p<.01, * p<.05, + p<.1, F=355.883***
Difference between generation
Difference among impression of countries
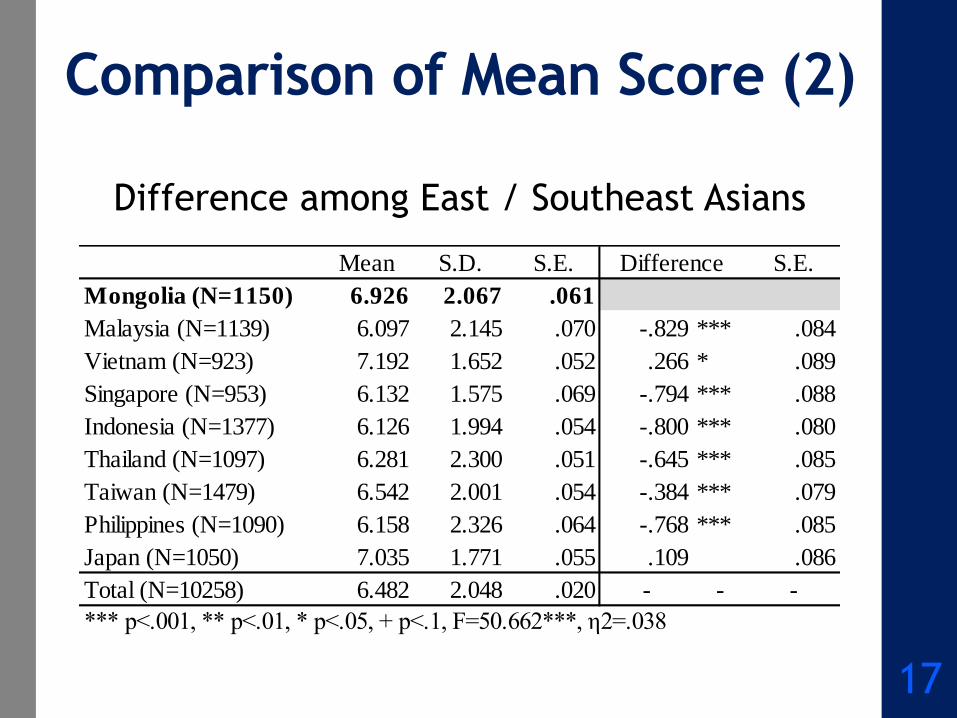
Comparison of Mean Score (2)
17
Mean S.D. S.E. S.E.
Mongolia (N=1150) 6.926 2.067 .061
Malaysia (N=1139) 6.097 2.145 .070 -.829 *** .084
Vietnam (N=923) 7.192 1.652 .052 .266 * .089
Singapore (N=953) 6.132 1.575 .069 -.794 *** .088
Indonesia (N=1377) 6.126 1.994 .054 -.800 *** .080
Thailand (N=1097) 6.281 2.300 .051 -.645 *** .085
Taiwan (N=1479) 6.542 2.001 .054 -.384 *** .079
Philippines (N=1090) 6.158 2.326 .064 -.768 *** .085
Japan (N=1050) 7.035 1.771 .055 .109 .086
Total (N=10258) 6.482 2.048 .020 - - -
*** p<.001, ** p<.01, * p<.05, + p<.1, F=50.662***, η2=.038
Difference
Difference among East / Southeast Asians

Regression Analysis (1)
18
B S.E. β B S.E. β B S.E. β
Intercept 6.155 *** .523 5.681 *** .485 6.179 *** .534
Gender .058 .138 .014 .047 .138 .011 .057 .138 .014
Age -.016 ** .005 -.108 -.017 * .008 -.116
Socialist era dummy -.296 * .148 -.071 .047 .214 .011
Years of education .048 * .024 .078 .054 * .024 .089 .047 * .024 .078
Place of residence: Province -.045 .190 -.008 -.016 .191 -.003 -.048 .191 -.009
County .129 .183 .031 .179 .182 .043 .127 .184 .030
Countryside .445 .415 .037 .496 .415 .041 .445 .415 .037
Subjective social stratification -.029 .042 -.023 -.033 .042 -.027 -.029 .042 -.023
Income level .141 ** .053 .097 .150 ** .053 .103 .141 ** .053 .096
Sense of trust -.016 .209 -.002 -.038 .210 -.006 -.016 .210 -.002
Religion: Buddhist -.063 .266 -.014 -.123 .266 -.027 -.061 .267 -.013
Muslim .089 .352 .011 .021 .352 .003 .090 .353 .011
Christian -.465 .472 -.039 -.471 .473 -.039 -.465 .472 -.038
Religiosity -.034 .113 -.015 -.017 .113 -.007 -.035 .113 -.015
Ownership of TV -.092 .306 -.010 -.093 .307 -.010 -.090 .307 -.010
Accessilibity to CATV .021 .186 .004 -.003 .186 -.001 .022 .186 .005
Ownership of radio -.169 .134 -.041 -.185 .134 -.045 -.169 .134 -.041
Use of Internet -.073 .058 -.054 -.047 .058 -.035 -.071 .059 -.053
Following major foreign events .037 .077 .017 .024 .077 .011 .037 .077 .017
Traveling abroad .056 .064 .034 .049 .065 .029 .054 .065 .032
Contact w/ foreigners .107 + .062 .067 .115 + .062 .072 .107 + .062 .067
Recognition of international organizations .168 * .069 .086 .155 * .069 .080 .168 * .069 .086
F-value 3.118 *** 2.874 *** 2.975 ***
adjusted R2 .043 .038 .042
Model 1 (N=994) Model 3 (N=994)Model 2 (N=994)

Regression Analysis (2)
19
B S.E. β B S.E. β
Intercept 5.823 *** .742 6.969 *** .988
Gender .267 .183 .065 -.131 .218 -.030
Age -.016 + .009 -.082 -.025 .024 -.059
Socialist era dummy
Years of education .063 * .029 .115 .030 .048 .041
Place of residence: Province -.022 .053 -.018 -.070 .319 -.012
County .084 .070 .056 .423 .287 .102
Countryside .064 .243 .013 1.269 * .642 .108
Subjective social stratification .095 .243 .023 -.049 .068 -.038
Income level -.140 .546 -.011 .236 ** .083 .165
Sense of trust -.252 .255 -.041 .411 .372 .054
Religion: Buddhist .076 .349 .016 -.165 .424 -.036
Muslim .241 .436 .033 -.437 .640 -.042
Christian -.788 .680 -.056 -.276 .678 -.027
Religiosity .043 .145 .018 -.111 .183 -.051
Ownership of TV .180 .383 .020 -.973 + .523 -.097
Accessilibity to CATV .261 .254 .054 -.245 .281 -.052
Ownership of radio -.366 * .179 -.089 .079 .209 .019
Use of Internet -.167 + .092 -.095 -.008 .085 -.007
Following major foreign events -.064 .102 -.029 .245 * .118 .112
Traveling abroad .081 .087 .051 .056 .104 .030
Contact w/ foreigners .016 .089 .010 .218 * .089 .144
Recognition of international organizations .233 ** .088 .123 .025 .113 .012
F-value 2.501 *** 2.056 **
adjusted R2 .051 .052
*** p<.001, ** p<.01, * p<.05, + p<.1
GUS (N=586) GAD (N=408)

Additional Analysis (ABS3)
• Is Japan “model for future development?”
• The Mongolians’ answers are examined by
using ABS3 data
• The question focused on is “Which country
should be a model for our own country’s
future development?”
• Choices are: “1. United States,” “2.
China,” “3. India,” “4. Japan,” “5.
Singapore,” “6. Other [please name],”
and “7. We should follow our country’s
own model”20

Cross-national Comparison
21

Summary of the Analyses
• Impression of Japan is significantly
different between GUS and GAD
• However, in both generations the majority
have favorable impression of Japan
• The Mongolians has relatively favorable
impression of Japan, compared with other
East and Southeast Asians
• Factors affecting impression of Japan are
totally different between GUS and GAD
• Japan is less likely to be a “model for
future development” in Mongolia22

Discussion (JP MN)
• Meaning of the answer “0” is ambiguous
(Neither good nor bad feeling? No feeling
at all? Don’t know about Mongolia? etc.)
• The potential reasons for relatively
favorable attitude are:
(1) Rapidly developing exchanges and
relations since Mongolian
democratization
(2) Longstanding interest in Mongolia and
its history (esp. Mongol Empire)
23

Interest in Mongolia (Japan)
Examples of fictional and non-fictional works during Cold War era whose subject relates to Mongolia 24

Discussion (MN JP)
• Effect of socialist education and
propaganda has been diminishing (or had
little effect from the beginning?), as far as
impression of Japan is concerned
• Generational difference might have
linkage to difference in significant factors
• Socialist education system had
(presumably) unintended effect: Longer
education years under socialism (!) led to
more favorable impression of Japan
25

Conclusion
• This study confirmed favorable attitude
between Japanese and Mongolian citizens
• However, the study also has limitations:
(1) There might be other factors relating to
the attitude
(2) There might be change in the attitude
after 2007
• Exploring affinity between the two
countries might be suggestive when we
are to find clues to resolve estrangement
in East Asia 26

AcknowledgementsThe Japanese General Social Surveys (JGSS) are designed
and carried out by the JGSS Research Center at Osaka University of Commerce (Joint Usage / Research Center for Japanese General Social Surveys accredited by Minister of Education, Culture, Sports, Science and Technology), in collaboration with the Institute of Social Science at the University of Tokyo. The datasets are distributed by SSJ Data Archive, Institute of Social Science, the University of Tokyo.
Data analyzed in this article were collected by the Asian Barometer Project (2005-2008 and 2010-2012), which was co-directed by Professors Fu Hu and Yun-han Chu and received major funding support from Taiwan’s Ministry of Education, Academia Sinica and National Taiwan University. The Asian Barometer Project Office (www.asianbarometer.org) is solely responsible for the data distribution. The author appreciates the assistance in providing data by the institutes and individuals aforementioned. The views expressed herein are the author’s own. 27