HOW DID PEPSICO START?
55
The Wolves of Court Street
Transcript of HOW DID PEPSICO START?

The Wolves of Court Street

HOW DID PEPSICO START?
PepsiCo merger between PepsiCola and Frito Lay
PepsiCola founded in 1890 by Caleb Bradham
Frito Lay formed in 1961 after a merger of Frito Co and H.W. Lay company
PEPSI IN THE GREAT DECADES
Nutrition labels placed on foods
Inters Tokyo stock market
Bottled tea is introduced
1st major cola brand to produce and distribute in Vietnam
Lays is introduced to 20 countries worldwide
Kentucky Fried Chicken, Taco Bell, Pizza Hut are spun off as Tricon Global Restaurants, Inc.

PEPSI TODAY
Began four year plan to invest one billion US dollars in China to “expand in emerging markets and broaden the portfolio of locally relevant products.” Has 22 – billion dollar companies
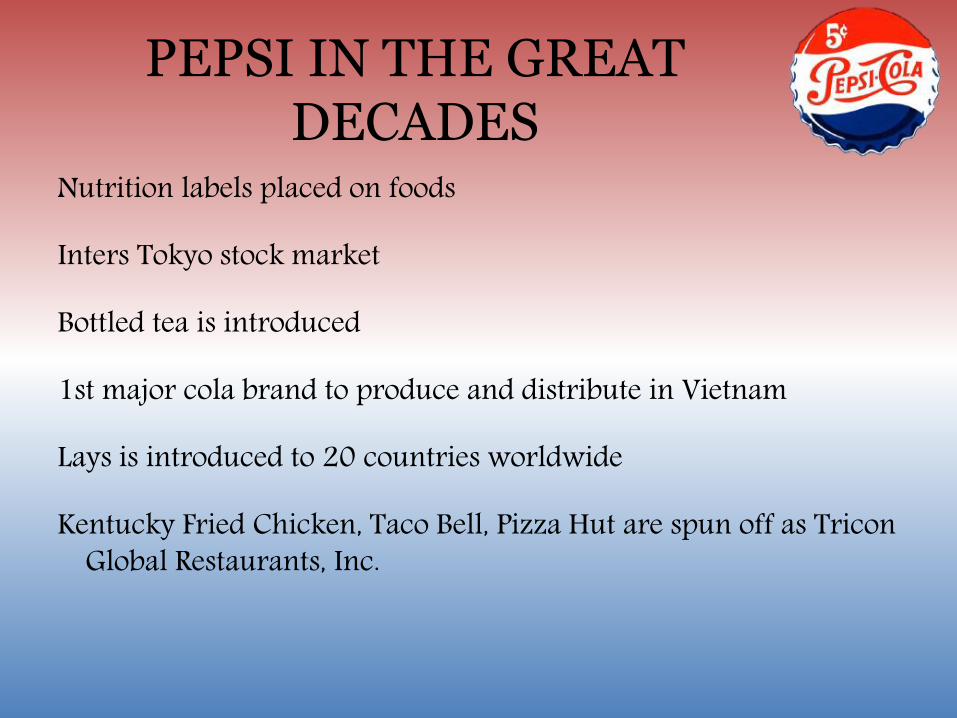
RECENT NEWS
The Great Bottle Shape Dispute
New Executive Vice President, Global Categories and Operations of European Unit
New CEO, PepsiCo Europe
Arby’s commercial
Craft Sodas

Competitors
Coca Cola in the beverage industry
Kraft Foods in the snack food industry
Dr. Pepper Snapple Group, Inc.
Nestle
The Kellogg Company
ConAgra Foods

Product Mix

Sales Breakdown
52%
48%
Food Beverage
Net Revenue: $66.4 Billion

Business Model
Market Cap: $145 Billion
274,000 Employees
Operates in over 200 countries
Largest seller of American Beverages & Snacks
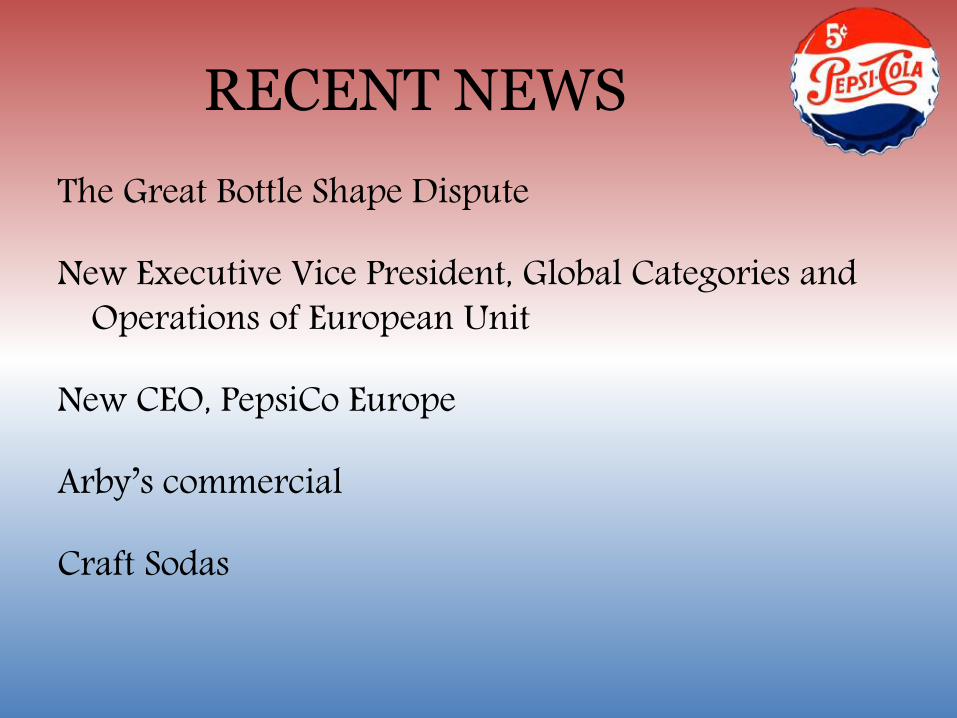
Business Model
PepsiCo Americas Foods• Frito-Lay North America (FLNA)• Quaker Foods North America (QFNA)• Latin American food and snack business (LAF)
PepsiCo Americas Beverages (PAB)• North and South American beverage business
PepsiCo Europe (Europe)• All beverage, food, and snack business and Europe and
South AfricaPepsiCo Asia, Middle East, and Africa (AMEA)
• All beverage, food, and snack businesses in AMEA
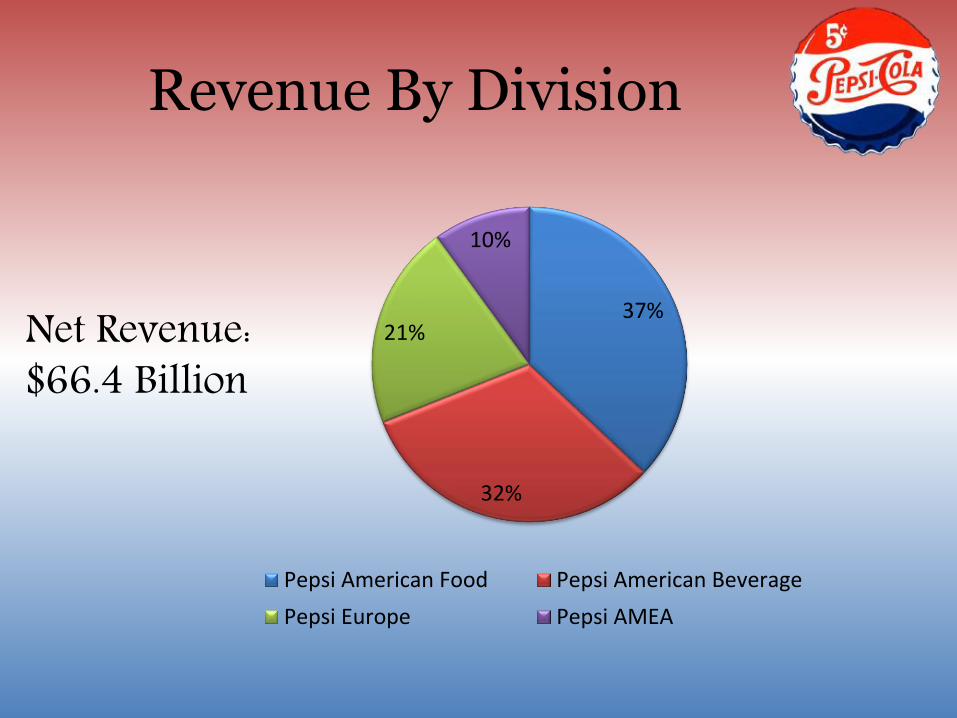
Revenue By Division
37%
32%
21%
10%
Pepsi American Food Pepsi American Beverage
Pepsi Europe Pepsi AMEA
Net Revenue: $66.4 Billion

Operating Income
52%
26%
12%
10%
Pepsi American Food Pepsi American Beverage
Pepsi Europe Pepsi AMEA
Net Core Operating Income: $10.4 Billion

Bottling Acquisition
Pepsi Bottling Group, Inc. & PepsiAmericas, Inc.
Two largest Pepsico bottlers acquired in 2010
$7.8 billion investment
Provides efficiency

Competitive Advantage
Leverage on bottling business
Global leader in snacks
Very diverse in products
Sells complementary products
22 different types of brands earning over 1 billion in sales per year

Consumer Base
World wide Markets more to families, students, and young adultsTrying to find a niche in the middle-aged population with ‘nutritional’ products

Regular Customers
Wholesale/Other distributorsFoodservice CustomersGrocery StoresDrug StoresConvenience Stores
Discount/Dollar StoresMass MerchandisersMembership StoresAuthorized Independent Bottlers

Reliance on Customers
Do not sell directly to consumers– Rely on and provide financial incentive to assist in
distribution and promotion of products– Includes:
• Volume-based Rebates• Product Placement Fees• Promotions• Displays
– Annually Negotiated

Market with Other Companies
Taco BellBuffalo Wild WingsNFLRecently added A&M College Station

Growth Rates
Over the past decade:– Net revenue compound annual growth rate: 9%– Earnings per share growth rate: 8%
2013:– Operating Profit growth rate: 7%
• Caused by net revenue growth and planned cost reductions across a number of expense categories, as well as lower commodity costs, primarily cooking oil
2014 most recent quarter:– Net Revenue Growth: 2%

Foreign Expansion
Both the food and beverage categories have an expected 5% global growth rateSuccessful Markets:
– Russia, Mexico, Canada, the United Kingdom, and Brazil
Expansion into Emerging Countries:– China, India, and regions in Latin America, Africa,
and the Middle East

Multi-Year Productivity Plan
Implemented in 2012Includes actions in every aspect of their business that they believe will strengthen their complementary food, snack and beverage businesses by:
– Leveraging new technologies and processes across PepsiCo’s operations
– Go-to-market and information systems– Heightening the focus on best practice sharing across the
globe– Consolidating manufacturing, warehouse and sales
facilities – Implementing simplified organization structures, with
wider spans of control and fewer layers of management

Risk Factors
Change in Consumer Preference
Change in legal environment
Loss of a key customer
Inability to grow business into emerging markets
Inability to integrate acquired parts into existing operations
Unions

Financial Data

Buffettology
Metric PEP Buffet’s Standard Satisfied?
Gross Profit Margin 14.88% > 20% No
Net Profit Margin 10.39% > 10% Yes
SG&A Expenditures/ Gross Profit
71.9% ≤ 80% Yes
Depreciation/ GrossProfit
7.39% ≤ 10% Yes
Interest/ Operating Income
8.98% ≤ 15% Yes
Current Ratio 1.16 ≥ 1 Yes

Buffettology
Metric PEP Buffet’s Standard Satisfied?
Long Term Debt/ Net Earnings
5.4 years < 5 years No
Return on Equity 31% ≥ 15% Yes
Return on Capital 16% ≥ 15% Yes
Dividend Payout Ratio
54% ≤ 60% Yes
Adj. Debt/ Shareholders’ Equity
1.17 < 0.80 No

Morning Star
$13.6 Billion Due within 5 Years

Return on Equity
10
15
20
25
30
35
40
45
4-Dec 5-Dec 6-Dec 7-Dec 8-Dec 9-Dec 10-Dec 11-Dec 12-Dec 13-Dec TTM

Return on Assets
0
2
4
6
8
10
12
14
16
18
20
4-Dec 5-Dec 6-Dec 7-Dec 8-Dec 9-Dec 10-Dec 11-Dec 12-Dec 13-Dec TTM

Qualitative Analysis
Metric
What type of business is this: commodity or sustained competitive advantage?
Competitive Advantage
Can you easily explain what the business does?
Yes
Is it heavily unionized?Yes
Does it require heavy capital infusion?No
Does it require lots of research and development?
No
Can inventory become obsolete?Yes
Are there chronic "one time" write offs?No
Is the company able to raise its prices to offset inflation?
Maybe
Will the company be able to sell more in the future?
Yes

IOFS
Trend Increasing?
Sales per Share Yes
Cashflows per share Yes
Earnings per Share Yes
Dividends Declared pershare
Yes
Book Value per Share Yes
Revenues (Sales) Yes
Gross Profit Margin Decreasing
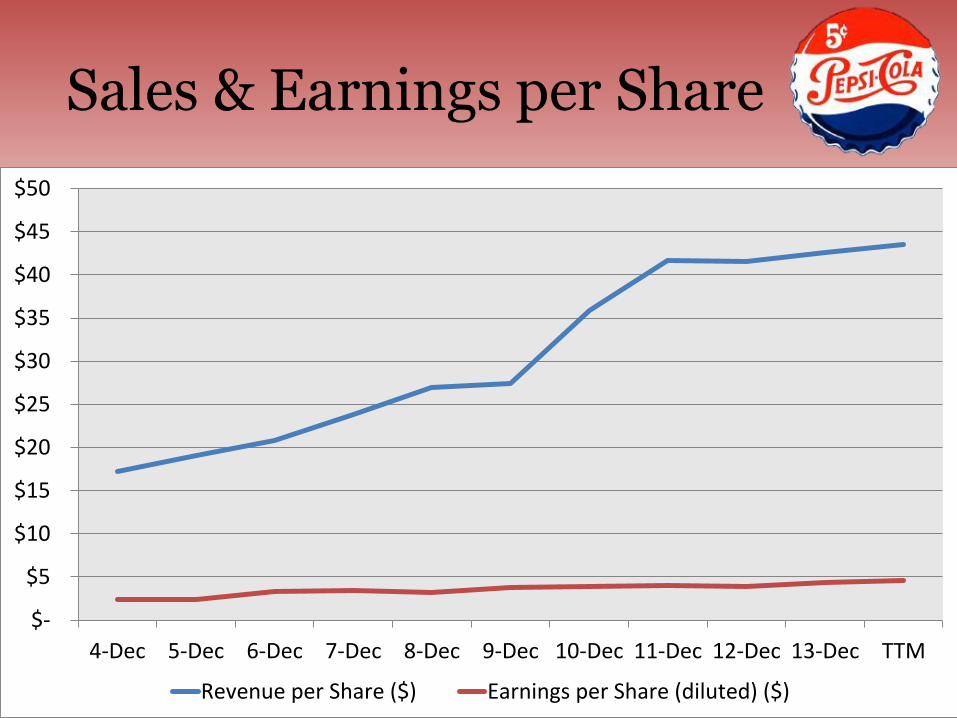
Sales & Earnings per Share
$-
$5
$10
$15
$20
$25
$30
$35
$40
$45
$50
4-Dec 5-Dec 6-Dec 7-Dec 8-Dec 9-Dec 10-Dec 11-Dec 12-Dec 13-Dec TTM
Revenue per Share ($) Earnings per Share (diluted) ($)

Profit Margins
0
10
20
30
40
50
60
4-Dec 5-Dec 6-Dec 7-Dec 8-Dec 9-Dec 10-Dec 11-Dec 12-Dec 13-Dec TTM
Gross Margin % Operating Margin % Net Margin %

IOFS
Trend Increasing
Operating Profit Margin Stable last 4 years
Number of Stores N/A
Net Profit Yes
Net Profit Margin Stable
Working Capital Varies
Shareholder’s Equity Yes

IOFS
Trend Increasing?
Return on Total Capital Decreasing
Return on Shareholder’s Equity
Varies (always above 15)
Long-Term Debt Stable (after 1 time expense)
All Dividends to Net Profit Under 60%
Yes
Common Shares Outstanding No

Discounted Cash Flow
No Tangible Book:
Tangible Book:

Conscious Investor

Conscious Investor Report
SafetyCut P/E by: 10.7%Cut Growth by: 1.14%

Conscious Investor Report
SafetyCut P/E by: 10.7%Cut Growth by: 0.89%

Conscious Investor Report
SafetyCut P/E by: 10.7%Cut Growth by: 2.97%

Van Den Berg’s
0.0
0.5
1.0
1.5
2.0
2.5
3.0
3.5
4.0
4.5
20
14
-12
-10
20
14
-01
-31
20
13
-02
-28
20
12
-03
-31
20
11
-04
-30
20
10
-05
-31
20
09
-06
-30
20
08
-07
-31
20
07
-08
-31
20
06
-09
-30
20
05
-10
-31
20
04
-11
-30
20
03
-12
-31
20
03
-01
-31
20
02
-02
-28
20
01
-03
-31
20
00
-04
-30
19
99
-05
-31
19
98
-06
-30
19
97
-07
-31
19
96
-08
-31
19
95
-09
-30
19
94
-10
-31
19
93
-11
-30
19
92
-12
-31
19
92
-01
-31
19
91
-02
-28
19
90
-03
-31
Price/Sales

Van Den Berg’s
0.0
5.0
10.0
15.0
20.0
25.0
30.0
35.0
20
14
-12
-10
20
14
-01
-31
20
13
-02
-28
20
12
-03
-31
20
11
-04
-30
20
10
-05
-31
20
09
-06
-30
20
08
-07
-31
20
07
-08
-31
20
06
-09
-30
20
05
-10
-31
20
04
-11
-30
20
03
-12
-31
20
03
-01
-31
20
02
-02
-28
20
01
-03
-31
20
00
-04
-30
19
99
-05
-31
19
98
-06
-30
19
97
-07
-31
19
96
-08
-31
19
95
-09
-30
19
94
-10
-31
19
93
-11
-30
19
92
-12
-31
19
92
-01
-31
19
91
-02
-28
19
90
-03
-31
Price/Earnings

Van Den Berg’s
0.0
2.0
4.0
6.0
8.0
10.0
12.0
20
14
-12
-10
20
14
-02
-28
20
13
-04
-30
20
12
-06
-30
20
11
-08
-31
20
10
-10
-31
20
09
-12
-31
20
09
-02
-28
20
08
-04
-30
20
07
-06
-30
20
06
-08
-31
20
05
-10
-31
20
04
-12
-31
20
04
-02
-29
20
03
-04
-30
20
02
-06
-30
20
01
-08
-31
20
00
-10
-31
19
99
-12
-31
19
99
-02
-28
19
98
-04
-30
19
97
-06
-30
19
96
-08
-31
19
95
-10
-31
19
94
-12
-31
19
94
-02
-28
19
93
-04
-30
19
92
-06
-30
19
91
-08
-31
Price/Book

Van Den Berg’s
0.0
5.0
10.0
15.0
20.0
25.0
20
14
-12
-10
20
14
-02
-28
20
13
-04
-30
20
12
-06
-30
20
11
-08
-31
20
10
-10
-31
20
09
-12
-31
20
09
-02
-28
20
08
-04
-30
20
07
-06
-30
20
06
-08
-31
20
05
-10
-31
20
04
-12
-31
20
04
-02
-29
20
03
-04
-30
20
02
-06
-30
20
01
-08
-31
20
00
-10
-31
19
99
-12
-31
19
99
-02
-28
19
98
-04
-30
19
97
-06
-30
19
96
-08
-31
19
95
-10
-31
19
94
-12
-31
19
94
-02
-28
19
93
-04
-30
19
92
-06
-30
19
91
-08
-31
Price/Cashflow

Van Den Berg’s
0.0
0.5
1.0
1.5
2.0
2.5
3.0
3.5
4.0
4.5
20
14
-12
-10
20
14
-01
-31
20
13
-02
-28
20
12
-03
-31
20
11
-04
-30
20
10
-05
-31
20
09
-06
-30
20
08
-07
-31
20
07
-08
-31
20
06
-09
-30
20
05
-10
-31
20
04
-11
-30
20
03
-12
-31
20
03
-01
-31
20
02
-02
-28
20
01
-03
-31
20
00
-04
-30
19
99
-05
-31
19
98
-06
-30
19
97
-07
-31
19
96
-08
-31
19
95
-09
-30
19
94
-10
-31
19
93
-11
-30
19
92
-12
-31
19
92
-01
-31
19
91
-02
-28
19
90
-03
-31
EV/Revenue

Van Den Berg’s
0.0
5.0
10.0
15.0
20.0
25.0
30.0
20
14
-12
-10
20
14
-01
-31
20
13
-02
-28
20
12
-03
-31
20
11
-04
-30
20
10
-05
-31
20
09
-06
-30
20
08
-07
-31
20
07
-08
-31
20
06
-09
-30
20
05
-10
-31
20
04
-11
-30
20
03
-12
-31
20
03
-01
-31
20
02
-02
-28
20
01
-03
-31
20
00
-04
-30
19
99
-05
-31
19
98
-06
-30
19
97
-07
-31
19
96
-08
-31
19
95
-09
-30
19
94
-10
-31
19
93
-11
-30
19
92
-12
-31
19
92
-01
-31
19
91
-02
-28
EV/EBIT

Van Den Berg’s
0.0
5.0
10.0
15.0
20.0
25.0
20
14
-12
-10
20
14
-01
-31
20
13
-02
-28
20
12
-03
-31
20
11
-04
-30
20
10
-05
-31
20
09
-06
-30
20
08
-07
-31
20
07
-08
-31
20
06
-09
-30
20
05
-10
-31
20
04
-11
-30
20
03
-12
-31
20
03
-01
-31
20
02
-02
-28
20
01
-03
-31
20
00
-04
-30
19
99
-05
-31
19
98
-06
-30
19
97
-07
-31
19
96
-08
-31
19
95
-09
-30
19
94
-10
-31
19
93
-11
-30
19
92
-12
-31
19
92
-01
-31
19
91
-02
-28
EV/EBITDA

DuPont Analysis
Net Profit Margin
Total Asset Turnover
Financial Leverage Multiplier Return on Equity
Pepsi 10% 0.83 3.49 30.10%
Coke 17% 0.48 2.88 24.07%
Kraft 13% 0.79 4.08 41.90%
Kellogg 12% 0.92 4.66 51.45%
Nestle 11% 0.76 1.96 16.15%

Asset Turnover
0
0.2
0.4
0.6
0.8
1
1.2
1.4
4-Dec 5-Dec 6-Dec 7-Dec 8-Dec 9-Dec 10-Dec 11-Dec 12-Dec 13-Dec TTM

Industry Company
PepsiCo Inc Coca-Cola Co Kellogg Co Nestle SAKraft Foods Group Inc
Dr Pepper Snapple Group Inc
Number of Guru Holders 15 12 2 1 10 4
Combined Weightings (%) 35.42 39.45 0.64 2.40 0.67 0.92
Number of Guru Buys:Sells (12 months)
15 : 23 16 : 13 10 : 12 2 : 2 9 : 10 10 : 11
Market Value ($mil) $145,365 $184,140 $23,368 $235,632 $35,506 $13,852
Revenue (mil) $66,415 $46,854 $14,792 $97,235 $18,218 $5,997
P/E(ttm) 21.50 23.30 13.70 22.90 15.30 20
P/S 2.23 4.06 1.60 2.56 2 2.30
P/B 6.34 5.50 6.90 3.56 6.40 5.90
EV/EBIT 16.61 19.48 11.32 18.89 11.07 13.57
EV/Sales 2.47 4.37 2.10 2.67 2.46 2.65
ROA (%) 8.84 8.69 11.17 7.83 10.24 8.64
ROE (%) 29.96 24.29 51.19 15.19 44.93 30.98
Operating Margin (%) 14.88 22.45 18.58 13.89 22.19 19.56
Net Margin (%) 10.39 17.41 11.97 10.57 13.10 11.67
10-Year Rvn. Growth (%) 11.70 10.80 6.30 2.70 0 0
10-Year Earning Growth (%) 6.40 9.70 5.50 5.60 0 0
5-Year Rvn. Growth (%) 10.80 13 6.30 0 0 8.30
5-Year Earning Growth (%) 2.80 2.70 6.80 3.60 0 10.40
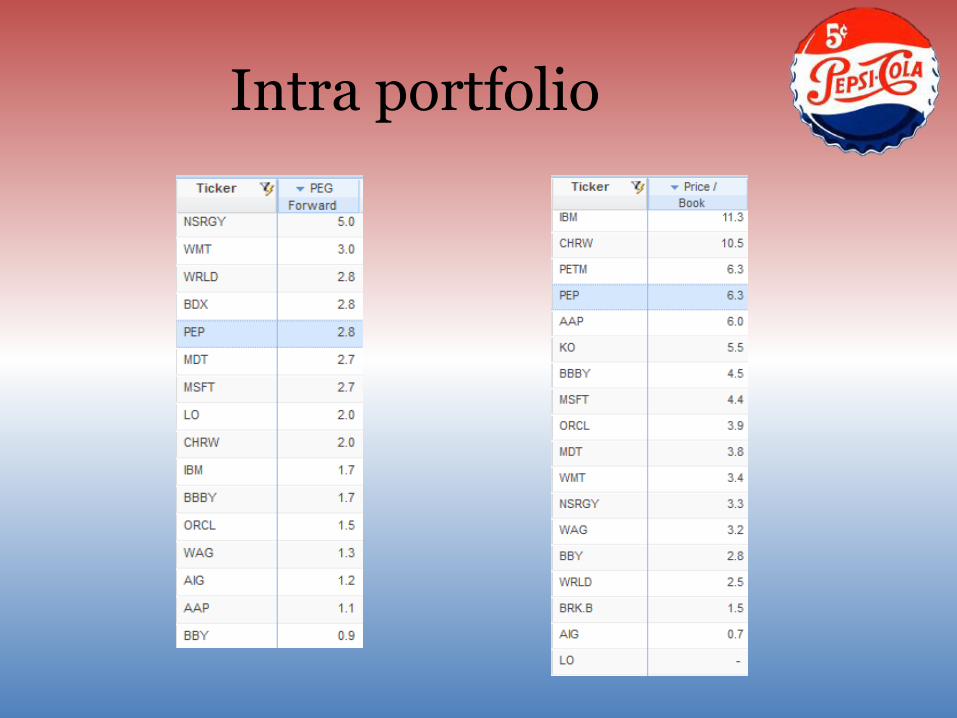
Intra portfolio

Intra Portfolio

Goal of these presentations?
Determine the single best action for our portfolio at this time

Recommendation
Write one call with the following conditions:
Strike Price - $100Premium - $2.50Strike Data – 1/23/2015

Bonus Recommendation!
Limit order on the other 100 shares we own with a strike price of $105

Van Den Berg
0.0
5.0
10.0
15.0
20.0
25.0
30.0
35.0
40.0
45.0
20
14
-12
-10
20
14
-02
-28
20
13
-04
-30
20
12
-06
-30
20
11
-08
-31
20
10
-10
-31
20
09
-12
-31
20
09
-02
-28
20
08
-04
-30
20
07
-06
-30
20
06
-08
-31
20
05
-10
-31
20
04
-12
-31
20
04
-02
-29
20
03
-04
-30
20
02
-06
-30
20
01
-08
-31
20
00
-10
-31
19
99
-12
-31
19
99
-02
-28
19
98
-04
-30
19
97
-06
-30
19
96
-08
-31
19
95
-10
-31
19
94
-12
-31
19
94
-02
-28
19
93
-04
-30
19
92
-06
-30
19
91
-08
-31
Price/Free Cashflow