
How Chemical Manufacturing and Petroleum Refining Facilities in Harris County are Using Point
93
10333 Richmond Avenue, Suite 910, Houston TX 77042 713.470.6546 Final Report How Chemical Manufacturing and Petroleum Refining Facilities in Harris County Are Using Point Source Monitoring to Identify and Reduce HRVOC Emissions HARC Project H76 Prepared for Houston Advanced Research Center 4800 Research Forest Drive The Woodlands, Texas 77381 Prepared by Steven H. Ramsey Christopher J. Colville ENVIRON International Corporation 10333 Richmond Avenue, Suite 910 Houston, Texas 77042 Telephone: (713) 470-6546 October 27, 2006
Transcript of How Chemical Manufacturing and Petroleum Refining Facilities in Harris County are Using Point

10333 Richmond Avenue, Suite 910, Houston TX 77042 713.470.6546
Final Report
How Chemical Manufacturing and Petroleum Refining Facilities in Harris County Are Using Point Source Monitoring to Identify and Reduce HRVOC Emissions
HARC Project H76
Prepared for Houston Advanced Research Center
4800 Research Forest Drive The Woodlands, Texas 77381
Prepared by
Steven H. Ramsey Christopher J. Colville
ENVIRON International Corporation 10333 Richmond Avenue, Suite 910
Houston, Texas 77042 Telephone: (713) 470-6546
October 27, 2006
HARC Project H76 iOctober 27, 2006
TABLE OF CONTENTS
Page ACKNOWLEDGEMENTS ............................................................................................................................................. V
EXECUTIVE SUMMARY .......................................................................................................................................... ES-1 PROJECT H76 OVERVIEW ......................................................................................................................................... 1 KEY FINDINGS............................................................................................................................................................ 2 RECOMMENDATIONS.................................................................................................................................................. 3
1. INTRODUCTION..................................................................................................................................................... 1 1.1 BACKGROUND ON THE REGULATION OF HRVOC...................................................................................... 1 1.2 OVERVIEW OF HRVOC EMISSION CONTROL PROGRAM .......................................................................... 2 1.3 OVERVIEW OF HARC PROJECT H76......................................................................................................... 5
2. STUDY METHODOLOGY ..................................................................................................................................... 6 2.1 STUDY TEAM FORMATION .......................................................................................................................... 6 2.2 DATA ACQUISITION ..................................................................................................................................... 6 2.3 ANALYSIS & REPORTING ............................................................................................................................ 7
3. COLLECTED DATA & INFORMATION .............................................................................................................. 9 3.1 CONTINUOUS EMISSION MONITORING SYSTEMS....................................................................................... 9 3.2 IMPLEMENTATION SCHEDULES ................................................................................................................. 13 3.3 MONITORING DATA ................................................................................................................................... 14 3.4 HRVOC DATA MANAGEMENT.................................................................................................................. 16 3.5 STUDY PARTICIPANT OBSERVATIONS AND SUGGESTIONS ...................................................................... 17 3.5.1 Observations and Reported Implementation Issues ......................................................................... 17 3.5.2 Suggestions by Study Participants ...................................................................................................... 19 3.6 HRVOC MONITORING PROGRAM IMPLEMENTATION COSTS .................................................................. 19 3.7 USE OF MONITORS TO ELIMINATE AND/OR REDUCE SOURCES OF HRVOC EMISSIONS ....................... 22 3.8 CHANGES IN PRACTICES RESULTING FROM USE OF HRVOC MONITORS.............................................. 23 3.8.1 Operational.............................................................................................................................................. 23 3.8.2 Maintenance............................................................................................................................................ 24 3.8.3 Emission Events ..................................................................................................................................... 24 3.9 EMISSION CONTROL PROJECTS ............................................................................................................... 24 3.10 EMISSION CONTROL PROJECT COSTS..................................................................................................... 26 3.11 USE OF REMOTE SENSING TECHNOLOGY................................................................................................ 26 3.11.1 IR Camera Use at Facility #1 ........................................................................................................... 27 3.11.2 IR Camera Use at Facility #2 ........................................................................................................... 27 3.11.3 IR Camera Use at Facility #3 ........................................................................................................... 28 3.11.4 IR Camera Use at Facility #4 ........................................................................................................... 28 3.11.5 Fenceline FTIR .................................................................................................................................. 28 3.12 EDUCATION AND TRAINING ....................................................................................................................... 28 3.13 ECONOMIC BENEFITS OF HRVOC MONITORING..................................................................................... 29
4. ANALYSIS ............................................................................................................................................................. 30 4.1 CONTINUOUS EMISSION MONITORING SYSTEMS..................................................................................... 30 4.2 IMPLEMENTATION...................................................................................................................................... 30 4.3 MONITORING DATA ................................................................................................................................... 30 4.3.1 Total Emissions ...................................................................................................................................... 30 4.3.2 Flares ....................................................................................................................................................... 32

HARC Project H76 iiOctober 27, 2006
4.3.3 Cooling Towers....................................................................................................................................... 34 4.4 DATA MANAGEMENT ................................................................................................................................. 35 4.5 DIFFICULTIES ENCOUNTERED DURING IMPLEMENTATION ....................................................................... 35 4.6 USE OF MONITORS TO ELIMINATE AND/OR REDUCE SOURCES OF HRVOC EMISSIONS ....................... 36 4.7 CHANGES IN PRACTICES RESULTING FROM USE OF HRVOC MONITORS.............................................. 36 4.8 EMISSION CONTROL PROJECTS ............................................................................................................... 36 4.9 COSTS....................................................................................................................................................... 36 4.9.1 HRVOC CEMS Installed Costs ............................................................................................................ 37 4.9.2 HRVOC Monitoring Operating Costs................................................................................................... 37 4.9.3 Process Vent Source Testing Costs .................................................................................................... 38 4.9.4 Total Cost – HRVOC Monitoring Program Implementation.............................................................. 39 4.9.5 Cost of HRVOC Emission Reduction Projects ................................................................................... 39 4.10 USE OF REMOTE SENSING TECHNOLOGY................................................................................................ 40 4.11 EDUCATION AND TRAINING ....................................................................................................................... 41 4.12 ECONOMIC EVALUATION........................................................................................................................... 41 4.13 OBSERVED AMBIENT HRVOC CONCENTRATIONS .................................................................................. 41
5. KEY FINDINGS AND RECOMMENDATIONS ................................................................................................. 46 5.1 KEY FINDINGS ........................................................................................................................................... 46 5.2 BEST MANAGEMENT PRACTICES.............................................................................................................. 47 5.3 RECOMMENDATIONS................................................................................................................................. 48
APPENDICES
Appendix A: Information on Participant Companies
Appendix B: Data Collection Survey
Appendix C: Flare and Cooling Tower Equipment Listing
Appendix D: HRVOC Monitoring Data
Appendix E: Suggestions for HRVOC Rule Improvements Provided by Study Participants
HARC Project H76 iiiOctober 27, 2006
LIST OF FIGURES
Page FIGURE 3-1. Schematic of CEMS Interactions with Facility Systems ............................................................... 9
FIGURE 3-2. Siemens MAXUM II Gas Chromatograph in Flare HRVOC Analyzer Building located at the Lyondell/Equistar Channelview Chemical Complex ............................................................................... 10
FIGURE 3-3. Siemens MAXUM II Gas Chromatograph in Cooling Tower HRVOC Analyzer Building located at the Lyondell/Equistar Channelview Chemical Complex .................................................................. 10
FIGURE 3-4. Siemens Sparging Sample System Schematic Diagram............................................................ 11
FIGURE 3-5. El Paso Stripper Method Schematic Diagram ............................................................................ 12
FIGURE 4-1. Total HRVOC Network Average Concentrations at Houston Ship Channel PAMS-GC Monitoring Sites, June-November .................................................................................................................... 42
FIGURE 4-2. Average HRVOC Concentrations at Houston Ship Channel PAMS-GC Monitoring Sites, June-November...................................................................................................................................... 42
FIGURE 4-3. Reported Point Source HRVOC Emissions by Year for Harris County ...................................... 43
FIGURE 4-4. Reported Point Source Total VOC Emissions by Year for Harris County .................................. 43
HARC Project H76 ivOctober 27, 2006
LIST OF TABLES
Page TABLE 1-1. HECT Allowance Allocations (August 18, 2006) ............................................................................ 2
TABLE 3-1. Monitored Flare HRVOC Emissions ............................................................................................. 14
TABLE 3-2. Monitored Cooling Tower HRVOC Emissions .............................................................................. 15
TABLE 3-3. Tested Process Vent HRVOC Emissions..................................................................................... 15
TABLE 3-4. HRVOC CEMS Total Installed Costs............................................................................................ 20
TABLE 3-5. HRVOC CEMS Annual Operating and Maintenance Costs ......................................................... 21
TABLE 3-6. Process Vent HRVOC Testing Costs ........................................................................................... 21
TABLE 3-7. HRVOC Data Management Costs ................................................................................................ 22
TABLE 3-8. HRVOC Emissions Control Project Costs .................................................................................... 26
TABLE 4-1. Comparison of HARC Project H76 Emissions to 2003 Actual HRVOC Emissions ...................... 31
TABLE 4-2. Comparison of HRVOC Projected Emissions to HRVOC Allowance Allocations......................... 32
TABLE 4-3. Comparison of Total HRVOC Projected Annual Emissions to Historical Reporting – Flares ....... 33
TABLE 4-4. Comparison of Total HRVOC Projected Annual Emissions to Historical Reporting – Cooling Towers ..................................................................................................................................................... 34
TABLE 4-5. HRVOC Monitoring Total Installed Cost ....................................................................................... 37
TABLE 4-6. Annual Operating Costs per HRVOC CEMS................................................................................ 38
TABLE 4-7. Cost per Process Vent Tested...................................................................................................... 39
TABLE 4-8. Cost Effectiveness of HRVOC Emission Reduction Measures .................................................... 40
TABLE C-1. Flare and Cooling Tower Equipment Listing .............................................................................. C-1
TABLE E-1. Summary of Suggested HRVOC Rule Improvements................................................................ E-1
HARC Project H76 vOctober 27, 2006
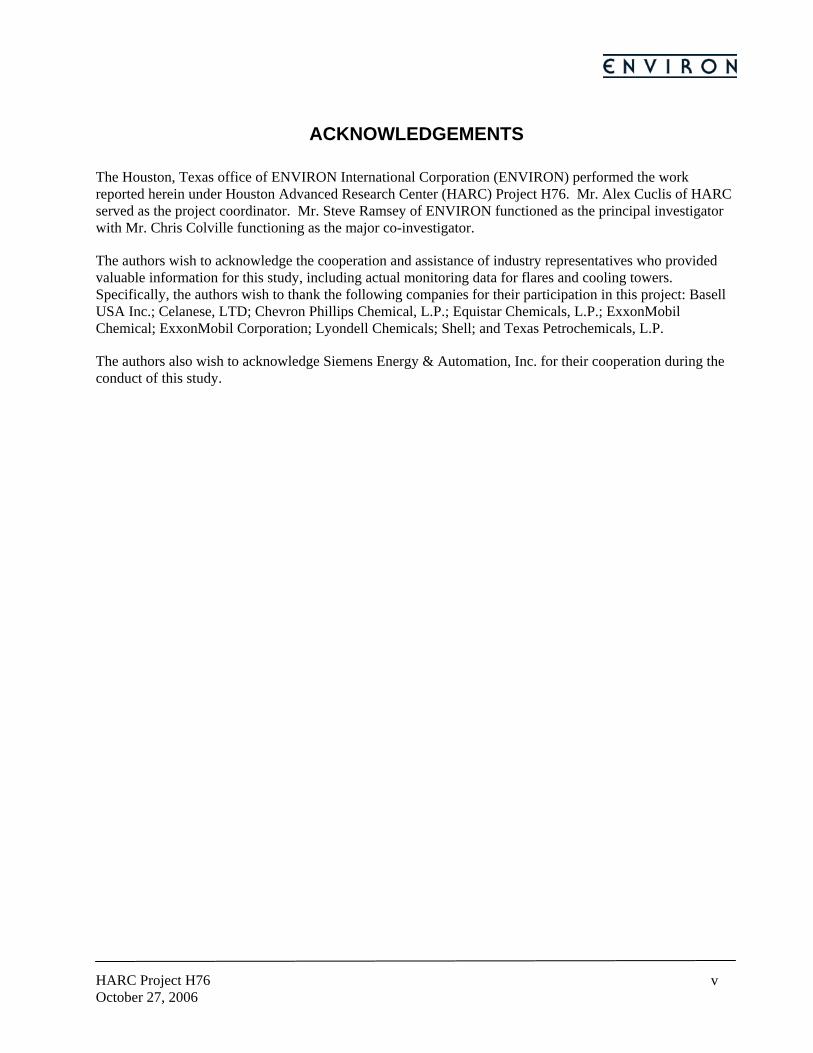
ACKNOWLEDGEMENTS
The Houston, Texas office of ENVIRON International Corporation (ENVIRON) performed the work reported herein under Houston Advanced Research Center (HARC) Project H76. Mr. Alex Cuclis of HARC served as the project coordinator. Mr. Steve Ramsey of ENVIRON functioned as the principal investigator with Mr. Chris Colville functioning as the major co-investigator.
The authors wish to acknowledge the cooperation and assistance of industry representatives who provided valuable information for this study, including actual monitoring data for flares and cooling towers. Specifically, the authors wish to thank the following companies for their participation in this project: Basell USA Inc.; Celanese, LTD; Chevron Phillips Chemical, L.P.; Equistar Chemicals, L.P.; ExxonMobil Chemical; ExxonMobil Corporation; Lyondell Chemicals; Shell; and Texas Petrochemicals, L.P.
The authors also wish to acknowledge Siemens Energy & Automation, Inc. for their cooperation during the conduct of this study.
HARC Project H76 ES-1October 27, 2006
EXECUTIVE SUMMARY
Project H76 Overview
In 2002, the Texas Commission on Environmental Quality (TCEQ) established the first set of regulations limiting emissions of highly reactive volatile organic compounds (HRVOC) via both long-term cap (HRVOC emissions cap and trade, or HECT program) and short-term emission limit. Modified in 2004, this program limits emissions from 51 affected facilities in Harris County, Texas, to collectively no more than 3,451.5 tons of HRVOC annually. It also limits emissions of HRVOC from any facility in Harris County to no more than 1,200 pounds in any one hour. Compliance with these limits is demonstrated through use of emission source testing, process knowledge and, in the case of most affected facilities, installation and operation of continuous emission monitor systems (CEMS) on flares and cooling towers.
In May 2006, the Houston Advanced Research Center (HARC) authorized ENVIRON to investigate the effectiveness of HRVOC monitoring as a control measure. Designated Project H76, the work involves a comprehensive quantitative and qualitative review and analysis of HRVOC emissions monitoring data for representative facilities that are located in Harris County and subject to both short- and long-term HRVOC emission limits. Among other anticipated outcomes, the primary goal of Project H76 is to provide insight into the effectiveness of monitoring as an emission control strategy.
Nine facilities representing eight companies participated in this study.
Basell USA – Bayport Plant
Celanese, LTD – Clear Lake Plant
Chevron Phillips Chemical Company, LP – Cedar Bayou Plant
ExxonMobil Chemical – Baytown Chemical and Baytown Olefins Plants
ExxonMobil Corporation – Baytown Refinery
Lyondell Chemicals / Equistar Chemicals, LP – Channelview Chemical Complex
Shell – Deer Park Plant (refinery and chemical plant)
Texas Petrochemicals, LP – Houston Plant
Collectively, these facilities represent 67.5% of the HRVOC allowance allocated to facilities in Harris County and they continuously monitor 41 flares and 50 cooling towers.
Study participants provided both quantitative monitoring data and qualitative HRVOC program implementation information in support of this study. This data and information were evaluated with respect to, among other items: monitoring implementation schedule and difficulties, actual emissions in comparison to HECT program allowance allocations, actual flare and cooling tower emissions in comparison to historical reported values, use of monitors to eliminate/reduce sources of HRVOC emissions, changes in practices resulting from use of HRVOC monitors, HRVOC emission control projects, costs and cost effectiveness, and use of remote sensing technologies.

HARC Project H76 ES-2October 27, 2006
Key Findings
The key findings of Project H76 investigations are as follows.
• For the nine facilities participating in the study, eight projects have been or are being implemented that, collectively, will reduce HRVOC emissions approximately 396 tons/year. This is equivalent to approximately 17% of the annual allowances allocated to the study participants as a group. As discussed in more detail within the body of this report, several of these projects were undertaken for other reasons, with HRVOC control being a secondary benefit. The largest project (as measured by capital cost) undertaken by the study participant group is designed to control unscheduled, episodic emissions for purposes of complying with the short-term, 1200 pound per hour HRVOC emission limit. Reductions in actual annual emissions that will result from this project have not been estimated.
• Collectively, HRVOC projected annual emissions from study participant facilities are less than HECT program allowance allocations. However, there is significant variability within the study group, with projected actual emissions ranging from 18% to 115% of annual allowance allocations.
• No study participant indicated that they are going to rely upon the purchase of allowances to cover actual emissions in excess of allocations. Instead, they are taking measures necessary to ensure that site and/or company allowance allocations are more than adequate to cover anticipated actual emissions.
• Some study participants have taken steps to use HRVOC monitoring data to improve operating and maintenance practices that may eventually may lead to a reduction in emissions. However, at this time, insufficient data is available to quantify any future emission reductions resulting from improved practices.
• HRVOC monitoring program implementation costs are higher than estimated during HRVOC rule development. For example, the average cost of an installed HRVOC monitor at the participating facilities is approximately $569,000. This compares to an estimate of $88,000 to $90,000 presented in the 2002 HRVOC rule development documents. Actual source testing costs and estimated annual operation and maintenance costs are also higher than estimated during rule development.
• Insufficient data is available at this time to evaluate economic benefits resulting from the recovery and sale or reuse of materials that would have otherwise been emitted or flared.
• Use of remote sensing to identify and reduce and/or eliminate sources of HRVOC and other emissions has already demonstrated specific economic and environmental value.
• Data collected by the Houston Regional Monitoring Corporation indicates a significant reduction in annual average HRVOC concentrations along the Houston Ship Channel between 2003 and 2005. ENVIRON discusses in the Analysis section of this report the potential reasons for this reduction; however, to the best of our knowledge, no investigation into the actual causes has been conducted.
• HRVOC emissions to atmosphere from flares are estimated by assuming a destruction efficiency. Even a modest variation in actual flare performance relative to assumed performance could significantly impact actual versus reported emissions.
In addition to the key findings, ENVIRON identified the following best management practices among study participants.
• Early engagement in the regulatory development and stakeholder process.
• Allocate sufficient resources in a timely fashion. Ideally the regulations should allow for a two year
HARC Project H76 ES-3October 27, 2006
implementation schedule.
• Leverage existing environmental data management systems or implement systems that have been used successfully in similar applications at other sites.
• Access to a sufficient number of skilled analyzer technicians and/or engineers.
• Active use of HRVOC monitoring data to improve operations and maintenance practices. Ultimately, this should result in improved environmental and economic performance.
• Greater use of remote sensing technologies to find and fix sources of HRVOC and other VOC emissions. One study participant claims that the payback on the purchase of infrared cameras has been less than four months.
Recommendations
ENVIRON offers the following recommends with respect to Project H76 findings.
• Further study once at least two years of monitoring data is available to evaluate trends and develop more detailed cost-effectiveness estimates.
• Investigate the underlying causes for the observed 36% decrease in Houston Ship Channel HRVOC concentrations between 2003 and 2005.
• Continue the investigations initiated by URS Corporation and the University of Houston in 2004 with respect to flare performance. Specifically, through use of remote sensing technologies, investigate in-field destruction efficiency of flares under a variety of operating and meteorological conditions.
• Continued investigation of opportunities for use of remote sensing to identify sources of emissions for use in developing cost-effective, source-specific reduction strategies.
HARC Project H76 1October 27, 2006
1. INTRODUCTION
1.1 Background on the Regulation of HRVOC1
As part of the effort to demonstrate attainment with the one-hour ozone ambient air quality standard, in December 2000 the Texas Commission on Environmental Quality (TCEQ) adopted regulations that mandated a collective 90% reduction in emissions of nitrogen oxides (NOX) from stationary combustion sources in the eight-county Houston/Galveston Area (HGA). In January 2001, the Business Coalition for Clean Air – Appeal Group (BCCA-AG) and several regulated companies challenged the December 2000 State Implementation Plan (SIP) and some of the associated rules. Specifically, the BCCA-AG challenged the 90% NOX emission reduction requirement from stationary sources in HGA. In June 2001 a Consent Order was signed, committing the TCEQ to perform an investigation of the causes of rapid ozone formation events and identify potential mitigating measures.
In compliance with the consent order, the TCEQ conducted an investigation based in large part on data collected during the course of the Texas 2000 Air Quality Study (TexAQS). A comprehensive research project studying ground-level ozone formation in the HGA and East Texas, TexAQS was conducted in August and September 2000 by more than 200 scientists from over 40 research organizations at a cost of more than $20 million. Major findings of TexAQS included:
• Emissions of volatile organic compounds (VOC) were, most likely, understated in earlier emission inventories; with some reports indicating VOC emissions 3-15 times higher than expected. The source of these emissions have been attributed by some to routine operations while others claim the primary source is episodic events such as plant upsets and turnarounds.
• Aircraft flights in the Houston area found that ozone plumes almost without exception had their origin in the Houston Ship Channel area.
• Houston was able to create ozone at a faster rate than any other U.S. city. This was attributed to emissions of highly reactive VOC, or HRVOC.
To address these findings and fulfill obligations resulting from the BCCA-AG settlement, the TCEQ focused on substituting industrial VOC controls for the last 10% of stationary source NOX emission reductions.
Photochemical modeling indicated that that same air quality benefit could be achieved by an 80% reduction in NOX emissions and targeted VOC emission reductions as would be realized with a 90% reduction in stationary source NOX emissions. These same modeling analyses showed that four HRVOC are important in the rapid formation of ozone along the Houston Ship Channel: ethylene, propylene, 1,3-butadiene and butenes. It was determined that these pollutants were the best candidates for additional controls.
In December 2002 the TCEQ adopted the first set of HRVOC regulations. These regulations established an annual cap on emissions from flares, cooling towers and process vents as well as more stringent requirements for the monitoring and repair of fugitive emission sources. A major revision to the HRVOC rules was adopted in December 2004.
1 Information in this section is derived extensively from TCEQ document Post-1999 Rate-of-Progress and Attainment Demonstration Follow-Up SIP for the Houston/Galveston Ozone Nonattainment Area, Rule Log No. 2002-046a-SIP-AI, December 13, 2002.
HARC Project H76 2October 27, 2006
1.2 Overview of HRVOC Emission Control Program
Highly reactive volatile organic compounds (HRVOC) are currently defined as ethylene, propylene, 1,3-butadiene and all isomers of butene in Harris County, Texas. The definition is limited to ethylene and propylene in the other seven counties that constitute the Houston-Galveston-Brazoria (HGB) nonattainment area, specifically: Brazoria, Chambers, Fort Bend, Galveston, Liberty, Montgomery and Waller counties.
Affected facilities are those that emit, or have the potential to emit, HRVOC. Program requirements published in 30 TAC 115, Subchapter H, include:
• Monitoring of HRVOC emissions from process vents, flares, and cooling towers as specified in §§115.725 and 115.764.
• Implementing the fugitive emissions monitoring and control requirements of Division 3.
• Compliance with the HRVOC emissions cap and trade (HECT) programs described in 30 TAC Chapter 101, Subchapter H, Division 6 (Harris County only).
• Compliance with the 1,200 pounds per hour short-term emission limit (Harris County only).
Affected facilities in Harris County, Texas, were required to install and begin operation of continuous emission monitors on certain sources of highly reactive volatile organic compounds (HRVOC) by the end of January 2006.
The purpose of these monitors is two-fold. The TCEQ states in several rule development documents that the intent of the monitoring program is to gain a better understanding of the sources and magnitudes of HRVOC emissions. With respect to regulated facilities, however, the monitors are used to demonstrate compliance with the HECT program cap and the short-term emission limit. As such, the monitors are an integral part of efforts to limit emissions of HRVOC from industrial sources. In advance of the compliance dates – April 1, 2006, for the short-term limit and January 1, 2007, for the start of the first cap-and-trade compliance period – it is anticipated that affected facilities will use monitor data to identify and quantify sources of HRVOC emissions. This data is necessary for the development of site-wide compliance strategies.
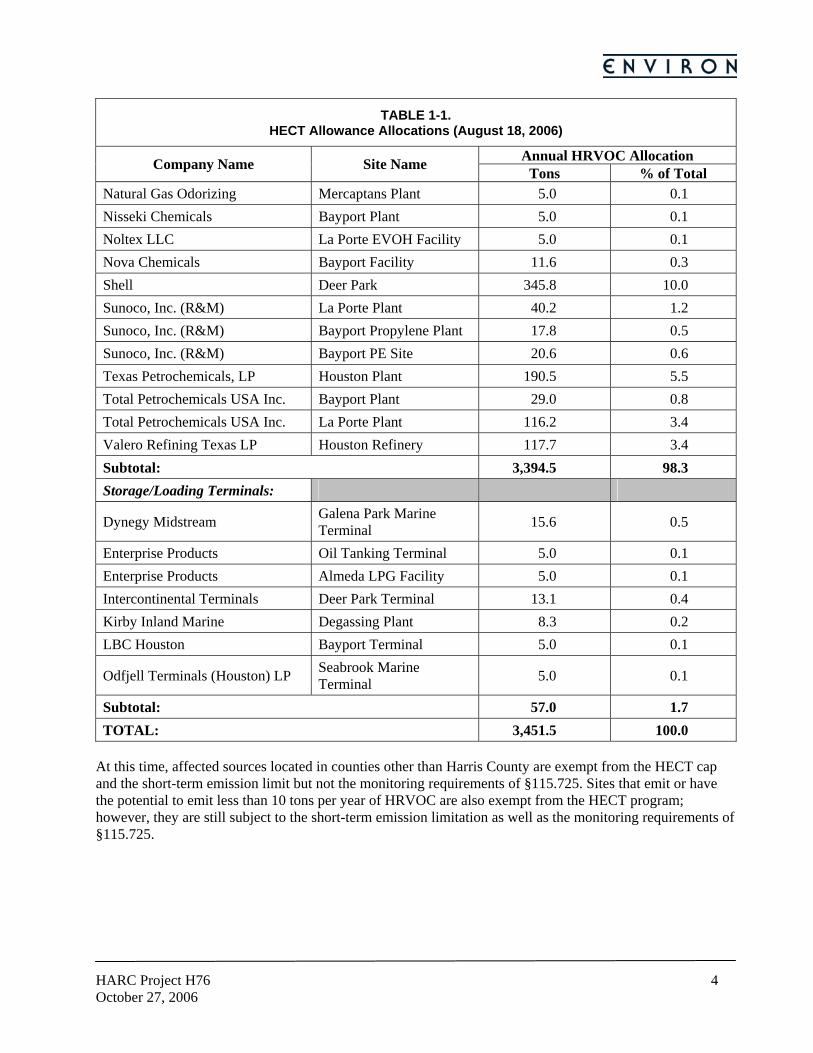
Affected sources are allocated HECT allowances based on certified level of activity during a baseline period. On August 18, 2006, the TCEQ published a list of HECT allowance allocations. A total of 51 sites were allocated 3,451.5 tons of HRVOC. Allowance allocations are shown in Table 1-1.
TABLE 1-1. HECT Allowance Allocations (August 18, 2006)
Annual HRVOC Allocation Company Name Site Name Tons % of Total Manufacturing Facilities: Albemarle Corporation Houston Plant 5.0 0.1 American Acryl, LP Pasadena Plant 5.8 0.2 Basell USA Inc. Bayport Plant 74.1 2.2 BASF Corporation Pasadena Plant 8.5 0.2
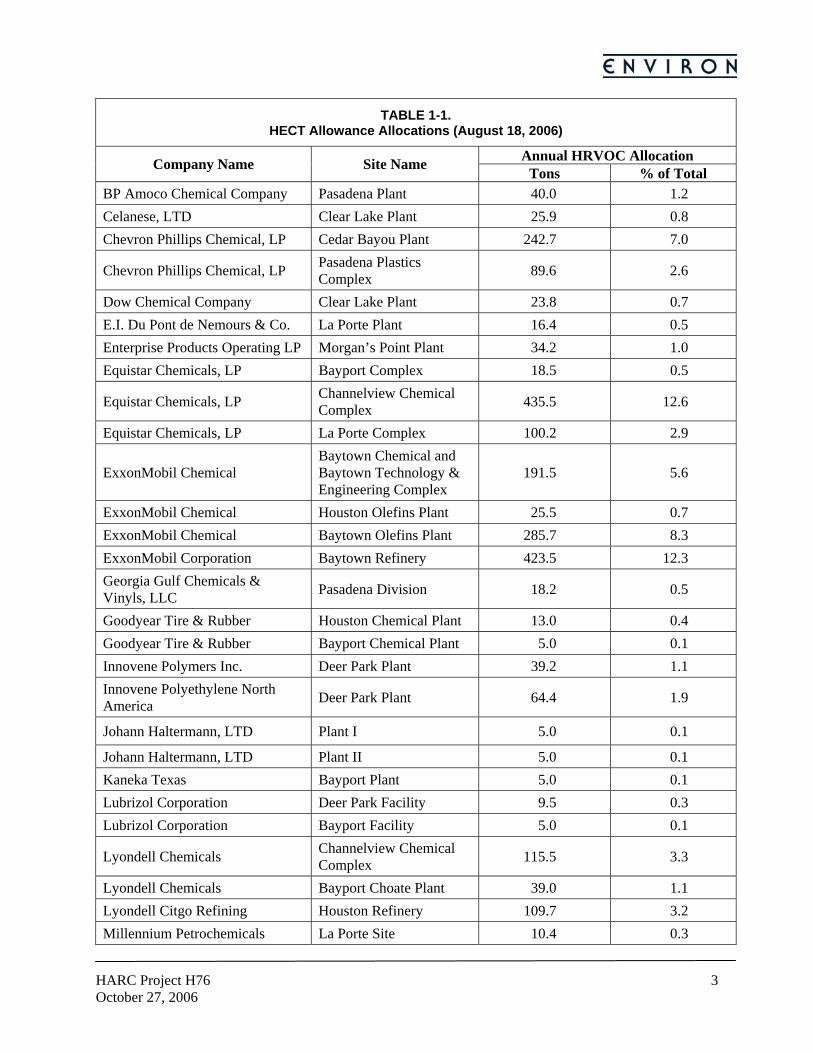
HARC Project H76 3October 27, 2006
TABLE 1-1. HECT Allowance Allocations (August 18, 2006)
Annual HRVOC Allocation Company Name Site Name Tons % of Total BP Amoco Chemical Company Pasadena Plant 40.0 1.2 Celanese, LTD Clear Lake Plant 25.9 0.8 Chevron Phillips Chemical, LP Cedar Bayou Plant 242.7 7.0
Chevron Phillips Chemical, LP Pasadena Plastics Complex 89.6 2.6
Dow Chemical Company Clear Lake Plant 23.8 0.7 E.I. Du Pont de Nemours & Co. La Porte Plant 16.4 0.5 Enterprise Products Operating LP Morgan’s Point Plant 34.2 1.0 Equistar Chemicals, LP Bayport Complex 18.5 0.5
Equistar Chemicals, LP Channelview Chemical Complex 435.5 12.6
Equistar Chemicals, LP La Porte Complex 100.2 2.9
ExxonMobil Chemical Baytown Chemical and Baytown Technology & Engineering Complex
191.5 5.6
ExxonMobil Chemical Houston Olefins Plant 25.5 0.7 ExxonMobil Chemical Baytown Olefins Plant 285.7 8.3 ExxonMobil Corporation Baytown Refinery 423.5 12.3 Georgia Gulf Chemicals & Vinyls, LLC Pasadena Division 18.2 0.5
Goodyear Tire & Rubber Houston Chemical Plant 13.0 0.4 Goodyear Tire & Rubber Bayport Chemical Plant 5.0 0.1 Innovene Polymers Inc. Deer Park Plant 39.2 1.1 Innovene Polyethylene North America Deer Park Plant 64.4 1.9
Johann Haltermann, LTD Plant I 5.0 0.1
Johann Haltermann, LTD Plant II 5.0 0.1 Kaneka Texas Bayport Plant 5.0 0.1 Lubrizol Corporation Deer Park Facility 9.5 0.3 Lubrizol Corporation Bayport Facility 5.0 0.1
Lyondell Chemicals Channelview Chemical Complex 115.5 3.3
Lyondell Chemicals Bayport Choate Plant 39.0 1.1 Lyondell Citgo Refining Houston Refinery 109.7 3.2 Millennium Petrochemicals La Porte Site 10.4 0.3
HARC Project H76 4October 27, 2006
TABLE 1-1. HECT Allowance Allocations (August 18, 2006)
Annual HRVOC Allocation Company Name Site Name Tons % of Total Natural Gas Odorizing Mercaptans Plant 5.0 0.1 Nisseki Chemicals Bayport Plant 5.0 0.1 Noltex LLC La Porte EVOH Facility 5.0 0.1 Nova Chemicals Bayport Facility 11.6 0.3 Shell Deer Park 345.8 10.0 Sunoco, Inc. (R&M) La Porte Plant 40.2 1.2 Sunoco, Inc. (R&M) Bayport Propylene Plant 17.8 0.5 Sunoco, Inc. (R&M) Bayport PE Site 20.6 0.6 Texas Petrochemicals, LP Houston Plant 190.5 5.5 Total Petrochemicals USA Inc. Bayport Plant 29.0 0.8 Total Petrochemicals USA Inc. La Porte Plant 116.2 3.4 Valero Refining Texas LP Houston Refinery 117.7 3.4 Subtotal: 3,394.5 98.3 Storage/Loading Terminals:
Dynegy Midstream Galena Park Marine Terminal 15.6 0.5
Enterprise Products Oil Tanking Terminal 5.0 0.1 Enterprise Products Almeda LPG Facility 5.0 0.1 Intercontinental Terminals Deer Park Terminal 13.1 0.4 Kirby Inland Marine Degassing Plant 8.3 0.2 LBC Houston Bayport Terminal 5.0 0.1
Odfjell Terminals (Houston) LP Seabrook Marine Terminal 5.0 0.1
Subtotal: 57.0 1.7 TOTAL: 3,451.5 100.0
At this time, affected sources located in counties other than Harris County are exempt from the HECT cap and the short-term emission limit but not the monitoring requirements of §115.725. Sites that emit or have the potential to emit less than 10 tons per year of HRVOC are also exempt from the HECT program; however, they are still subject to the short-term emission limitation as well as the monitoring requirements of §115.725.
HARC Project H76 5October 27, 2006
1.3 Overview of HARC Project H76
In May 2006, the Houston Advanced Research Center (HARC) authorized ENVIRON to execute and deliver the scope of work defined in a proposal submitted earlier in the year to investigate the effectiveness of HRVOC monitoring as a control measure. Designated Project H76, the work involves a comprehensive quantitative and qualitative review and analysis of HRVOC emissions monitoring data for representative facilities that are located in Harris County and subject to both short- and long-term HRVOC emission limits. The anticipated outcomes of this project included the following.
• Insight into the effectiveness of monitoring as a tool in developing compliance strategies.
• Identify how monitored HRVOC emissions deviate from reported emissions prior to installation of emission monitoring systems.
• Comparison of monitored HRVOC emissions to HECT allowance allocations.
• Identify the costs of implementing HRVOC monitoring requirements, including capital and operating costs for continuous emission monitoring systems, source testing costs, data acquisition and management costs, and program administration costs.
• If possible, quantify the reduction in lost raw materials and products, if any, and the associated economic value.
• Qualitative assessment of how the HRVOC program changed awareness of potential sources of emissions and the responses, if any, to a changed awareness.
• Insight into the use, findings and response of infrared cameras and other remote sensing technologies.
• Actions taken by study participants to comply with the HECT and short-term HRVOC emission limits such as: − Enhanced inspection and maintenance activities, − Equipment replacements and upgrades, − Investments in new and/or modified emission control systems, and − Changes in operating procedures and practices
• Identify best management and program implementation practices

HARC Project H76 6October 27, 2006
2. STUDY METHODOLOGY
2.1 Study Team Formation
In consultation with HARC, it was determined that to properly evaluate the effectiveness of HRVOC emission monitoring as a control strategy, a minimum of eight affected facilities that collectively monitor a minimum of 12 flares and 12 cooling towers would need to be included in the study. These facilities would need to be representative of those most affected by the HRVOC rules: facilities that manufacture as a primary product one or more HRVOC, use one or more HRVOC as a primary raw material, and/or handle large quantities of HRVOC. ENVIRON’s first task was to assemble a study team that met these criteria.
The following eight companies generously agreed to allow at least one of their facilities to participate in this study.
• Basell USA – Bayport Plant
• Celanese, LTD – Clear Lake Plant
• Chevron Phillips Chemical Company, LP – Cedar Bayou Plant
• ExxonMobil Chemical – Baytown Chemical and Baytown Olefins Plants
• ExxonMobil Corporation – Baytown Refinery
• Lyondell Chemicals / Equistar Chemicals, LP – Channelview Chemical Complex
• Shell – Deer Park Plant (refinery and chemical plant)
• Texas Petrochemicals, LP – Houston Plant
Collectively, these facilities represent 67.5% of the HRVOC allowances allocated to facilities in Harris County and monitor 41 flares and 50 cooling towers.
As a condition of participation, ENVIRON agreed to maintain the confidentiality of information shared by study participants by blinding the study. To the extent possible, information collected during the course of this investigation is presented so that it cannot be associated with any specific participating company or facility.
Additional information on the participant companies and facilities is included in Appendix A.
2.2 Data Acquisition
ENVIRON worked closely with each study team participant to identify the available information and then to collect, compile and analyze the information for inclusion in this findings report. Quantitative information sought included:
• HRVOC emissions monitoring data, including the mass of emissions as well as any temporal variation in emissions. Specifically requested were hourly emission rates for speciated and total HRVOC for each affected flare, cooling tower and process vent. [It is noted that some study participants declined to share monitoring data due to: difficulties in extracting and reporting data, difficulties encountered during startup of data management systems, concerns about impact on future
HARC Project H76 7October 27, 2006
HRVOC allocation methods, and/or concerns about impacts on the pricing of allowance futures.]
• Where continuous monitoring is not used, speciated worst-case HRVOC emission estimates from process vents, flares and cooling towers as determined by one-time source testing.
• Pre-monitoring baseline emission estimates as reported in the facility’s annual air emission inventories filed with the Texas Commission on Environmental Quality (TCEQ). The purpose of this information is to compare historical reported emissions with actual emissions determined through continuous monitoring or one-time worst-case source testing.
• HECT program allowance allocations.
• Continuous monitoring system cost data including total installed costs (monitors, instrumentation, housing, testing, calibration, etc.) as well as annual operating and maintenance costs.
• One-time source testing costs.
• HRVOC data management system costs including hardware, software, and implementation expenses as well as annual maintenance costs.
ENVIRON also sought information on how the study team participants are using and responding to the HRVOC monitoring findings. For example:
• Instances of finding and eliminating and/or reducing emissions as a result of the HRVOC monitoring program.
• Identification of HRVOC emission reduction measures that have been implemented or will be implemented prior to the first HECT compliance period (starting January 1, 2007).
• Reductions in emissions that have been realized or that the study participant expects to realize by January 1, 2007.
• The economic value of materials recovered, if any, as a direct result of the HRVOC emissions monitoring program.
• Itemized capital and operating costs for implementation of HRVOC emission reduction measures.
• Employee and contractor education and training programs.
Also sought was information on the more qualitative aspects of the HRVOC monitoring program such as how monitoring has affected general awareness of HRVOC emissions and environmental performance in general, difficulties encountered during program implementation, changes in operating practices and procedures (including management of emission events), use and findings of remote sensing technologies, etc. This information was obtained through a series of employee interviews at each of the participating facilities. The survey used to guide these discussions is included as Appendix B.
Note that the quantitative information provided by study participants has not been audited for completeness and/or accuracy.
2.3 Analysis & Reporting
Using the HRVOC monitoring data provided by facilities, ENVIRON performed the following analyses, the results of which are reported herein:
• Sources, magnitudes and temporal variation of HRVOC emissions.
• Comparison of projected annual HRVOC emissions to HRVOC allocations.
HARC Project H76 8October 27, 2006
• Comparison of projected flare and cooling tower HRVOC emissions to historically reported emissions.
Using the cost data provided by facilities, ENVIRON derived the following:
• Total cost per installation (i.e., on-line analyzer).
• Annual operating cost per installation.
• Cost per process vent tested.
• Cost-effectiveness of HRVOC emission reduction measures.
Based on the more qualitative data provided by facilities, ENVIRON determined what, in our opinion, constitutes best management practices related to the HRVOC monitoring program.

HARC Project H76 9October 27, 2006
3. COLLECTED DATA & INFORMATION
ENVIRON collected data from study participants as described in the Study Methodology section of this report. Study participants provided both qualitative and quantitative data as summarized herein. This data represents the initial findings of the HRVOC monitoring program at each participating facility.
3.1 Continuous Emission Monitoring Systems
ENVIRON surveyed nine affected facilities in Harris County. Collectively, these facilities have installed continuous emission monitoring systems (CEMS) on 41 flares and 50 cooling towers. A CEMS consists of the on-line analyzer, associated flow monitor, and temperature and pressure monitors (flares only). Two facilities have, collectively, six cooling towers for which no on-line analyzer is installed because design capacity is less than 8,000 gallons per minute (gpm). As allowed by regulation, grab samples are used to determine HRVOC concentrations in the cooling water returns. Facilities determine the speciated strippable HRVOC concentration by collecting samples from each cooling water return at least once per month in accordance with the air-stripping method in Appendix P.2
The CEMS interacts with other facility systems. In most cases, the CEMS is connected to the plant distributed control system (DCS). A DCS is a process control system that uses a network to interconnect sensors, controllers, operator terminals and actuators. The DCS is connected to the facility HRVOC data management system typically through the plant data historian (Note: HRVOC data management systems are discussed in detail under the heading “HRVOC Data Management”). A diagram showing the general flow of data between the CEMS, the DCS, data historian and the HRVOC data management system is presented in Figure 3-1.
FIGURE 3-1. Schematic of CEMS Interactions with Facility Systems
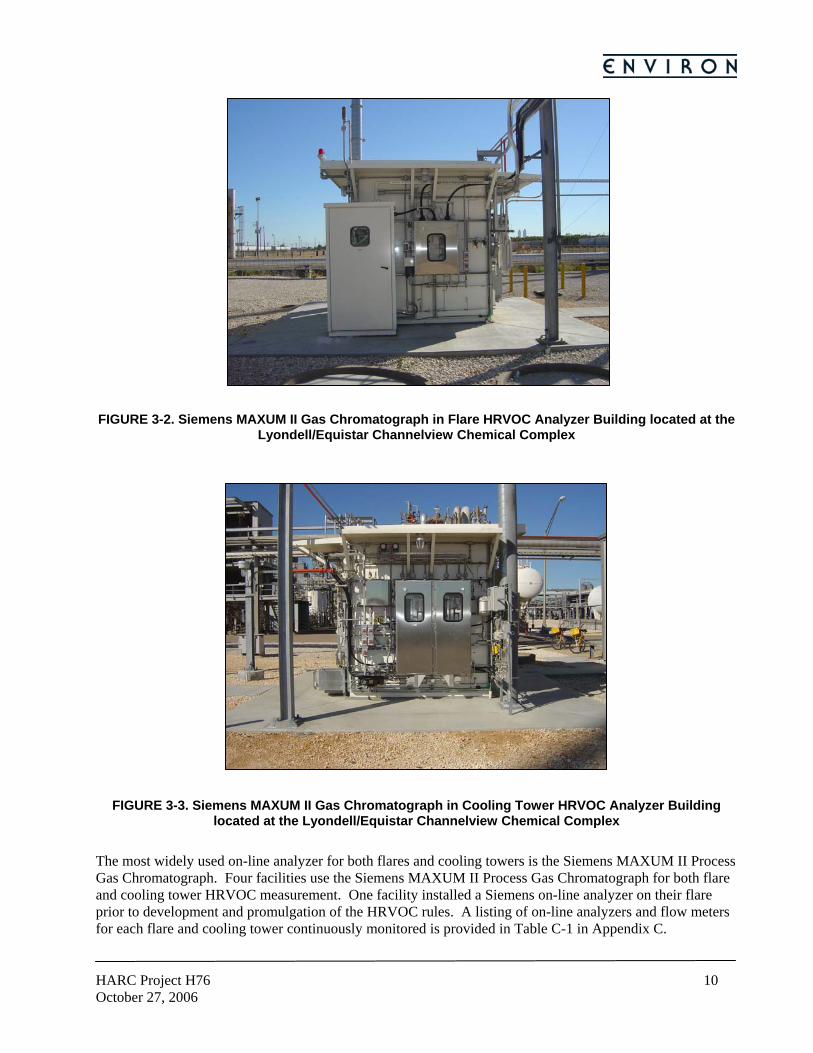
Photographs of a typical CEMS installation are presented as Figures 3-2 and 3-3.
2 Texas Commission on Environmental Quality, Sampling Procedures Manual: Appendix P Cooling Tower Monitoring, January 2003.
HRVOC CEMS
Distributed Control System
Plant Data Historian
Data Data Data
HRVOC Data
Management System
HARC Project H76 10October 27, 2006
FIGURE 3-2. Siemens MAXUM II Gas Chromatograph in Flare HRVOC Analyzer Building located at the
Lyondell/Equistar Channelview Chemical Complex
FIGURE 3-3. Siemens MAXUM II Gas Chromatograph in Cooling Tower HRVOC Analyzer Building located at the Lyondell/Equistar Channelview Chemical Complex
The most widely used on-line analyzer for both flares and cooling towers is the Siemens MAXUM II Process Gas Chromatograph. Four facilities use the Siemens MAXUM II Process Gas Chromatograph for both flare and cooling tower HRVOC measurement. One facility installed a Siemens on-line analyzer on their flare prior to development and promulgation of the HRVOC rules. A listing of on-line analyzers and flow meters for each flare and cooling tower continuously monitored is provided in Table C-1 in Appendix C.
HARC Project H76 11October 27, 2006
While the Siemens MAXUM II Process Gas Chromatograph is the most common on-line analyzer employed by the surveyed facilities, other brands are also used at affected facilities. One facility uses the Yokogawa GC 1000 Mark II series gas chromatograph on their cooling tower inlets. Another facility uses a Rosemount Analytical Inc. (Rosemount) on-line analyzer on their flare header and Process Analytical Applications, Inc. (PAAI) total VOC monitors on their cooling tower inlets.
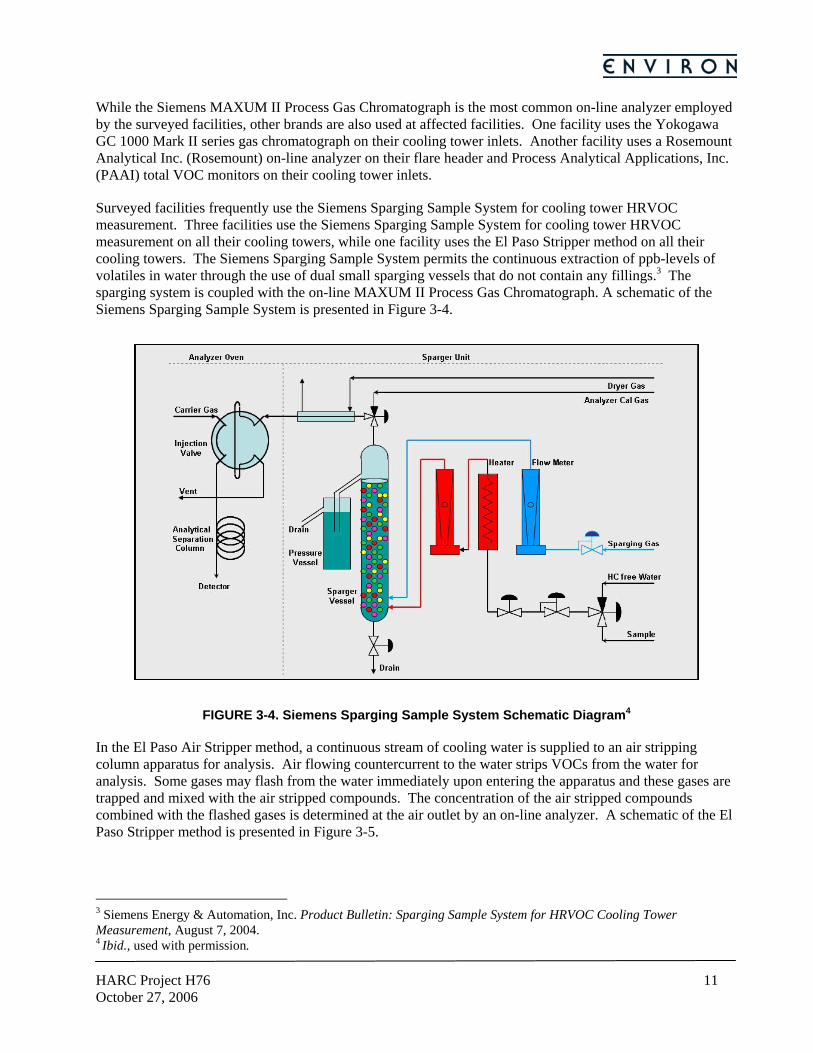
Surveyed facilities frequently use the Siemens Sparging Sample System for cooling tower HRVOC measurement. Three facilities use the Siemens Sparging Sample System for cooling tower HRVOC measurement on all their cooling towers, while one facility uses the El Paso Stripper method on all their cooling towers. The Siemens Sparging Sample System permits the continuous extraction of ppb-levels of volatiles in water through the use of dual small sparging vessels that do not contain any fillings.3 The sparging system is coupled with the on-line MAXUM II Process Gas Chromatograph. A schematic of the Siemens Sparging Sample System is presented in Figure 3-4.
FIGURE 3-4. Siemens Sparging Sample System Schematic Diagram4
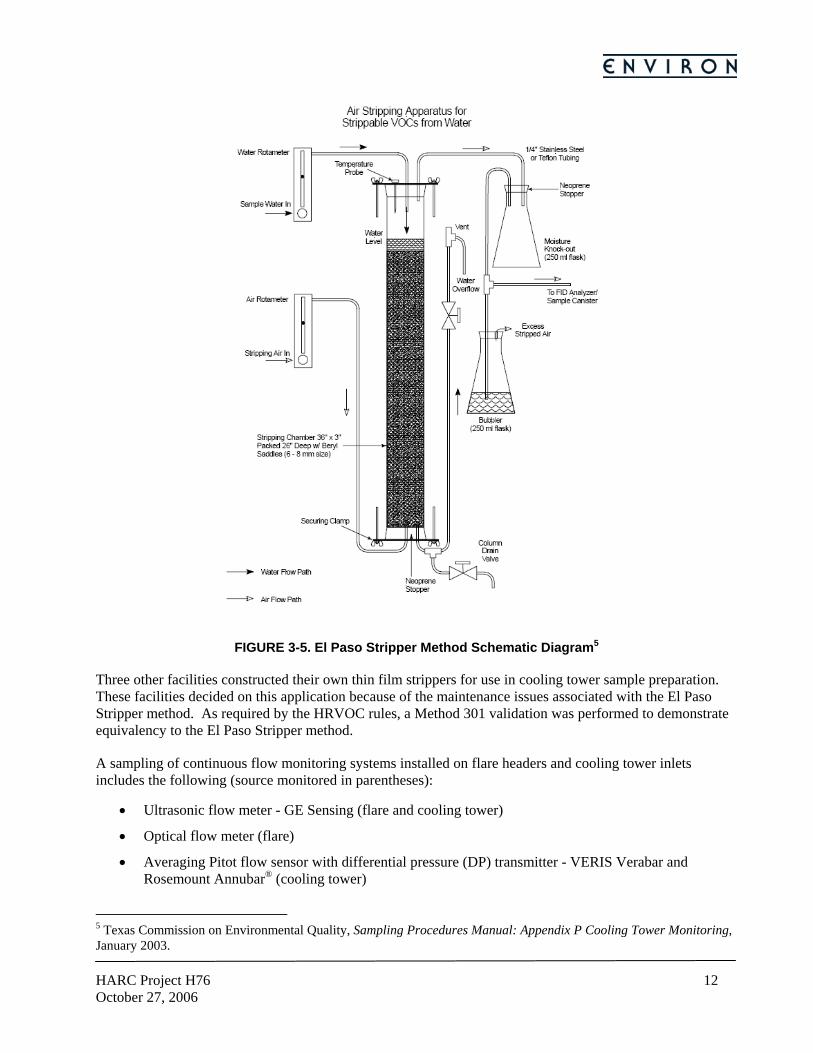
In the El Paso Air Stripper method, a continuous stream of cooling water is supplied to an air stripping column apparatus for analysis. Air flowing countercurrent to the water strips VOCs from the water for analysis. Some gases may flash from the water immediately upon entering the apparatus and these gases are trapped and mixed with the air stripped compounds. The concentration of the air stripped compounds combined with the flashed gases is determined at the air outlet by an on-line analyzer. A schematic of the El Paso Stripper method is presented in Figure 3-5.
3 Siemens Energy & Automation, Inc. Product Bulletin: Sparging Sample System for HRVOC Cooling Tower Measurement, August 7, 2004. 4 Ibid., used with permission.
HARC Project H76 12October 27, 2006
FIGURE 3-5. El Paso Stripper Method Schematic Diagram5
Three other facilities constructed their own thin film strippers for use in cooling tower sample preparation. These facilities decided on this application because of the maintenance issues associated with the El Paso Stripper method. As required by the HRVOC rules, a Method 301 validation was performed to demonstrate equivalency to the El Paso Stripper method.
A sampling of continuous flow monitoring systems installed on flare headers and cooling tower inlets includes the following (source monitored in parentheses):
• Ultrasonic flow meter - GE Sensing (flare and cooling tower)
• Optical flow meter (flare)
• Averaging Pitot flow sensor with differential pressure (DP) transmitter - VERIS Verabar and Rosemount Annubar® (cooling tower)
5 Texas Commission on Environmental Quality, Sampling Procedures Manual: Appendix P Cooling Tower Monitoring, January 2003.

HARC Project H76 13October 27, 2006
GE Sensing (formerly GE Panametrics) flow meters are commonly used by surveyed facilities for flare and cooling tower flow measurement. ENVIRON reviewed the DigitalFlowTM GF868 product bulletin for a description of the GE Sensing technology.6 GE Sensing uses an ultrasonic flow measurement technique consisting of all-metal ultrasonic transducers installed in the pipe. These transducers send sound pulses upstream and downstream through the gas/liquid. The DigitalFlow GF868’s on-board computer calculates velocity and volumetric and mass flow rate based on the difference in the transit times, with and against the flow. The on-board computer uses temperature and pressure inputs to correct the flow to standard flow for flares.
One facility uses an optical flow meter for flare flow measurement on some of its flares. Optical flow meters measure gas flow using optical sensors. One example is the PHOTON CONTROL Focus® Probe.7 This technology uses laser beams to measure the gas flow by sensing the velocity of microscopic particulates naturally occurring in the gas.
The VERIS Verabar technology is an averaging pitot flow sensor that measures differential pressure to calculate flow rate.8 The fluid, in this case the cooling water, impacts the front of the sensor, creating a high-pressure zone. As the fluid moves past the sensor, it accelerates and creates a low-pressure zone to the side and rear of the sensor. Multiple ports are located in the high and low-pressure zones allowing for the determination of the average differential pressure. The Rosemount Annubar® technology is also an averaging pitot flow sensor with DP transmitter. Though different in design, the Rosemount Annubar® is based on the same principles as the VERIS Verabar technology.9
Currently, no surveyed facilities have installed continuous emission monitors (CEMS) on any process vents.
3.2 Implementation Schedules
The time required for HRVOC program implementation varied significantly among surveyed facilities. Study participants provided information related to project management, including delivery, installation, and reliability schedules for the implementation of the HRVOC monitoring program.
Delivery times for the components of the CEMS’s were relatively constant, ranging from three to four months. With respect to the time it took to progress from initial startup to reliable collection of good quality data, study participants reported much greater variability. Examples follow.
• For a facility that installed seven on-line analyzer systems, the on-line analyzers were obtaining reliable data within five to six months of installation. Monitors were installed in June 2005 and fully operational by January 2006. During this implementation period, one instrument technician spent 40+ hours per week on the on-line analyzer systems.
• For a facility that installed three on-line analyzer systems, the on-line analyzers were obtaining reliable data within one to two months of installation. The facility installed these monitors in late 2005. Because the facility does not monitor speciated HRVOC on its cooling towers, the equipment vendor had to customize the application, which caused an approximately one month delay on the back-end of implementation.
• For a larger facility that installed 17 on-line analyzers, startup times ranged from two days to two
6 GE Sensing, Digital FlowTM GF868 Panametrics Ultrasonic Flare Gas Flowmeter, 2005. 7 Photon Control Inc., Focus® Probe Optical Gas Flowmeter, 2006. 8 http://www.veris-inc.com/verabar_how.asp 9 http://www.emersonprocess.com/rosemount/products/flow/m485ann.html
HARC Project H76 14October 27, 2006
weeks. The facility installed the monitors between August and December 2005.
3.3 Monitoring Data
One of the key elements in evaluating the effectiveness of the HRVOC monitoring program as a control strategy is a thorough review of available monitoring data. Realizing that the HRVOC monitoring program is still in its early stages, this data may still provide valuable insight into the sources and magnitude of emissions, the temporal variability in emissions and the accuracy of previously reported HRVOC emissions.
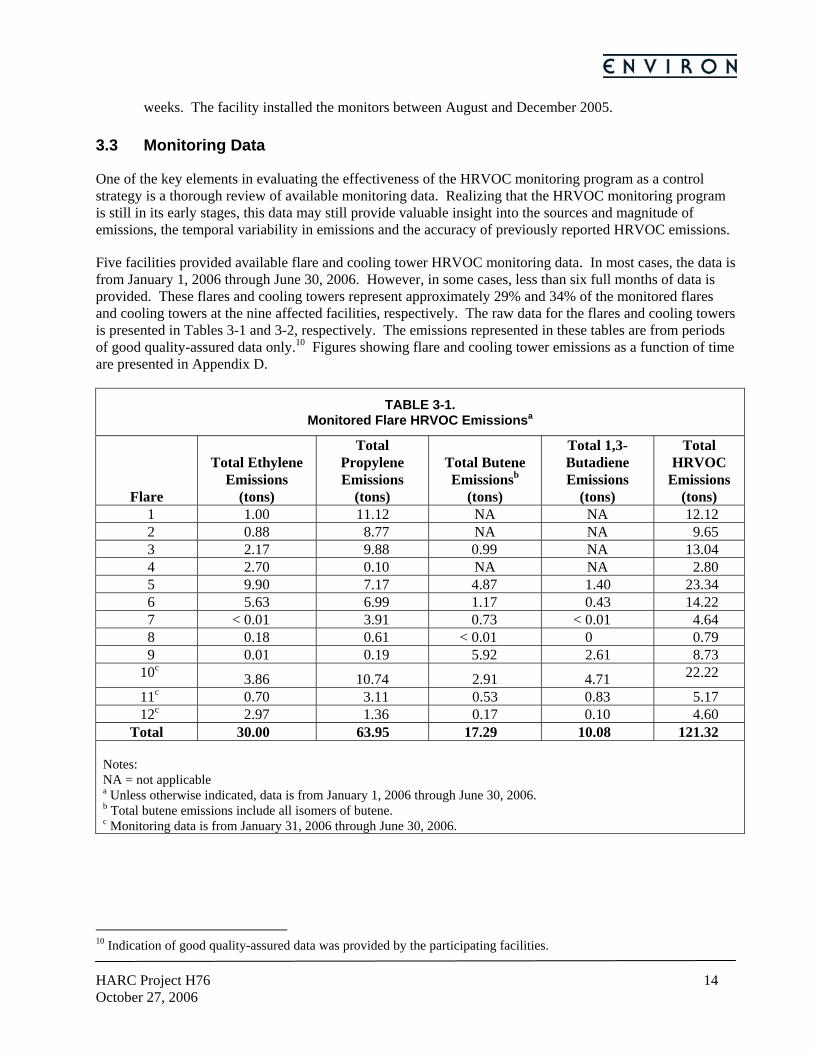
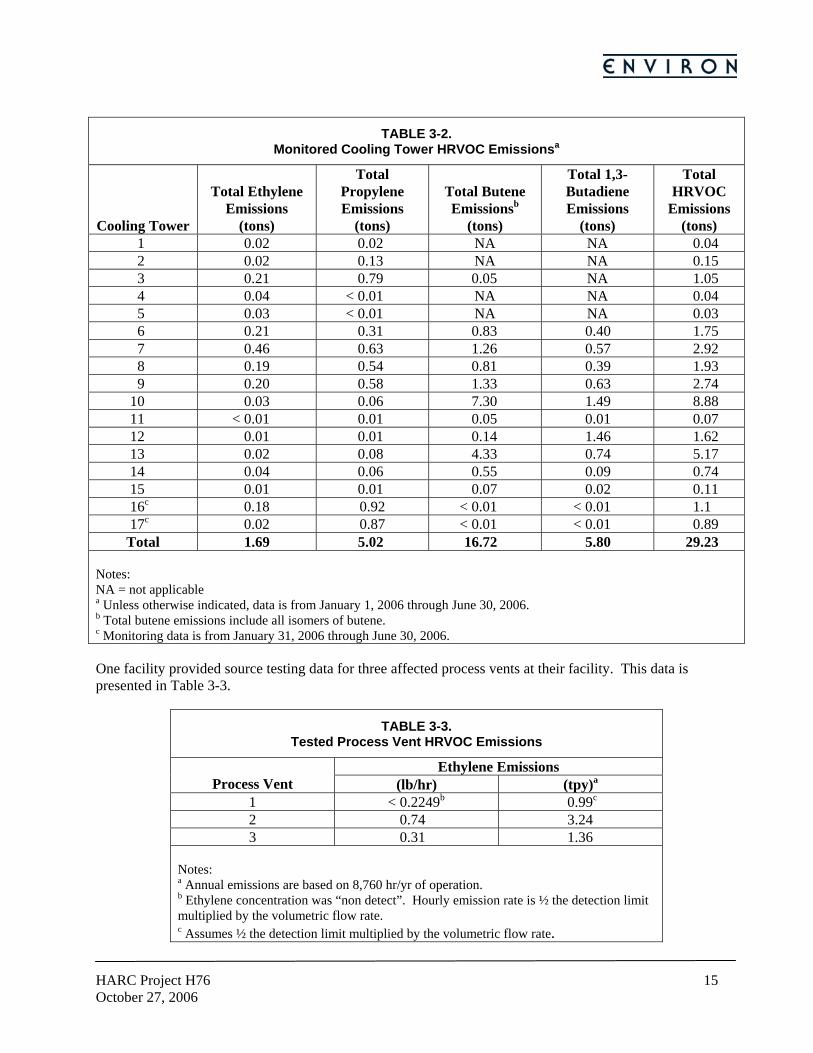
Five facilities provided available flare and cooling tower HRVOC monitoring data. In most cases, the data is from January 1, 2006 through June 30, 2006. However, in some cases, less than six full months of data is provided. These flares and cooling towers represent approximately 29% and 34% of the monitored flares and cooling towers at the nine affected facilities, respectively. The raw data for the flares and cooling towers is presented in Tables 3-1 and 3-2, respectively. The emissions represented in these tables are from periods of good quality-assured data only.10 Figures showing flare and cooling tower emissions as a function of time are presented in Appendix D.
TABLE 3-1. Monitored Flare HRVOC Emissionsa
Flare
Total Ethylene Emissions
(tons)
Total Propylene Emissions
(tons)
Total Butene Emissionsb
(tons)
Total 1,3-Butadiene Emissions
(tons)
Total HRVOC
Emissions (tons)
1 1.00 11.12 NA NA 12.12 2 0.88 8.77 NA NA 9.65 3 2.17 9.88 0.99 NA 13.04 4 2.70 0.10 NA NA 2.80 5 9.90 7.17 4.87 1.40 23.34 6 5.63 6.99 1.17 0.43 14.22 7 < 0.01 3.91 0.73 < 0.01 4.64 8 0.18 0.61 < 0.01 0 0.79 9 0.01 0.19 5.92 2.61 8.73
10c 3.86 10.74 2.91 4.71 22.22
11c 0.70 3.11 0.53 0.83 5.17 12c 2.97 1.36 0.17 0.10 4.60
Total 30.00 63.95 17.29 10.08 121.32 Notes: NA = not applicable a Unless otherwise indicated, data is from January 1, 2006 through June 30, 2006. b Total butene emissions include all isomers of butene. c Monitoring data is from January 31, 2006 through June 30, 2006.
10 Indication of good quality-assured data was provided by the participating facilities.
HARC Project H76 15October 27, 2006
TABLE 3-2.
Monitored Cooling Tower HRVOC Emissionsa
Cooling Tower
Total Ethylene Emissions
(tons)
Total Propylene Emissions
(tons)
Total Butene Emissionsb
(tons)
Total 1,3-Butadiene Emissions
(tons)
Total HRVOC
Emissions (tons)
1 0.02 0.02 NA NA 0.04 2 0.02 0.13 NA NA 0.15 3 0.21 0.79 0.05 NA 1.05 4 0.04 < 0.01 NA NA 0.04 5 0.03 < 0.01 NA NA 0.03 6 0.21 0.31 0.83 0.40 1.75 7 0.46 0.63 1.26 0.57 2.92 8 0.19 0.54 0.81 0.39 1.93 9 0.20 0.58 1.33 0.63 2.74
10 0.03 0.06 7.30 1.49 8.88 11 < 0.01 0.01 0.05 0.01 0.07 12 0.01 0.01 0.14 1.46 1.62 13 0.02 0.08 4.33 0.74 5.17 14 0.04 0.06 0.55 0.09 0.74 15 0.01 0.01 0.07 0.02 0.11 16c 0.18 0.92 < 0.01 < 0.01 1.1 17c 0.02 0.87 < 0.01 < 0.01 0.89
Total 1.69 5.02 16.72 5.80 29.23 Notes: NA = not applicable a Unless otherwise indicated, data is from January 1, 2006 through June 30, 2006. b Total butene emissions include all isomers of butene. c Monitoring data is from January 31, 2006 through June 30, 2006.
One facility provided source testing data for three affected process vents at their facility. This data is presented in Table 3-3.
TABLE 3-3. Tested Process Vent HRVOC Emissions
Ethylene Emissions Process Vent (lb/hr) (tpy)a
1 < 0.2249b 0.99c 2 0.74 3.24 3 0.31 1.36
Notes: a Annual emissions are based on 8,760 hr/yr of operation. b Ethylene concentration was “non detect”. Hourly emission rate is ½ the detection limit multiplied by the volumetric flow rate. c Assumes ½ the detection limit multiplied by the volumetric flow rate.

HARC Project H76 16October 27, 2006
This facility discovered that stack testing results were significantly lower than previous estimates of HRVOC PTE from these process vents. However, the facility did not provide quantitative information on how much lower. It should be noted that this facility discovered that analyzer vents – not represented in Table 3-3 – are a larger than anticipated source of HRVOC emissions. Again, no quantitative information was provided.
Another facility, which did not provide stack testing data, originally estimated an HRVOC PTE of 36 tpy from process vents, but found less than 5 tpy HRVOC based on stack tests. This facility also found that the HRVOC percentage (i.e., concentration) is much lower than previous estimates.
Several study participants who did not provide actual monitoring data for this study did provide some initial findings after their preliminary review of data. Following is a brief discussion of these initial findings:
• One facility found that they have been historically overestimating cooling tower emissions based on the results of the HRVOC monitoring. Also, this facility has found that historically they have been underestimating product silo vent emissions. Possible reasons include that the required methods for testing are for continuous processes and that silo vent emissions are cyclic.
• One facility stated that the HRVOC monitors have provided actual emissions data from flares and cooling towers that was in line with expected values.
3.4 HRVOC Data Management
The surveyed facilities use a variety of methods to manage their HRVOC data. Examples follow.
• One facility uses an existing upper level data historian (i.e., Plant Information (PI) System), to manage their HRVOC data.11
• Three facilities use existing environmental management software which has been modified for the HRVOC program. These facilities have modified existing Pavilion Technologies, Environmental Software Providers’ opsEnvironmental™, and VisionMonitor software to handle their HRVOC data.
• Five facilities purchased new environmental management software specifically for this application (i.e., VisionMonitor HRVOC Solution, Honeywell XCEED Cirrus EISTM, and SAP xEM).
Upper level data historians record and store raw data received from plant distributed control systems (DCS). A DCS is a process control system that uses a network to interconnect sensors, controllers, operator terminals and actuators.
For the purposes of the HRVOC program, one facility exports the data from their upper level data historian (i.e., PI System) to a spreadsheet application. Facility personnel evaluate the data within the spreadsheet application for deviations and to perform data substitution, which takes approximately one day per month to complete. This facility invested no capital in the HRVOC data management system, leveraging existing systems.
Environmental management software applications perform HRVOC data collection and reporting functions. These applications collect data from the plant DCS and data historians. Examples follow.
• One facility originally installed VisionMonitor for the NOX Mass Emissions Cap and Trade (MECT) program. This facility incorporated additional equipment into the VisionMonitor software to allow management of the HRVOC Cap and Trade (HECT) program.
11 The PI System is produced by OSI Software, Inc. (http://www.osisoft.com/).
HARC Project H76 17October 27, 2006
• At another facility, VisionMonitor has the capability to alert board operators of problems with analyzers. Supervising operators carry a pager which VisionMonitor alerts if there are problems with analyzers. Additionally, VisionMonitor sends an email to the supervising operator(s), environmental department, and environmental production coordinator if there are problems with any analyzers. The facility can then explore problems in VisionMonitor and then decide how to proceed.
• One facility invested capital in the plant DCS, data historian, and HRVOC data management system. This facility uses the Honeywell XCEED Cirrus EISTM system.
• One facility uses the opsEnvironmental™ application in the following manner. HRVOC monitors are connected to the DCS systems across the site. A calculation server reads the data inputs and calculates source emissions and site totals. The source emissions are then stored in data history systems and transferred to the opsEnvironmental™ application for storage and reporting.
Although these environmental management software applications have been used with some success, some systems still require debugging. Facilities continue to report difficulties with data management systems, including data extraction and production of user-friendly reports.
3.5 Study Participant Observations and Suggestions
3.5.1 Observations and Reported Implementation Issues
During the course of ENVIRON’s investigations, study participants reported both technical and logistical difficulties that occurred during implementation of the HRVOC monitoring program. Equipment reliability issues were identified as the predominant technical problem experienced during implementation. Other technical issues reported by study participants include the following.
• Programming issues with on-line analyzers and flow meters.
• Programming issues with HRVOC calculations and data transmission.
• Cooling water sample system plugging.
• On-line analyzer column failure.
• Sample system leaks.
• Incorrect installation of cooling tower flow meters.
• Calibration gas bottle concentration vendor quality control error.
• Ongoing on-line analyzer technical issues, i.e., “hydrogen problem” – if analyzer misses a particular peak and consequently the total does not equal 100%, then the analyzer assumes the remainder is hydrogen. This problem is due to a decision by the study participant to determine hydrogen by difference instead of direct measurement.
• Delays of approximately 6 months caused by the necessity for use of engineered clamps to install on-line analyzers and flow meters on flare headers.
• Finding flow meter technology that would meet accuracy requirements without forcing facility to completely change flare header piping.
• Issues with an optical flow meter – false high process flow experienced due to interference with meter purge gas stream.
HARC Project H76 18October 27, 2006
• Applying regulatory defined methods to analyzers when methods were not applicable.
• Finding reliable calibration gas standards as the quality of standards from several suppliers was marginal.
• Inadequacy of initial vendor design in some cases, e.g., sample conditioning system engineering.
• Extremely large amounts of data to handle during a short implementation period.
• Training of a large number of employees from multiple disciplines (operations, maintenance and technical).
• Prescriptive nature of Appendix P and Performance Specification 9 which dramatically increased the monitoring program implementation time.
• Corrosion of analyzer building in the vicinity of a cooling tower.
• False alarms from HRVOC data management software.
In addition to the aforementioned technical issues, logistical problems experienced by study participants include the following:
• Hurricane Rita, which struck the Gulf Coast during the height of the implementation, caused delays and scheduling problems with stack testing companies.
• One study participant who collects monthly samples from two of their cooling towers, had to ship samples for analysis because no local lab performed the speciated analysis during the early stages of implementation. [Note that a local laboratory has now established in the Houston area.]
• Another study participant indicated that their equipment vendor did not have adequately trained personnel to assist in the implementation.
• Coordinating stack tests with maximum rates.
There is also general concern among study participants that rule complexity will result in more reportable Title V deviations and that dealing with these deviations will require more resources on the part of the study participants.
During a October 11, 2006, ISA Houston Analysis Subsection panel discussion, senior analyzer engineers and technicians from five companies, including several who did not participate in the H76 study, confirmed many of these observations. Of particular note are the following comments made about ongoing issues.
• Some voiced concerns that the HRVOC program was very difficult and expensive and questioned whether there was not there was a more cost effective way to address the problem. Some items, listed in part to respond to these concerns, are provided in section 4.13.
• Multi-point calibrations are burdensome and unnecessary for maintaining analyzer accuracy.
• Given the very low concentrations of organics being observed in the cooling water returns, if they had to do it again they would opt for monitoring total VOC, not speciated HRVOC.
• Installation and maintenance of HRVOC monitors and associated instrumentation is about five times more difficult than standard NOX CEMS. However, some noted that NOX CEMS were very difficult to install initially and suggested that the HRVOC systems will become easier to maintain after they have one or two years of experience. Others were not as optimistic.
• Several members of the panel expressed opinions that regulated industry has been too accepting of the HRVOC program. Among the reasons hypothesized for this acquiescence is that industry got

HARC Project H76 19October 27, 2006
what they requested (referring to the 80% instead of 90% NOX reduction) and individual companies want to maintain a positive relationship with TCEQ.
3.5.2 Suggestions by Study Participants
The most commonly cited opportunity for improvement by study participants relates to the requirement for multi-point calibrations anytime maintenance is performed on the HRVOC analyzer. In the opinion of the analyzer engineers and technicians that participated in this study – as well as the participants in the aforementioned October 11 ISA panel session – the requirement for a multi-point calibration is not necessary given the inherent linearity of the instruments being used to monitor HRVOC concentrations in flare headers and cooling tower water returns.
Many of the study participants also question the value of manually collecting samples during instrument downtime given the 95% annual uptime requirement specified by rule. They believe that process data can be used to accurately estimate emissions during instrument downtime. Logistically, it has proven very difficult to get qualified sampling contractors into the facility in a timely fashion.
Study participants are generally of the opinion that the TCEQ should consider revising the HRVOC rules to address the multi-point calibration and downtime sampling requirements discussed above as well as other potential rule improvement opportunities. The approach recommended by study participants is for the TCEQ to convene an industry work group to investigate streamlining the HRVOC monitoring rules so that program goals can be accomplished more cost effectively. A list of suggestions for HRVOC rule improvements provided by study participants is included as Appendix E.
3.6 HRVOC Monitoring Program Implementation Costs
Study participants provided cost data when available. ENVIRON requested such information as total installed costs for the CEMS, annual operating and maintenance costs, source testing costs, data management system costs, and investments in emission control systems/measures. As noted elsewhere in this report, ENVIRON did not audit the cost data provided by study participants
Total installed costs are presented in Table 3-4. Some study participants provided total installed costs only while others included additional information such as installation labor, installation spare parts, and other initial costs. Items typically included by study participants in the total installed cost include:
• Purchase of a continuous/automatic gas chromatograph (auto GC) and sampling system
• Purchase and installation of monitor shelter
• Purchase, installation and integration of flow meters
• Purchase, installation and integration of temperature measurements
• Integration with data acquisition and management systems (distributed control system)
• Purchase and installation of sample system pumps and valves
• Purchase and installation of sample lines, heated in the case of flares
• Hot tap of sample supply
• Structural elements (concrete slab)
• Electrical systems
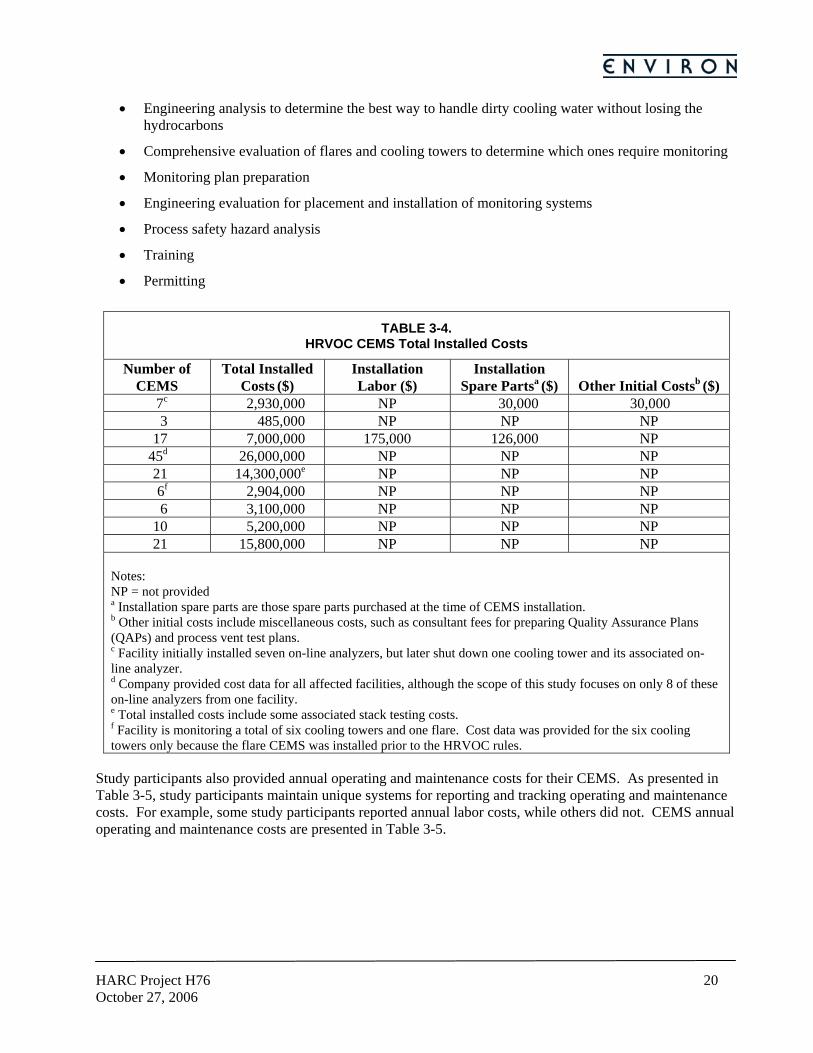
HARC Project H76 20October 27, 2006
• Engineering analysis to determine the best way to handle dirty cooling water without losing the hydrocarbons
• Comprehensive evaluation of flares and cooling towers to determine which ones require monitoring
• Monitoring plan preparation
• Engineering evaluation for placement and installation of monitoring systems
• Process safety hazard analysis
• Training
• Permitting
TABLE 3-4. HRVOC CEMS Total Installed Costs
Number of CEMS
Total Installed Costs ($)
Installation Labor ($)
Installation Spare Partsa ($) Other Initial Costsb ($)
7c 2,930,000 NP 30,000 30,000 3 485,000 NP NP NP
17 7,000,000 175,000 126,000 NP 45d 26,000,000 NP NP NP 21 14,300,000e NP NP NP 6f 2,904,000 NP NP NP 6 3,100,000 NP NP NP
10 5,200,000 NP NP NP 21 15,800,000 NP NP NP
Notes: NP = not provided a Installation spare parts are those spare parts purchased at the time of CEMS installation. b Other initial costs include miscellaneous costs, such as consultant fees for preparing Quality Assurance Plans (QAPs) and process vent test plans. c Facility initially installed seven on-line analyzers, but later shut down one cooling tower and its associated on-line analyzer. d Company provided cost data for all affected facilities, although the scope of this study focuses on only 8 of these on-line analyzers from one facility. e Total installed costs include some associated stack testing costs. f Facility is monitoring a total of six cooling towers and one flare. Cost data was provided for the six cooling towers only because the flare CEMS was installed prior to the HRVOC rules.
Study participants also provided annual operating and maintenance costs for their CEMS. As presented in Table 3-5, study participants maintain unique systems for reporting and tracking operating and maintenance costs. For example, some study participants reported annual labor costs, while others did not. CEMS annual operating and maintenance costs are presented in Table 3-5.

HARC Project H76 21October 27, 2006
TABLE 3-5. HRVOC CEMS Annual Operating and Maintenance Costs
Number of CEMS
Annual Parts/
Service Agreementsa
($/yr) Labor ($/yr)
Annual Calibrations/
Certificationsb ($/yr)
Calibration Gases ($/yr)
Uncategorized Operations/M
aintenance ($/yr)
Total ($)
6 84,000 175,000 NP 38,000 NP 297,000 3 NP 25,350 NP NP NP 25,350
17 25,000 NP 25,000 125,000 NP 175,000 4 32,000 308,500 NP NP NP 340,500
21 NP NP NP NP 340,000 340,000 6 NP 51,480 NP 33,000 NP 84,480 6 NP NP NP 50,000 170,000 220,000
10 NP NP NP 150,000 650,000 800,000 21 NP NP NP 600,000 1,760,000 2,360,000
Notes: NP = not provided a Service agreements with vendors b Calibration/certification of temperature, pressure, and/or flow monitors
Process vent source testing costs were provided for seven facilities. In one case, the source testing cost includes the cost to modify the process vents to allow for proper testing. Source testing costs are presented in Table 3-6.
TABLE 3-6. Process Vent HRVOC Testing Costs
Facility Number of Process
Vents Tested Total Source Testing Costsa
($) 1 15 355,000b 2 3 23,400 3 14 43,000 4 48 165,000 5 15 75,000 6 39 183,000 7 71 310,000
Total 205 $1,154,400 Notes: a Unless otherwise noted, total source testing costs include costs for sampling only. b The total source testing cost includes costs for sampling and modifying process vents for testing.
Several study participants provided cost data for their HRVOC data management systems. HRVOC data management costs are presented in Table 3-7.
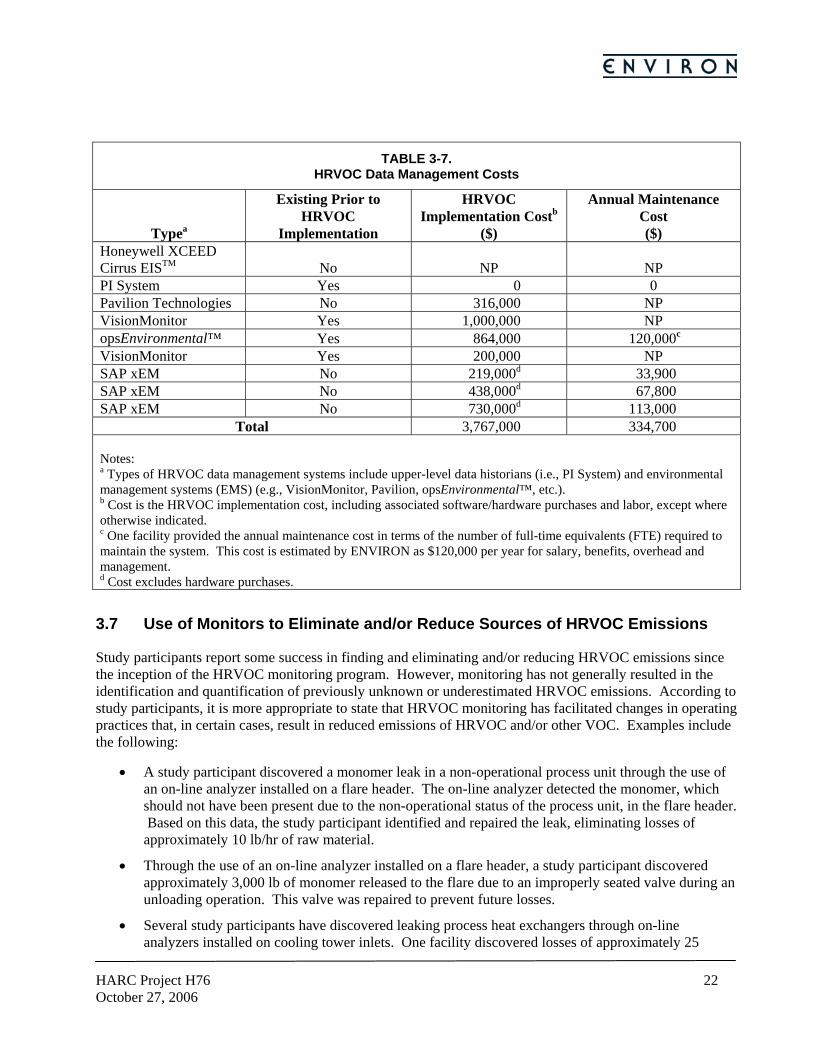
HARC Project H76 22October 27, 2006
TABLE 3-7.
HRVOC Data Management Costs
Typea
Existing Prior to HRVOC
Implementation
HRVOC Implementation Costb
($)
Annual Maintenance Cost ($)
Honeywell XCEED Cirrus EISTM No NP NP PI System Yes 0 0 Pavilion Technologies No 316,000 NP VisionMonitor Yes 1,000,000 NP opsEnvironmental™ Yes 864,000 120,000c VisionMonitor Yes 200,000 NP SAP xEM No 219,000d 33,900 SAP xEM No 438,000d 67,800 SAP xEM No 730,000d 113,000
Total 3,767,000 334,700 Notes: a Types of HRVOC data management systems include upper-level data historians (i.e., PI System) and environmental management systems (EMS) (e.g., VisionMonitor, Pavilion, opsEnvironmental™, etc.). b Cost is the HRVOC implementation cost, including associated software/hardware purchases and labor, except where otherwise indicated. c One facility provided the annual maintenance cost in terms of the number of full-time equivalents (FTE) required to maintain the system. This cost is estimated by ENVIRON as $120,000 per year for salary, benefits, overhead and management. d Cost excludes hardware purchases.
3.7 Use of Monitors to Eliminate and/or Reduce Sources of HRVOC Emissions
Study participants report some success in finding and eliminating and/or reducing HRVOC emissions since the inception of the HRVOC monitoring program. However, monitoring has not generally resulted in the identification and quantification of previously unknown or underestimated HRVOC emissions. According to study participants, it is more appropriate to state that HRVOC monitoring has facilitated changes in operating practices that, in certain cases, result in reduced emissions of HRVOC and/or other VOC. Examples include the following:
• A study participant discovered a monomer leak in a non-operational process unit through the use of an on-line analyzer installed on a flare header. The on-line analyzer detected the monomer, which should not have been present due to the non-operational status of the process unit, in the flare header. Based on this data, the study participant identified and repaired the leak, eliminating losses of approximately 10 lb/hr of raw material.
• Through the use of an on-line analyzer installed on a flare header, a study participant discovered approximately 3,000 lb of monomer released to the flare due to an improperly seated valve during an unloading operation. This valve was repaired to prevent future losses.
• Several study participants have discovered leaking process heat exchangers through on-line analyzers installed on cooling tower inlets. One facility discovered losses of approximately 25
HARC Project H76 23October 27, 2006
lb/day of raw material and a potential reactor operability issue due to water intrusion during process shutdowns through the use of their on-line analyzer. The facility replaced the heat exchanger. The on-line analyzer now shows zero loss during normal operations. Use of on-line analyzers has allowed more rapid detection and repair of heat exchanger leaks.
3.8 Changes in Practices Resulting from Use of HRVOC Monitors
Generally, the HRVOC monitoring program has improved general awareness of HRVOC emissions at study participant facilities, particularly in the areas of emissions and emission event reporting. Two study participants stated that the data indicates that they have over reported emissions historically, specifically in regards to cooling tower emissions. Based on source testing data, one facility discovered that process vent actual emissions may be higher than historically reported. One facility has suggested that the HRVOC monitoring data is useful in emission event reporting. Some facilities only see the benefits of the HRVOC monitoring program as an enhanced leak detection system, while others are using the data to improve operational, maintenance, and emission event reporting practices.
3.8.1 Operational
The HRVOC data management systems have had a significant impact on operations personnel. Typically, the system is designed so that operators view data from the HRVOC data management system on their screens. Some facilities have alarm set points to alert operators of any malfunctions with the CEMS’s. For example, at one facility operators are alerted when the on-line analyzer stops communicating with the DCS for a period of at least 30 minutes. The operators tend to be the first line of defense. Then they contact the instrumentation department. In general, operators use the data as an indication of when emissions are elevated. Operators initiate the next steps, such as contacting maintenance personnel.
Following are operational practices study participants are implementing as a result of the HRVOC monitoring program:
• One study participant is using auto GC heat content data to manage the addition of propane to the flare header to maintain the required Btu content of 300 Btu/scf. The facility discovered low hydrocarbon flow during normal operations, causing the net heating value of the stream to fall below 300 Btu/scf. The addition of the propane has reduced calculated HRVOC emissions, but resulted in increased VOC and NOX emissions. [Note: ENVIRON did not investigate flare destruction efficiencies used by study participants in calculating emissions for reporting purposes prior to monitoring of net heating values as required by the HRVOC rules.]
• One study participant discovered high losses to the flare during certain unplanned facility shutdowns. The facility found that current practices during process cold run increased hourly emissions. The facility revised standard operating procedures resulting in emission reductions of approximately 0.5 tons per event.
• One study participant has implemented additional vent switching (i.e., switch waste gas stream from incinerator to flare to maintain above 300 Btu/scf) as a result of the HRVOC monitoring program.
• Several study participants cited increased communication between “utilities” and process units. [Note: Plant Utility Departments typically manage certain flare support operations such as steam, air, and natural gas usage.]
• One study participant uses the CEMS as a feedback mechanism. For example, if flaring, operators can use CEMS to troubleshoot source of flow, i.e., PSV leaks, open valves, etc. The on-line analyzers do not identify specific equipment, but the speciation capabilities of the on-line analyzers
HARC Project H76 24October 27, 2006
help to narrow troubleshooting efforts to a particular process area.
• One study participant has used the HRVOC monitoring data to make ancillary process changes, e.g., crack nitrogen hoses instead of fully opening in order to maintain appropriate heating value levels in the flare header.
3.8.2 Maintenance
The predominant impact on maintenance practices has been with process heat exchangers. One facility uses cooling tower monitoring data to assist in the evaluation of heat exchanger mechanical integrity. Historically, such issues may have not been detected or suspect heat exchangers may have been plugged and put back into service.
Following are maintenance practices study participants are implementing as a result of the HRVOC monitoring program:
• One study participant has added additional equipment to their preventive maintenance (PM) program.
• One study participant has changed their procedures for process heat exchanger leak monitoring in cooling towers. The HRVOC monitoring allows the facility to immediately identify leaks instead of waiting for grab sample analysis results.
• One study participant has seen an increase in maintenance activities because of the HRVOC monitoring program. Returning on-line analyzers to service and repairing process heat exchanger leaks are top priority maintenance activities.
• One study participant has upgraded their test methods for determining leaks in process heat exchangers. The facility now performs helium testing on process heat exchangers in high-differential pressure service.
Enhanced maintenance activities should result in lower HRVOC emissions. However, no study participant was able to provide an estimate of what those emission reductions may be.
3.8.3 Emission Events
The majority of surveyed facilities report no changes in the way that emission events are prevented or managed as a result of the HRVOC monitoring program.
Two study participants have suggested that HRVOC monitoring data is useful in emission event reporting. For one study participant, the data indicates that some emissions previously thought to be reportable, e.g., emissions exceeding the reportable quantity (RQ), are in fact less than the RQ.
3.9 Emission Control Projects
Several study participants have invested in or are considering investment in HRVOC emission control measures. Some projects have already been implemented, while others will be implemented prior to the beginning of the first HECT compliance period on January 1, 2007. Still others are in the developmental phase and may or may not become actual projects. The following examples demonstrate the range of measures under consideration by study participants.
• One facility is exploring the possibility of returning some small analyzer vents back into the process.
HARC Project H76 25October 27, 2006
Currently these vents are routed to the atmosphere. The primary purpose of this measure would be a reduction in annual emissions against the HRVOC allocations. No emission reduction estimates were provided.
• Although not specifically an emission control measure, one facility may install a CEMS on a process vent for improved quantification purposes. Effectively, this may result in lower actual HRVOC emissions because of the improved quantification. Currently, the process vent HRVOC emissions are based on the source testing data which was established under maximum operating conditions. No emission reduction estimates were provided.
• One facility is investigating a project to reuse vent gas that currently is released to the atmosphere. The facility considered routing the vent gas to an existing incinerator, but the incinerator is not sized to handle the additional air volume. Therefore, the study participant will reuse the vent gas in the process instead of sending it to the incinerator. No emission reduction estimates were provided.
• Prior to the HRVOC rules compliance date, one facility implemented a flare gas recovery project which recovers all VOCs back into the plant’s process systems that once were routed to the flare. This project was driven by a VOC reduction initiative but has had the corollary benefit of significantly reducing HRVOC emissions. During normal operations, there is no flow to the flare. The facility is considering the installation of an auto-GC to see what is being recirculated through the process, which can be useful in protecting the integrity of the compressors.
Following are summaries of the projects evaluated in more detail as part of this study.
• Project 1 - Because of concerns about meeting its HECT cap, one facility plans to reduce HRVOC emissions by as much as 25 tpy by reconfiguring an off-gas compressor to remove hydrocarbons from the flare header. The additional off-gas will be sold as fuel gas.
• Project 2 - One facility plans to send off-spec HRVOC to an off-site salt dome storage facility for later reuse, reducing HRVOC emissions by 17 tons per year (tpy).
• Project 3 - One facility installed an incinerator and a refrigerated chiller, in addition to recovering for additional processing previously flared and uncontrolled HRVOC emissions. Total HRVOC emission reductions resulting from this project is 241 tpy.
• Projects 4 – 7 - One facility has implemented various projects over the last few years that have resulted in HRVOC emissions reductions at the site, including two flare gas recovery projects, a heavy ends stream recovery project, and a flaring reduction project. These projects were initiated for purposes other than HRVOC emissions reductions and would have been completed even without the HRVOC rules. These projects were necessary for the participant company to demonstrate compliance with the HECT program cap for their portfolio of affected facilities in Harris County. HRVOC reductions from these projects are estimated as 113 tons per year.
• Project 8 – One facility routed approximately 29 atmospheric pressure relief valves (PRVs) to a new flare constructed specifically for controlling releases from these PRVs. This project was initiated in response to the 1,200 lb/hr HRVOC emission limit established by the HRVOC rules. The facility anticipates HRVOC hourly emission reductions because of this project, but has not estimated impacts on annual HRVOC emissions.
Another option available to affected facilities for HECT program compliance is the purchase of HRVOC allowances. However, several study participants expressed reservations about purchasing HRVOC allowances as a way to comply with the HECT annual cap because of the current uncertainty surrounding the market with respect to both availability of allowances and pricing. To ensure that the company allocation of allowances is sufficient to cover actual HRVOC emissions at single or multiple sites, some emission
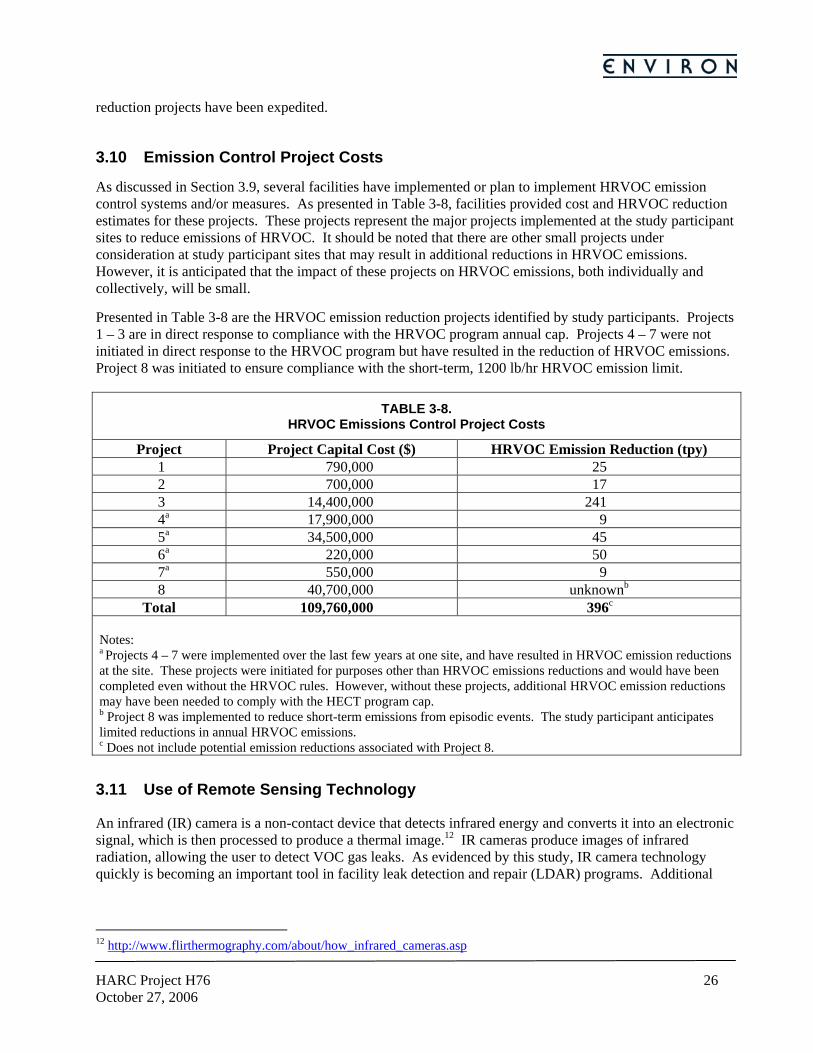
HARC Project H76 26October 27, 2006
reduction projects have been expedited.
3.10 Emission Control Project Costs
As discussed in Section 3.9, several facilities have implemented or plan to implement HRVOC emission control systems and/or measures. As presented in Table 3-8, facilities provided cost and HRVOC reduction estimates for these projects. These projects represent the major projects implemented at the study participant sites to reduce emissions of HRVOC. It should be noted that there are other small projects under consideration at study participant sites that may result in additional reductions in HRVOC emissions. However, it is anticipated that the impact of these projects on HRVOC emissions, both individually and collectively, will be small.
Presented in Table 3-8 are the HRVOC emission reduction projects identified by study participants. Projects 1 – 3 are in direct response to compliance with the HRVOC program annual cap. Projects 4 – 7 were not initiated in direct response to the HRVOC program but have resulted in the reduction of HRVOC emissions. Project 8 was initiated to ensure compliance with the short-term, 1200 lb/hr HRVOC emission limit.
TABLE 3-8. HRVOC Emissions Control Project Costs
Project Project Capital Cost ($) HRVOC Emission Reduction (tpy) 1 790,000 25 2 700,000 17 3 14,400,000 241 4a 17,900,000 9 5a 34,500,000 45 6a 220,000 50 7a 550,000 9 8 40,700,000 unknownb
Total 109,760,000 396c Notes: a Projects 4 – 7 were implemented over the last few years at one site, and have resulted in HRVOC emission reductions at the site. These projects were initiated for purposes other than HRVOC emissions reductions and would have been completed even without the HRVOC rules. However, without these projects, additional HRVOC emission reductions may have been needed to comply with the HECT program cap. b Project 8 was implemented to reduce short-term emissions from episodic events. The study participant anticipates limited reductions in annual HRVOC emissions. c Does not include potential emission reductions associated with Project 8.
3.11 Use of Remote Sensing Technology
An infrared (IR) camera is a non-contact device that detects infrared energy and converts it into an electronic signal, which is then processed to produce a thermal image.12 IR cameras produce images of infrared radiation, allowing the user to detect VOC gas leaks. As evidenced by this study, IR camera technology quickly is becoming an important tool in facility leak detection and repair (LDAR) programs. Additional
12 http://www.flirthermography.com/about/how_infrared_cameras.asp

HARC Project H76 27October 27, 2006
remote sensing technologies are discussed elsewhere.13
ENVIRON found that 3 of the 9 surveyed facilities have used or are using IR camera technology to locate potential sources of HRVOC emissions. An additional surveyed facility has future plans to use the IR camera technology. Following is a discussion of the use/proposed use of the IR camera at these facilities.
3.11.1 IR Camera Use at Facility #1
One facility uses IR camera technology to locate potential leaks from fugitive equipment components, including: sight glasses; valves; gaskets; pin holes in pipe, including buried pipe; API separator lids; plugs and caps; tank gauge hatches; and process vent lines. Some of these components are part of the fugitive monitoring program, while others are not. This facility has future plans to identify fugitive leaks from pressure relief valves in closed vent systems.
This facility uses the IR camera technology to identify leaks from fugitive components and then proceeds with the applicable leak detection and repair (LDAR) program (i.e., Method 21, tag/repair, etc.). The IR camera technology is useful in locating leaks that are detected initially via olfactory means, i.e., leaking component behind insulation, which would not have otherwise been detected. One limitation of the IR camera technology is that currently it can only detect leaks above approximately 3,000 ppmv.
Use of the IR camera technology at this facility has resulted in significant cost savings. The facility has saved a total of approximately $98,000 on pump seal replacements alone. The company originally purchased three IR cameras at a total cost of approximately $300,000 (FLIR Systems ThermaCAM® GasFindIR™). These cameras are used at the company’s facilities nationwide. In the Southern Region alone, the company estimates savings of approximately $225,000 to date. Since beginning use of the IR camera technology, the technology has nearly paid for itself.
3.11.2 IR Camera Use at Facility #2
At another facility, the IR camera is used to monitor process unit start-ups and shutdowns. Generally, the camera is used to look at major pieces of equipment to help in determining if there are emissions coming from the equipment during start-up or shutdown. Such equipment includes distillation columns, run down tanks (drums), pumps, and piping. This type of filming is done when the camera operator is notified of a process unit start-up or shutdown. If emissions are discovered and the piece of equipment or piping connection is tagged, the on-site fugitive emissions contractor is notified so that the source of the leak can be checked out and corrected as soon as possible.
Once per month, the camera is used to look at Railcar Loading and Tank Truck Loading, as well as analyzer buildings. While tank trucks or rail cars are being loaded, the camera is used to help in locating potential leaks from the loading arms or vent lines from the tank car/tank truck to the flare header. If a leak is discovered, the loading operator is notified so that the operator can tighten the connection or have maintenance assess the leaking connection. Again, if the leaking connection is tagged for fugitive emissions monitoring, the on-site contractor is notified so that the source of the leak can be checked out and repaired as necessary.
13 Houston Advanced Research Center, Survey and Demonstration of Monitoring Technology for Houston Industrial Emissions, Project H31.2004, January 2005.

HARC Project H76 28October 27, 2006
An additional application of the IR camera at this facility is tank clean-outs/maintenance. If the camera operator is notified prior to tank maintenance or clean-out, the camera is used to locate potential sources of fugitive emissions from these activities.
3.11.3 IR Camera Use at Facility #3
Another facility uses IR camera technology to locate leaks from process equipment during start-ups and shutdowns. This facility has used the FLIR Systems ThermaCAM® GasFindIR™ for approximately two years. Currently, this facility does not use the IR camera specifically for HRVOC rule compliance purposes nor is the IR camera directly used as part of the facility LDAR program. This facility has indicated that the IR camera has proven value.
3.11.4 IR Camera Use at Facility #4
A fourth affected facility has future plans to use IR camera technology. Potential uses are being discussed and range from locating potential leaks from fugitive equipment components to system leak checks following a turnaround prior to startup.
3.11.5 Fenceline FTIR
IR camera technology is not the only remote sensing tool being used at affected facilities in Harris County. One facility has installed fence line Fourier Transform Infrared Spectroscopy (FTIR) monitors for measuring low concentrations of 1,3-Butadiene in ambient air. FTIR utilizes an infrared light beam directed along a path into a detector. The detector analyzes the absorption of the infrared beam. This analysis produces an interferogram, which is mathematically converted into a field spectrum. The types and concentrations of the compounds in ambient air can be ascertained from the field spectrum.14
Although there are no specific findings to report, facility personnel have a favorable opinion of this technology. Facility personnel have indicated that they would have considered and investigated FTIR as an alternative to process GCs for flare and cooling tower HRVOC measurements.
3.12 Education and Training
The HRVOC monitoring program has resulted in education and training programs specifically related to the HRVOC program. Education and training programs range from general education to specific technical training related to daily operations. Examples of these education and training programs include the following:
• One study participant made general presentations to various groups within the facility to draw attention to certain program elements that must be considered now that were not considered before the program. These sessions also served as forums for answering common questions, e.g., “if we have a cooling tower leak, do we have to shut down immediately?”
• Several study participants sent technicians to the training offered by equipment vendors. For example, one study participant sent three technicians for two weeks of training with the on-line analyzer equipment vendor.
• Most facilities conducted specific training for the operators (operations engineers and assistants). At 14 Ibid.
HARC Project H76 29October 27, 2006
one facility, operators received at least 20 hours of training related to the HRVOC monitoring program.
3.13 Economic Benefits of HRVOC Monitoring
To date, no study participant has performed an evaluation of the HRVOC program with respect to quantities of raw materials, intermediates and/or products recovered for reprocessing or reuse and the economic value of those materials. Most facilities expressed an opinion that an economic evaluation at this point is premature, believing that at least two or three years of monitoring and implementation cost data is required prior to conducting such an evaluation.
HARC Project H76 30October 27, 2006
4. ANALYSIS
ENVIRON provides the following analysis of quantitative and qualitative information gathered during the course of this study and presented in Section 3 of this report.
4.1 Continuous Emission Monitoring Systems
Among the surveyed facilities, the Siemens MAXUM II Process Gas Chromatograph and the Siemens Sparging Sample System are the most widely used instruments for flare and cooling tower HRVOC measurement, respectively. Siemens was clearly an early entrant in the HRVOC emissions monitoring market, working with potentially affected facilities to develop a product that could meet the requirements of the HRVOC monitoring program. As a result, the Siemens MAXUM II has been the overwhelming choice of study participants for monitoring HRVOC concentrations in flare headers and cooling water returns.
4.2 Implementation
Based on discussions with study participants, the CEMS equipment was readily available during the implementation period. Evidence of this is the relatively constant equipment delivery time of approximately three to four months. Greater variability was found in the time to install, startup, and troubleshoot the equipment. Larger facilities with many sources experienced the longest overall implementation time. This phase of the implementation was very time intensive, even for the well-prepared facilities.
Those companies with the greatest presence in the HGB nonattainment area tended to be more involved in the HRVOC regulatory development process. These companies tended to be more knowledgeable about regulatory developments and better prepared for implementing the HRVOC rules. For example, one study participant that was very active in the HRVOC rule development process began planning in August 2002. However, according to the facility, this project management philosophy had both advantages and disadvantages. The primary advantage was that the facility had ample time to fully implement the HRVOC monitoring program at its very large and complex sites. However, given the dynamic nature of the rule development process, there were inherent difficulties with managing the project. Significant rule changes, such as those adopted in December 2004, often necessitated changes in the CEMS implementation.
4.3 Monitoring Data
ENVIRON analyzed the quantitative HRVOC monitoring data provided by study participants with special attention to the sources, magnitudes, and temporal variation of the data. Data analysis is limited to HRVOC monitoring data collected from flares and cooling towers.
4.3.1 Total Emissions
HRVOC emissions from flares predominate, with total HRVOC emissions from flares being more than 4 times greater than total HRVOC emissions from cooling towers. A comparison of the distribution of HRVOC emissions from the 12 flares and 17 cooling towers (through June 30, 2006) to 2003 actual HRVOC emissions for Harris County is provided in Table 4-1.

HARC Project H76 31October 27, 2006
TABLE 4-1. Comparison of HARC Project H76 Emissions (through June 30, 2006) to 2003 Actual
HRVOC Emissions
Pollutant HARC Project H76a (% of total HRVOC)
2003 Actual Emissionsb (% of total HRVOC)
Ethylene 21.05% 42.21% Propylene 45.81% 48.37% Butenes 22.59% 1.34% 1,3-Butadiene 10.55% 8.08%
Notes: a Facilities provided HRVOC monitoring data for 12 flares and 17 cooling towers. b 2003 data from emission inventories was provided by the TCEQ for Harris County.
Depending on facility performance from August 1 to December 31, 2006, the distribution of HRVOC emissions from the 12 flares and 17 cooling towers could change. Study group makeup also affects this distribution. A definitive analysis would only be possible if all HRVOC affected facilities in Harris County were included in this study.
For facilities that provided adequate monitoring data for comparison purposes, ENVIRON compared total HRVOC projected annual emissions to the total HRVOC allocations for each facility.15 The differences between projected annual emissions and HECT program allowance allocations are presented in Table 4-2. Collectively, these facilities represent approximately 1,460 tons per year of HRVOC allowance allocations or slightly more than 42% of total HECT program allowances allocated to facilities located in Harris County. To protect the confidentiality of study participants, values for individual facilities are not presented.
The comparison of projected actual 2006 emissions to HECT program allowance allocations should be considered in light of the following.
• Some facilities provided HRVOC emissions data for process vents while others did not. While emissions from process vents are typically considered to be a small percentage of facility total HRVOC emissions, this is not universally true. For some study participants, emissions from process vents constitute a significant contribution to overall facility emissions.
• The projection of actual annual emissions is based on six months or less of data. The first six months of 2006 may or may not be representative of the entire year.
• Emissions during 2006 may or may not be an appropriate indicator of future year emissions.
• Three facilities participating in this study did not provide sufficient information to allow estimation of actual 2006 emissions.
The reader should also bear in mind that most HECT program-affected facilities in Harris County did not participate in this study. A comparison of actual emissions to allocated allowances for those facilities could yield findings that are similar or very different to those observed for study participants.
15 Some study participants did not share data because of difficulties in extracting and reporting data, concerns about the impact on future HRVOC allocations, and concerns about the impact on pricing of allowance futures.
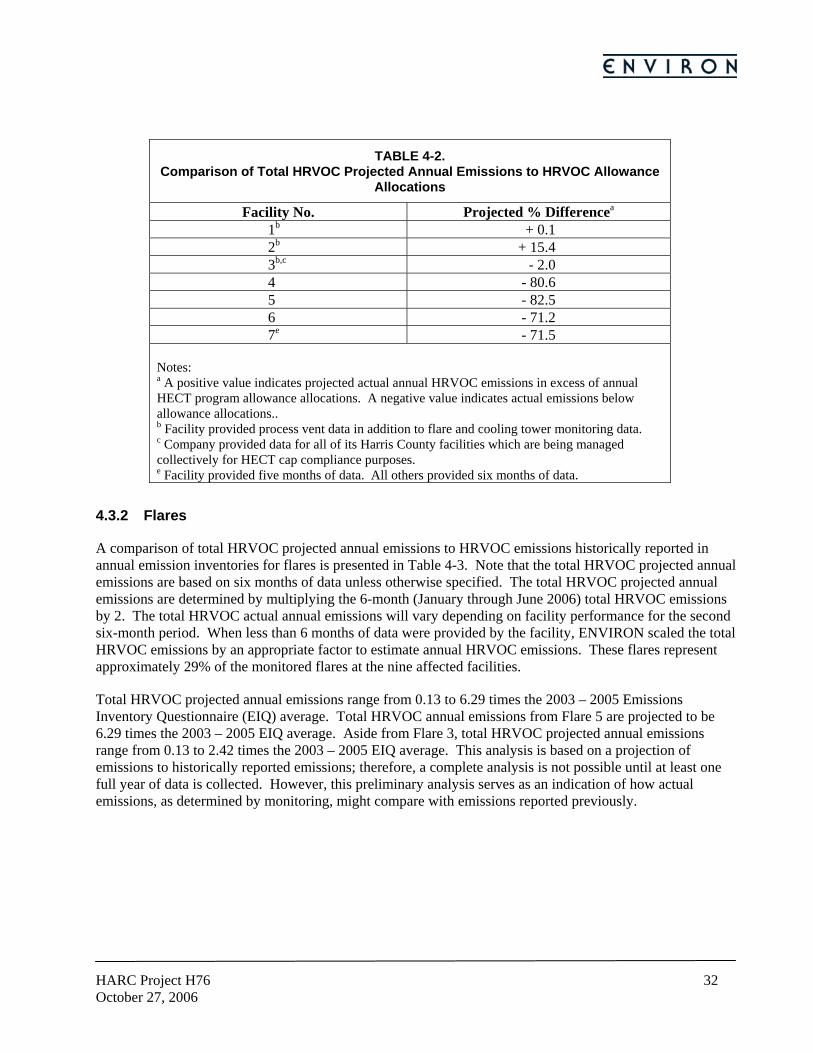
HARC Project H76 32October 27, 2006
TABLE 4-2. Comparison of Total HRVOC Projected Annual Emissions to HRVOC Allowance
Allocations
Facility No. Projected % Differencea 1b + 0.1 2b + 15.4 3b,c - 2.0 4 - 80.6 5 - 82.5 6 - 71.2 7e - 71.5
Notes: a A positive value indicates projected actual annual HRVOC emissions in excess of annual HECT program allowance allocations. A negative value indicates actual emissions below allowance allocations.. b Facility provided process vent data in addition to flare and cooling tower monitoring data. c Company provided data for all of its Harris County facilities which are being managed collectively for HECT cap compliance purposes. e Facility provided five months of data. All others provided six months of data.
4.3.2 Flares
A comparison of total HRVOC projected annual emissions to HRVOC emissions historically reported in annual emission inventories for flares is presented in Table 4-3. Note that the total HRVOC projected annual emissions are based on six months of data unless otherwise specified. The total HRVOC projected annual emissions are determined by multiplying the 6-month (January through June 2006) total HRVOC emissions by 2. The total HRVOC actual annual emissions will vary depending on facility performance for the second six-month period. When less than 6 months of data were provided by the facility, ENVIRON scaled the total HRVOC emissions by an appropriate factor to estimate annual HRVOC emissions. These flares represent approximately 29% of the monitored flares at the nine affected facilities.
Total HRVOC projected annual emissions range from 0.13 to 6.29 times the 2003 – 2005 Emissions Inventory Questionnaire (EIQ) average. Total HRVOC annual emissions from Flare 5 are projected to be 6.29 times the 2003 – 2005 EIQ average. Aside from Flare 3, total HRVOC projected annual emissions range from 0.13 to 2.42 times the 2003 – 2005 EIQ average. This analysis is based on a projection of emissions to historically reported emissions; therefore, a complete analysis is not possible until at least one full year of data is collected. However, this preliminary analysis serves as an indication of how actual emissions, as determined by monitoring, might compare with emissions reported previously.
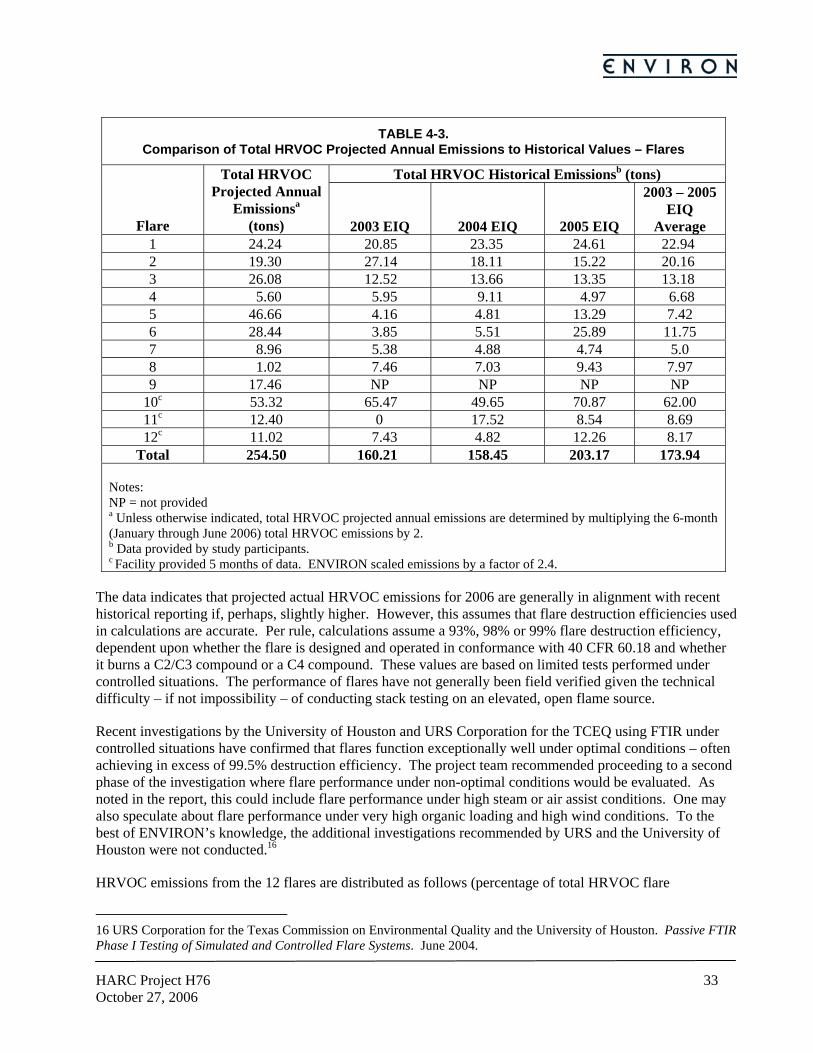
HARC Project H76 33October 27, 2006
TABLE 4-3.
Comparison of Total HRVOC Projected Annual Emissions to Historical Values – Flares
Total HRVOC Historical Emissionsb (tons)
Flare
Total HRVOC Projected Annual
Emissionsa (tons) 2003 EIQ 2004 EIQ 2005 EIQ
2003 – 2005 EIQ
Average 1 24.24 20.85 23.35 24.61 22.94 2 19.30 27.14 18.11 15.22 20.16 3 26.08 12.52 13.66 13.35 13.18 4 5.60 5.95 9.11 4.97 6.68 5 46.66 4.16 4.81 13.29 7.42 6 28.44 3.85 5.51 25.89 11.75 7 8.96 5.38 4.88 4.74 5.0 8 1.02 7.46 7.03 9.43 7.97 9 17.46 NP NP NP NP
10c 53.32 65.47 49.65 70.87 62.00 11c 12.40 0 17.52 8.54 8.69 12c 11.02 7.43 4.82 12.26 8.17
Total 254.50 160.21 158.45 203.17 173.94 Notes: NP = not provided a Unless otherwise indicated, total HRVOC projected annual emissions are determined by multiplying the 6-month (January through June 2006) total HRVOC emissions by 2. b Data provided by study participants. c Facility provided 5 months of data. ENVIRON scaled emissions by a factor of 2.4.
The data indicates that projected actual HRVOC emissions for 2006 are generally in alignment with recent historical reporting if, perhaps, slightly higher. However, this assumes that flare destruction efficiencies used in calculations are accurate. Per rule, calculations assume a 93%, 98% or 99% flare destruction efficiency, dependent upon whether the flare is designed and operated in conformance with 40 CFR 60.18 and whether it burns a C2/C3 compound or a C4 compound. These values are based on limited tests performed under controlled situations. The performance of flares have not generally been field verified given the technical difficulty – if not impossibility – of conducting stack testing on an elevated, open flame source.
Recent investigations by the University of Houston and URS Corporation for the TCEQ using FTIR under controlled situations have confirmed that flares function exceptionally well under optimal conditions – often achieving in excess of 99.5% destruction efficiency. The project team recommended proceeding to a second phase of the investigation where flare performance under non-optimal conditions would be evaluated. As noted in the report, this could include flare performance under high steam or air assist conditions. One may also speculate about flare performance under very high organic loading and high wind conditions. To the best of ENVIRON’s knowledge, the additional investigations recommended by URS and the University of Houston were not conducted.16
HRVOC emissions from the 12 flares are distributed as follows (percentage of total HRVOC flare
16 URS Corporation for the Texas Commission on Environmental Quality and the University of Houston. Passive FTIR Phase I Testing of Simulated and Controlled Flare Systems. June 2004.
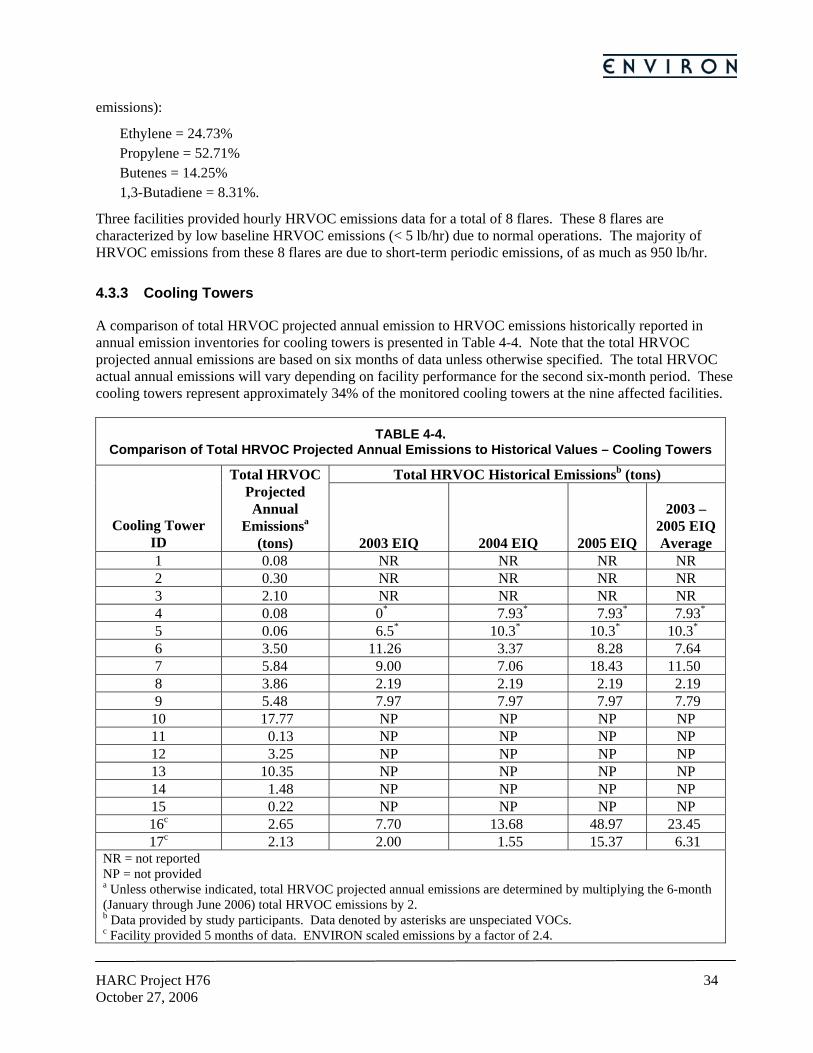
HARC Project H76 34October 27, 2006
emissions):
Ethylene = 24.73% Propylene = 52.71% Butenes = 14.25% 1,3-Butadiene = 8.31%.
Three facilities provided hourly HRVOC emissions data for a total of 8 flares. These 8 flares are characterized by low baseline HRVOC emissions (< 5 lb/hr) due to normal operations. The majority of HRVOC emissions from these 8 flares are due to short-term periodic emissions, of as much as 950 lb/hr.
4.3.3 Cooling Towers
A comparison of total HRVOC projected annual emission to HRVOC emissions historically reported in annual emission inventories for cooling towers is presented in Table 4-4. Note that the total HRVOC projected annual emissions are based on six months of data unless otherwise specified. The total HRVOC actual annual emissions will vary depending on facility performance for the second six-month period. These cooling towers represent approximately 34% of the monitored cooling towers at the nine affected facilities.
TABLE 4-4. Comparison of Total HRVOC Projected Annual Emissions to Historical Values – Cooling Towers
Total HRVOC Historical Emissionsb (tons)
Cooling Tower ID
Total HRVOC Projected Annual
Emissionsa (tons) 2003 EIQ 2004 EIQ 2005 EIQ
2003 – 2005 EIQ Average
1 0.08 NR NR NR NR 2 0.30 NR NR NR NR 3 2.10 NR NR NR NR 4 0.08 0* 7.93* 7.93* 7.93* 5 0.06 6.5* 10.3* 10.3* 10.3* 6 3.50 11.26 3.37 8.28 7.64 7 5.84 9.00 7.06 18.43 11.50 8 3.86 2.19 2.19 2.19 2.19 9 5.48 7.97 7.97 7.97 7.79
10 17.77 NP NP NP NP 11 0.13 NP NP NP NP 12 3.25 NP NP NP NP 13 10.35 NP NP NP NP 14 1.48 NP NP NP NP 15 0.22 NP NP NP NP 16c 2.65 7.70 13.68 48.97 23.45 17c 2.13 2.00 1.55 15.37 6.31
NR = not reported NP = not provided a Unless otherwise indicated, total HRVOC projected annual emissions are determined by multiplying the 6-month (January through June 2006) total HRVOC emissions by 2. b Data provided by study participants. Data denoted by asterisks are unspeciated VOCs. c Facility provided 5 months of data. ENVIRON scaled emissions by a factor of 2.4.
HARC Project H76 35October 27, 2006
These cooling towers are characterized by very low (< 1 lb/hr) baseline HRVOC emissions. The majority of HRVOC emissions from these cooling towers are due to periodic “plateau-like” emission increases that result from process heat exchanger leaks. Typically, the elevated HRVOC emissions persist until the leaking process heat exchanger is fixed.
The comparison of total HRVOC projected annual emissions to historical reporting for cooling towers is limited by the lack of available historical data. For example, HRVOC emissions for Cooling Towers 1 – 3 were not reported in 2003 – 2005. When historical data was available, some was unspeciated VOCs, as in the case of Cooling Towers 4 – 5. The lack of available historical data indicates that, in the absence of monitored data, quantification of HRVOC emissions is difficult and not well understood.
Where speciated historical data is available, total HRVOC projected annual emissions range from 0.11 to 1.76 times the 2003 – 2005 EIQ averages. Except for Cooling Tower 8, total project HRVOC emissions from the cooling towers are less than 2003 – 2005 EIQ averages.
HRVOC emissions from the 17 cooling towers are distributed as follows (percentage of total HRVOC cooling tower emissions)
Ethylene – 5.78% Propylene – 17.17% Butenes – 57.20% 1,3-Butadiene – 19.84%.
Note that 75% of the 17 cooling towers service process units that either use butene as a raw material or produce butene.
4.4 Data Management
HRVOC monitoring data can be managed in a variety of ways depending on the individual needs of the facility. One facility with relatively few affected sources successfully manages HRVOC data by using the plant’s PI system coupled with a spreadsheet application for data analysis. This method requires a labor commitment of approximately one day per month for data analysis. In contrast, larger facilities with more affected sources use environmental management software applications to manage their HRVOC data. Manual review of data for these facilities, if feasible, would be very labor intensive.
Although critical to the management of large amounts of data at the larger facilities, these environmental management software applications are not without their problems. Facilities continue to report difficulties with data management systems, including data extraction and production of user-friendly reports.
4.5 Difficulties Encountered During Implementation
Analysis of technical difficulties encountered during program implementation indicates the need for extensive planning and allowing for sufficient implementation time. Typically, the technical issues experienced by facilities related to instrumentation design and installation difficulties. These problems led to several months delay in some cases. In many cases, these issues were unforeseeable and might not have been avoided by additional planning. This emphasizes the need for sufficient implementation time to address the inevitable technical difficulties.
Analysis of logistical difficulties experienced during program implementation also indicates the need for adequate planning and allowing for sufficient implementation time. Some of the logistical problems could
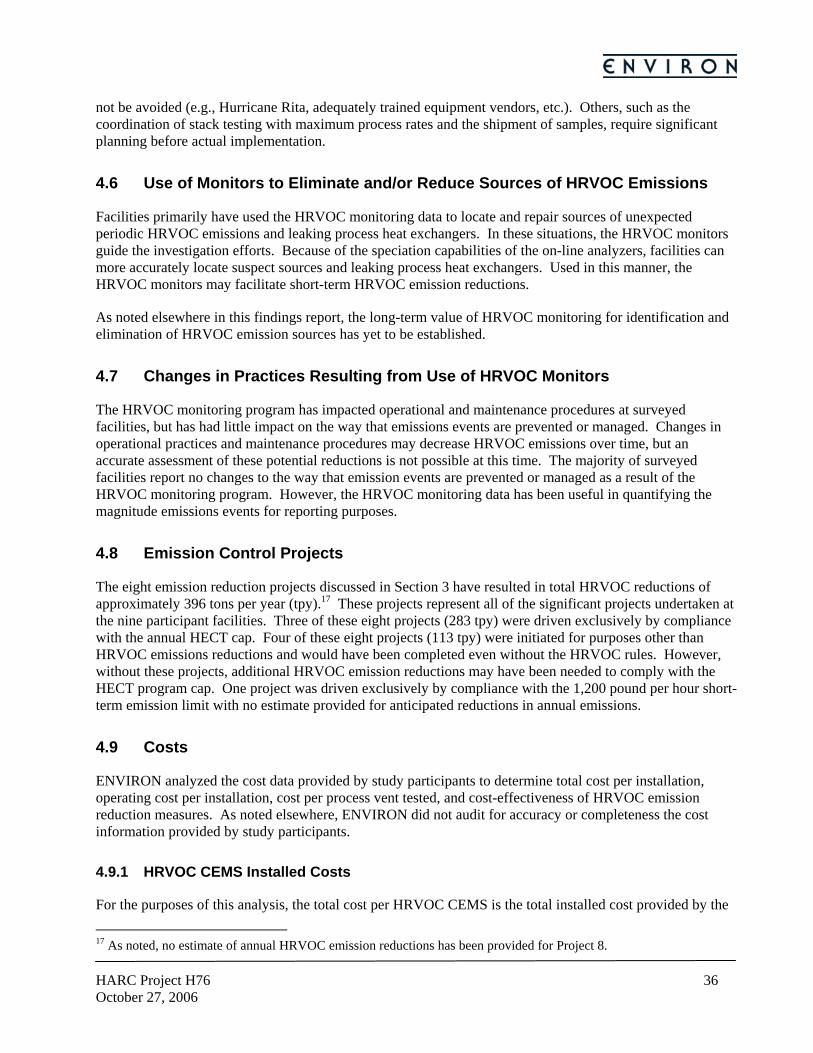
HARC Project H76 36October 27, 2006
not be avoided (e.g., Hurricane Rita, adequately trained equipment vendors, etc.). Others, such as the coordination of stack testing with maximum process rates and the shipment of samples, require significant planning before actual implementation.
4.6 Use of Monitors to Eliminate and/or Reduce Sources of HRVOC Emissions
Facilities primarily have used the HRVOC monitoring data to locate and repair sources of unexpected periodic HRVOC emissions and leaking process heat exchangers. In these situations, the HRVOC monitors guide the investigation efforts. Because of the speciation capabilities of the on-line analyzers, facilities can more accurately locate suspect sources and leaking process heat exchangers. Used in this manner, the HRVOC monitors may facilitate short-term HRVOC emission reductions.
As noted elsewhere in this findings report, the long-term value of HRVOC monitoring for identification and elimination of HRVOC emission sources has yet to be established.
4.7 Changes in Practices Resulting from Use of HRVOC Monitors
The HRVOC monitoring program has impacted operational and maintenance procedures at surveyed facilities, but has had little impact on the way that emissions events are prevented or managed. Changes in operational practices and maintenance procedures may decrease HRVOC emissions over time, but an accurate assessment of these potential reductions is not possible at this time. The majority of surveyed facilities report no changes to the way that emission events are prevented or managed as a result of the HRVOC monitoring program. However, the HRVOC monitoring data has been useful in quantifying the magnitude emissions events for reporting purposes.
4.8 Emission Control Projects
The eight emission reduction projects discussed in Section 3 have resulted in total HRVOC reductions of approximately 396 tons per year (tpy).17 These projects represent all of the significant projects undertaken at the nine participant facilities. Three of these eight projects (283 tpy) were driven exclusively by compliance with the annual HECT cap. Four of these eight projects (113 tpy) were initiated for purposes other than HRVOC emissions reductions and would have been completed even without the HRVOC rules. However, without these projects, additional HRVOC emission reductions may have been needed to comply with the HECT program cap. One project was driven exclusively by compliance with the 1,200 pound per hour short-term emission limit with no estimate provided for anticipated reductions in annual emissions.
4.9 Costs
ENVIRON analyzed the cost data provided by study participants to determine total cost per installation, operating cost per installation, cost per process vent tested, and cost-effectiveness of HRVOC emission reduction measures. As noted elsewhere, ENVIRON did not audit for accuracy or completeness the cost information provided by study participants.
4.9.1 HRVOC CEMS Installed Costs
For the purposes of this analysis, the total cost per HRVOC CEMS is the total installed cost provided by the
17 As noted, no estimate of annual HRVOC emission reductions has been provided for Project 8.
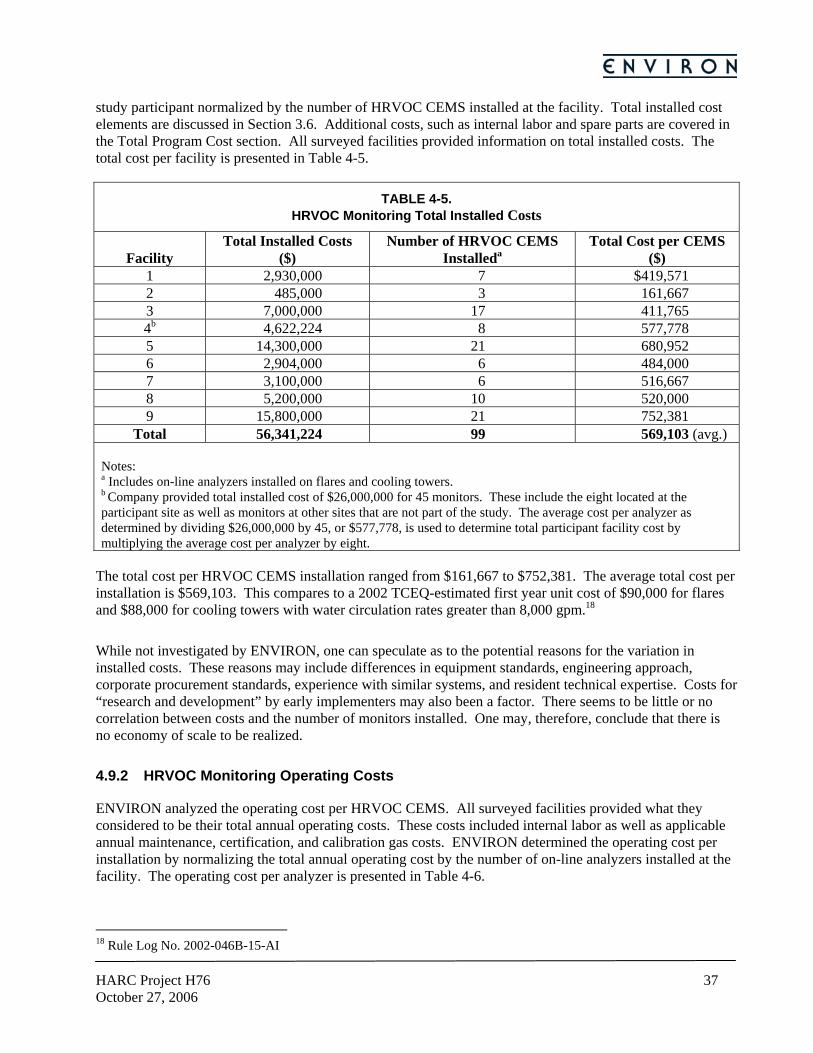
HARC Project H76 37October 27, 2006
study participant normalized by the number of HRVOC CEMS installed at the facility. Total installed cost elements are discussed in Section 3.6. Additional costs, such as internal labor and spare parts are covered in the Total Program Cost section. All surveyed facilities provided information on total installed costs. The total cost per facility is presented in Table 4-5.
TABLE 4-5. HRVOC Monitoring Total Installed Costs
Facility Total Installed Costs
($) Number of HRVOC CEMS
Installeda Total Cost per CEMS
($) 1 2,930,000 7 $419,571 2 485,000 3 161,667 3 7,000,000 17 411,765 4b 4,622,224 8 577,778 5 14,300,000 21 680,952 6 2,904,000 6 484,000 7 3,100,000 6 516,667 8 5,200,000 10 520,000 9 15,800,000 21 752,381
Total 56,341,224 99 569,103 (avg.) Notes: a Includes on-line analyzers installed on flares and cooling towers. b Company provided total installed cost of $26,000,000 for 45 monitors. These include the eight located at the participant site as well as monitors at other sites that are not part of the study. The average cost per analyzer as determined by dividing $26,000,000 by 45, or $577,778, is used to determine total participant facility cost by multiplying the average cost per analyzer by eight.
The total cost per HRVOC CEMS installation ranged from $161,667 to $752,381. The average total cost per installation is $569,103. This compares to a 2002 TCEQ-estimated first year unit cost of $90,000 for flares and $88,000 for cooling towers with water circulation rates greater than 8,000 gpm.18
While not investigated by ENVIRON, one can speculate as to the potential reasons for the variation in installed costs. These reasons may include differences in equipment standards, engineering approach, corporate procurement standards, experience with similar systems, and resident technical expertise. Costs for “research and development” by early implementers may also been a factor. There seems to be little or no correlation between costs and the number of monitors installed. One may, therefore, conclude that there is no economy of scale to be realized.
4.9.2 HRVOC Monitoring Operating Costs
ENVIRON analyzed the operating cost per HRVOC CEMS. All surveyed facilities provided what they considered to be their total annual operating costs. These costs included internal labor as well as applicable annual maintenance, certification, and calibration gas costs. ENVIRON determined the operating cost per installation by normalizing the total annual operating cost by the number of on-line analyzers installed at the facility. The operating cost per analyzer is presented in Table 4-6.
18 Rule Log No. 2002-046B-15-AI
HARC Project H76 38October 27, 2006
TABLE 4-6. Annual Operating Cost per HRVOC CEMS
Facility Annual Operating Costs
($) No. of HRVOC CEMS
Operating
Operating Cost per HRVOC CEMS
($) 1a 297,000 6 49,500 2 25,350 3 8,450 3 175,000 17 10,294 4b 340,500 4 85,125 5 340,000 21 16,190 6 84,480 6 14,080 7 220,000 6 36,667 8 800,000 10 80,000 9 2,360,000 21 112,381
Total 4,642,330 94 49,386 (avg.)
Notes: a The facility discontinued use of one cooling tower and associated on-line analyzer after implementation. b The facility provided annual operating costs for four of the eight analyzers located at the participant site.
The annual operating cost per installation ranged from $8,450 to $112,381. The mean annual operating cost per installation was $49,386. This compares to TCEQ-estimated annual operating costs of $20,000 for each flare and cooling towers with water circulation rates of greater than 8,000 gpm.19
While not investigated in depth by ENVIRON, the large range in values would seem to indicate that facilities estimated their annual operating costs differently. All facilities provided some indication of annual labor costs, which was the primary contributor to the annual operating cost in most cases. Depending on the number of on-line analyzers and number of instrument technicians, these labor costs can vary significantly. Note that some facilities did not provide an estimate of calibration gas cost – a cost item that other participants considered significant.
4.9.3 Process Vent Source Testing Costs
Seven facilities provided the total costs for source testing as well as the number of process vents tested. ENVIRON analyzed this data to determine the cost per process vent tested. The cost per process vent tested in provided in Table 4-7.
19 Ibid
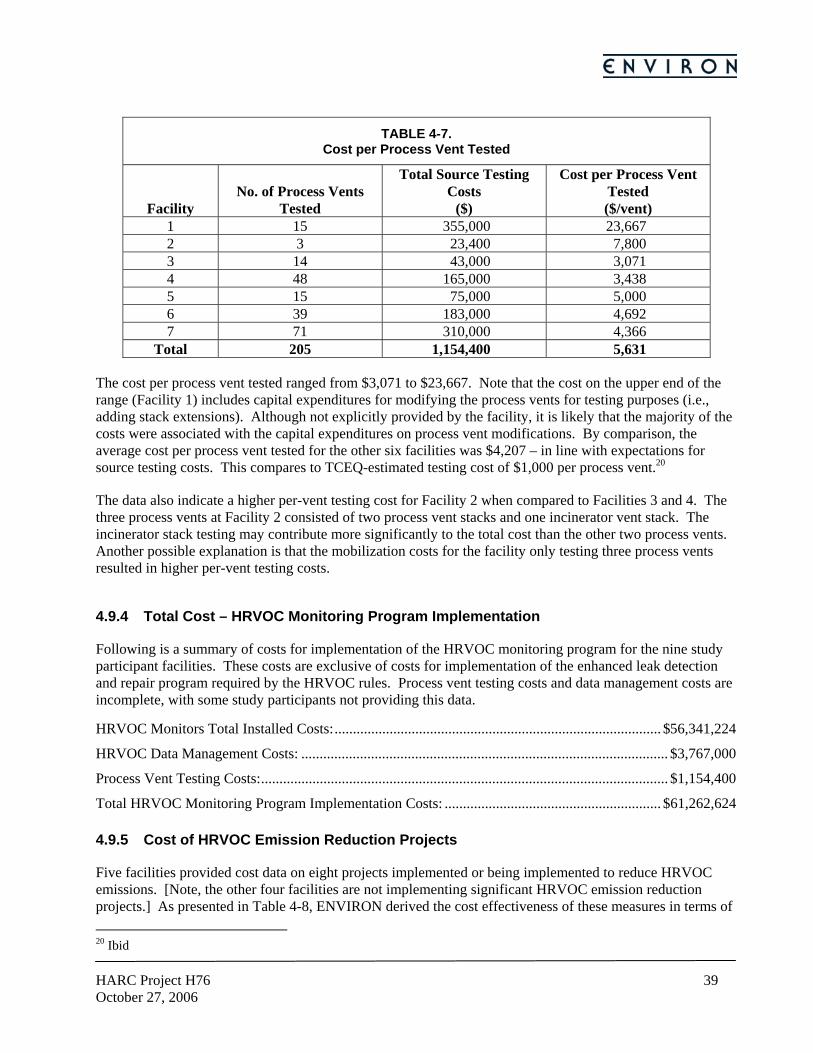
HARC Project H76 39October 27, 2006
TABLE 4-7.
Cost per Process Vent Tested
Facility No. of Process Vents
Tested
Total Source Testing Costs
($)
Cost per Process Vent Tested ($/vent)
1 15 355,000 23,667 2 3 23,400 7,800 3 14 43,000 3,071 4 48 165,000 3,438 5 15 75,000 5,000 6 39 183,000 4,692 7 71 310,000 4,366
Total 205 1,154,400 5,631
The cost per process vent tested ranged from $3,071 to $23,667. Note that the cost on the upper end of the range (Facility 1) includes capital expenditures for modifying the process vents for testing purposes (i.e., adding stack extensions). Although not explicitly provided by the facility, it is likely that the majority of the costs were associated with the capital expenditures on process vent modifications. By comparison, the average cost per process vent tested for the other six facilities was $4,207 – in line with expectations for source testing costs. This compares to TCEQ-estimated testing cost of $1,000 per process vent.20
The data also indicate a higher per-vent testing cost for Facility 2 when compared to Facilities 3 and 4. The three process vents at Facility 2 consisted of two process vent stacks and one incinerator vent stack. The incinerator stack testing may contribute more significantly to the total cost than the other two process vents. Another possible explanation is that the mobilization costs for the facility only testing three process vents resulted in higher per-vent testing costs.
4.9.4 Total Cost – HRVOC Monitoring Program Implementation
Following is a summary of costs for implementation of the HRVOC monitoring program for the nine study participant facilities. These costs are exclusive of costs for implementation of the enhanced leak detection and repair program required by the HRVOC rules. Process vent testing costs and data management costs are incomplete, with some study participants not providing this data.
HRVOC Monitors Total Installed Costs:......................................................................................... $56,341,224
HRVOC Data Management Costs: .................................................................................................... $3,767,000
Process Vent Testing Costs:............................................................................................................... $1,154,400
Total HRVOC Monitoring Program Implementation Costs: ........................................................... $61,262,624
4.9.5 Cost of HRVOC Emission Reduction Projects
Five facilities provided cost data on eight projects implemented or being implemented to reduce HRVOC emissions. [Note, the other four facilities are not implementing significant HRVOC emission reduction projects.] As presented in Table 4-8, ENVIRON derived the cost effectiveness of these measures in terms of 20 Ibid
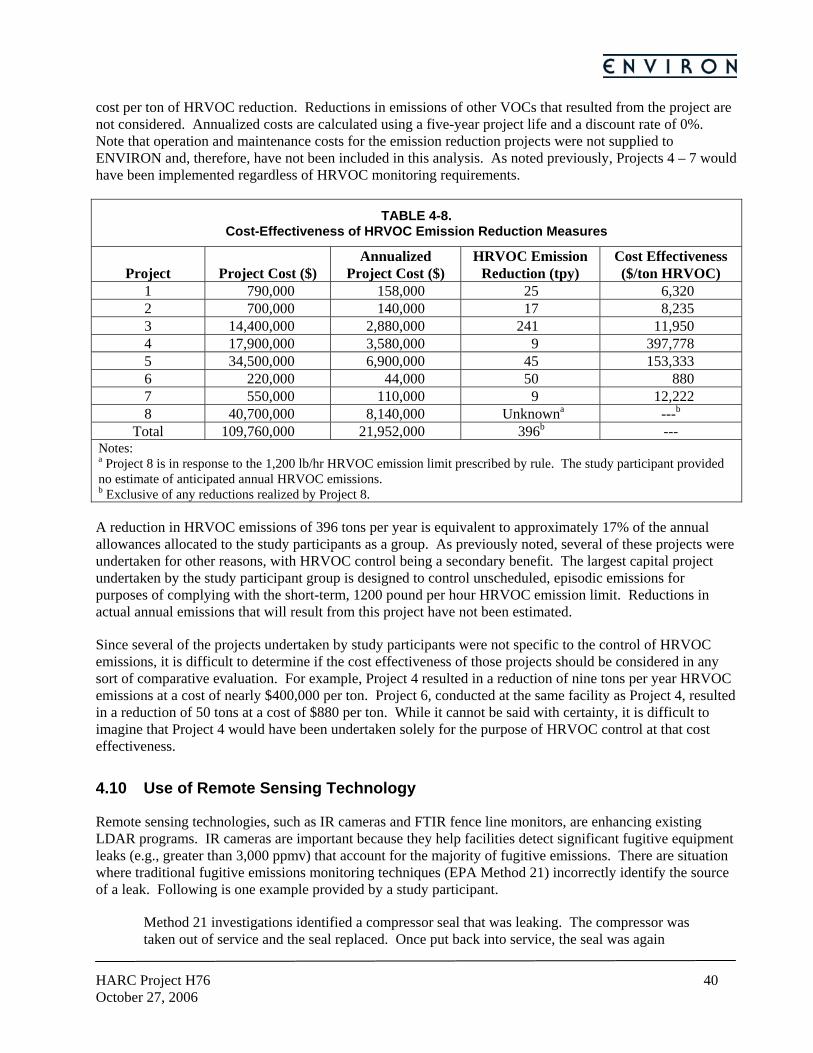
HARC Project H76 40October 27, 2006
cost per ton of HRVOC reduction. Reductions in emissions of other VOCs that resulted from the project are not considered. Annualized costs are calculated using a five-year project life and a discount rate of 0%. Note that operation and maintenance costs for the emission reduction projects were not supplied to ENVIRON and, therefore, have not been included in this analysis. As noted previously, Projects 4 – 7 would have been implemented regardless of HRVOC monitoring requirements.
TABLE 4-8. Cost-Effectiveness of HRVOC Emission Reduction Measures
Project Project Cost ($) Annualized
Project Cost ($) HRVOC Emission
Reduction (tpy) Cost Effectiveness ($/ton HRVOC)
1 790,000 158,000 25 6,320 2 700,000 140,000 17 8,235 3 14,400,000 2,880,000 241 11,950 4 17,900,000 3,580,000 9 397,778 5 34,500,000 6,900,000 45 153,333 6 220,000 44,000 50 880 7 550,000 110,000 9 12,222 8 40,700,000 8,140,000 Unknowna ---b
Total 109,760,000 21,952,000 396b --- Notes: a Project 8 is in response to the 1,200 lb/hr HRVOC emission limit prescribed by rule. The study participant provided no estimate of anticipated annual HRVOC emissions. b Exclusive of any reductions realized by Project 8.
A reduction in HRVOC emissions of 396 tons per year is equivalent to approximately 17% of the annual allowances allocated to the study participants as a group. As previously noted, several of these projects were undertaken for other reasons, with HRVOC control being a secondary benefit. The largest capital project undertaken by the study participant group is designed to control unscheduled, episodic emissions for purposes of complying with the short-term, 1200 pound per hour HRVOC emission limit. Reductions in actual annual emissions that will result from this project have not been estimated.
Since several of the projects undertaken by study participants were not specific to the control of HRVOC emissions, it is difficult to determine if the cost effectiveness of those projects should be considered in any sort of comparative evaluation. For example, Project 4 resulted in a reduction of nine tons per year HRVOC emissions at a cost of nearly $400,000 per ton. Project 6, conducted at the same facility as Project 4, resulted in a reduction of 50 tons at a cost of $880 per ton. While it cannot be said with certainty, it is difficult to imagine that Project 4 would have been undertaken solely for the purpose of HRVOC control at that cost effectiveness.
4.10 Use of Remote Sensing Technology
Remote sensing technologies, such as IR cameras and FTIR fence line monitors, are enhancing existing LDAR programs. IR cameras are important because they help facilities detect significant fugitive equipment leaks (e.g., greater than 3,000 ppmv) that account for the majority of fugitive emissions. There are situation where traditional fugitive emissions monitoring techniques (EPA Method 21) incorrectly identify the source of a leak. Following is one example provided by a study participant.
Method 21 investigations identified a compressor seal that was leaking. The compressor was taken out of service and the seal replaced. Once put back into service, the seal was again

HARC Project H76 41October 27, 2006
tested using Method 21 and found to still be leaking. At this point an infrared camera was used to help identify the exact source of the leak. Instead of a leaking compressor seal, the camera identified a pinhole leak in a valve cover near the compressor that was shooting a stream of VOC toward the compressor. Method 21 had erroneously identified the compressor seal as the source of VOC when, in fact, it was not leaking. Once identified the valve cover was replaced and the leak eliminated. Use of the IR camera prior to initiating the compressor seal repair would have saved approximately $30,000.
It is reasonable to assume that these benefits are transferable to other facilities.
In general, study participants are strong supporters of enhanced use of remote sensing technologies to find and eliminate or reduce sources of HRVOC and other pollutants.
4.11 Education and Training
Most education and training was focused on operators and instrument technicians, both of whom have significant interaction with the HRVOC monitoring systems on a daily basis. Facilities invested significant time and expense to train operators and technicians.
4.12 Economic Evaluation
It appears that any economic evaluation of the program is premature at this point, although most facilities believe that this program will have no economic return in the long-term.
4.13 Observed Ambient HRVOC Concentrations
Photochemical Assessment Monitoring Stations (PAMS) in the Houston Ship Channel area provide near real-time ozone, NOx and meteorological data, and continuous measurement for 55 common VOCs.21 Between 2003 and 2005, average network-wide monitored HRVOC levels declined by more than 36% in the Houston Ship Channel as shown in Figure 4-1.22 Average concentrations by location are shown in Figure 4-2.23
Reported HRVOC emissions for facilities located in Harris County, as shown in Figure 4-3, increased between 2002 and 2004 while total VOC emissions (Figure 4-4) remained relatively constant. Values for 2005 are not yet available.
As noted elsewhere in this report, emission reduction projects at nine facilities representing approximately 67.5% of HECT program allowance allocations will result in a combined reduction in HRVOC emissions of 396 tons/year or, on average, approximately 1.1 tons/day. Several of the participating facilities have calculated/measured emissions that are well below their HECT cap.
21 Houston Regional Monitoring Corporation, Air Quality Trends in the Houston-Galveston-Brazoria Area (An Historical Perspective), May 2006. 22 Ibid. 23 Ibid.

HARC Project H76 42October 27, 2006
0
5
10
15
20
25
30
35
2003 2004 2005
Calendar Year
Ave
rage
Con
cent
ratio
n (p
pb)
Butenes1,3-ButadienePropyleneEthylene
0
5
10
15
20
25
30
35
40
45
50
HRM 3 LynchburgFerry
WallisvilleRoad
Clinton Drive Deer Park Channelview Chavez
Location
Ave
rage
Con
cent
ratio
n (p
pb)
200320042005
FIGURE 4-1. Total HRVOC Network Average Concentrations at Houston Ship Channel PAMS-GC Monitoring Sites, June-November (Source: Houston Regional Monitoring)
FIGURE 4-2. Average HRVOC Concentrations at Houston Ship Channel PAMS-GC Monitoring Sites, June-November (Source: Houston Regional Monitoring)
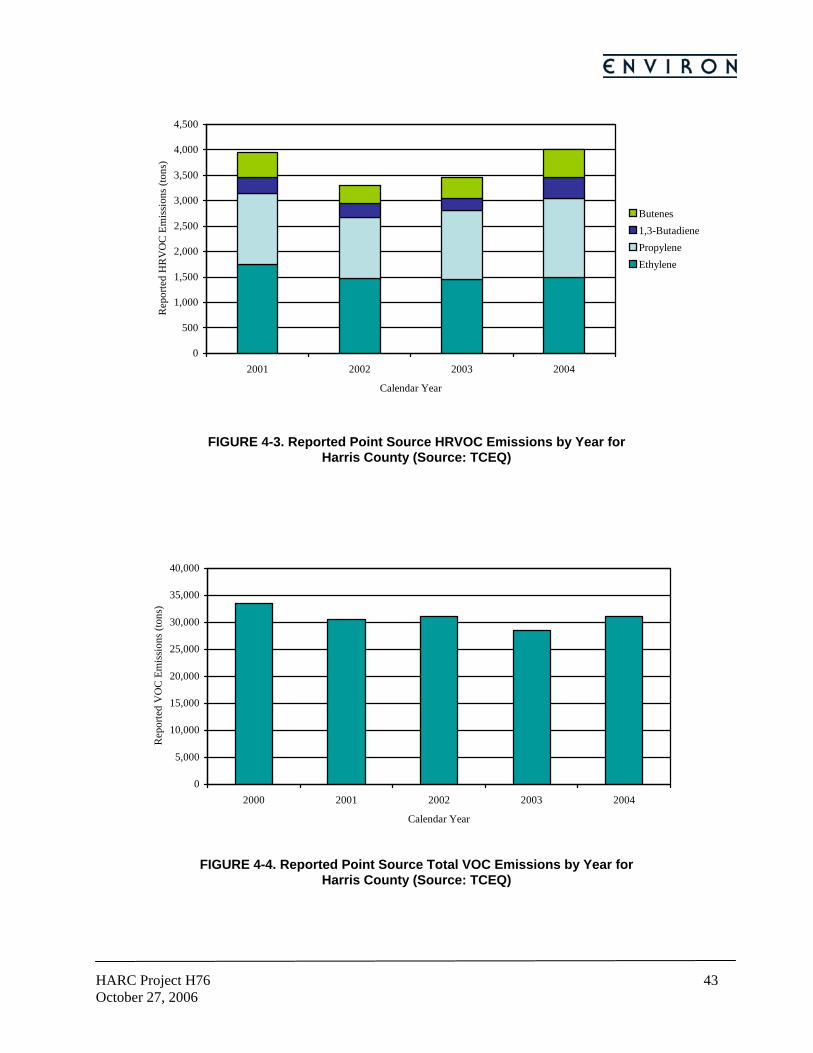
HARC Project H76 43October 27, 2006
0
500
1,000
1,500
2,000
2,500
3,000
3,500
4,000
4,500
2001 2002 2003 2004
Calendar Year
Rep
orte
d H
RV
OC
Em
issi
ons (
tons
)
Butenes1,3-ButadienePropyleneEthylene
0
5,000
10,000
15,000
20,000
25,000
30,000
35,000
40,000
2000 2001 2002 2003 2004
Calendar Year
Rep
orte
d V
OC
Em
issi
ons (
tons
)
FIGURE 4-3. Reported Point Source HRVOC Emissions by Year for Harris County (Source: TCEQ)
FIGURE 4-4. Reported Point Source Total VOC Emissions by Year for Harris County (Source: TCEQ)
HARC Project H76 44October 27, 2006
Additional items for consideration:
• The HRVOC monitors were installed to improve our knowledge about the mass levels and types of HRVOC emitted and to support the 1200 lbs/hr short term limit program and the annual HRVOC Cap and Trade program.
• The HRVOC monitors do not reduce emissions; however, awareness of the magnitude of actual emissions can trigger actions to reduce emissions.
• The HRVOC monitors support emissions limits and controls programs. The cap and trade program is what provides regulatory limits for annual emissions.
• The HRVOC hourly cap of 1200 lbs/hour has been in effect since April 2006.
• The annual cap (which has a facility specific allowance that can be held, traded, or supplemented with purchased allowances) does not go into effect until 2007.
• Concerns about the impact of HRVOC emissions on ground-level ozone formation have existed since the early findings releases for TexAQS in late 2000. Since then, industrial facilities have implemented voluntary episodic emission reduction initiatives as well as complied with more stringent regulatory requirements, both with resultant decreases in HRVOC emissions. Examples include: − Reduced flaring of streams containing HRVOC. − Reductions in the concentration and flow of HRVOC in process vents and streams that are
flared. − More attention and response to heat exchanger leaks that may cause the release of HRVOC
through cooling water towers. − More attention towards reducing the number as well as the duration and flow of HRVOC during
upsets, startups, shutdowns and maintenance activities including turnarounds. − Implementation of practices which reduce the number of upsets. − Reduced process fugitive emissions due to more stringent leak detection and repair (LDAR)
program requirements, including implementation of HRVOC the LDAR program starting in 2004.
− Shutdown or idling of industrial facilities due to financial considerations. − Compliance with the federal emission standards (e.g. Ethylene MACT). All of the actions identified will likely be applied in the future in order for facilities to meet their hourly and annual caps
• It is possible that the facilities which did not participate in this study, representing 32.5% of HECT program allowance allocations, may achieve larger reductions of HRVOC emissions in order to comply with the HECT program cap.
• Presented in the December 13, 2002 SIP revision is an estimate of 5,610 tons of HRVOC emitted annually from flares, process vents and cooling towers located at facilities in Harris County.24 The TCEQ prepared this estimate using reported emissions for calendar year 2000 and a series of assumptions, including use of ambient concentrations measured during TexAQS to adjust inventory
24 Table 6.2-1, Initial HRVOC Site-Cap Allocations, in the TCEQ document Post-1999 Rate-of-Progress and Attainment Demonstration Follow-Up SIP for the Houston/Galveston Ozone Nonattainment Area, Rule Log No. 2002-046a-SIP-AI, December 13, 2002.
HARC Project H76 45October 27, 2006
values. The accuracy of this estimate is not known; however, using the 5,610 ton/year baseline value, a reduction of approximately 2,159 tons per year of HRVOC emissions is required to comply with the HECT program cap (3,451.5 tons/year).
• HRVOC monitors and flow devices identify the composition and volume of what enters a flare, but actual emissions depend on the flare’s destruction efficiency. Currently there are no known methods for accurately measuring destruction efficiency, hence actual flare destruction efficiencies could be significantly less than 98-99+% published by EPA.
• The International Flare Consortium (http://www.nrcan.gc.ca/es/etb/cetc/ifc/home_e.html) is performing additional research on the impact of a set of factors (e.g. composition, BTU content, air assist rates, steam assist rates, cross-winds) to identify flare efficiencies under a variety of conditions and develop any other specifications needed to be included to ensure a destruction efficiency of 98-99+%.
• Since HRVOC monitors track compositions and flow rates going to flares there may be opportunities to correlate various flare parameters with surrounding concentrations to optimize flare destruction efficiencies.
HARC Project H76 46October 27, 2006
5. KEY FINDINGS AND RECOMMENDATIONS
5.1 Key Findings
Following are ENVIRON’s key findings from Project H76 investigations.
• For the nine facilities participating in the study, eight projects have been or are being implemented that, collectively, will reduce HRVOC emissions approximately 396 tons/year. This is equivalent to approximately 17% of the annual allowances allocated to the study participants as a group. As discussed in more detail within the body of this report, several of these projects were undertaken for other reasons, with HRVOC control being a secondary benefit.
• The largest project (as measured by capital cost) undertaken by the study participant group is designed to control unscheduled, episodic emissions for purposes of complying with the short-term, 1200 pound per hour HRVOC emission limit. Reductions in actual annual emissions that will result from this project have not been estimated.
• Collectively, HRVOC projected annual emissions from study participant facilities are less than HECT program allowance allocations. However, there is significant variability within the study group, with projected actual emissions ranging from 18% to 115% of annual allowance allocations. How this finding compares to the larger population of HECT program affected facilities in Harris County is unknown.
• No study participant indicated that they are going to rely upon the purchase of allowances to cover actual emissions in excess of allocations. Instead, they are taking measures necessary to ensure that site and/or company allowance allocations are more than adequate to cover anticipated actual emissions. Ownership of sufficient allowances is critical to facility operation and the HECT allowance markets are considered under-developed and unreliable at this time. Reliance on this market for continued facility operation is considered an overly risky strategy.
• Some study participants have taken steps to use HRVOC monitoring data to improve operating and maintenance practices that may lead to a reduction in future emissions. However, at this time, insufficient monitoring data is available to determine longer-term responses, such as changes in management and/or operating practices that may reduce the frequency and magnitude of transient emissions and/or baseline emissions. So far, the primary use of HRVOC monitoring seems to be earlier identification of leaks from process heat exchangers and in identifying the source of flare emissions.
• HRVOC monitoring program implementation costs are higher than estimated during HRVOC rule development. For example, the average cost of an installed HRVOC monitor at the participating facilities is approximately $569,000. This compares to an estimate of $88,000 to $90,000 presented in the 2002 HRVOC rule development documents. Actual source testing costs and estimated annual operation and maintenance costs are also higher than estimated during rule development.
• Insufficient data is available at this time to evaluate economic benefits resulting from the recovery and sale or reuse of materials that would have otherwise been emitted or flared.
• Use of remote sensing to identify and reduce and/or eliminate sources of HRVOC and other emissions have already demonstrated specific economic and environmental value and should continue to be promoted.
HARC Project H76 47October 27, 2006
• Data collected by the Houston Regional Monitoring Corporation indicates a significant reduction in annual average HRVOC concentrations along the Houston Ship Channel between 2003 and 2005. ENVIRON discusses in the Analysis section of this report the potential reasons for this reduction; however, to the best of our knowledge, no investigation into the actual causes has been conducted.
• HRVOC CEMS monitor loading to flares, not actual emissions to atmosphere. For purposes of HRVOC program compliance demonstrations, flares are assumed to be either 93, 98 or 99% efficient in destroying HRVOC based on the compound flared and conformance with design criteria in 40 CFR 60.18. Deviation relative to assumed efficiencies could result in emissions to the atmosphere that are significantly different – higher or lower – than estimated and reported under the HRVOC program.
5.2 Best Management Practices
During the course of this study, ENVIRON identified what we consider to be “best management practices” in use among one or more of the study participants. These are as follows.
• Early engagement in the regulatory development and stakeholder process increases the ability to understand and develop strategic responses to regulatory developments and to provide input to the regulatory agency on rule design and technical implementation issues.
• Allocation of sufficient resources in a timely fashion to facilitate effective implementation of rule requirements. It has been recommended by more than one study participant that the design, implementation, and startup of a large-scale emissions monitoring program requires a minimum of two years.
• Most facilities have found managing the very large quantities of data associated with the HRVOC program to be a significant challenge. The most successful facilities either leveraged existing environmental data management systems at the site that had been used successfully with other environmental monitoring programs (e.g. NOX MECT program) or, at significant cost, purchased and implemented other systems that had been used successfully in similar applications at other sites. As with monitor installation and startup, allocation of sufficient resources in a timely fashion was critical.
• Key to a successful, rapid implementation was a sufficient number of skilled analyzer technicians and/or engineers, both in-plant and supplied by the analyzer manufacturer. Facilities with a limited number of analyzer installations and/or those facilities with simpler data management protocols were able to more rapidly obtain reliable data following startup.
• Some facilities designed their monitoring systems to accommodate, to the extent possible, future expansion of HRVOC monitoring requirements (i.e., monitoring of additional compounds). This may result in lower cost and more rapid implementation should this program be expanded in the future.
• Certain facilities are actively using HRVOC monitoring data to improve operations and maintenance practices. One study participant advocates the use of the HRVOC monitoring data as a feedback mechanism to continuously improve operations and to explore ways to reduce and/or eliminate HRVOC flow to facility flares.
• Some companies have used remote sensing technologies to great effect in finding and fixing sources of HRVOC and other VOC emissions. One company in particular is of the opinion that savings resulting from use of infrared camera technology paid for the purchase and use of the camera within only a few months. Another company is supportive of the use of fence line FTIR to determine

HARC Project H76 48October 27, 2006
ambient concentrations of HRVOC and use of that information to target emission reduction opportunities.
5.3 Recommendations
ENVIRON offers the following recommends with respect to Project H76 findings.
• Further study once more data is available for evaluating trends and developing more detailed cost-effectiveness estimates. It is recommended that this study be updated once at least two years of monitoring data has been collected and reported.
• As noted, there has been a greater than 36% decrease in annual average HRVOC concentrations in the vicinity of the Houston Ship Channel between 2003 and 2005. It is recommended that the underlying causes for this decrease be investigated further for the purpose of identifying those measures that result in actual HRVOC emission reductions.
• Continue the investigations initiated by URS Corporation and the University of Houston in 2004 with respect to flare performance. Specifically, through use of remote sensing technologies and/or ambient sampling, investigate in-field destruction efficiency of flares under a variety of operating and meteorological conditions.
• Continue investigation of opportunities for use of remote sensing to identify sources of emissions for use in developing cost-effective, source-specific reduction strategies.

HARC Project H76 October 27, 2006
A P P E N D I X A
Information on Participant Companies
HARC Project H76 A-1 October 27, 2006
Basell USA Bayport Plant
Basell is the world's largest producer of polypropylene and advanced polyolefins products, a leading supplier of polyethylene and catalysts, and a global leader in the development and licensing of polypropylene and polyethylene processes. Basell, together with its joint ventures, has manufacturing facilities around the world and sells products in more than 120 countries. With research and development activities in Europe, North America and the Asia-Pacific region, Basell is continuing a technological heritage that dates back to the beginning of the polyolefins industry.
Located on 147 acres within the Bayport Industrial Complex in Pasadena, Texas, operations at the Bayport Plant date to 1974. Originally owned by Hercules, the site is now 100% owned and managed by Basell Polyolefins. Over time, older conventional slurry-based polymer plants have been replaced by the inherently safer Spheripol and Catalloy Basell-owned technologies, of which the former is well established. The Catalloy polymers unit at Bayport is one of four in the world, all owned and operated by Basell. The Bayport facilities now comprise:
• Three Spheripol polypropylene trains of total 675,000 ton per year capacity, and
• One 100,000 ton per year Catalloy polymers unit, as well as
• Finishing buildings, extrusion facilities, and support infrastructure.
Celanese Corporation Clear Lake Plant
As a global leader in the chemicals industry, Celanese Corporation makes products essential to everyday living. Products, found in consumer and industrial applications, are manufactured in North America, Europe and Asia. Celanese is the world’s largest producer of acetyl products, including acetic acid and vinyl acetate monomer ("VAM"), polyacetal products ("POM"), as well as a leading global producer of high-performance engineered polymers used in consumer and industrial products and designed to meet highly technical customer requirements.
The Celanese Clear Lake Plant has been a world leader in the production of bulk organic materials since it opened in 1967. A continuous program of innovation and improvement has increased the original plant's capacity and reduced energy requirements. The products produced are shipped worldwide via pipeline, oceangoing tankers, barges, rail and highway tank trucks. Safety records have consistently been among the industry's very best. Key products include acetic acid and vinyl acetate. Acetic acid is used in water-based paints, paper coatings, textile finishes, adhesives, tires, filter products, pharmaceuticals, aspirin, cosmetics, artificial sweetener, car wax, safety glass. Vinyl acetate is used in vinyl, acrylic and vinyl-acrylic paints, glue, paper coatings, textile finishes, inks, cosmetics, safety glass, candy.
HARC Project H76 A-2 October 27, 2006
Chevron Phillips Chemical Company LLC Cedar Bayou Plant
Chevron Phillips Chemical Company LLC with its affiliates has nearly $7 billion in assets, operates 37 manufacturing and research facilities in eight countries, and employs approximately 5,150 persons worldwide. As one of Chevron Phillips Chemical’s 31 manufacturing facilities, the Cedar Bayou Plant is located on Interstate 10 approximately 30 miles east of downtown Houston in Baytown, Texas. In operation for over 40 years, the Cedar Bayou Plant produces ethylene, propylene, polyethylene, normal alpha olefins, and polyalphaolefins. These products are used in the manufacture of consumer products ranging from milk jugs and food packaging to fuel additives and lubricants.
The Cedar Bayou Plant is committed to environmental excellence. Total air emissions at the Cedar Bayou Plant are trending downward with a 46 percent absolute reduction in air emissions during 2001–2005 while production at the facility has increased. The total amount of air emissions per pound of production at the Cedar Bayou Plant shows a 53 percent reduction during the 2001– 2005 period. Chevron Phillips Chemical has also invested more than $72 million for environmental upgrades to its Cedar Bayou Plant. These improvements have resulted in significant reductions of sulfur dioxide (SO2) and NOX emissions, and provided for monitoring of HRVOC (highly reactive volatile organic compound) emissions.
ExxonMobil Chemical Company Baytown Chemical and Baytown Olefins Plants
ExxonMobil Chemical is one of the largest worldwide petrochemical companies. It is an integrated manufacturer and global marketer of olefins, aromatics, fluids, synthetic rubber, polyethylene, polypropylene, oriented polypropylene packaging films, plasticizers, synthetic lubricant basestocks, additives for fuels and lubricants, zeolite catalysts and other petrochemical products.
The mission of the ExxonMobil Chemical Company is to provide quality petrochemical products and services in the most efficient and responsible manner to generate outstanding customer and shareholder value. For more than 75 years, ExxonMobil has been part of the Baytown community. The ExxonMobil Baytown petroleum and petrochemical complex is the largest of this type in the world and the largest manufacturing complex in North America. It consists of a refinery, two chemical plants and two research centers. ExxonMobil provides approximately 4,000 full-time and 2,000 contract jobs in Baytown.
The Baytown Chemical Plant, located on the Gulf coast of Texas, began operations in 1940. Products include polypropylene (packaging, diapers), butyl polymers (tires, bottle stoppers), and specialty fluids (paint, household cleaners).
The Baytown Olefins Plant was founded in 1979. Products include ethylene, propylene and butadiene, with ethylene accounting for about three-fourths of the annual production. The plant is the largest, single-train ethylene facility in the world and is equipped with state-of-the-art technology.
HARC Project H76 A-3 October 27, 2006
ExxonMobil Corporation Baytown Refinery
ExxonMobil’s Refining and Supply business focuses on providing quality products and feedstocks to its customers. The company efficiently manufactures clean fuels, lubes, and other high-valued products utilizing a highly integrated asset base that includes an ownership interest in 45 refineries, located in 25 countries, with distillation capacity of 6.3 million barrels per day and lubricant basestock manufacturing capacity of 145 thousand barrels per day
A global supply organization coordinates and optimizes the supply of crude and feedstock to the refineries, the mix of products produced, and working inventory. The supply organization also manages an efficient and flexible global logistics system that includes ownership interest in 32 crude oil and petroleum product tankers, more than 25 thousand miles of pipelines, and over 300 major petroleum products terminals.
Originally operated by the Humble Oil Company, the refinery dates to 1919. Today it is the largest employer in Baytown.
The Lyondell Chemical Company Channelview Chemical Complex
With $18.6 billion in consolidated revenues, the Lyondell Chemical Company and its wholly-owned subsidiaries, Equistar Chemicals and Millennium Chemicals, are global leaders in the manufacture of chemicals and polymers, building blocks for countless products that people around the world use every day. From cars to homes, from the grocery store to the office, Lyondell’s products are vital to the goods that people throughout the world depend upon to enhance their quality of life.
Lyondell manufactures basic chemicals and derivatives including ethylene, propylene, titanium dioxide, styrene, polyethylene, propylene oxide and acetyls. Lyondell is also a refiner of heavy, high-sulfur crude oil and a significant producer of gasoline-blending components. With headquarters in Houston, Texas, Lyondell operates on five continents and employs approximately 11,000 people worldwide.
The Channelview Chemical Complex manufactures a large variety of basic chemicals including ethylene, propylene, butadiene, benzene, toluene, alkylate, MTBE, propylene oxide, styrene monomer, and butanediol.
Shell Deer Park Refining and Chemical Plant
Shell Deer Park is located on the Houston Ship Channel 20 miles east of downtown Houston. The site, originally developed in 1929, covers 1,500 acres and is a fully integrated refinery and petrochemical plant with approximately 1,700 employees plus contractors’ employees. The refinery is Shell’s largest in the U.S. and sixth largest overall in the United States with a crude oil

HARC Project H76 A-4 October 27, 2006
capacity of 340,000 barrels a day. It operates as Deer Park Refining Limited Partnership, a 50-50 joint venture formed in 1993 between Shell Oil Company and Petroleos Mexicanos or Pemex. The chemical plant manufactures base chemicals or raw material chemicals that are sold to other chemical companies that transform them into thousands of consumer products ranging from plastics to building materials.
Shell Deer Park’s top priorities are health and safety, environment, security, quality products and being a good neighbor with local communities. In 2004, both the refinery and chemical plant received certification to the ISO 14001 international standard for environmental management systems.
Texas Petrochemicals LP Houston Plant
Texas Petrochemicals LP (TPC) is dedicated to C4 hydrocarbons processing, development and manufacturing. The Houston Plant’s integrated manufacturing facilities focus on production and marketing within four main business units: C4 Olefins, Specialty Chemicals, Fuel Products and Polyisobutylene. TPC maintains its leadership in the industry with an innovative ability to bring high-quality products to the marketplace. Among the diverse product lines available to TPC customers are Butadiene, Butene-1, Isobutylene and Isobutylene derivatives.
TPC uses Process Safety Management practices to provide a safe operating facility for its employees and neighbors.
• The company interacts with Local Emergency Planning Committees and Mutual Aid groups to help with emergency needs within the community.
• TPC meets regularly with a Citizens Advisory Panel made up of representatives from neighboring communities, schools and business leaders to identify and address community issues.
• TPC maintains a fully-equipped quality control laboratory for sampling and testing to ensure all feedstocks and products meet TPC's rigorous quality standards.
• TPC operates all of its own equipment necessary to comply with national and regional environmental, health and safety laws and regulations. The professional deployment of these tools and measures protects our excellent safety record.
TPC works continuously to provide a strong, positive statement for safety and the environment.
HARC Project H76 October 27, 2006
A P P E N D I X B
Data Collection Survey
HARC Project H76 October 27, 2006 B-1
PROJECT H76 FACILITY QUESTIONNAIRE
1. How many continuous emission monitors (including both CMS on process vents, flares and cooling
towers, and actual CEMS on process vents) are installed at your facility?
2. Are any of your process vents equipped with continuous emission monitoring systems (CEMS)? If
yes, how many?
3. How many process vents, flares and/or cooling towers at your facility are you monitoring?
4. When did you install the continuous emission monitors?
5. Were the continuous emission monitors operating properly by the January 31, 2006 deadline?
6. What are the total installed costs – itemized if available – for HRVOC continuous emission monitors,
including instrumentation, housing, testing, calibration, etc.?
7. What are the estimated annual operating and maintenance costs – itemized if available – for
continuous emission monitors?
8. Who supplied your continuous emission monitors?
9. What were the associated source testing costs for process vents?
10. How often do you purchase specialized calibration gases for calibration of your continuous emission
monitors?
11. What is the cost associated with the purchase of these specialized calibration gases?
12. How often do you calibrate your continuous emission monitors?
13. Have you experienced any specific problems with the calibration procedures as required by the
HRVOC rules?
14. Did your facility encounter any difficulties during implementation of the HRVOC point source
monitoring program?
15. If yes: What types of difficulties did your facility encounter during implementation of the HRVOC
point source monitoring program? For example,
a. Delay in delivery of HRVOC monitoring equipment
b. Technical problems with HRVOC monitoring equipment
c. Technical problems with stack testing
d. Logistical problems with stack testing
e. Technical problems with data acquisition and handling system
16. Which data management system do you use to manage HRVOC monitoring and compliance data?
17. What do you do with the data collected by the data management system?
HARC Project H76 October 27, 2006 B-2
18. How are you handling data management system problems in relation to Title V deviation reporting
requirements?
19. What was the cost to purchase, install and implement the HRVOC program-specific data
management software or modify/upgrade existing compliance systems, inclusive of any associated
hardware purchases?
20. What are the estimated annual costs to maintain the data management system?
21. As a direct result of the HRVOC point source monitoring program, has your facility made any
changes to its maintenance programs?
22. If yes: Please describe the specific changes to your facility’s maintenance program (i.e., enhanced
inspection and maintenance programs).
23. As a direct result of the HRVOC point source monitoring program, has your facility made any
changes to its operating practices?
24. If yes: Please describe the specific changes to your facility’s operating practices.
25. As a direct result of the HRVOC point source monitoring program, has your facility made any
equipment upgrades and/or replacements (i.e., accelerated equipment replacements and upgrades)?
26. Please describe any equipment upgrades and/or replacements.
27. As a direct result of the HRVOC point source monitoring program, has your facility made any
investments in emission control systems?
28. Please describe your facility’s investments in emission control systems.
29. What are the costs of these investments in emission control systems?
30. Has the HRVOC point source monitoring program enabled your facility to eliminate/reduce HRVOC
emissions?
31. Please describe any reductions in emissions that have been realized or that you expect to realize by
January 1, 2007.
32. What is your estimated economic value of materials recovered as a direct result of the HRVOC
monitoring program, if applicable?
33. Please provide itemized capital and operating costs for implementation of HRVOC emission
reduction measures.
34. Has the HRVOC point source monitoring improved your facility’s general awareness of potential
HRVOC emissions as compared to before the monitors were actually installed?
35. Prior to the installation of the HRVOC monitors, did your facility know which measures/practices
affected the existence and magnitude of HRVOC emissions?
36. What are these measures/practices?
HARC Project H76 October 27, 2006 B-3
37. Have you learned anything new about measures and practices that affect the existence and magnitude
of HRVOC emissions as a direct result of the HRVOC monitoring program? For example, the
HRVOC monitoring program has helped us to
a. Confirm that some or all previously identified measures/practices affect the existence and
magnitude of HRVOC emissions
b. Disprove that some or all previously identified measures/practices affect the existence and
magnitude of HRVOC emissions
c. Identify additional measures/practices that affect the existence and magnitude of HRVOC
emissions
38. What are these additional measures/practices?
39. Was an infrared camera used at your facility to locate potential sources of HRVOC emissions?
40. If yes: Which covered facilities did your facility identify as having the HRVOC emissions? For
example,
a. Process vents
b. Cooling towers
c. Fugitive equipment components (including fugitive leaks from pressure relief valves)
41. If yes: Upon identifying the source of the HRVOC emissions using the infrared camera, what did
you do?
42. As a direct result of the HRVOC point source monitoring program, has your facility made any
changes in how emission events are prevented and/or managed?
43. If yes: Please describe the specific changes to how emission events are prevented and/or managed.
44. As a direct result of the HRVOC point source monitoring program, has your facility implemented
education and training of personnel with respect to management of HRVOC emission?
45. Please describe any education and training of personnel directly related to the HRVOC monitoring
program.

HARC Project H76 October 27, 2006
A P P E N D I X C
Flare and Cooling Tower Equipment Listing
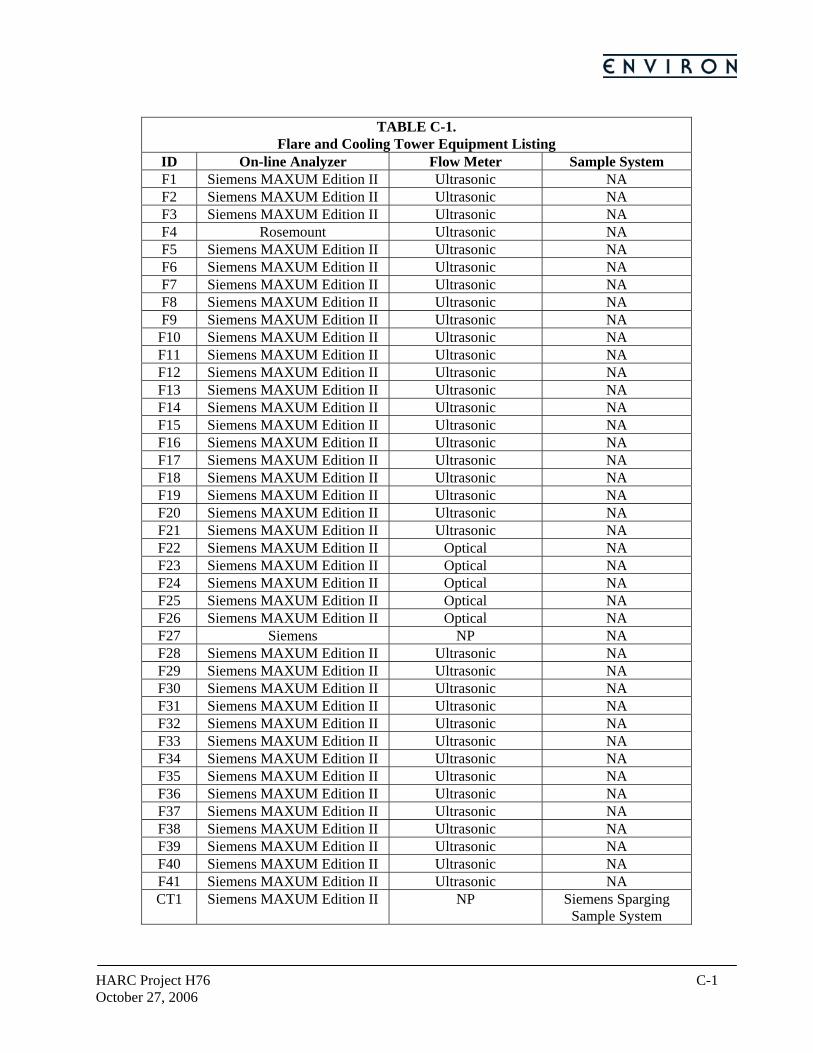
HARC Project H76 C-1 October 27, 2006
TABLE C-1.
Flare and Cooling Tower Equipment Listing ID On-line Analyzer Flow Meter Sample System F1 Siemens MAXUM Edition II Ultrasonic NA F2 Siemens MAXUM Edition II Ultrasonic NA F3 Siemens MAXUM Edition II Ultrasonic NA F4 Rosemount Ultrasonic NA F5 Siemens MAXUM Edition II Ultrasonic NA F6 Siemens MAXUM Edition II Ultrasonic NA F7 Siemens MAXUM Edition II Ultrasonic NA F8 Siemens MAXUM Edition II Ultrasonic NA F9 Siemens MAXUM Edition II Ultrasonic NA
F10 Siemens MAXUM Edition II Ultrasonic NA F11 Siemens MAXUM Edition II Ultrasonic NA F12 Siemens MAXUM Edition II Ultrasonic NA F13 Siemens MAXUM Edition II Ultrasonic NA F14 Siemens MAXUM Edition II Ultrasonic NA F15 Siemens MAXUM Edition II Ultrasonic NA F16 Siemens MAXUM Edition II Ultrasonic NA F17 Siemens MAXUM Edition II Ultrasonic NA F18 Siemens MAXUM Edition II Ultrasonic NA F19 Siemens MAXUM Edition II Ultrasonic NA F20 Siemens MAXUM Edition II Ultrasonic NA F21 Siemens MAXUM Edition II Ultrasonic NA F22 Siemens MAXUM Edition II Optical NA F23 Siemens MAXUM Edition II Optical NA F24 Siemens MAXUM Edition II Optical NA F25 Siemens MAXUM Edition II Optical NA F26 Siemens MAXUM Edition II Optical NA F27 Siemens NP NA F28 Siemens MAXUM Edition II Ultrasonic NA F29 Siemens MAXUM Edition II Ultrasonic NA F30 Siemens MAXUM Edition II Ultrasonic NA F31 Siemens MAXUM Edition II Ultrasonic NA F32 Siemens MAXUM Edition II Ultrasonic NA F33 Siemens MAXUM Edition II Ultrasonic NA F34 Siemens MAXUM Edition II Ultrasonic NA F35 Siemens MAXUM Edition II Ultrasonic NA F36 Siemens MAXUM Edition II Ultrasonic NA F37 Siemens MAXUM Edition II Ultrasonic NA F38 Siemens MAXUM Edition II Ultrasonic NA F39 Siemens MAXUM Edition II Ultrasonic NA F40 Siemens MAXUM Edition II Ultrasonic NA F41 Siemens MAXUM Edition II Ultrasonic NA CT1 Siemens MAXUM Edition II NP Siemens Sparging
Sample System
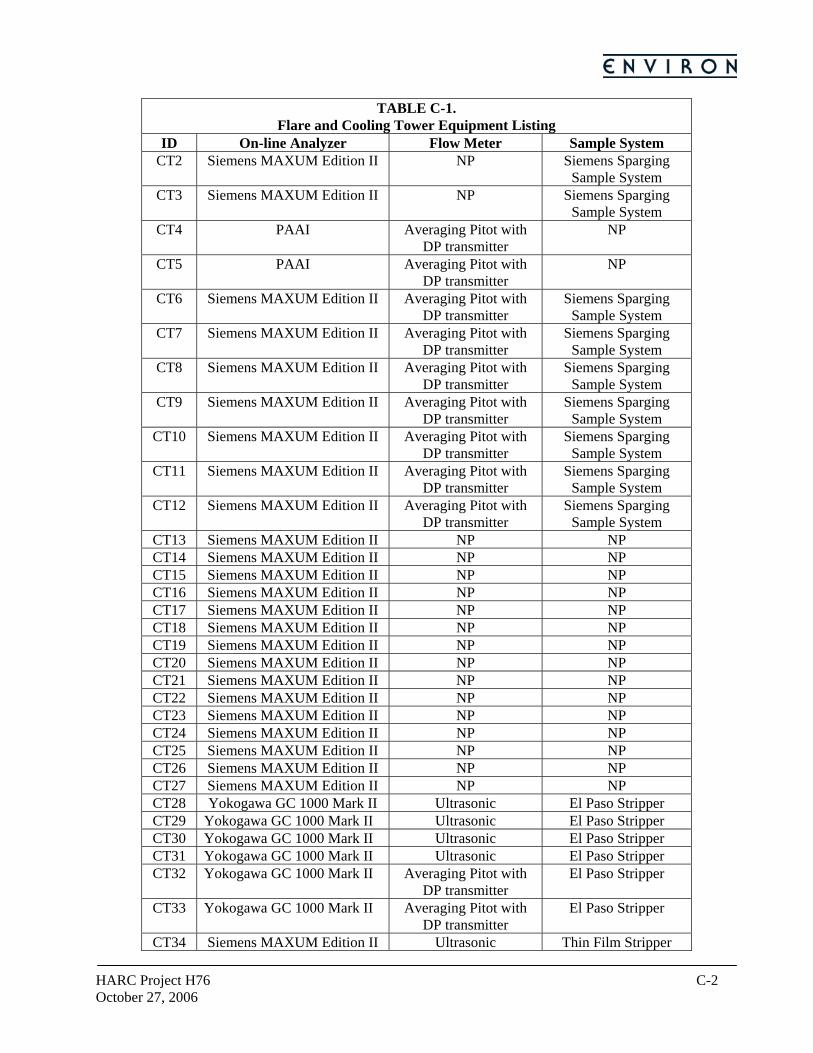
HARC Project H76 C-2 October 27, 2006
TABLE C-1. Flare and Cooling Tower Equipment Listing
ID On-line Analyzer Flow Meter Sample System CT2 Siemens MAXUM Edition II NP Siemens Sparging
Sample System CT3 Siemens MAXUM Edition II NP Siemens Sparging
Sample System CT4 PAAI Averaging Pitot with
DP transmitter NP
CT5 PAAI Averaging Pitot with DP transmitter
NP
CT6 Siemens MAXUM Edition II Averaging Pitot with DP transmitter
Siemens Sparging Sample System
CT7 Siemens MAXUM Edition II Averaging Pitot with DP transmitter
Siemens Sparging Sample System
CT8 Siemens MAXUM Edition II Averaging Pitot with DP transmitter
Siemens Sparging Sample System
CT9 Siemens MAXUM Edition II Averaging Pitot with DP transmitter
Siemens Sparging Sample System
CT10 Siemens MAXUM Edition II Averaging Pitot with DP transmitter
Siemens Sparging Sample System
CT11 Siemens MAXUM Edition II Averaging Pitot with DP transmitter
Siemens Sparging Sample System
CT12 Siemens MAXUM Edition II Averaging Pitot with DP transmitter
Siemens Sparging Sample System
CT13 Siemens MAXUM Edition II NP NP CT14 Siemens MAXUM Edition II NP NP CT15 Siemens MAXUM Edition II NP NP CT16 Siemens MAXUM Edition II NP NP CT17 Siemens MAXUM Edition II NP NP CT18 Siemens MAXUM Edition II NP NP CT19 Siemens MAXUM Edition II NP NP CT20 Siemens MAXUM Edition II NP NP CT21 Siemens MAXUM Edition II NP NP CT22 Siemens MAXUM Edition II NP NP CT23 Siemens MAXUM Edition II NP NP CT24 Siemens MAXUM Edition II NP NP CT25 Siemens MAXUM Edition II NP NP CT26 Siemens MAXUM Edition II NP NP CT27 Siemens MAXUM Edition II NP NP CT28 Yokogawa GC 1000 Mark II Ultrasonic El Paso Stripper CT29 Yokogawa GC 1000 Mark II Ultrasonic El Paso Stripper CT30 Yokogawa GC 1000 Mark II Ultrasonic El Paso Stripper CT31 Yokogawa GC 1000 Mark II Ultrasonic El Paso Stripper CT32 Yokogawa GC 1000 Mark II Averaging Pitot with
DP transmitter El Paso Stripper
CT33 Yokogawa GC 1000 Mark II Averaging Pitot with DP transmitter
El Paso Stripper
CT34 Siemens MAXUM Edition II Ultrasonic Thin Film Stripper
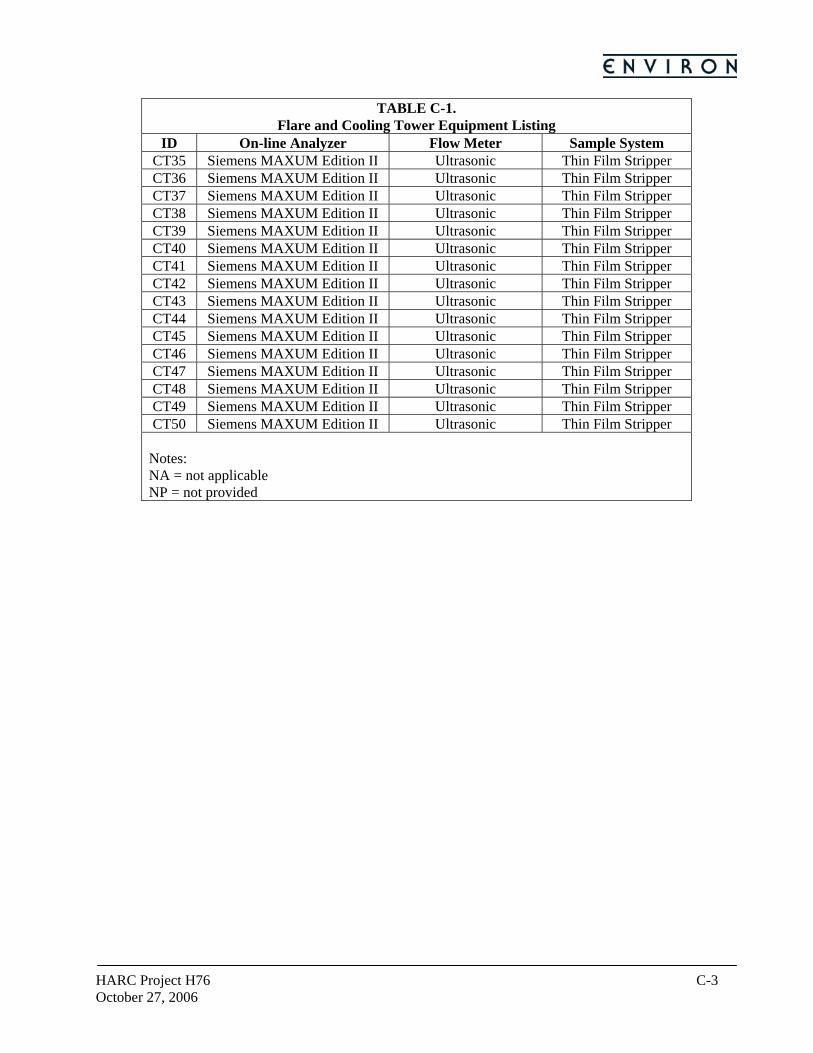
HARC Project H76 C-3 October 27, 2006
TABLE C-1. Flare and Cooling Tower Equipment Listing
ID On-line Analyzer Flow Meter Sample System CT35 Siemens MAXUM Edition II Ultrasonic Thin Film Stripper CT36 Siemens MAXUM Edition II Ultrasonic Thin Film Stripper CT37 Siemens MAXUM Edition II Ultrasonic Thin Film Stripper CT38 Siemens MAXUM Edition II Ultrasonic Thin Film Stripper CT39 Siemens MAXUM Edition II Ultrasonic Thin Film Stripper CT40 Siemens MAXUM Edition II Ultrasonic Thin Film Stripper CT41 Siemens MAXUM Edition II Ultrasonic Thin Film Stripper CT42 Siemens MAXUM Edition II Ultrasonic Thin Film Stripper CT43 Siemens MAXUM Edition II Ultrasonic Thin Film Stripper CT44 Siemens MAXUM Edition II Ultrasonic Thin Film Stripper CT45 Siemens MAXUM Edition II Ultrasonic Thin Film Stripper CT46 Siemens MAXUM Edition II Ultrasonic Thin Film Stripper CT47 Siemens MAXUM Edition II Ultrasonic Thin Film Stripper CT48 Siemens MAXUM Edition II Ultrasonic Thin Film Stripper CT49 Siemens MAXUM Edition II Ultrasonic Thin Film Stripper CT50 Siemens MAXUM Edition II Ultrasonic Thin Film Stripper
Notes: NA = not applicable NP = not provided

HARC Project H76 October 27, 2006
A P P E N D I X D
HRVOC Monitoring Data
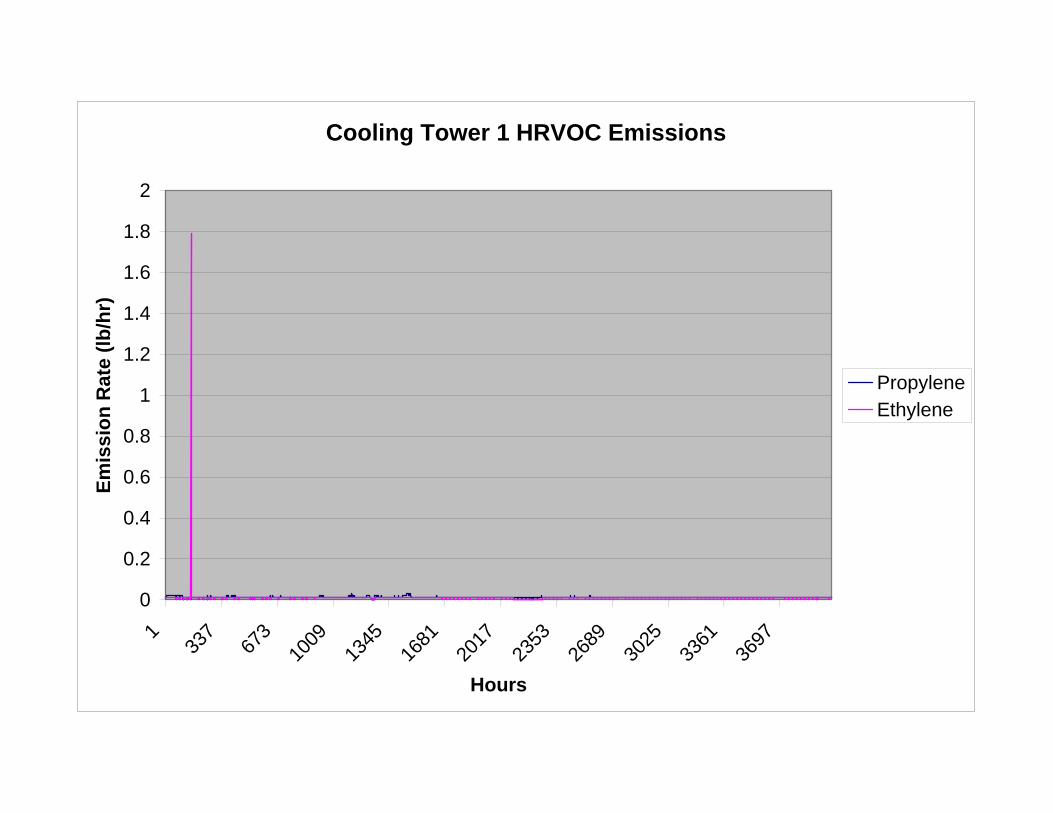
Cooling Tower 1 HRVOC Emissions
0
0.2
0.4
0.6
0.8
1
1.2
1.4
1.6
1.8
2
1
337
673
1009
1345
1681
2017
2353
2689
3025
3361
3697
Hours
Emis
sion
Rat
e (lb
/hr)
PropyleneEthylene
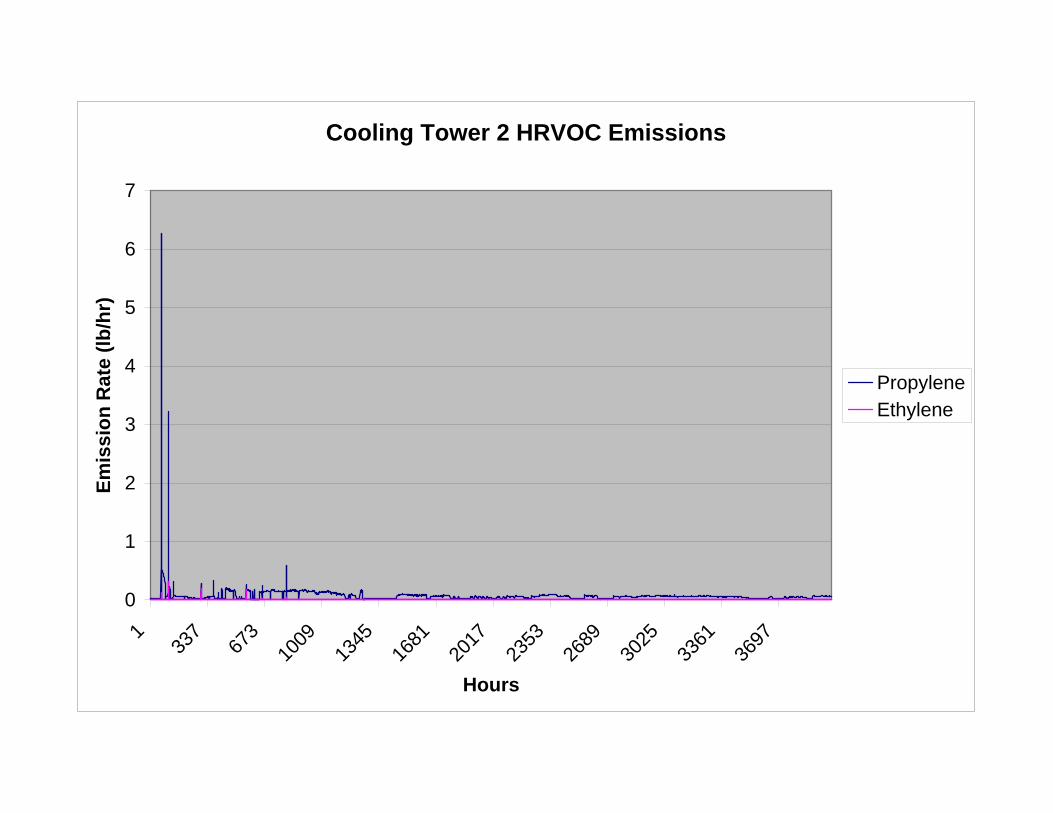
Cooling Tower 2 HRVOC Emissions
0
1
2
3
4
5
6
7
1
337
673
1009
1345
1681
2017
2353
2689
3025
3361
3697
Hours
Emis
sion
Rat
e (lb
/hr)
PropyleneEthylene

Cooling Tower 3 HRVOC Emissions
0
5
10
15
20
25
30
35
40
45
50
1
337
673
1009
1345
1681
2017
2353
2689
3025
3361
3697
Hours
Emis
sion
Rat
e (lb
/hr)
PropyleneEthyleneButene
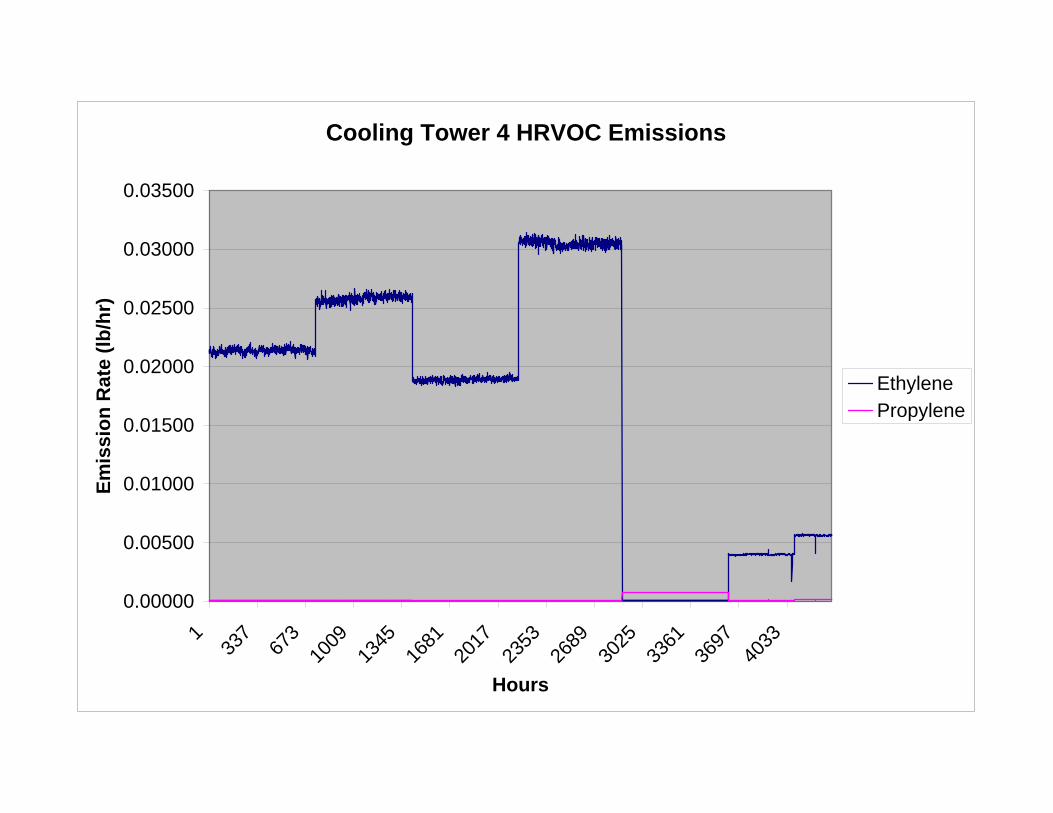
Cooling Tower 4 HRVOC Emissions
0.00000
0.00500
0.01000
0.01500
0.02000
0.02500
0.03000
0.03500
1
337
673
1009
1345
1681
2017
2353
2689
3025
3361
3697
4033
Hours
Emis
sion
Rat
e (lb
/hr)
EthylenePropylene
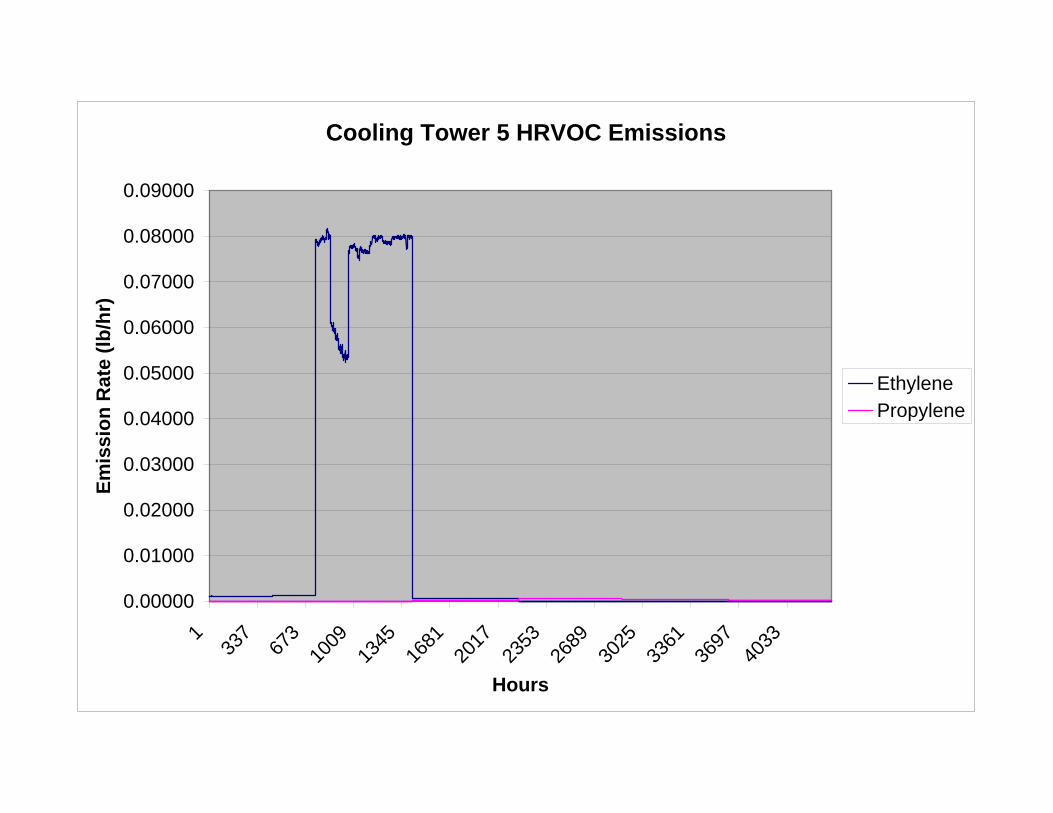
Cooling Tower 5 HRVOC Emissions
0.00000
0.01000
0.02000
0.03000
0.04000
0.05000
0.06000
0.07000
0.08000
0.09000
1
337
673
1009
1345
1681
2017
2353
2689
3025
3361
3697
4033
Hours
Emis
sion
Rat
e (lb
/hr)
EthylenePropylene

Cooling Tower 6 HRVOC Emissions
0
0.2
0.4
0.6
0.8
1
1.2
1.4
1
337
673
1009
1345
1681
2017
2353
2689
3025
3361
3697
Hours
Emis
sion
Rat
e (lb
/hr)
EthylenePropyleneButenecis-Butenetrans-Butene1,3-Butadiene
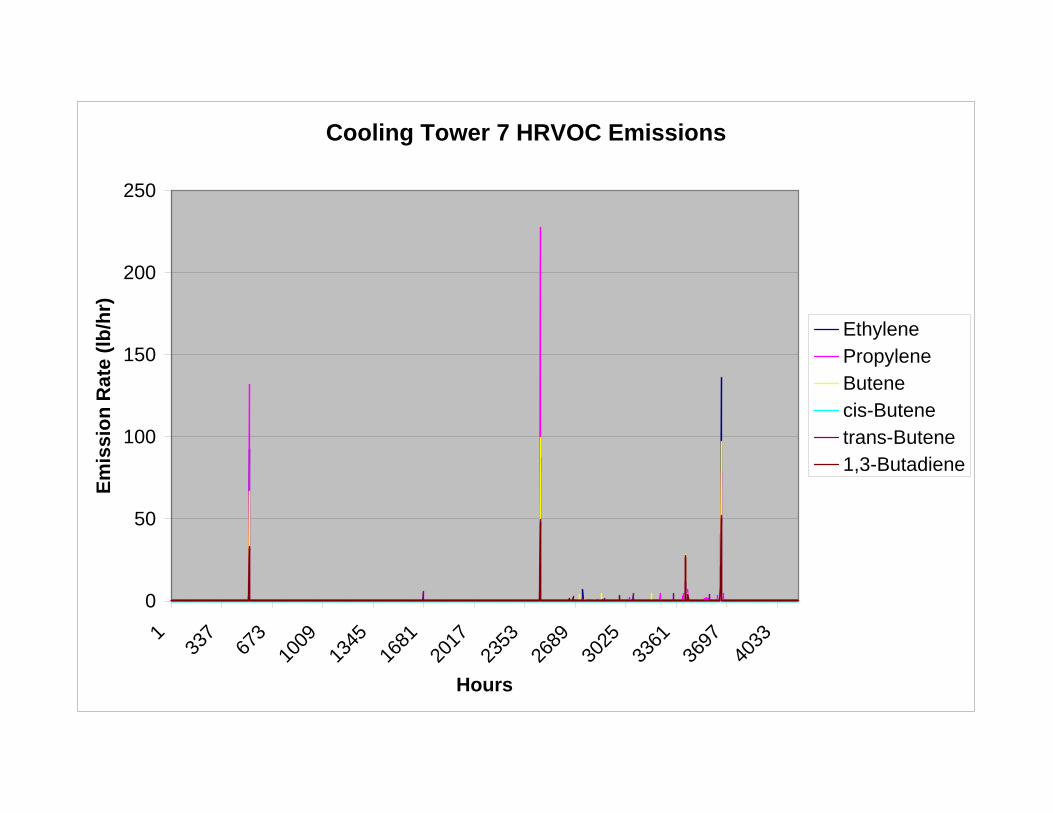
Cooling Tower 7 HRVOC Emissions
0
50
100
150
200
250
1
337
673
1009
1345
1681
2017
2353
2689
3025
3361
3697
4033
Hours
Emis
sion
Rat
e (lb
/hr)
EthylenePropyleneButenecis-Butenetrans-Butene1,3-Butadiene

Cooling Tower 8 HRVOC Emissions
0
5
10
15
20
25
30
1
337
673
1009
1345
1681
2017
2353
2689
3025
3361
3697
4033
Hours
Emis
sion
Rat
e (lb
/hr)
EthylenePropyleneButenecis-Butenetrans-Butene1,3-Butadiene
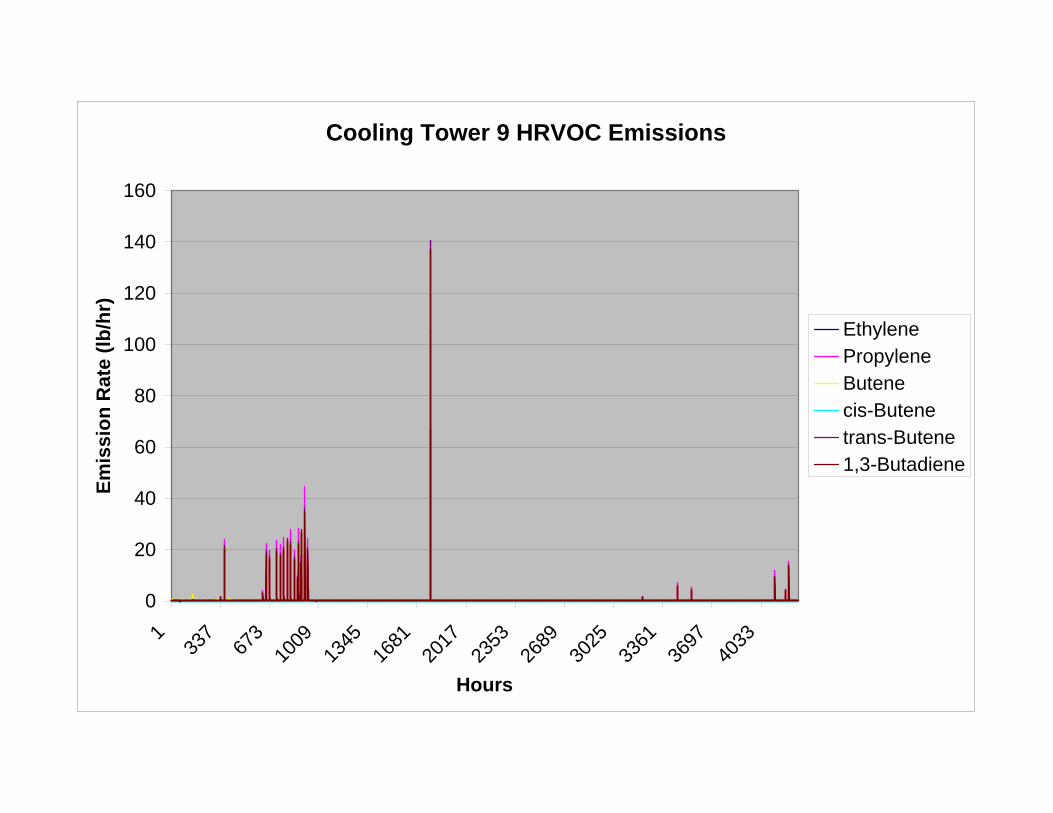
Cooling Tower 9 HRVOC Emissions
0
20
40
60
80
100
120
140
160
1
337
673
1009
1345
1681
2017
2353
2689
3025
3361
3697
4033
Hours
Emis
sion
Rat
e (lb
/hr)
EthylenePropyleneButenecis-Butenetrans-Butene1,3-Butadiene
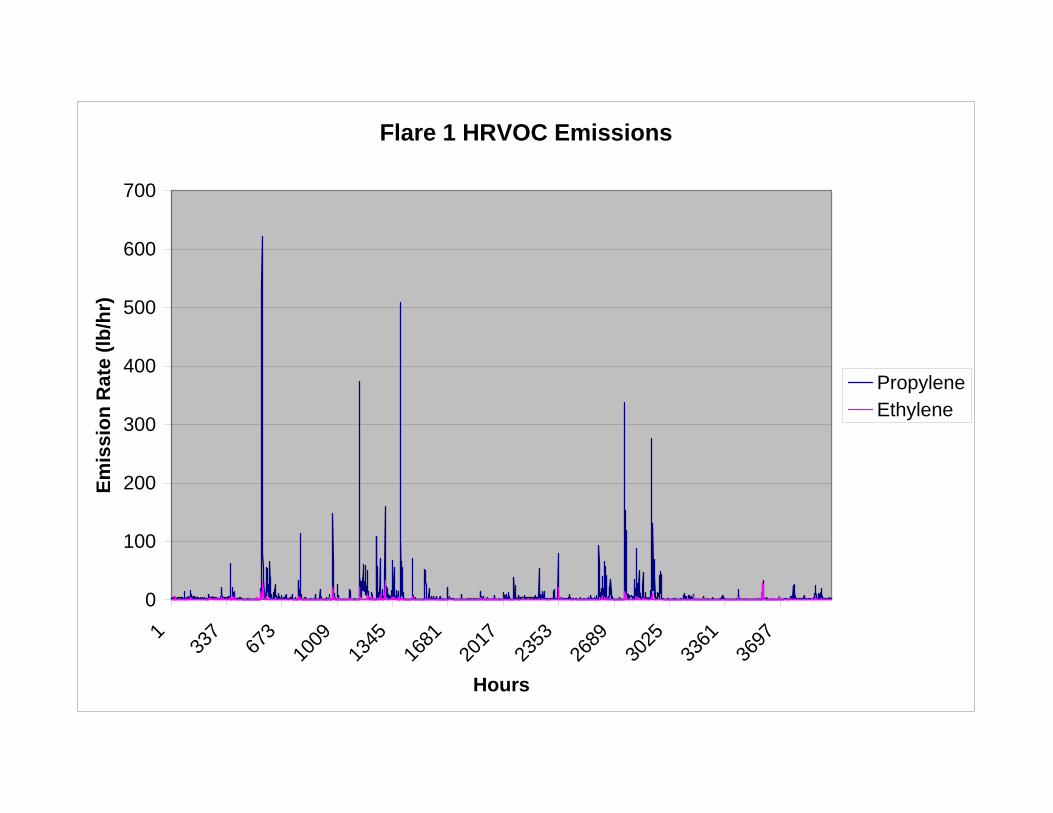
Flare 1 HRVOC Emissions
0
100
200
300
400
500
600
700
1
337
673
1009
1345
1681
2017
2353
2689
3025
3361
3697
Hours
Emis
sion
Rat
e (lb
/hr)
PropyleneEthylene
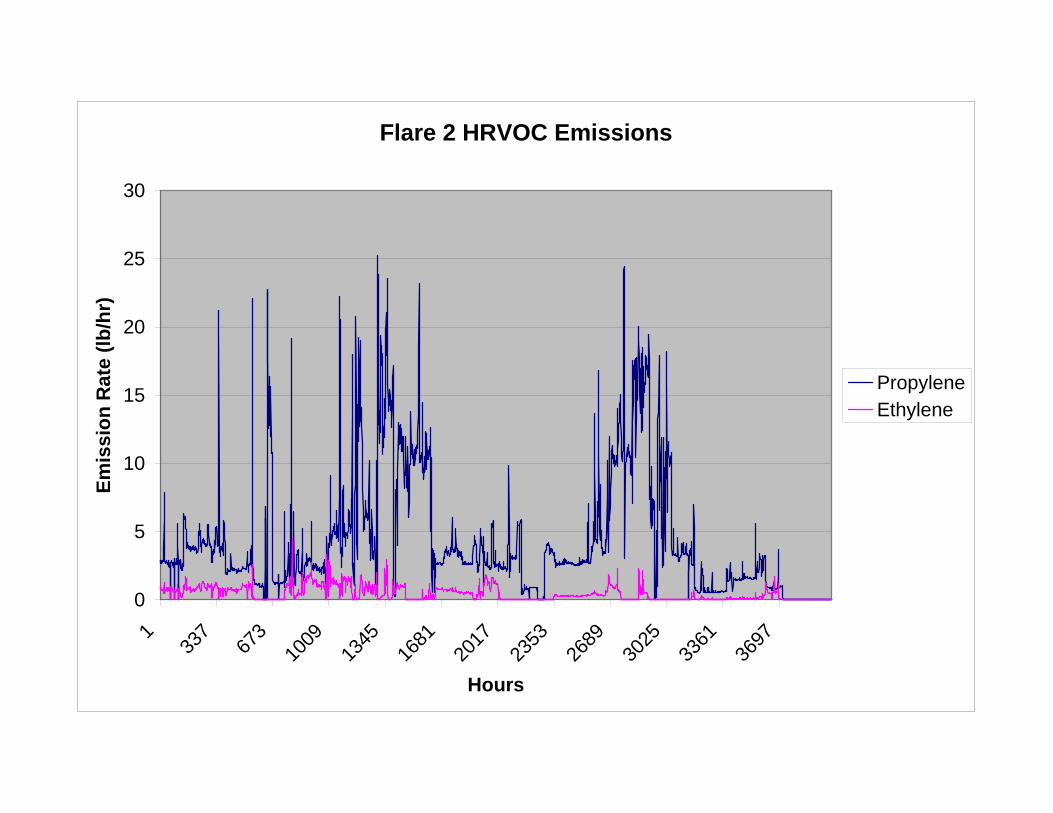
Flare 2 HRVOC Emissions
0
5
10
15
20
25
30
1
337
673
1009
1345
1681
2017
2353
2689
3025
3361
3697
Hours
Emis
sion
Rat
e (lb
/hr)
PropyleneEthylene
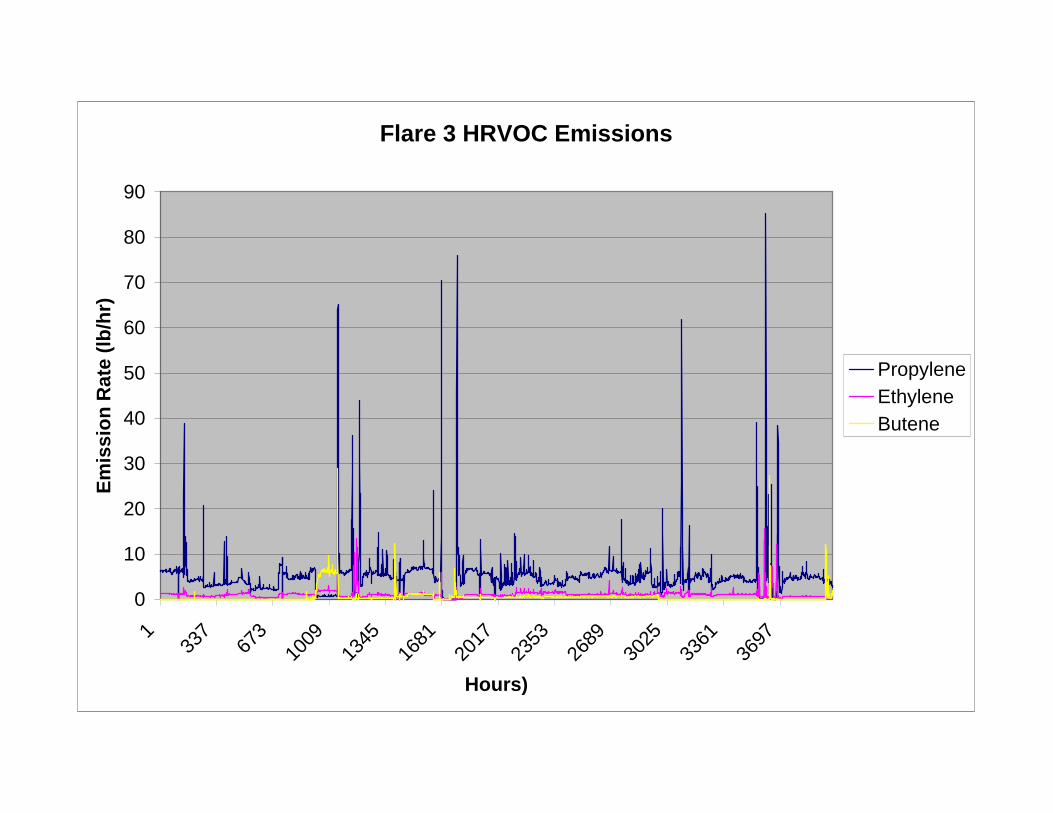
Flare 3 HRVOC Emissions
0
10
20
30
40
50
60
70
80
90
1
337
673
1009
1345
1681
2017
2353
2689
3025
3361
3697
Hours)
Emis
sion
Rat
e (lb
/hr)
PropyleneEthyleneButene
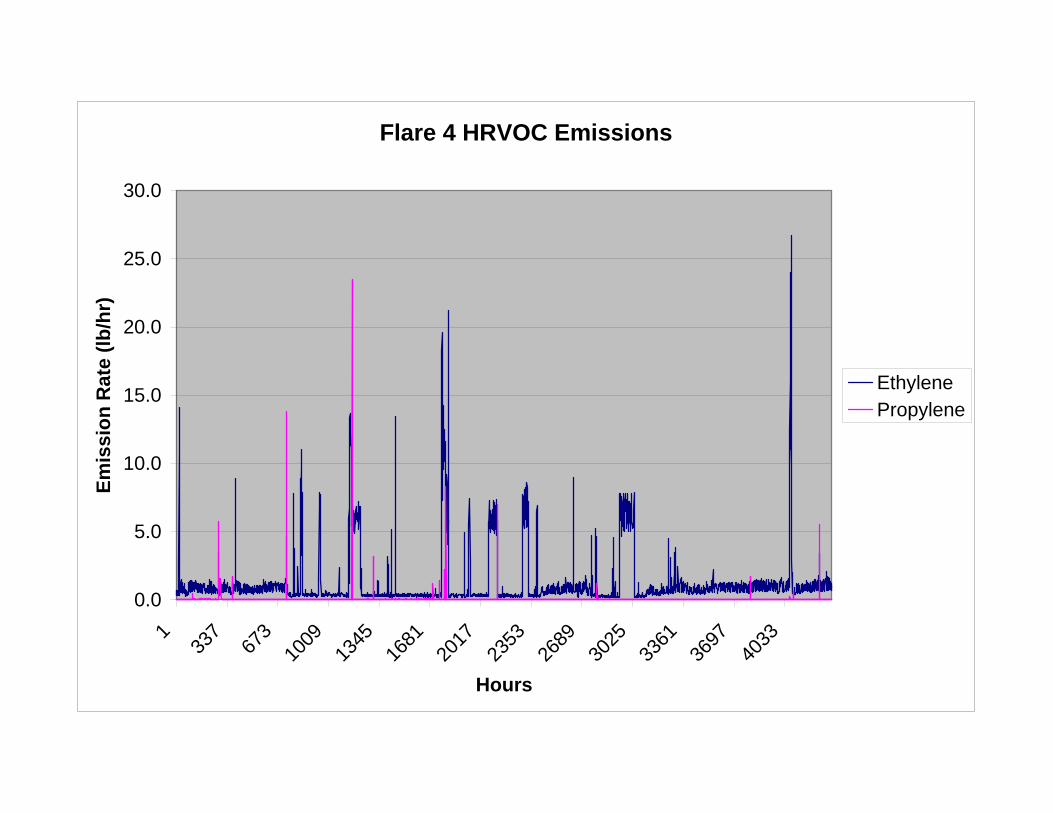
Flare 4 HRVOC Emissions
0.0
5.0
10.0
15.0
20.0
25.0
30.0
1
337
673
1009
1345
1681
2017
2353
2689
3025
3361
3697
4033
Hours
Emis
sion
Rat
e (lb
/hr)
EthylenePropylene
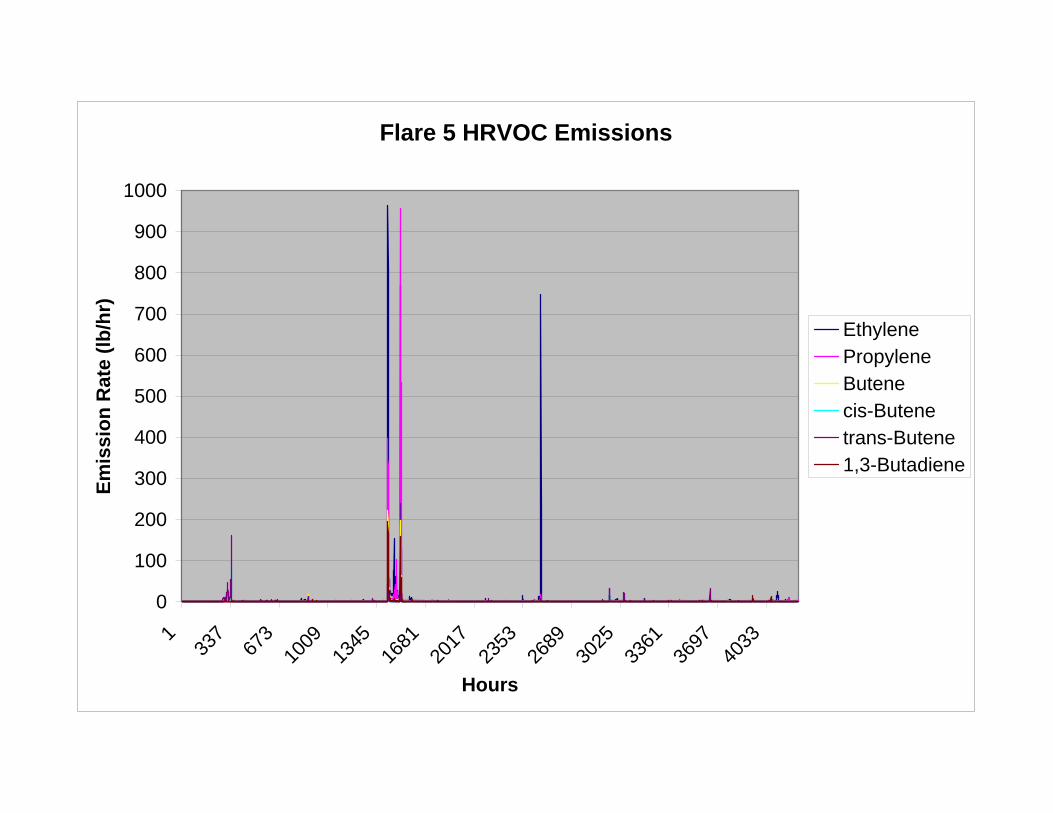
Flare 5 HRVOC Emissions
0
100
200
300
400
500
600
700
800
900
1000
1
337
673
1009
1345
1681
2017
2353
2689
3025
3361
3697
4033
Hours
Emis
sion
Rat
e (lb
/hr)
EthylenePropyleneButenecis-Butenetrans-Butene1,3-Butadiene
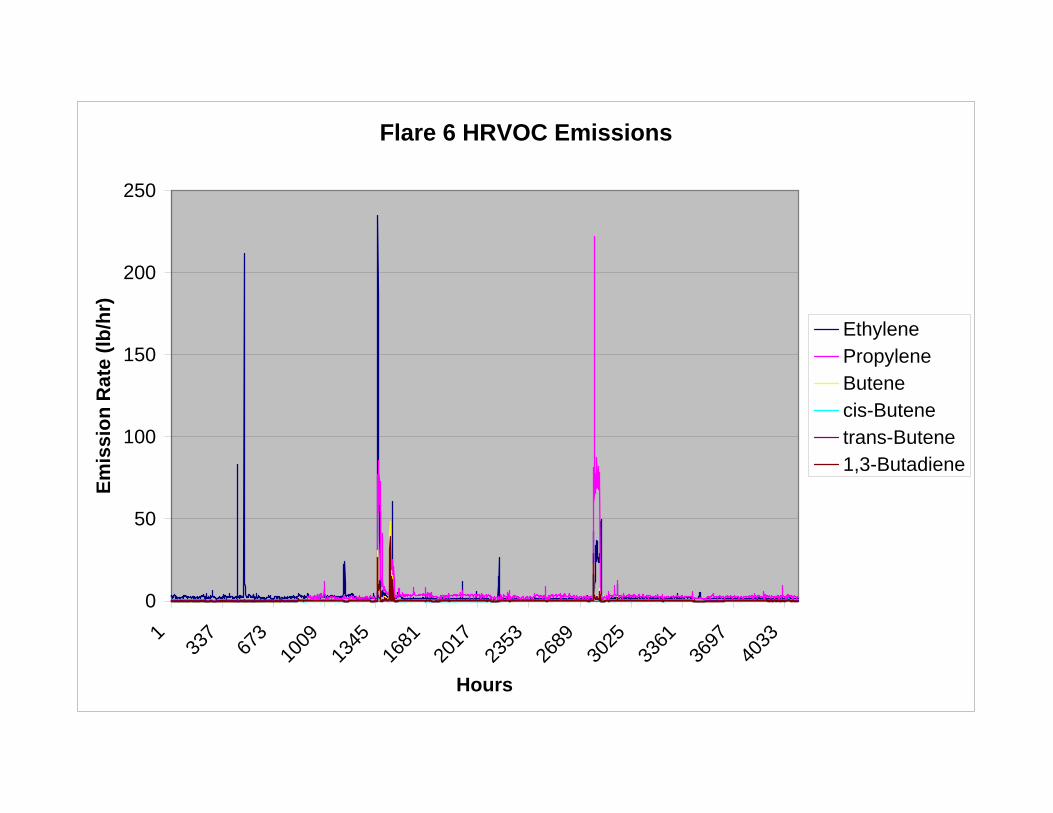
Flare 6 HRVOC Emissions
0
50
100
150
200
250
1
337
673
1009
1345
1681
2017
2353
2689
3025
3361
3697
4033
Hours
Emis
sion
Rat
e (lb
/hr)
EthylenePropyleneButenecis-Butenetrans-Butene1,3-Butadiene
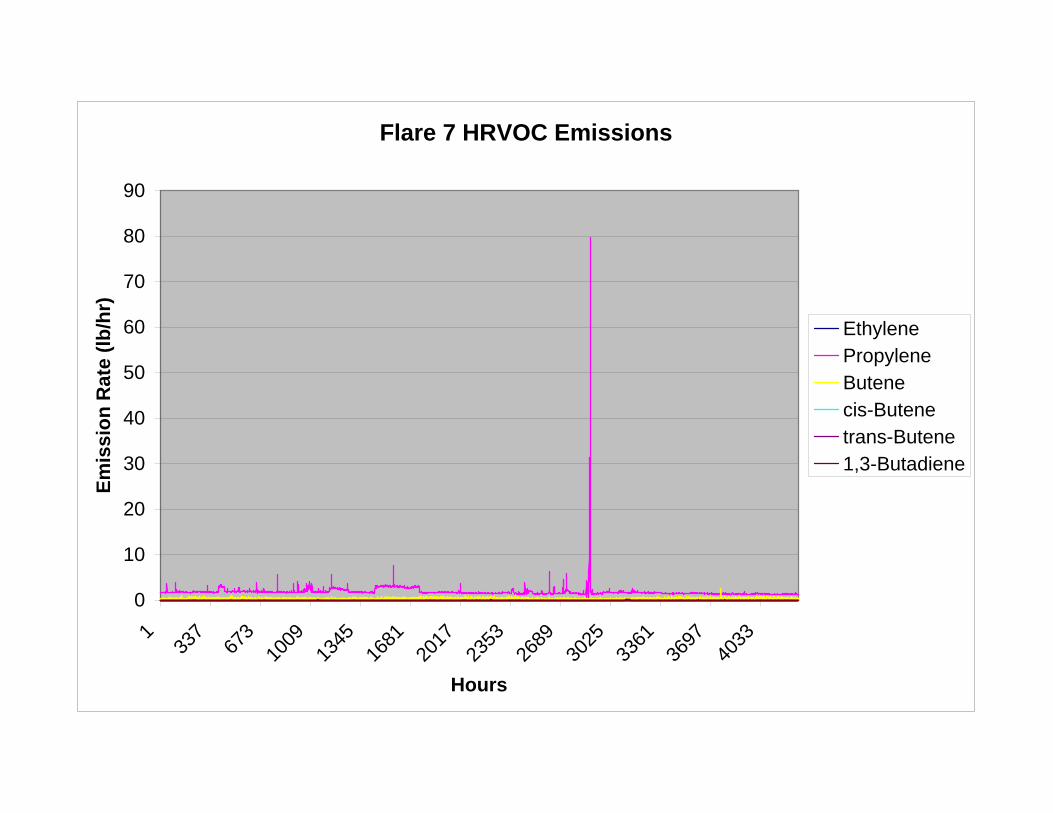
Flare 7 HRVOC Emissions
0
10
20
30
40
50
60
70
80
90
1
337
673
1009
1345
1681
2017
2353
2689
3025
3361
3697
4033
Hours
Emis
sion
Rat
e (lb
/hr)
EthylenePropyleneButenecis-Butenetrans-Butene1,3-Butadiene
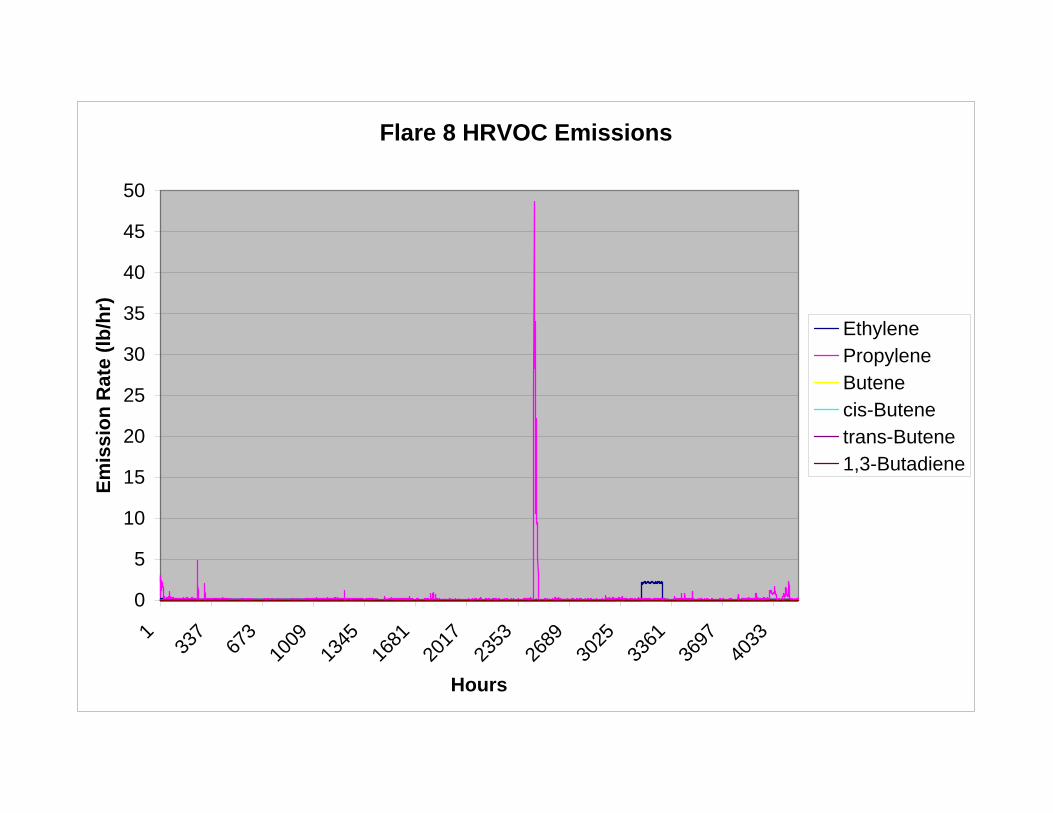
Flare 8 HRVOC Emissions
0
5
10
15
20
25
30
35
40
45
50
1
337
673
1009
1345
1681
2017
2353
2689
3025
3361
3697
4033
Hours
Emis
sion
Rat
e (lb
/hr)
EthylenePropyleneButenecis-Butenetrans-Butene1,3-Butadiene

HARC Project H76 October 27, 2006
A P P E N D I X E
Suggestions for HRVOC Rule Improvements Provided by Study Participants

HARC Project H76 E-1 October 27, 2006
Following is a compilation of comments provided by study participants with respect to improving the current HRVOC rules. Not all study participants are in agreement with all suggestions nor does ENVIRON necessarily endorse them.
TABLE E-1. Summary of Suggested HRVOC Rule Improvements
Issue Industry Comment
Subchapter H, Division 1 (Vent
Gas Control) Citation(s)
Subchapter H, Division 2
(Cooling Tower Heat Exchange
Systems) Citation(s)
1) Allow weekly mid-level calibration of cooling tower on-line analyzers instead of the daily calibration requirement in Performance Specification 9 (PS 9) for consistency with flare requirements. Flare on-line analyzer systems are currently subject to a weekly mid-level calibration; or 2) Remove the requirement for the multi-point calibration required by Performance Specification 9 (PS 9). Instead, allow operation per the industry standard for plant gas chromatograph operations, i.e., one-point calibration using the weekly validation only. Consequently, the quarterly multi-point calibration procedure in Section 10.1 of PS 9 is no longer necessary.
115.725(d)(2)(A)(i)/
PS 9 115.764(a)(6)/
PS 9 The multi-point calibration procedure in PS 9 requires facilities to check calibration at specified percentages of the operating range for calibration gases, which can lead to a significant surplus of stored calibration gas bottles. Facilities consider this a waste, as current GC technology is linear. PS 9 PS 9
Multi-point calibration/Performance
Specification 9
The multi-point calibration requirement following routine maintenance or repair is unnecessary, especially when the maintenance or repair does not impact the chromatography. PS 9 PS 9
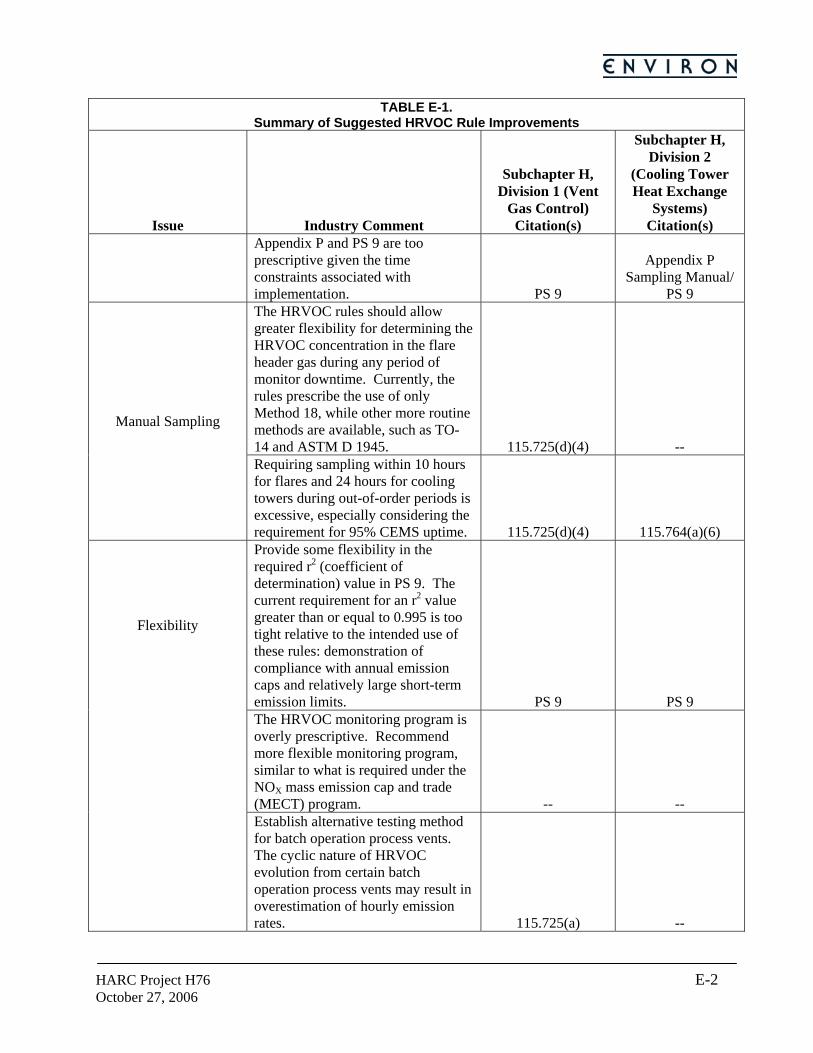
HARC Project H76 E-2 October 27, 2006
TABLE E-1. Summary of Suggested HRVOC Rule Improvements
Issue Industry Comment
Subchapter H, Division 1 (Vent
Gas Control) Citation(s)
Subchapter H, Division 2
(Cooling Tower Heat Exchange
Systems) Citation(s)
Appendix P and PS 9 are too prescriptive given the time constraints associated with implementation. PS 9
Appendix P Sampling Manual/
PS 9 The HRVOC rules should allow greater flexibility for determining the HRVOC concentration in the flare header gas during any period of monitor downtime. Currently, the rules prescribe the use of only Method 18, while other more routine methods are available, such as TO-14 and ASTM D 1945. 115.725(d)(4) --
Manual Sampling
Requiring sampling within 10 hours for flares and 24 hours for cooling towers during out-of-order periods is excessive, especially considering the requirement for 95% CEMS uptime. 115.725(d)(4) 115.764(a)(6) Provide some flexibility in the required r2 (coefficient of determination) value in PS 9. The current requirement for an r2 value greater than or equal to 0.995 is too tight relative to the intended use of these rules: demonstration of compliance with annual emission caps and relatively large short-term emission limits. PS 9 PS 9 The HRVOC monitoring program is overly prescriptive. Recommend more flexible monitoring program, similar to what is required under the NOX mass emission cap and trade (MECT) program. -- --
Flexibility
Establish alternative testing method for batch operation process vents. The cyclic nature of HRVOC evolution from certain batch operation process vents may result in overestimation of hourly emission rates. 115.725(a) --
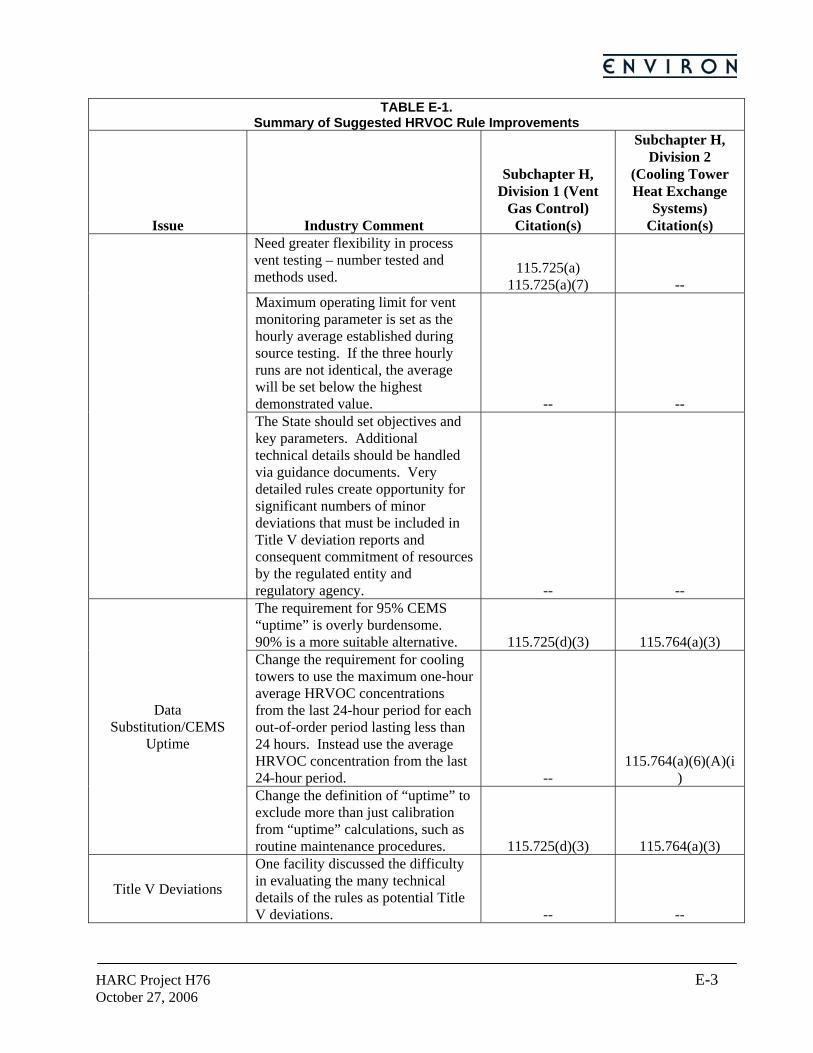
HARC Project H76 E-3 October 27, 2006
TABLE E-1. Summary of Suggested HRVOC Rule Improvements
Issue Industry Comment
Subchapter H, Division 1 (Vent
Gas Control) Citation(s)
Subchapter H, Division 2
(Cooling Tower Heat Exchange
Systems) Citation(s)
Need greater flexibility in process vent testing – number tested and methods used. 115.725(a)
115.725(a)(7) -- Maximum operating limit for vent monitoring parameter is set as the hourly average established during source testing. If the three hourly runs are not identical, the average will be set below the highest demonstrated value. -- -- The State should set objectives and key parameters. Additional technical details should be handled via guidance documents. Very detailed rules create opportunity for significant numbers of minor deviations that must be included in Title V deviation reports and consequent commitment of resources by the regulated entity and regulatory agency. -- -- The requirement for 95% CEMS “uptime” is overly burdensome. 90% is a more suitable alternative. 115.725(d)(3) 115.764(a)(3) Change the requirement for cooling towers to use the maximum one-hour average HRVOC concentrations from the last 24-hour period for each out-of-order period lasting less than 24 hours. Instead use the average HRVOC concentration from the last 24-hour period. --
115.764(a)(6)(A)(i)
Data Substitution/CEMS
Uptime
Change the definition of “uptime” to exclude more than just calibration from “uptime” calculations, such as routine maintenance procedures. 115.725(d)(3) 115.764(a)(3)
Title V Deviations
One facility discussed the difficulty in evaluating the many technical details of the rules as potential Title V deviations. -- --

HARC Project H76 E-4 October 27, 2006
TABLE E-1. Summary of Suggested HRVOC Rule Improvements
Issue Industry Comment
Subchapter H, Division 1 (Vent
Gas Control) Citation(s)
Subchapter H, Division 2
(Cooling Tower Heat Exchange
Systems) Citation(s)
LDAR
Several facilities expressed support for creating a single LDAR program, thereby eliminating the need for tracking compliance with individual and often overlapping programs. -- --